Back to Journals » OncoTargets and Therapy » Volume 9
miR-663 overexpression induced by endoplasmic reticulum stress modulates hepatocellular carcinoma cell apoptosis via transforming growth factor beta 1
Authors Huang Y, Liu J ![]() , Fan L, Wang F, Yu H, Wei W, Sun G
, Fan L, Wang F, Yu H, Wei W, Sun G
Received 22 September 2015
Accepted for publication 14 January 2016
Published 17 March 2016 Volume 2016:9 Pages 1623—1633
DOI https://doi.org/10.2147/OTT.S96902
Checked for plagiarism Yes
Review by Single anonymous peer review
Peer reviewer comments 3
Editor who approved publication: Professor Daniele Santini
Yawei Huang,1,* Jiatao Liu,1,* Lulu Fan,1 Fang Wang,1 Hanqing Yu,1 Wei Wei,2 Guoping Sun1
1Department of Oncology, The First Affiliated Hospital of Anhui Medical University, 2Institute of Clinical Pharmacology, Anhui Medical University, Hefei, Anhui, People’s Republic of China
*These authors contributed equally to this work
Abstract: microRNAs are commonly dysregulated in a number of human cancers, for example, hepatocellular carcinoma (HCC), but the precise mechanism of dysregulation has not been extensively studied. Although previous studies have indicated that HCC cells are resistant to endoplasmic reticulum (ER) stress-induced apoptosis, little is known about the relationship between microRNAs and ER stress-mediated apoptosis resistance. In this study, we have demonstrated for the first time that the expression level of miR-663 was significantly upregulated in HCC cells co-incubated with tunicamycin, an ER stress inducer, as measured by a microRNA-chromatin immunoprecipitation microarray and quantitative real-time polymerase chain reaction; however, the effect of miR-663 on HCC cell apoptosis remains unknown. To investigate the potential involvement of miR-663 in HCC, HepG2 cells were transfected with mimics or inhibitors of miR-663. Consequently, we identified that downregulation of miR-663 suppressed HCC cell proliferation and promoted apoptosis under ER stress. Target gene analysis further predicted that the effects of miR-663 on HCC cells were mediated by directly targeting transforming growth factor beta 1 (TGFB1). Interestingly, the expression levels of TGFB1 changed inversely after downregulation or upregulation of miR-663 by inhibitors or mimics of miR-663 in HepG2 cells. Additionally, TGFB1 knockdown inhibited apoptosis in HepG2 cells. In sum, our study identifies a role for miR-663 as a critical regulator of ER stress-mediated apoptosis resistance in HCC cells via TGFB1. Accordingly, therapies aimed at the miR-663/TGFB1 axis might represent a hopeful strategy to overcome apoptosis resistance in HCC.
Keywords: hepatocellular carcinoma cells, endoplasmic reticulum stress, microRNAs, miR-663, TGFB1, apoptosis
Introduction
Hepatocellular carcinoma (HCC), one of the most common malignant neoplasms in the digestive system and the fifth major cause of cancer-related mortality throughout the world, is characterized by a high prevalence of drug resistance and lack of curative treatment.1,2 To improve the efficacy of systemic chemotherapies, studies focused on the molecular mechanisms implicated in human hepatocarcinogenesis have been encouraged. Over the past few decades, several mechanisms have been revealed, and the best known is dysfunctional apoptotic machinery.3 Therefore, a better understanding of the mechanism underlying apoptosis resistance is essential.
A number of cellular stress factors, including hypoxia, starvation, glycosylation state changes, among others, disturb the normal endoplasmic reticulum (ER) function and increase the accumulation of misfolded and/or unfolded proteins in the ER lumen, leading to ER stress.4 To maintain ER homeostasis, unfolded protein response is evoked via the activation of survival or proliferative pathways. However, when ER stress is of high intensity or prolonged, apoptosis is initiated.5 A growing number of studies, including ours, have demonstrated that ER stress is elevated in a variety of solid tumors, such as HCC, mammary carcinoma, cervical cancer, prostate cancer, bladder cancer, and colorectal cancer.6–9 According to our previous reports, hepatoma cells under ER stress could counteract apoptosis induced by chemotherapy agents. In other words, ER stress represents an adaptive mechanism that supports hepatoma cell survival and chemoresistance. However, the mechanism of ER stress-mediated apoptosis resistance remains unknown.
microRNAs (miRNAs) are a group of 17–25 nucleotide (nt) small noncoding RNAs that regulate the translational inhibition or degradation of target messenger RNAs (mRNAs) by binding to the 3′ untranslated region (3′UTR) of their target genes.10 miRNAs are known to play a crucial role in regulating cellular function, such as cell proliferation, development, differentiation, and apoptosis.11–14 In recent decades, accumulating evidence has shown that miRNAs appear to be a major regulator of HCC. There are nearly 20 miRNAs that have been reported to regulate HCC tumor progression and metastasis by regulating key genes.15 However, there is no straightforward evidence to suggest whether miRNAs participate in HCC cells apoptosis under ER stress.
In the current work, we have demonstrated that ER stress could significantly increase miR-663 expression using miRNA-chromatin immunoprecipitation (CHIP) microarray analysis and quantitative real-time polymerase chain reaction (qRT-PCR). The association of miR-663 levels with proliferation and apoptosis in HCC cells were also analyzed. Furthermore, the expression level of targeting transforming growth factor beta 1 (TGFB1) changed, followed by downregulation or upregulation of miR-663, and knockdown of TGFB1-inhibited HepG2 cells apoptosis. Mechanistically, our results indicated that ER stress could reduce HCC cell apoptosis by modulating the miR-663/TGFB1 axis.
Materials and methods
Cell culture
The study was approved by the institutional review board (IRB) of Anhui Medical University, Anhui, People’s Republic of China. All participants provided written informed consent. All experiments were performed within the approved guidelines. The human HCC cell lines HepG2, Bel7402, and SMMC7721 (the Cell Bank of the Chinese Academy of Sciences, Shanghai, People’s Republic of China) were maintained in high glucose Dulbecco’s Modified Eagle’s Medium media (Thermo Fisher Scientific, Waltham, MA, USA) supplemented with 10% heat-inactivated fetal bovine serum, 100 U/mL penicillin, and 100 mg/mL streptomycin. All of the cells were cultured in a humidified atmosphere of 5% CO2 in air at 37°C.
Cell proliferation inhibition analysis
HepG2 cells were seeded into 96-well plates at a density of 5 to 6×10³ per well in a fixed volume of 100 μL of medium and were incubated for 24 hours under 5% CO2 at 37°C to allow adherence. The cells were then exposed to tunicamycin (TM; Streptomyces sp, Sigma-Aldrich, St Louis, MO, USA) for 24 hours, which was dissolved in dimethyl sulfoxide to a final concentration of 3 μM in the culture medium. Then, a portion of cells were transfected. After 48 hours of incubation, 10 μL of cell counting kits-8 (CCK-8) solution (Transgen Biotech, Beijing, People’s Republic of China) was added to each well. After 2 hours of additional incubation, the absorbance at 450 nm was measured using an enzyme-labeled (EL) ×800 (Bio-Tek, Winosski, VT, USA). The cellular proliferation inhibition rate was calculated according to the formula: cellular proliferation inhibition rate = (1 − [average optical density (OD) value of the experimental group − average OD 450 nm background]/[average OD value of the control group − average OD 450 nm background]) ×100%. All experiments were repeated at least three times, and each treatment was performed in three parallel dishes.
Cell apoptosis analysis
To detect apoptotic cells via flow cytometry (Cytomics FC 500; Beckman Coulter, Fullerton, CA, USA), an Annexin V-FITC/PI (fluorescein isothiocyanate/propidium iodide) double-staining apoptosis detection kit (BestBio, Shanghai, People’s Republic of China) was used, according to the manufacturer’s protocols. HepG2 cells were plated in six-well plates; when the cell confluence degree reached 75% to 80%, the floating dead cells were removed by gentle washing and then replaced with new medium containing 3 μM TM. Subsequently, cells were transfected with miRNAs or small interfering RNAs (siRNAs). Following a 48 hour period, cells were collected and centrifuged at 300× g for 10 minutes. After washing twice with PBS and centrifuging in the same condition, cells were stained with 10 μL of Annexin V-FITC for 15 minutes and 5 μL of PI for 5 minutes at 4°C in the dark. Cells were then analyzed using FITC signal detector and PI detector with flow cytometry and FlowJo version 7.6 software (Stanford University, Stanford, CA, USA). A minimum of 2×10⁴ cells were analyzed for each sample. All experiments were repeated at least three times.
RNA extraction and qRT-PCR
Human HCC cell lines, HepG2, Bel7402, and SMMC7721, were plated in six-well plates and classified into control and TM groups (3 μM). After culturing for 24 hours, total RNA was extracted by using the Trizol reagent (Invitrogen, Carlsbad, CA, USA) according to the manufacturer’s recommendations. qRT-PCR was performed to confirm the expression levels of miRNAs and mRNAs. For miR-663 detection, qRT-PCR was performed as a one-step reaction using an EzOmics™ miRNA qPCR Detection Kit (Biomic, Nantong, People’s Republic of China); 60 minutes at 40°C and 10 minutes at 95°C, followed by 40 cycles of 95°C for 20 seconds, 62°C for 30 seconds, and 72°C for 30 seconds. For mRNA detection, qRT-PCR was performed using a two-step reaction using TransStart® All-in-One First-Strand cDNA Synthesis SuperMix and TransStart® Top Green qPCR SuperMix Kit (Transgen, Beijing, People’s Republic of China);15 minutes at 42°C and 5 seconds at 85°C, followed by 40 cycles of 95°C for 2 minutes, 95°C for 15 seconds, 60°C for 1 minute, 60°C for 30 seconds, 0.2°C for 1 second, and 20°C for 10 seconds. All data were normalized to the highly conserved and universally expressed small nuclear RNA U6 and glyceraldehydes-3-phosphate dehydrogenase (GAPDH) for miRNA and mRNA analyses, respectively. All of the primer sequences are shown in Table 1. All data were analyzed with the cycle threshold (Ct) value and compared following the 2−ΔΔCT formula.
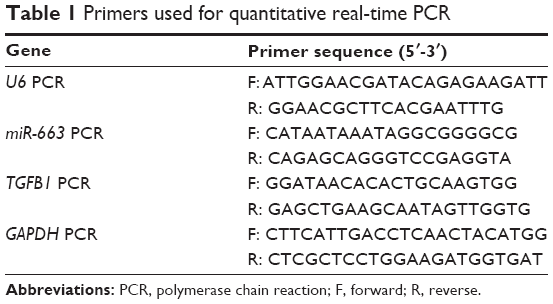 | Table 1 Primers used for quantitative real-time PCR |
Transfection
HepG2 cells were plated in 96-well plates or six-well plates at a density of 5 to 6×10³ or 2×10⁵ cells per well, respectively. When cells grew to 40%–60% confluence, they were transfected with 10 nM miR-663 mimics, inhibitors or their corresponding negative control (Ambion, Life Technologies, Grand Island, NY, USA) using Lipofectamine RNAiMAX (Invitrogen) according to the manufacturer’s instructions. Similarly, RNA interference was performed the same way, using siRNA TGFB1 (GenePharma, Shanghai, People’s Republic of China) for transfection.
Western blot analysis
Western blot assays were conducted as reported previously.16 The total protein content was measured by using Coomassie brilliant blue staining. Each sample protein was loaded onto10% sodium dodecyl sulfate-polyacrylamide gel electrophoresis gels and transferred onto a polyvinylidene difluoride membrane (Millipore, Bedford, MA, USA). The glucose regulated protein 78 (GRP78) antibody (Bioworld, St Louis Park, MN, USA) and β-actin antibody (Zhongshan Biotechnology, Beijing, People’s Republic of China) were used as primary antibodies for Western blot analysis, according to the manufacturer’s instructions. Membranes were blocked in 5% skimmed milk for 2 hours at room temperature and then washed and incubated with primary antibodies overnight at 4°C. After washing in phosphate buffered saline tween-20 (PBST) and incubating with the secondary antibodies for 2 hours at 37°C, the immunoreactive bands were visualized with an enhanced chemiluminescence (ECL) kit (Thermo Fisher, Waltham, MA, USA), and the signals were revealed by Image Quant™ LAS-4000 Mini Imager (GE Healthcare Life Sciences, Fuji, Japan). For quantitative analysis, the integrated density of each band was obtained using ImageJ software (National Institutes of Health, Benthesda, Maryland, USA), and the respective intensities were corrected by normalization to β-actin.
Enzyme-linked immunosorbent assay
The cell culture supernatant was harvested at the indicated time-points. The concentrations of TGFB1 in medium were measured by a TGFB1 enzyme-linked immunosorbent assay (ELISA) kit (Dakewe Bioengineering Corporation, Shenzhen, People’s Republic of China). According to the ELISA kit manual, before the assay, all samples must be activated by the addition of 1 N HCl (20 μL mixed in 100 μL of sample) for 15 minutes, followed by the addition of 20 μL of 1.2 N NaOH, and subsequent blending with 60 μL of dilution buffer R (1×). The absorbance at 450 nm was measured using an enzyme-labeled EL ×800. All samples were assayed in triplicate.
Statistical analysis
Except when otherwise stated, all experiments were performed in triplicate. Statistical analysis was performed using SPSS 16.0 software (SPSS Inc., Chicago, IL, USA). Data are presented as the mean ± standard deviation in each group. Two group comparisons of parametric data were analyzed using the Student’s t-test, and multiple group comparisons of parametric data were analyzed using one-way analysis of variance. For all analyses, a value of P<0.05 was considered statistically significant.
Results
Effect of TM treatment on GRP78 expression in HepG2 cells
To determine the effect of the ER stress inducer TM, a concentration of 3 μM was used to induce optimum ER stress in all subsequent experiments based on results from our previous study.6 HepG2 cells were incubated with 3 μM of TM for 0, 6, 12, 24, 36, and 48 hours. Western blot analysis was used to detect GRP78 expression, a molecular marker of ER stress. The gray value of each band was analyzed, and the ratio of GRP78/β-actin was calculated, as shown in Figure 1. Consequently, we found that expression of GRP78 is highest in HepG2 cells after exposure to TM for 24 hours, which suggests that TM effectively induced ER stress in this condition.
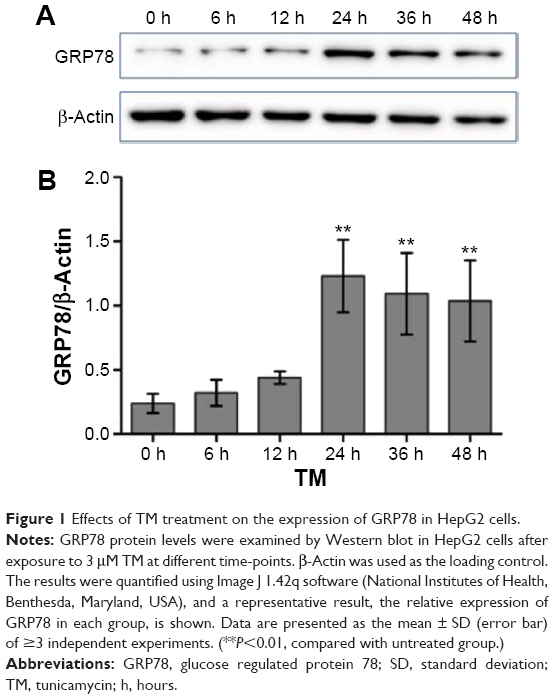 | Figure 1 Effects of TM treatment on the expression of GRP78 in HepG2 cells. |
miR-663 has a high expression level under ER stress in HCC
To establish a relationship between ER stress and miRNA gene expression, miRNA expression profiling was conducted with miRNA-CHIP microarray analysis using RNA isolated from HepG2 cells incubated with or without TM. Seventy differentially expressed miRNAs were detected in TM-treated cells compared with untreated HepG2 cells (Figure 2A). To our surprise, miR-663 was the most obviously upregulated after TM treated, especially at 24 hours. Then we conducted a bioinformatic analysis, suggesting that miR-663 may participate in some biological activities related to cell apoptosis. Therefore, we hypothesized that miR-663 might have a role in regulating the ER stress-induced apoptosis of HepG2 cells.
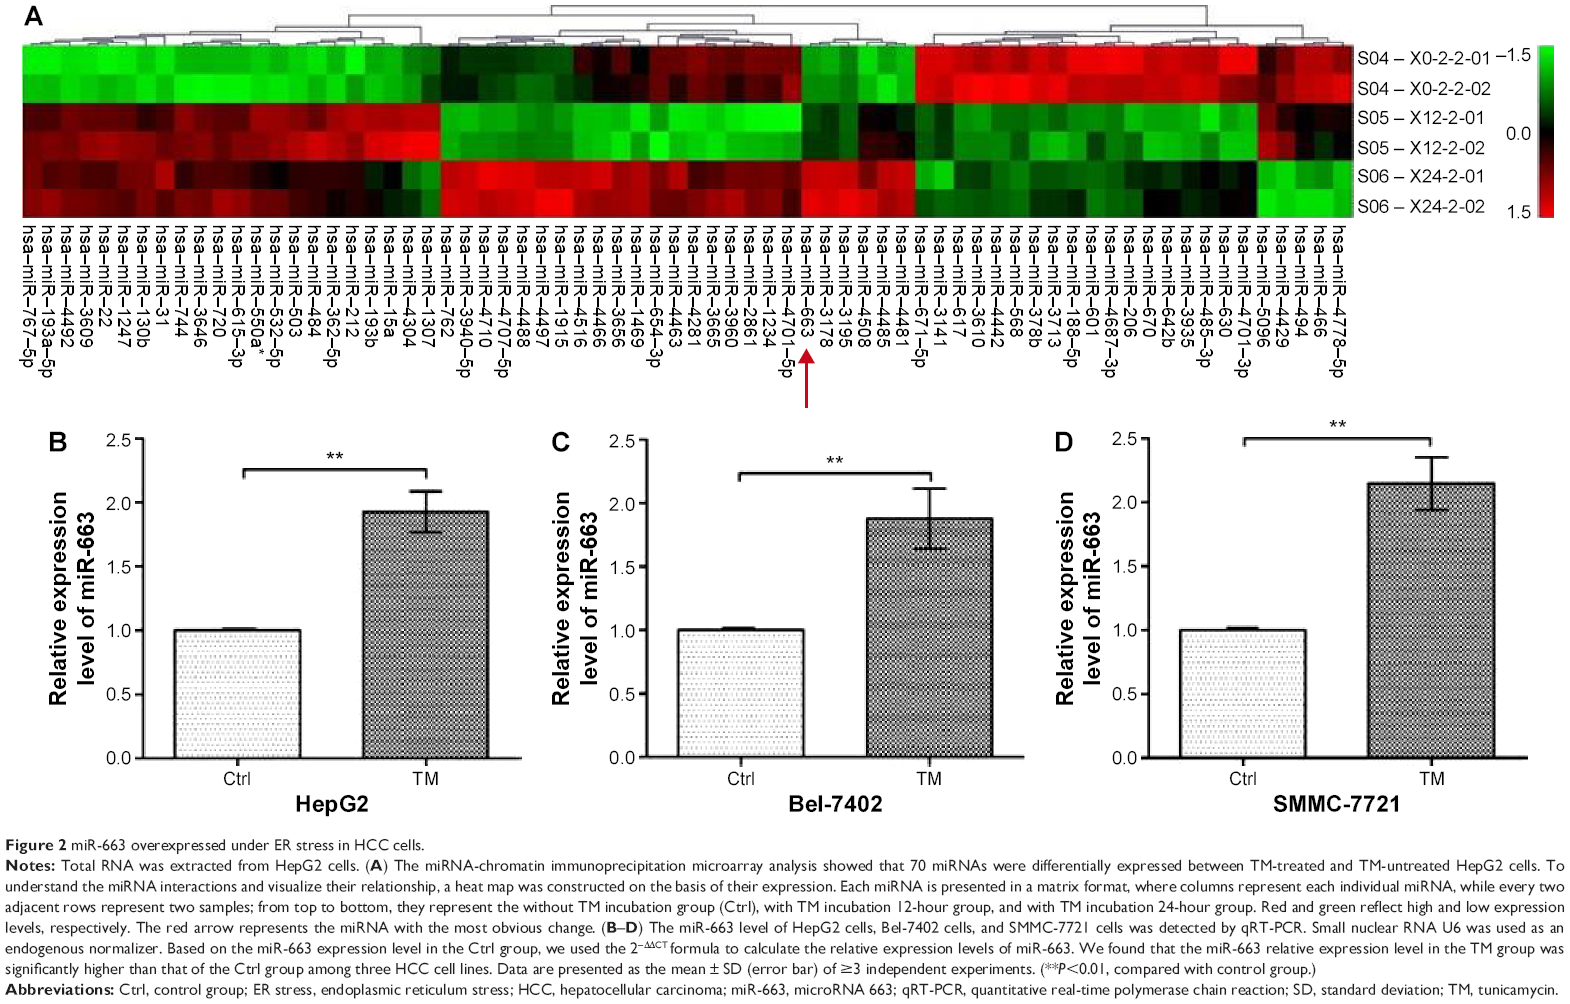 | Figure 2 miR-663 overexpressed under ER stress in HCC cells. |
To validate this unexpected finding, we then performed miR-663 specific qRT-PCR on different HCC cell lines. As shown in Figure 2B, consistent with the miRNA-CHIP result, the relative miR-663 expression level was 1.93±0.16-fold upregulated in HepG2 cells after exposure to 3 μM TM for 24 hours, a condition that effectively induces ER stress, compared with the untreated group. Furthermore, the expression level of miR-663 after exposure to 3 μM TM was also investigated by qRT-PCR in Bel-7402 cells (Figure 2C) and SMMC-7721 cells (Figure 2D), and the expression level of miR-633 was increased in these cells by 1.88±0.24 and 2.15±0.21 times compared with the untreated group, respectively. These results indicated that upregulation of miR-663 expression may be a universal phenomenon in HCC cells under ER stress.
miR-663 mimics and inhibitors effectively increase and decrease the expression of miR-663
qRT-PCR was used to verify whether the intracellular miR-663 expression level was regulated after transfection with miR-663 mimics or inhibitors for 24 hours and whether a significant increase or decrease of miR-663 expression was observed. The expression of miR-663 in cells treated with miR-633 mimics showed a 1,128.7±74.16-fold change over the mimics negative control group (NC), while expression of miR-663 in cells treated with miR-633 inhibitors showed only a 0.27±0.13-fold change compared with the inhibitor negative control group (INC) (Figure 3). As expected, these results validated that we can effectively upregulate and downregulate the expression level of miR-663 via transfection of HepG2 cells with either mimics or inhibitors of miR-663.
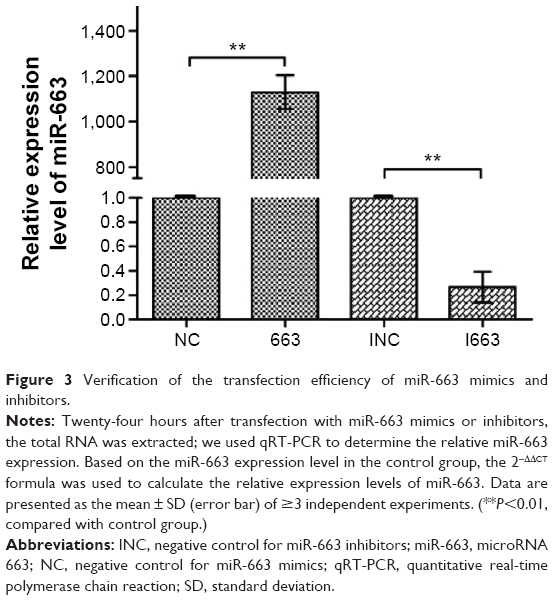 | Figure 3 Verification of the transfection efficiency of miR-663 mimics and inhibitors. |
Inhibition of miR-663 suppresses cell proliferation in HCC
The role of ER stress in protecting tumor cells prompted us to examine the potential role of miR-663 in HepG2 cell proliferation. As measured by the CCK-8 assay, we tested the effect of altering the miR-663 level on HepG2 cell proliferation. As shown in Figure 4, inhibition of miR-663 using miR-663 inhibitors combined with TM led to a remarkable decline in cell proliferation compared with the TM only treated cells. On the contrary, the rate of cell proliferation in cells treated with TM combined with miR-663 mimics was significantly higher than cells treated with TM alone. These results indicated that inhibition of miR-663 suppresses cell proliferation and that miR-663 might promote the proliferation of HepG2 cells under ER stress.
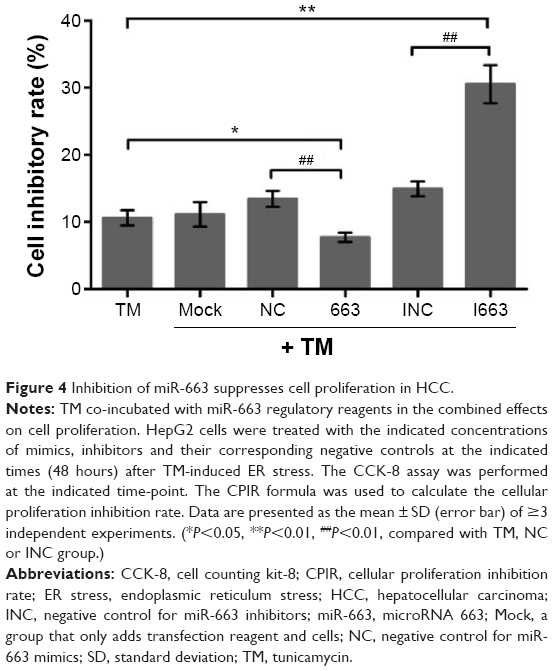 | Figure 4 Inhibition of miR-663 suppresses cell proliferation in HCC. |
Inhibition of miR-663 enhances cell apoptosis in HCC
To further confirm the effect of miR-663 in ER stress-induced apoptosis resistance, the Annexin V-FITC/PI apoptosis assay was conducted to investigate whether inhibition of miR-663 could increase HepG2 cells apoptosis. Cells were treated with pharmacological drugs in the same format as the CCK-8 assay. As shown in Figure 5, inhibition of miR-663 combined with TM treatment significantly enhanced cell apoptosis compared with untransfected cells. Collectively, our results implied that downregulation of miR-663 not only inhibits cell proliferation but also promotes cell apoptosis of HepG2 cells under ER stress.
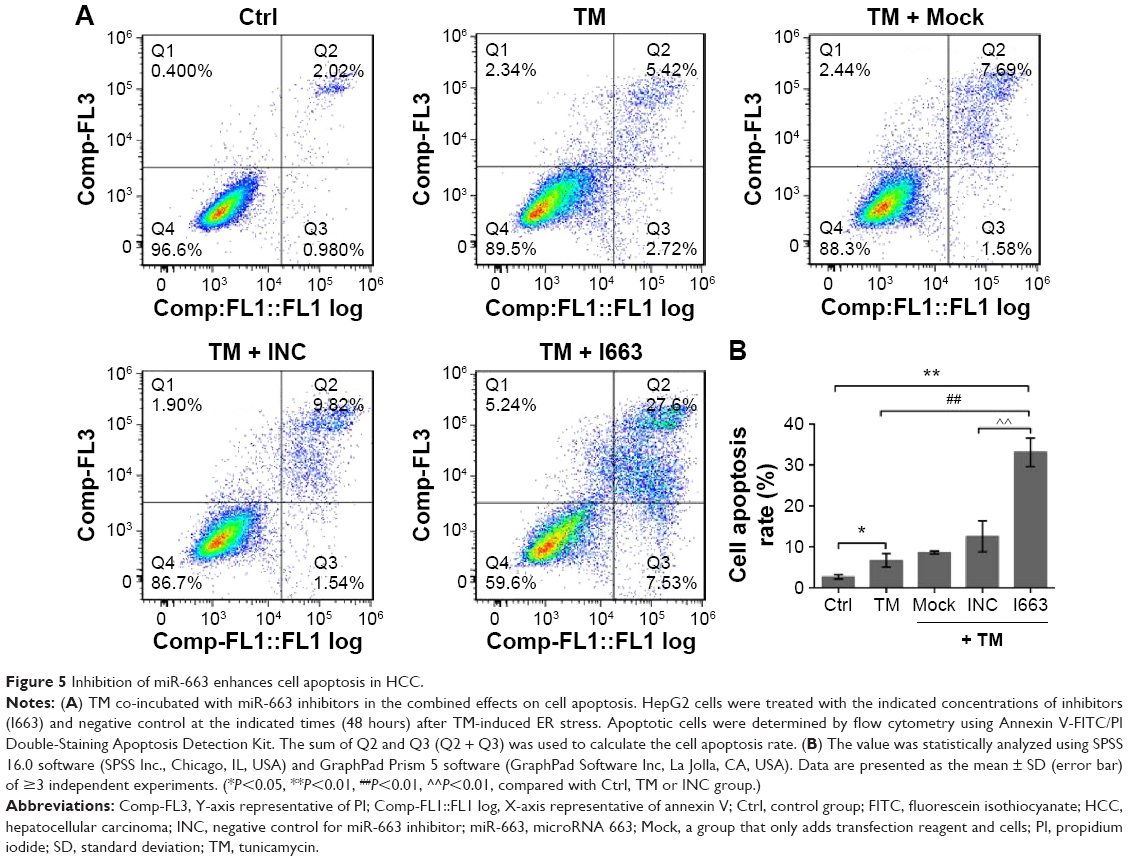 | Figure 5 Inhibition of miR-663 enhances cell apoptosis in HCC. |
TGFB1 is a potential target gene of miR-663
To gain insight into the mechanisms of miR-663 in regulating apoptosis in HCC cells, we conducted a target prediction programs analysis, such as TargetScan and miRanda, to predict the putative miR-663 targets. Among the predicted targets, we found TGFB1 as a predicted target with known roles both in HCC proliferation and apoptosis, which made it a good candidate for contributing to apoptosis in HCC.17–19 In this study, we found that TGFB1 expression was decreased following TM incubation (Figure 6), while miR-663 was increased during the same treatment (Figure 2), indicating a reverse correlation between miR-663 and TGFB1. Earlier studies also demonstrated that miR-663 downregulated TGFB1 expression in endothelial cells, papillary thyroid carcinoma cells as well as A549, SW460, and Hela cell lines.20–24 To confirm that miR-663 also regulates TGFB1 expression in HCC cells, we compared the mRNA and protein levels of TGFB1 in HepG2 cells following miR-663 overexpression and silencing by qRT-PCR and ELISA.
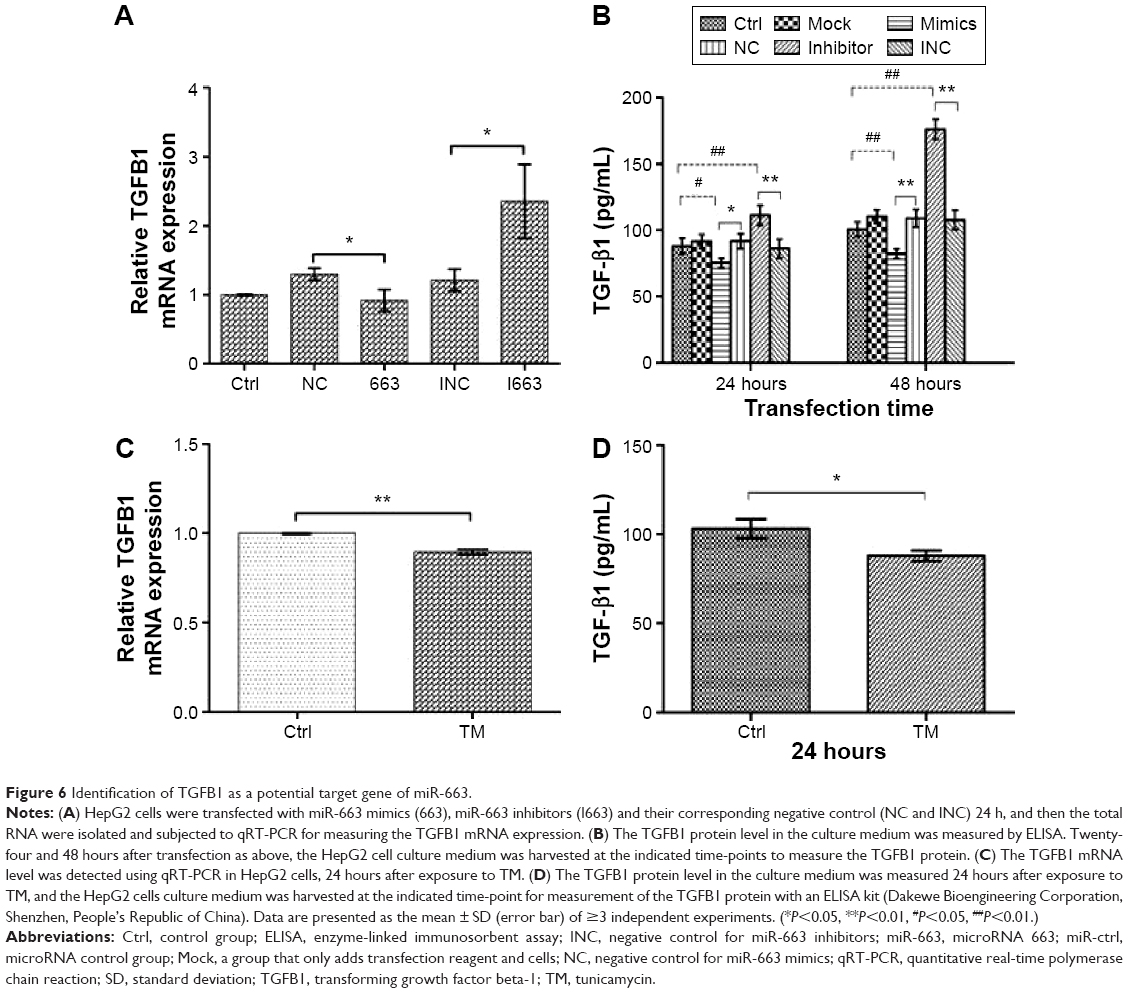 | Figure 6 Identification of TGFB1 as a potential target gene of miR-663. |
We found that overexpression of miR-663 resulted in downregulation of TGFB1 at the mRNA level by qRT-PCR (Figure 6). Conversely, decreasing miR-633 expression by siRNA led to the upregulation of the TGFB1 mRNA levels in HepG2 cells. We also confirmed this phenomenon at the protein level by ELISA, as shown in Figure 6. Transfection of the miR-663 inhibitors resulted in a significant increase in TGFB1 protein expression (P<0.01 versus control group [Ctrl] and INC), while transfection of miR-663 mimics significantly reduced TGFB1 protein levels (P<0.01 versus Ctrl and NC). Moreover, TGFB1 was markedly decreased at both the mRNA and protein level after treating HepG2 cells with TM (Figure 6). These results demonstrated that miR-663 inhibited TGFB1 expression in a posttranscriptional manner.
Interference of TGFB1 reduces apoptosis in HCC
To further explore whether ER stress-induced apoptosis resistance was attributed to miR-663 dependent downregulation of TGFB1, we decreased the expression of TGFB1 by transfecting a TGFB1 siRNA in HepG2 cells, and the relationship between the reduced level of TGFB1 expression and cell apoptosis was investigated. HepG2 cells were transfected with TGFB1 siRNA to obstruct TGFB1 mRNA expression. Subsequently, we verified the efficient decrease of TGFB1 expression at both the mRNA and protein levels (P<0.01, versus NC), as measured by qRT-PCR assay and ELISA (Figure 7A and B). Furthermore, to assess whether miR-663 regulates cell apoptosis by targeting TGFB1, we transfected HepG2 cells with TGFB1 siRNA and investigated the possible effects of TGFB1 on cell apoptosis. As expected, the ratio of apoptotic cells was significantly reduced, as measured by the Annexin V-FITC/PI apoptosis assay, after transfection with siRNA against TGFB1 for 48 hours in HepG2 cells (Figure 7C and D). These results might indicate that TGFB1, a target gene of miR-663, may be a key factor in regulating HCC cell apoptosis under ER stress.
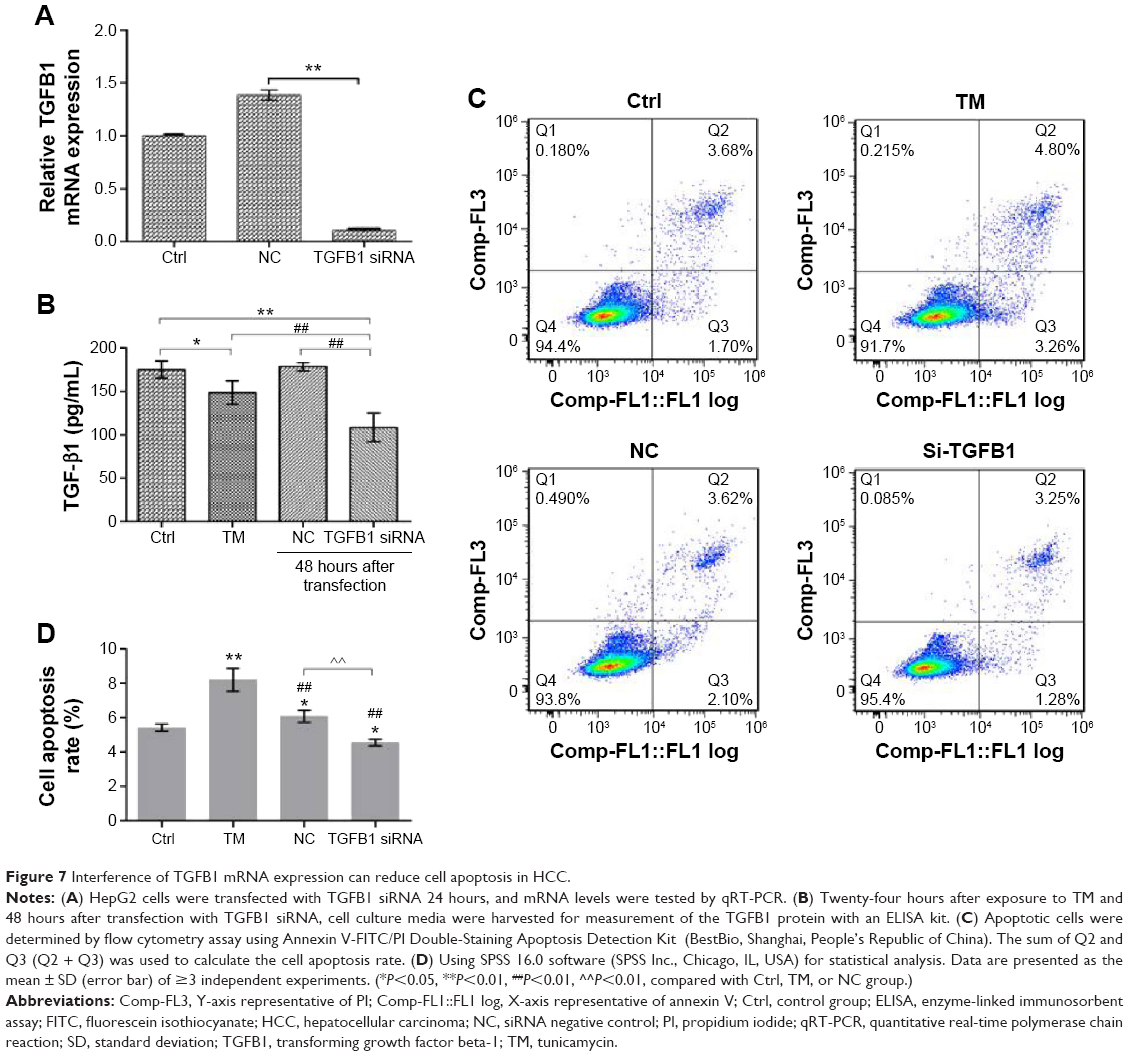 | Figure 7 Interference of TGFB1 mRNA expression can reduce cell apoptosis in HCC. |
Discussion
Although tumor cell apoptosis resistance caused by ER stress has been reported,25,26 the role of miRNAs in this process has not been carefully studied. In this study, we show for the first time that miR-663 was significantly upregulated under ER stress via miRNA-CHIP microarray and qRT-PCR assay. The increased expression of miR-663 has a positive role in HCC cell proliferation, but a negative one in cell apoptosis under ER stress, as demonstrated by the CCK-8 assay and flow cytometry analysis. TGFB1, a target gene of miR-663 predicted though computational analysis, was negatively regulated by miR-663 at both the mRNA and protein levels. Moreover, inhibition of TGFB1 expression by TGFB1 siRNA protects HepG2 cells against apoptosis. Therefore, we uncovered a vital role for themiR-663/TGFB1 axis in modulating ER stress-mediated apoptosis resistance of HCC cells.
It is well known that prolonged accumulation of misfolded or unfolded proteins caused by cellular stress triggers ER stress and that this may lead to a variety of consequences, such as adaptation, apoptosis, and autophagy. In eukaryotes, the activation of the unfolded protein response enables cells to survive ER stress and protects them from death. However, when ER stress is persistent or excessive, the adaptive mechanisms fail to compensate, and ultimately cell death occurs, typically through apoptosis.27,28 Indeed, due to rapid growth, most solid human tumors contain regions with acute and chronic hypoxia or anoxia, and this hypoxia or anoxia can induce stress in the ER.29,30 Therefore, to survive the unfriendly tumor microenvironment, the unfolded protein response pathways are activated in a large number of tumors; meanwhile, the expression of chaperones and antioxidants and/or progression to autophagy is initiated. Thus, the ER stress response acts as a protective function against the effects that long-term exposure stimulates and plays a crucial role in saving cancer cells from apoptosis. However, and most importantly, it may result in tumor progression due to the adaptation and selection of tumor cells to ER stress.26 This is usually referred to as ER stress-mediated apoptosis resistance. Therefore, it is essential and urgent to uncover the mechanism of ER stress-mediated apoptosis resistance and further overcome these resistance responses. In our work, we discovered miR-663 has a crucial protective function in the ER stress-mediated apoptosis of HCC cells.
In recent years, many types of tumors have been reported to have abnormal miRNA expression, and gradually, clarifying the roles of miRNAs in regulating the process of cancer development has become an interesting field of study.31,32 Additionally, some miRNAs have been promising for tumor diagnosis or treatment.33 Our results suggest that miR-663 should be a novel future therapeutic target for patients with HCC. A large number of studies have stated that miRNAs act as oncogenes or tumor suppressor genes. Usually, miRNAs that have increased expression in tumor cells are considered to be cancer-promoting miRNAs, while those that have decreased expression are seen as a tumor-suppressing miRNAs.34 However, the roles of miRNAs in cancer are very complicated. A single miRNA might have bidirectional regulation in various cancers, upregulated in one but downregulated in another. For instance, a study performed by Iorio et al35 found that miR-125b was dramatically downregulated in human breast cancer, whereas overexpression of miR-125b has been detected in prostate cancer.36
miR-663, which is located at human chromosome 20q11.1, was reported to be differentially expressed in diverse cancers, with an increased level found in lung cancer,22,37 ovarian cancer,37 breast cancer,38 and castration-resistant prostate cancer,39 whereas in colon cancer23 and gastric cancer,40 miR-663 expression was decreased. Multiple miR-663 targets genes have been reported, such as TGFB1, p21, H-ras, HSPG2, eEF1, and APP, which could modulate cancer cell proliferation, apoptosis, and chemotherapy resistance.23,38,41–45 Overexpression of miR-663 under ER stress was found to strengthen cell adaptability. Its inhibiting effect on TGFB1 seems to support such a role because TGFB1 could induce cytostatic and apoptotic responses.41
The present study confirmed that the expression of TGFB1 was significantly lower in TM-treated HCC cells compared with TM-untreated cells. Lower expression levels of TGFB1 were closely associated with cancer progression, such as cell proliferation and apoptosis.17–19 Based on the results of target prediction, we explored TGFB1 among the genes that were potentially targeted by miR-663. On one hand, as we mentioned before, TGFB1 has known roles in both HCC proliferation and apoptosis. On the other hand, miR-663 directly interacts with the 3′UTR of TGFB1, which has been demonstrated in endothelial cells, papillary thyroid carcinoma cells, A549, SW460 as well as Hela cell lines.20–24 Among these, Hela cell lines were a cell type that was often used in the luciferase report assay, which called tool cells, they have a higher transfection efficiency and make the experiment more accurate. Apart from Hela cell, HEK293T cell, and primary cell also can be used in this assay as tool cells. In addition, relevant professional institutes and literature often use tool cells, such as Hela cell, HEK293T cell, and primary cell, to conduct luciferase reporter gene experiments, and usually, the result is universally representative. For instance, the targeting relationship between miR-223 and C/EBPβ has been validated in Caco-2 cells and K562 cells, which is in line with the results of luciferase report assay in HEK-293T cells.46,47 Moreover, the consequence of miR-663 inhibition on the expression of the attached luciferase gene to the 3′UTR of eEF1A2 maintained high consistency among PANC-1, AsPC-1 cells, and Hela cells.44,48 In this study, we demonstrated that miR-663 decreases TGFB1 expression at both the mRNA and protein levels, indicating that miR-663 inhibited TGFB1 expression in a posttranscriptional manner.
Of note, TGFB1, as a multifunctional cytokine and a ligand of the TGFB signaling pathway, participates in several biological processes, including cell proliferation, apoptosis, and migration. The TGFB signaling pathway initiates with the activation of TGFB1, and after binding to the type II receptor (TGFBR2), the heterodimeric complex then phosphorylates the type I receptor (TGFBR1). Activated TGFBR1 then phosphorylates two downstream elements, SMAD2 and SMAD3, allowing them to bind to SMAD4 and form a stable complex called Co-SMAD. This complex interacts with various transcription factors through the C-terminal MH2 domain, which increases their binding affinity and specificity to the target gene promoters, resulting in their regulation.49,50 TGFB1 has a complex role in tumor cells; it act as a tumor suppressor at the initial stages of tumor formation and promotes metastasis at the later stages of tumor progression.51 Thus, it would be interesting to identify whether the impact of miR-663 on TGFB1 transcripts may vary according to the stage of the tumor. Elliott and Blobe52 reported that TGFB1 is a strong growth inhibitor in many cancers, such as breast cancer, gastric cancer, ovarian cancer, and prostate cancer. The mechanisms by which TGFB1 induced and regulated apoptosis are cell and context dependent.52 In our study, miR-663 overexpression resulted in the downregulation of TGFB1. After inhibition of miR-663 expression, TGFB1 was upregulated and apoptotic cells increased significantly. Additionally, inhibition of TGFB1 expression could reduce apoptosis in HepG2 cells. These results indicate that TGFB1 may play a crucial role in HCC cells apoptosis.
In conclusion, we show for the first time that miR-663 plays a pivotal role in ER stress-mediated apoptosis resistance in HCC cells by downregulating TGFB1. The newly identified miR-663/TGFB1 axis sheds light on the molecular mechanism of HCC cell apoptosis resistance. However, our work is only an in vitro study; thus, in vivo experiments are essential to further clarify the mechanism. This mechanism may provide new promising therapeutic targets for improving the efficacy of HCC therapy.
Acknowledgments
The authors thank Professor Wei Wei for providing the experimental platform to complete this study. This study was supported by grants from the National Natural Science Foundation of China (grants 81402040 and 81272739).
Disclosure
The authors report no conflicts of interest in this work.
References
Waly Raphael S, Yangde Z, Yuxiang C. Hepatocellular carcinoma: focus on different aspects of management. ISRN Oncol. 2012;2012:421673. | ||
Forner A, Llovet JM, Bruix J. Hepatocellular carcinoma. Lancet. 2012;379(9822):1245–1255. | ||
Minguez B, Tovar V, Chiang D, Villanueva A, Llovet JM. Pathogenesis of hepatocellular carcinoma and molecular therapies. Curr Opin Gastroenterol. 2009;25(3):186–194. | ||
Kapoor A, Sanyal AJ. Endoplasmic reticulum stress and the unfolded protein response. Clin Liver Dis. 2009;13(4):581–590. | ||
Ron D, Walter P. Signal integration in the endoplasmic reticulum unfolded protein response. Nat Rev Mol Cell Biol. 2007;8(7):519–529. | ||
Zha L, Fan L, Sun G, et al. Melatonin sensitizes human hepatoma cells to endoplasmic reticulum stress-induced apoptosis. J Pineal Res. 2012;52(3):322–331. | ||
Schonthal AH. Targeting endoplasmic reticulum stress for cancer therapy. Front Biosci. 2012;4:412–431. | ||
Su CC, Liu SH, Lee KI, et al. Cantharidin induces apoptosis through the calcium/PKC-regulated endoplasmic reticulum stress pathway in human bladder cancer cells. Am J Chin Med. 2015;43(3):581–600. | ||
Drake TM, Ritchie JE, Kanthou C, Staves JJ, Narramore R, Wyld L. Targeting the endoplasmic reticulum mediates radiation sensitivity in colorectal cancer. Exp Mol Pathol. 2015;98(3):532–539. | ||
Zhao Y, Srivastava D. A developmental view of microRNA function. Trends Biochem Sci. 2007;32(4):189–197. | ||
Chen CZ, Li L, Lodish HF, Bartel DP. MicroRNAs modulate hematopoietic lineage differentiation. Science. 2004;303(5654):83–86. | ||
Agrawal R, Tran U, Wessely O. The miR-30 miRNA family regulates Xenopus pronephros development and targets the transcription factor Xlim1/Lhx1. Development. 2009;136(23):3927–3936. | ||
Matsubara H, Takeuchi T, Nishikawa E, et al. Apoptosis induction by antisense oligonucleotides against miR-17-5p and miR-20a in lung cancers overexpressing miR-17-92. Oncogene. 2007;26(41):6099–6105. | ||
Mendell JT. miRiad roles for the miR-17-92 cluster in development and disease. Cell. 2008;133(2):217–222. | ||
Kim SJ, Kang HS, Lee JH, et al. Melatonin ameliorates ER stress-mediated hepatic steatosis through miR-23a in the liver. Biochem Biophys Res Commun. 2015;458(3):462–469. | ||
Liu JT, Li WC, Gao S, et al. Autophagy inhibition overcomes the antagonistic effect between gefitinib and cisplatin in epidermal growth factor receptor mutant non-small-cell lung cancer cells. Clin Lung Cancer. 2015;16(5):e55–e66. | ||
Ehnert S, Freude T, Eicher C, et al. Darbepoetin inhibits proliferation of hepatic cancer cells in the presence of TGF-beta. Arch Toxicol. 2014;88(1):89–96. | ||
Park TJ, Jeong BR, Tateno C, et al. Pleiotrophin inhibits transforming growth factor beta1-induced apoptosis in hepatoma cell lines. Mol Carcinog. 2008;47(10):784–796. | ||
Ceballos MP, Parody JP, Alvarez Mde L, Ingaramo PI, Carnovale CE, Carrillo MC. Interferon-alpha2b and transforming growth factor-beta1 treatments on HCC cell lines: Are Wnt/beta-catenin pathway and Smads signaling connected in hepatocellular carcinoma? Biochem Pharmacol. 2011;82(11):1682–1691. | ||
Hong Q, Yu S, Geng X, et al. High concentrations of uric acid inhibit endothelial cell migration via miR-663 which regulates phosphatase and tensin homolog by targeting transforming growth factor-beta1. Microcirculation. 2015;22(4):306–314. | ||
Hu W, Xu S, Yao B, et al. MiR-663 inhibits radiation-induced bystander effects by targeting TGFB1 in a feedback mode. RNA Biol. 2014;11(9):1189–1198. | ||
Liu ZY, Zhang GL, Wang MM, Xiong YN, Cui HQ. MicroRNA-663 targets TGFB1 and regulates lung cancer proliferation. Asian Pac J Cancer Prev. 2011;12(11):2819–2823. | ||
Tili E, Michaille JJ, Alder H, et al. Resveratrol modulates the levels of microRNAs targeting genes encoding tumor-suppressors and effectors of TGFbeta signaling pathway in SW480 cells. Biochem Pharmacol. 2010;80(12):2057–2065. | ||
Wang Z, Zhang H, Zhang P, Dong W, He L. MicroRNA-663 suppresses cell invasion and migration by targeting transforming growth factor beta 1 in papillary thyroid carcinoma. Tumour Biol. Epub 2015 Dec 19. | ||
Mann MJ, Hendershot LM. UPR activation alters chemosensitivity of tumor cells. Cancer Biol Ther. 2006;5(7):736–740. | ||
Hersey P, Zhang XD. Adaptation to ER stress as a driver of malignancy and resistance to therapy in human melanoma. Pigment Cell Melanoma Res. 2008;21(3):358–367. | ||
Rutkowski DT, Hegde RS. Regulation of basal cellular physiology by the homeostatic unfolded protein response. J Cell Biol. 2010;189(5):783–794. | ||
Rasheva VI, Domingos PM. Cellular responses to endoplasmic reticulum stress and apoptosis. Apoptosis. 2009;14(8):996–1007. | ||
Karar J, Dolt KS, Qadar Pasha MA. Endoplasmic reticulum stress response in murine kidney exposed to acute hypobaric hypoxia. FEBS Lett. 2008;582(17):2521–2526. | ||
Sawada N, Yao J, Hiramatsu N, et al. Involvement of hypoxia-triggered endoplasmic reticulum stress in outlet obstruction-induced apoptosis in the urinary bladder. Lab Invest. 2008;88(5):553–563. | ||
Landgraf P, Rusu M, Sheridan R, et al. A mammalian microRNA expression atlas based on small RNA library sequencing. Cell. 2007;129(7):1401–1414. | ||
Lu J, Getz G, Miska EA, et al. MicroRNA expression profiles classify human cancers. Nature. 2005;435(7043):834–838. | ||
Varol N, Konac E, Gurocak OS, Sozen S. The realm of microRNAs in cancers. Mol Biol Rep. 2011;38(2):1079–1089. | ||
Lovat F, Valeri N, Croce CM. MicroRNAs in the pathogenesis of cancer. Semin Oncol. 2011;38(6):724–733. | ||
Iorio MV, Ferracin M, Liu CG, et al. MicroRNA gene expression deregulation in human breast cancer. Cancer Res. 2005;65(16):7065–7070. | ||
Shi XB, Xue L, Yang J, et al. An androgen-regulated miRNA suppresses Bak1 expression and induces androgen-independent growth of prostate cancer cells. Proc Natl Acad Sci U S A. 2007;104(50):19983–19988. | ||
Kim YW, Kim EY, Jeon D, et al. Differential microRNA expression signatures and cell type-specific association with Taxol resistance in ovarian cancer cells. Drug Des Devel Ther. 2014;8:293–314. | ||
Hu H, Li S, Cui X, et al. The overexpression of hypomethylated miR-663 induces chemotherapy resistance in human breast cancer cells by targeting heparin sulfate proteoglycan 2 (HSPG2). J Biol Chem. 2013; 288(16):10973–10985. | ||
Jiao L, Deng Z, Xu C, et al. miR-663 induces castration-resistant prostate cancer transformation and predicts clinical recurrence. J Cell Physiol. 2014;229(7):834–844. | ||
Pan J, Hu H, Zhou Z, et al. Tumor-suppressive mir-663 gene induces mitotic catastrophe growth arrest in human gastric cancer cells. Oncol Rep. 2010;24(1):105–112. | ||
Siegel PM, Massague J. Cytostatic and apoptotic actions of TGF-beta in homeostasis and cancer. Nat Rev Cancer. 2003;3(11):807–821. | ||
Yi C, Wang Q, Wang L, et al. MiR-663, a microRNA targeting p21(WAF1/CIP1), promotes the proliferation and tumorigenesis of nasopharyngeal carcinoma. Oncogene. 2012;31(41):4421–4433. | ||
Yang Y, Wang LL, Wang HX, et al. The epigenetically-regulated miR-663 targets H-ras in K-562 cells. FEBS J. 2013;280(20):5109–5117. | ||
Vislovukh A, Kratassiouk G, Porto E, et al. Proto-oncogenic isoform A2 of eukaryotic translation elongation factor eEF1 is a target of miR-663 and miR-744. Br J Cancer. 2013;108(11):2304–2311. | ||
Shu R, Wong W, Ma QH, et al. APP intracellular domain acts as a transcriptional regulator of miR-663 suppressing neuronal differentiation. Cell Death Dis. 2015;6:e1651. | ||
Sun D, Wang C, Long S, et al. C/EBP-beta-activated microRNA-223 promotes tumour growth through targeting RASA1 in human colorectal cancer. Br J Cancer. 2015;112(9):1491–1500. | ||
Zhou H, Xiao J, Wu N, et al. MicroRNA-223 Regulates the differentiation and function of intestinal dendritic cells and macrophages by targeting C/EBPbeta. Cell Rep. 2015;13(6):1149–1160. | ||
Zang W, Wang Y, Wang T, et al. miR-663 attenuates tumor growth and invasiveness by targeting eEF1A2 in pancreatic cancer. Mol Cancer. 2015;14:37. | ||
Connolly EC, Freimuth J, Akhurst RJ. Complexities of TGF-beta targeted cancer therapy. Int J Biol Sci. 2012;8(7):964–978. | ||
Heldin CH, Moustakas A. Role of Smads in TGFbeta signaling. Cell Tissue Res. 2012;347(1):21–36. | ||
Tian M, Schiemann WP. The TGF-beta paradox in human cancer: an update. Future Oncol. 2009;5(2):259–271. | ||
Elliott RL, Blobe GC. Role of transforming growth factor beta in human cancer. J Clin Oncol. 2005;23(9):2078–2093. |
 © 2016 The Author(s). This work is published and licensed by Dove Medical Press Limited. The
full terms of this license are available at https://www.dovepress.com/terms
and incorporate the Creative Commons Attribution
- Non Commercial (unported, 3.0) License.
By accessing the work you hereby accept the Terms. Non-commercial uses of the work are permitted
without any further permission from Dove Medical Press Limited, provided the work is properly
attributed. For permission for commercial use of this work, please see paragraphs 4.2 and 5 of our Terms.
© 2016 The Author(s). This work is published and licensed by Dove Medical Press Limited. The
full terms of this license are available at https://www.dovepress.com/terms
and incorporate the Creative Commons Attribution
- Non Commercial (unported, 3.0) License.
By accessing the work you hereby accept the Terms. Non-commercial uses of the work are permitted
without any further permission from Dove Medical Press Limited, provided the work is properly
attributed. For permission for commercial use of this work, please see paragraphs 4.2 and 5 of our Terms.