Back to Journals » OncoTargets and Therapy » Volume 12
miR-522-3p Promotes Osteosarcoma Cell Growth By Regulating Glucose Uptake And GLUT1 Expression
Authors Chen R, Lin J, Yan W, Chen D
Received 27 May 2019
Accepted for publication 24 September 2019
Published 1 November 2019 Volume 2019:12 Pages 9053—9058
DOI https://doi.org/10.2147/OTT.S217324
Checked for plagiarism Yes
Review by Single anonymous peer review
Peer reviewer comments 2
Editor who approved publication: Prof. Dr. Takuya Aoki
Rong Chen, Jiasheng Lin, Wei Yan, Dongdong Chen
Musculoskeletal Tumor, Fuzhou Second Hospital Affiliated to Xiamen University, Fuzhou, Fujian 350007, People’s Republic of China
Correspondence: Rong Chen
Musculoskeletal Tumor, Fuzhou Second Hospital Affiliated to Xiamen University, No. 47, Shangteng Road, Cangshan District, Fuzhou, Fujian 350007, People’s Republic of China
Tel +86 591 8803 9333
Email [email protected]
Purpose: In a recent study, Kang et al reported a novel miRNA named miR-522-3p with critical roles in phagocytosis, in which GLUT1 played a critical role, indicating the possible interactions between them. This study aimed to investigate the role of miR-522-3p in osteosarcoma (OS).
Methods: Gene expression was analyzed by qPCR and Western blot. Overexpression experiments were performed to analyze gene interactions. Glucose uptake assay was performed to analyze the effects of glucose uptake in cells. CCK-8 assay was used to analyze cell proliferation.
Results: We found that miR-522-3p and GLUT1 were both upregulated in OS and positively correlated. Follow-up showed that high levels of miR-522-3p expression predicted poor survival. In OS cells, miR-522-3p overexpression led to upregulated GLUT1 expression and increase glucose uptake. Analysis of cell proliferation assay showed that overexpression of miR-522-3p and GLUT1 led to increased cell proliferate rates. In addition, GLUT1 siRNA silencing resulted in reduced effects of miR-522-3p overexpression.
Conclusion: MiR-522-3p promotes OS cell growth through reprogramming glucose metabolism.
Keywords: miR-522-3p, osteosarcoma, GLUT1, survival
Introduction
Osteosarcoma (OS) is one of the 3 most common types of bone cancers, and the other two are Ewing tumors and chondrosarcoma.1 OS mainly affects teenagers and young adults.1 The annual incidence rate of OS is about 1.67 per million, and the incidence rate is much higher in males than in females.2 Although OS is a rare type of cancer, incidence of this disease has been increased by 0.3% every year during the past decade.3 With the development of modern cancer therapies, the overall survival of OS patients has been significantly improved during the past decade.4,5 At present, more than 50% of OS patients can live longer than 5 years after diagnosis, while effective treatments for metastatic OS remain lacking.6
Glucose metabolism plays pivotal roles in both normal and cancer cells.7 In cancer cells, accelerated glucose consumption provides energies for all cancer cell behaviors.8 Therefore, inhibition of glucose uptake is considered as a potential target for the treatment of cancers.7,8 Glucose transporter 1, or GLUT1, is a key player in the transportation of glucose into mammalian cells.9 It is known that GLUT1 may interact with certain miRNAs to participate in cancer biology.10–12 In a recent study, Kang et al reported a novel miRNA named miR-522-3p with critical roles in phagocytosis,13 in which GLUT1 played a critical role,14 indicating the possible interactions between them. This study aimed to analyze the interaction between miR-522-3p and GLUT1 in OS.
Materials And Methods
Research Subjects
Research subjects of the present study were 62 OS patients (25 males and 27 females; age range: 19 to 38 years; mean age: 27.3 ± 5.6 years), who were selected from the 113 OS patients admitted to Fuzhou Second Hospital Affiliated to Xiamen University between March 2011 and April 2014. This study passed the review board of Fuzhou Second Hospital Affiliated to Xiamen University Ethics Committee before the admission of patients. Inclusion criteria: 1) no therapies were initiated and 2) newly diagnosed OS cases. Exclusion criteria: 1) OS patients complicated with other clinical disorders; 2) recurrent OS; and 3) patients who received treatments within 3 months before this study. All the 62 patients were staged according to AJCC staging system, and there were 12, 19, 18 and 13 cases at stage I-IV, respectively. All the 62 OS patients signed informed consent before this study.
OS Tissues, Treatment And Follow-Up
Before the initiation of therapies, all patients were subjected to MRI-guided fine needle biopsy. During biopsy, OS and adjacent non-tumor tissues were collected. All tissue samples were confirmed by histopathological examinations.
All patients were treated with surgical resections and/or chemotherapy or radiation therapies according to their conditions. From the day of admission, all patients were followed up for 5 years to monitor their survival conditions. The patients died of other causes and the patients who were lost during follow-up were excluded from the survival analysis.
Cell Culture And Transfection
Two human OS cell lines U2OS and MG-63 (ATCC, USA) were used in this study. Cells were cultivated in the mixture of 90% Eagle’s minimum essential medium and 10% FBS. Cell culture conditions were 37°C, 95% humidity and 5% CO2. U2OS and MG-63 cell were harvested at confluence of 70-80% to perform cell transfections. Negative control (NC) miRNA and miR-522-3p, NC siRNA and GLUT1 siRNA, as well as GLUT1-expression pcDNA3.1 vector and empty pcDNA3.1 vector were all from Sangon (Shanghai, China). Transient transfections were mediated by lipofectamine 2000 reagent (Sangon) to transfect 40 nM miRNA (NC miRNA as NC group), 40 nM siRNA (NC siRNA as NC group), or 10 nM vector (empty vector as NC group) into 106 cells. Subsequent experiments were performed using cells harvested at 24 hrs post-transfection. Control (C) cells for all transfections were untransfected cells.
Total RNAs And qPCR
Total RNAs in tissue samples and 105 cells were extracted using Trizol reagent (Invitrogen, USA). RNA precipitation and washing were performed using 85% ethanol to harvest miRNAs. All RNA samples were digested with DNase I for 2hrs at 37°C. To detect the expression of GLUT1 mRNA, RevertAid RT Reverse Transcription Kit (Thermo Fisher Scientific) was used to perform reverse transcriptions and DyNAmo Flash SYBR Green qPCR Kit (Thermo Fisher Scientific) was used to prepare qPCR reaction mixtures with GAPDH as endogenous control. To measure the expression levels of miR-522-3p, All-in-One™ miRNA qRT-PCR Reagent Kit (Genecopoeia) was used to complete all step according to manufacturer’s instructions. 2−ΔΔCT method was used to process data and three replicates were included in each experiment.
Glucose Uptake Analysis
U2OS and MG-63 cells were harvested at 24hrs post-transfection. Cells (105) were first cultivated in glucose-free Eagle’s minimum essential medium under condition of 37°C, 95% humidity and 5% CO2 for 16 hrs, followed by cell culture in high-glucose Eagle’s minimum essential medium for additional 24 hrs under the same conditions. After that, a fluorescence-based glucose assay kit (BioVision) was used to measure the levels of intracellular glucose.
Cell Proliferation Analysis
U2OS and MG-63 cells were harvested at 24hrs post-transfection. Cells were counted and 5 ×10⁴ cells were mixed with 1 mL Eagle’s minimum essential medium to prepare single cell suspensions. A 96-well plate was used to cultivate the cells under the conditions mentioned above (0.1mL per well). Each well was added with CCK-8 solution (10 µL, Sigma-Aldrich) at 4 hrs before the end of cell culture to monitor cell proliferation. After cell culture was terminated, each well was added with 10 ul DMSO and OD values at 450 nm were measured.
Western-Blot
U2OS and MG-63 cells were harvested at 24 hrs post-transfection and total proteins in 105 cells were extracted using RIPA solution (Sangon). Electrophoresis was performed using a SDS-PAGE (10%) gel to separate proteins after protein samples were boiled in water for 5 mins. Proteins were then transferred to PVDF membranes and blocking was performed in 5% non-fact milk for 2 hrs at room temperature. Following that, first blotting was performed using rabbit anti-GLUT-1 (1:1200, ab15309, Abcam) and anti-GAPDH antibody (1:1200, ab9485, Abcam) primary antibodies for 18hrs at 4°C, and the second blotting was performed using goat anti-rabbit IgG-HRP secondary antibody (1:1500, MBS435036, MyBioSource) for 2hrs at room temperature. ECL™ Blocking Agent GE Healthcare (Sigma-Aldrich) was used to incubate with membranes for 10 mins to develop signals and data were processed using Image J V1.34 software.
Statistical Analysis
All data presented in this study were mean values of 3 biological replicates. Correlations were analyzed by linear regression. Explorations of differences between two types of tissues (OS vs non-tumor) were performed using paired t test. Explorations of differences among multiple cell groups were analyzed by one-way ANOVA and Tukey’s test. The 62 patients were grouped into high and low two miR-522-3p level groups according to its median expression level in OS. K-M plotter and log-rank test were used to plot and compare survival curves. p < 0.05 was statistically significant.
Results
miR-522-3p And GLUT1 mRNA Were Positively Correlated In OS Tissues
qPCR was performed to measure the expression levels of miR-522-3p and GLUT1 mRNA in both OS and non-tumor tissues. Expression levels of miR-522-3p and GLUT1 were compared between two types of tissues by performed paired t-test. Comparing to non-tumor tissues, expression levels of miR-522-3p (Figure 1A) and GLUT1 (Figure 1B) were significantly higher in OS tissues (p<0.05). Correlations between miR-522-3p and GLUT1 mRNA were analyzed by linear regression. It can be observed that expression level of miR-522-3p was significantly and positively correlated with that of GLUT1 mRNA in OS tissues (Figure 1C). However, the correlation between miR-522-3p and GLUT1 mRNA in non-tumor tissues was not significant (Figure 1D).
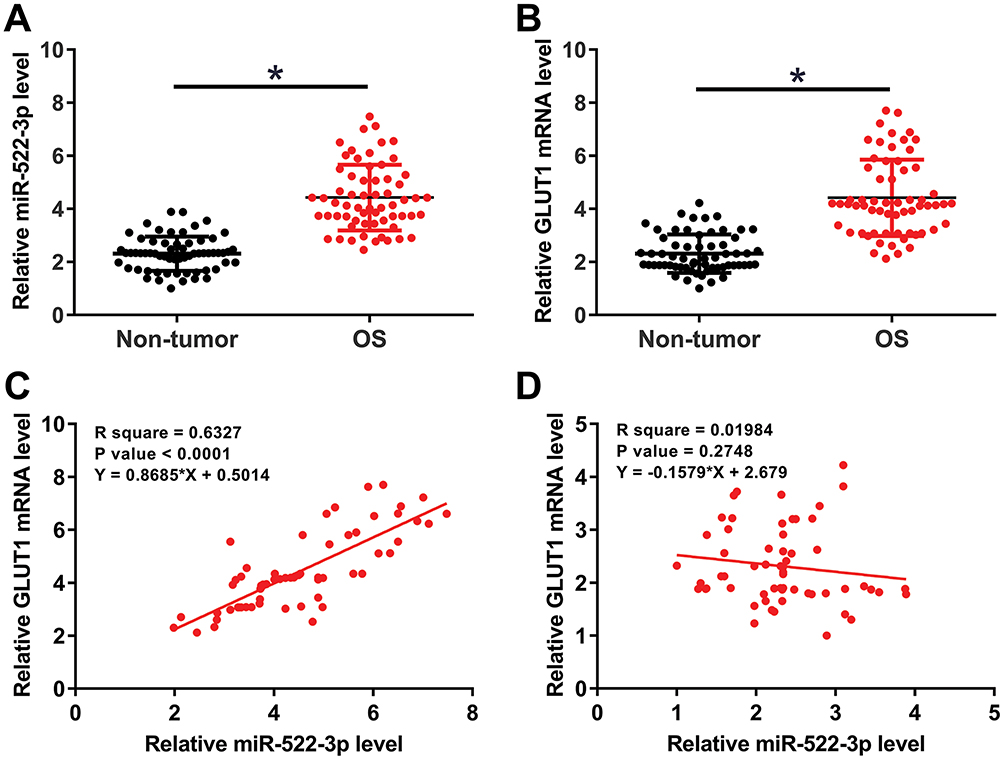 |
Figure 1 miR-522-3p and GLUT1 mRNA were positively correlated in OS tissues. qPCR was performed to measure the expression levels of miR-522-3p and GLUT1 mRNA in both OS and non-tumor tissues. Expression levels of miR-522-3p (A) and GLUT1 (B) were compared between two types of tissues by performed paired t-test. Correlations between miR-522-3p and GLUT1 mRNA in both OS (C) and non-tumor (D) tissues were analyzed by linear regression. Mean values were presented, *p<0.05. |
High Level Of miR-522-3p In OS Tissues Predicted Poor Survival
Using the survival data of the 5-year follow-up, survival curves of two (high and low) miR-522-3p level groups were plotted and compared through the methods aforementioned. Comparing to patients in low miR-522-3p level group, the overall survival rate of patients in high miR-522-3p level group was significantly lower (Figure 2).
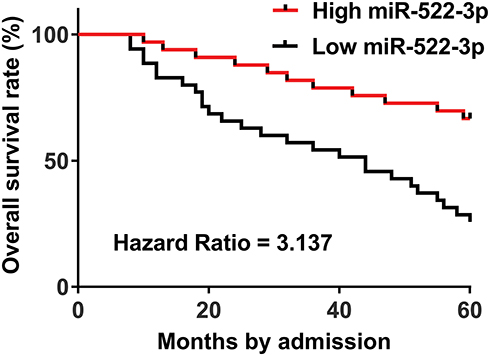 |
Figure 2 High level of miR-522-3p in OS tissues predicted poor survival. The 62 patients were group into high and low two miR-522-3p level groups according to its median expression level in OS. K-M plotter and log-rank test were used to plot and compare survival curves. |
miR-522-3p Promoted GLUT1 Expression And Increase Glucose Uptake In OS Cells
To investigate the interactions between miR-522-3p and GLUT1, U2OS and MG-63 cells were transfected with miR-522-3p mimic and GLUT1 expression vector. Expression levels of miR-522-3p and GLUT1 were measured at 24hrs post-transfections. Comparing to NC (NC miRNA or empty pcDNA3.1 vector-transfected cells) and C (untransfected cells) two controls, expression levels of miR-522-3p and GLUT1 were significantly upregulated (Figure 3A, p<0.05). Comparing to two controls, miR-522-3p overexpression led to upregulated GLUT1 expression (Figure 3B, p<0.05) and increase glucose uptake (Figure 3C, p<0.05). However, GLUT1 overexpression failed to significantly affect the expression of miR-522-3p (Figure 3D, p>0.05).
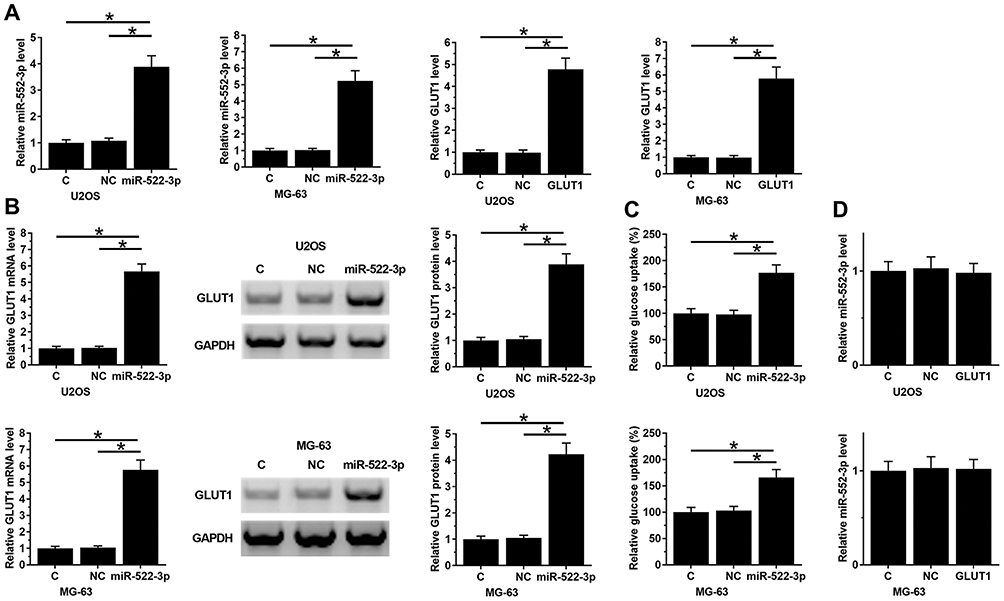 |
Figure 3 miR-522-3p promoted GLUT1 expression and increase glucose uptake in OS cells. To investigate the interactions between miR-522-3p and GLUT1, U2OS and MG-63 cells were transfected with miR-522-3p mimic and GLUT1-expression vector. Overexpression of miR-522-3p and GLUT1 was confirmed by qPCR at 24 hrs post-transfection (A). The effects on miR-522-3p overexpression on GLUT1 expression (B) and glucose uptake (C) were analyzed by Western blot, qPCR and glucose uptake assay. The effects of GLUT1 overexpression on miR-522-3p were analyzed by qPCR (D). Mean values of 3 biological replicates were presented. NC, NC miRNA or empty pcDNA3.1 vector-transfected cells; C, untransfected cells; *p<0.05. |
miR-522-3p Promoted OS Cell Proliferation Through GLUT1
The roles of miR-522-3p and GLUT in regulating the proliferation of U2OS and MG-63 cells were explored by performing cell proliferation assay. Comparing to NC (NC siRNA, NC miRNA or empty pcDNA3.1 vector-transfected cells) and C (untransfected cells) groups, overexpression of miR-522-3p and GLUT1 led to increase cell-proliferated rates. In addition, GLUT1 siRNA silencing resulted in reduced effects of miR-522-3p overexpression (Figure 4, p<0.05).
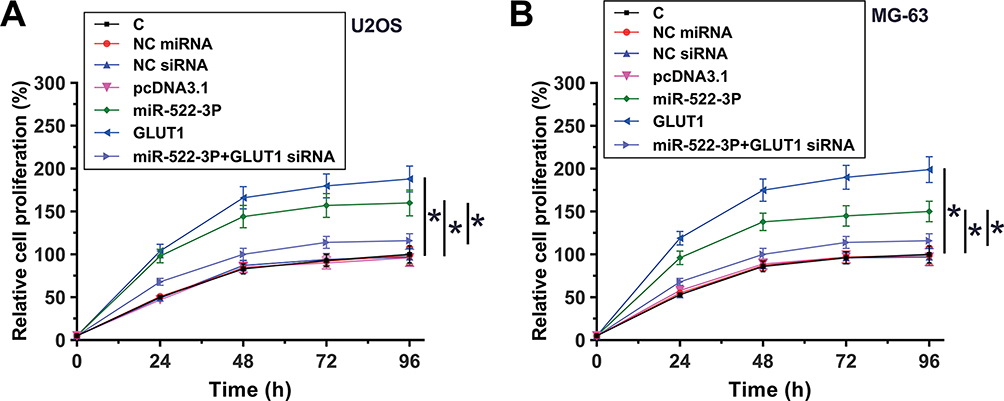 |
Figure 4 miR-522-3p promoted OS cell proliferation through GLUT1. The roles of miR-522-3p and GLUT in regulation the proliferation of U2OS (A) and MG-63 (B) cells were explored by performed cell proliferation assay. Mean values of 3 biological replicates were presented. NC, NC siRNA, NC miRNA or empty pcDNA3.1 vector-transfected cells; C, untransfected cells; *p<0.05. |
Discussion
In this study, we mainly investigated the roles of miR-522-3p in OS. We found that miR-522-3p was overexpressed in OS and was closely correlated with the survival of OS patients. In addition, miR-522-3p may upregulate the expression of GLUT1 to promote the proliferation of OS cells.
The functions of miR-522-3p have only been investigated in phagocytosis.13 In phagocytosis, miR522-3p can directly target prostaglandin reductase 1 to regulate inflammation.13 Based on our knowledge, the involvement of miR522-3p in human diseases is unclear. This study is the first to report the overexpression of miR522-3p in OS. In addition, we observed increased proliferation rate of OS cells after miR522-3p overexpression. Therefore, miR522-3p is an oncogenic miRNA in OS.
Accurate prognostic assignment may help the determination of therapeutic strategies and the development of postoperative care system.14,15 In this study, we found that the high expression levels of miR522-3p were significantly correlated with the poor survival of OS patients. Therefore, measurement of the expression of miR522-3p may help the prognostic assignment of OS cells. Comparing to gene expression in tumor tissues, plasma biomarkers are preferred in cancer prediction owing to the non-invasive nature.16 It is worth noting that our study failed to detect miR522-3p in blood of OS patients. However, most OS patients are diagnosed by biopsy. Therefore, measurement of the expression level of miR522-3p in OS tissues may be applicable in most cases.
It is known that the expression of GLUT1 in cancer biology can be downregulated by certain miRNAs, such as miR-218, miR‑10a and miR-132.10–12 However, in this study, we observed that miR522-3p can upregulate GLUT1 and promote glucose uptake in OS cells. The mechanism is unclear. We observed that miR522-3p and GLUT1 mRNA were only significantly correlated in OS tissues, but not in non-tumor tissues. Therefore, the interaction between miR522-3p and is likely mediated by certain cancer-related factors. Our future studies will explore the pathological mediators.
Conclusion
In conclusion, miR522-3p was upregulated in OS and may promote OS cell proliferation by upregulating GLUT1 and promoting glucose uptake.
Ethics Approval And Consent To Participate
Fuzhou Second Hospital Affiliated to Xiamen University Ethics Committee approved this study. All procedures were conducted in accordance with the Declaration of Helsinki. Written informed consent was obtained from all individual participants included in the study.
Disclosure
The authors report no conflicts of interest in this work.
References
1. Rickel K, Fang F, Tao J. Molecular genetics of osteosarcoma. Bone. 2017;102:69–79.
2. Pruksakorn D, Phanphaisarn A, Pongnikorn D, et al. Age standardized incidence rates and survival of osteosarcoma in Northern Thailand. Asian Pac J Cancer Prev. 2016;17(7):3455–3458.
3. Durfee RA, Mohammed M, Luu HH. Review of osteosarcoma and current management. Rheumatol Ther. 2016;3(2):221–243.
4. Anderson ME. Update on survival in osteosarcoma. Orthop Clin North Am. 2016;47(1):283–292.
5. Faisham WI, Mat Saad AZ, Alsaigh LN, et al. Prognostic factors and survival rate of osteosarcoma: a single-institution study. Asia Pac J Clin Oncol. 2017;13(2):e104–e110. doi:10.1111/ajco.12346
6. Conry RM, Rodriguez MG, Pressey JG. Zoledronic acid in metastatic osteosarcoma: encouraging progression free survival in four consecutive patients. Clin Sarcoma Res. 2016;6:6.
7. Hay N. Reprogramming glucose metabolism in cancer: can it be exploited for cancer therapy? Nat Rev Cancer. 2016;16(10):635–649.
8. Pavlova NN, Thompson CB. The emerging hallmarks of cancer metabolism. Cell Metab. 2016;23(1):27–47.
9. Fidler TP, Campbell RA, Funari T, et al. Deletion of GLUT1 and GLUT3 reveals multiple roles for glucose metabolism in platelet and megakaryocyte function. Cell Rep. 2017;20(4):881–894.
10. Li P, Yang X, Cheng Y, et al. MicroRNA-218 increases the sensitivity of bladder cancer to cisplatin by targeting glut1. Cell Physiol Biochem. 2017;41(3):921–932.
11. Chen YH, Song Y, Yu YL, Cheng W, Tong X. miRNA10a promotes cancer cell proliferation in oral squamous cell carcinoma by upregulating GLUT1 and promoting glucose metabolism. Oncol Lett. 2019;17(6):5441–5446.
12. Qu W, Ding SM, Cao G, Wang SJ, Zheng XH, Li GH. miR-132 mediates a metabolic shift in prostate cancer cells by targeting Glut1. FEBS Open Bio. 2016;6(7):735–741.
13. Kang GJ, Lee HJ, Byun HJ, et al. Novel involvement of miR-522-3p in high-mobility group box 1-induced prostaglandin reductase 1 expression and reduction of phagocytosis. Biochim Biophys Acta Mol Cell Res. 2017;1864(4):625–633.
14. Freemerman AJ, Zhao L, Pingili AK, et al. Myeloid Slc2a1-deficient murine model revealed macrophage activation and metabolic phenotype are fueled by GLUT1. J Immunol. 2019;202(4):1265–1286.
15. Kourou K, Exarchos TP, Exarchos KP, Karamouzis MV, Fotiadis DI. Machine learning applications in cancer prognosis and prediction. Comput Struct Biotechnol J. 2015;13:8–17.
16. Pritchard CC, Kroh E, Wood B, et al. Blood cell origin of circulating microRNAs: a cautionary note for cancer biomarker studies. Cancer Prev Res (Phila). 2012;5(3):492–497.
 © 2019 The Author(s). This work is published and licensed by Dove Medical Press Limited. The
full terms of this license are available at https://www.dovepress.com/terms
and incorporate the Creative Commons Attribution
- Non Commercial (unported, 3.0) License.
By accessing the work you hereby accept the Terms. Non-commercial uses of the work are permitted
without any further permission from Dove Medical Press Limited, provided the work is properly
attributed. For permission for commercial use of this work, please see paragraphs 4.2 and 5 of our Terms.
© 2019 The Author(s). This work is published and licensed by Dove Medical Press Limited. The
full terms of this license are available at https://www.dovepress.com/terms
and incorporate the Creative Commons Attribution
- Non Commercial (unported, 3.0) License.
By accessing the work you hereby accept the Terms. Non-commercial uses of the work are permitted
without any further permission from Dove Medical Press Limited, provided the work is properly
attributed. For permission for commercial use of this work, please see paragraphs 4.2 and 5 of our Terms.