Back to Journals » Cancer Management and Research » Volume 11
miR-491-5p functions as a tumor suppressor by targeting IGF2 in colorectal cancer
Authors Lu L, Cai M ![]() , Peng M, Wang F, Zhai X
, Peng M, Wang F, Zhai X
Received 8 August 2018
Accepted for publication 4 December 2018
Published 22 February 2019 Volume 2019:11 Pages 1805—1816
DOI https://doi.org/10.2147/CMAR.S183085
Checked for plagiarism Yes
Review by Single anonymous peer review
Peer reviewer comments 2
Editor who approved publication: Dr Xueqiong Zhu
Lei Lu,* Ming Cai,* Meixia Peng, Fei Wang, Xiaofeng Zhai
Department of Gastrointestinal Surgery, The Second Affiliated Hospital of Nantong University, Nantong, Jiangsu, China
*These authors contributed equally to this work
Background: Dysregulation of miRNAs is critically implicated in tumorigenesis, and aberrant expression of miR-491-5p has been reported to play a key role in initiation and progression of various cancers. However, the biological function and underlying mechanism of miR-491-5p in colorectal cancer (CRC) remain elusive.
Methods: Quantitative real-time PCR (qRT-PCR) was employed to evaluate the levels of miR-491-5p and IGF2 mRNA expression in CRC tissues, cell lines and plasma. Cell counting kit-8 and colony formation assays were used to detect the effects of miR-491-5p on CRC cell growth. Luciferase reporter assays were applied to confirm the miR-491-5p target gene. In vivo experiments were conducted in nude mice.
Results: miR-491-5p was found to be obviously downregulated in CRC tissues and cell lines, and decreased miR-491-5p expression level was shown to be associated with differentiation, TNM stage and poor overall survival (OS). miR-491-5p overexpression suppressed CRC cell proliferation both in vitro and in vivo. Mechanically, insulin-like growth factor 2 (IGF2) was identified to be a direct target of miR-491-5p in CRC cells, and overexpression of IGF2 rescued the miR-491-5p-induced suppression of proliferation in CRC cells. Finally, we demonstrated that plasma miR-491-5p expression was decreased in CRC when compared to healthy controls and might be an effective diagnostic biomarker for CRC.
Conclusion: These data showed that miR-491-5p functioned as a tumor suppressor by targeting IGF2 in CRC, and miR-491-5p could serve as a potential diagnostic and prognostic biomarker for CRC.
Keywords: miR-491-5p, IGF2, colorectal cancer, proliferation, biomarker
Introduction
Colorectal cancer (CRC) is one of the most common cancers and a leading cause of death worldwide.1 Despite great improvement in cancer diagnosis and treatment, the 5-year overall survival (OS) rate remains unsatisfied. Therefore, elucidation of the mechanism underlying CRC progression is urgently required.
miRNAs, a class of short noncoding RNAs, inversely regulate the expression of target genes via translational repression or elevating mRNA degradation.2,3 Mounting evidence indicated that many miRNAs were differently expressed in various cancers and play key roles in numerous biological processes, including cell growth, apoptosis, migration, invasion, metastasis and so on.4–6 miR-491-5p, located on chromosome 9p21.3, has been found to be dysregulated and function as a tumor suppressor in various cancers. Hui et al7 reported that miR-491-5p functioned as a tumor suppressor by targeting JMJD2B in ERα-positive breast cancer. Sun et al8 reported that Foxi1-mediated miR-491-5p inhibited the development of gastric cancer via suppressing Wnt3α/β-catenin signaling. However, the role of miR-491-5p in the progression and development of CRC remains unclear.
Insulin-like growth factor 2 (IGF2), a 7.5 kDa peptide produced by liver and many tissues, has been reported to be closely associated with many cancers.9 Li et al10 reported that miR-223 was upregulated by MYOD and inhibited myoblast proliferation by repressing IGF2. Yang et al11 reported that miR-615-5p targeted IGF2 and functioned as a tumor suppressor in esophageal squamous cell carcinoma (ESCC).
In this study, we aimed to explore the role of miR-491-5p in development and progression of CRC and its potential value of prognosis and diagnosis in CRC. miR-491-5p was found to be downregulated in CRC tissues and cell lines compared with adjacent normal tissues (ANTs) and colonic mucosal epithelial cell line (FHC), respectively. Moreover, we also detected that miR-491-5p expression level was significantly correlated with differentiation and TNM stage. Additionally, we found that miR-491-5p inhibited tumor cell growth in vitro and in vivo, whereas IGF2 could abrogate the inhibitory effect caused by miR-491-5p in CRC.
Materials and methods
Patients and tissue specimens
Eighty pairs of CRC and ANTs were obtained from CRC patients who underwent surgery at the Second Affiliated Hospital of Nantong University. The patients who received system treatments were excluded. The CRC tissues were frozen in liquid nitrogen after surgical resection and stored at –80°C until RNA extraction. Written informed consents were obtained from all these patients, and this procedure was conducted in accordance with the Declaration of Helsinki. This study was approved by the institutional review board of the Second Affiliated Hospital of Nantong University. Clinicopathological characteristics of these patients are listed in Table 1.
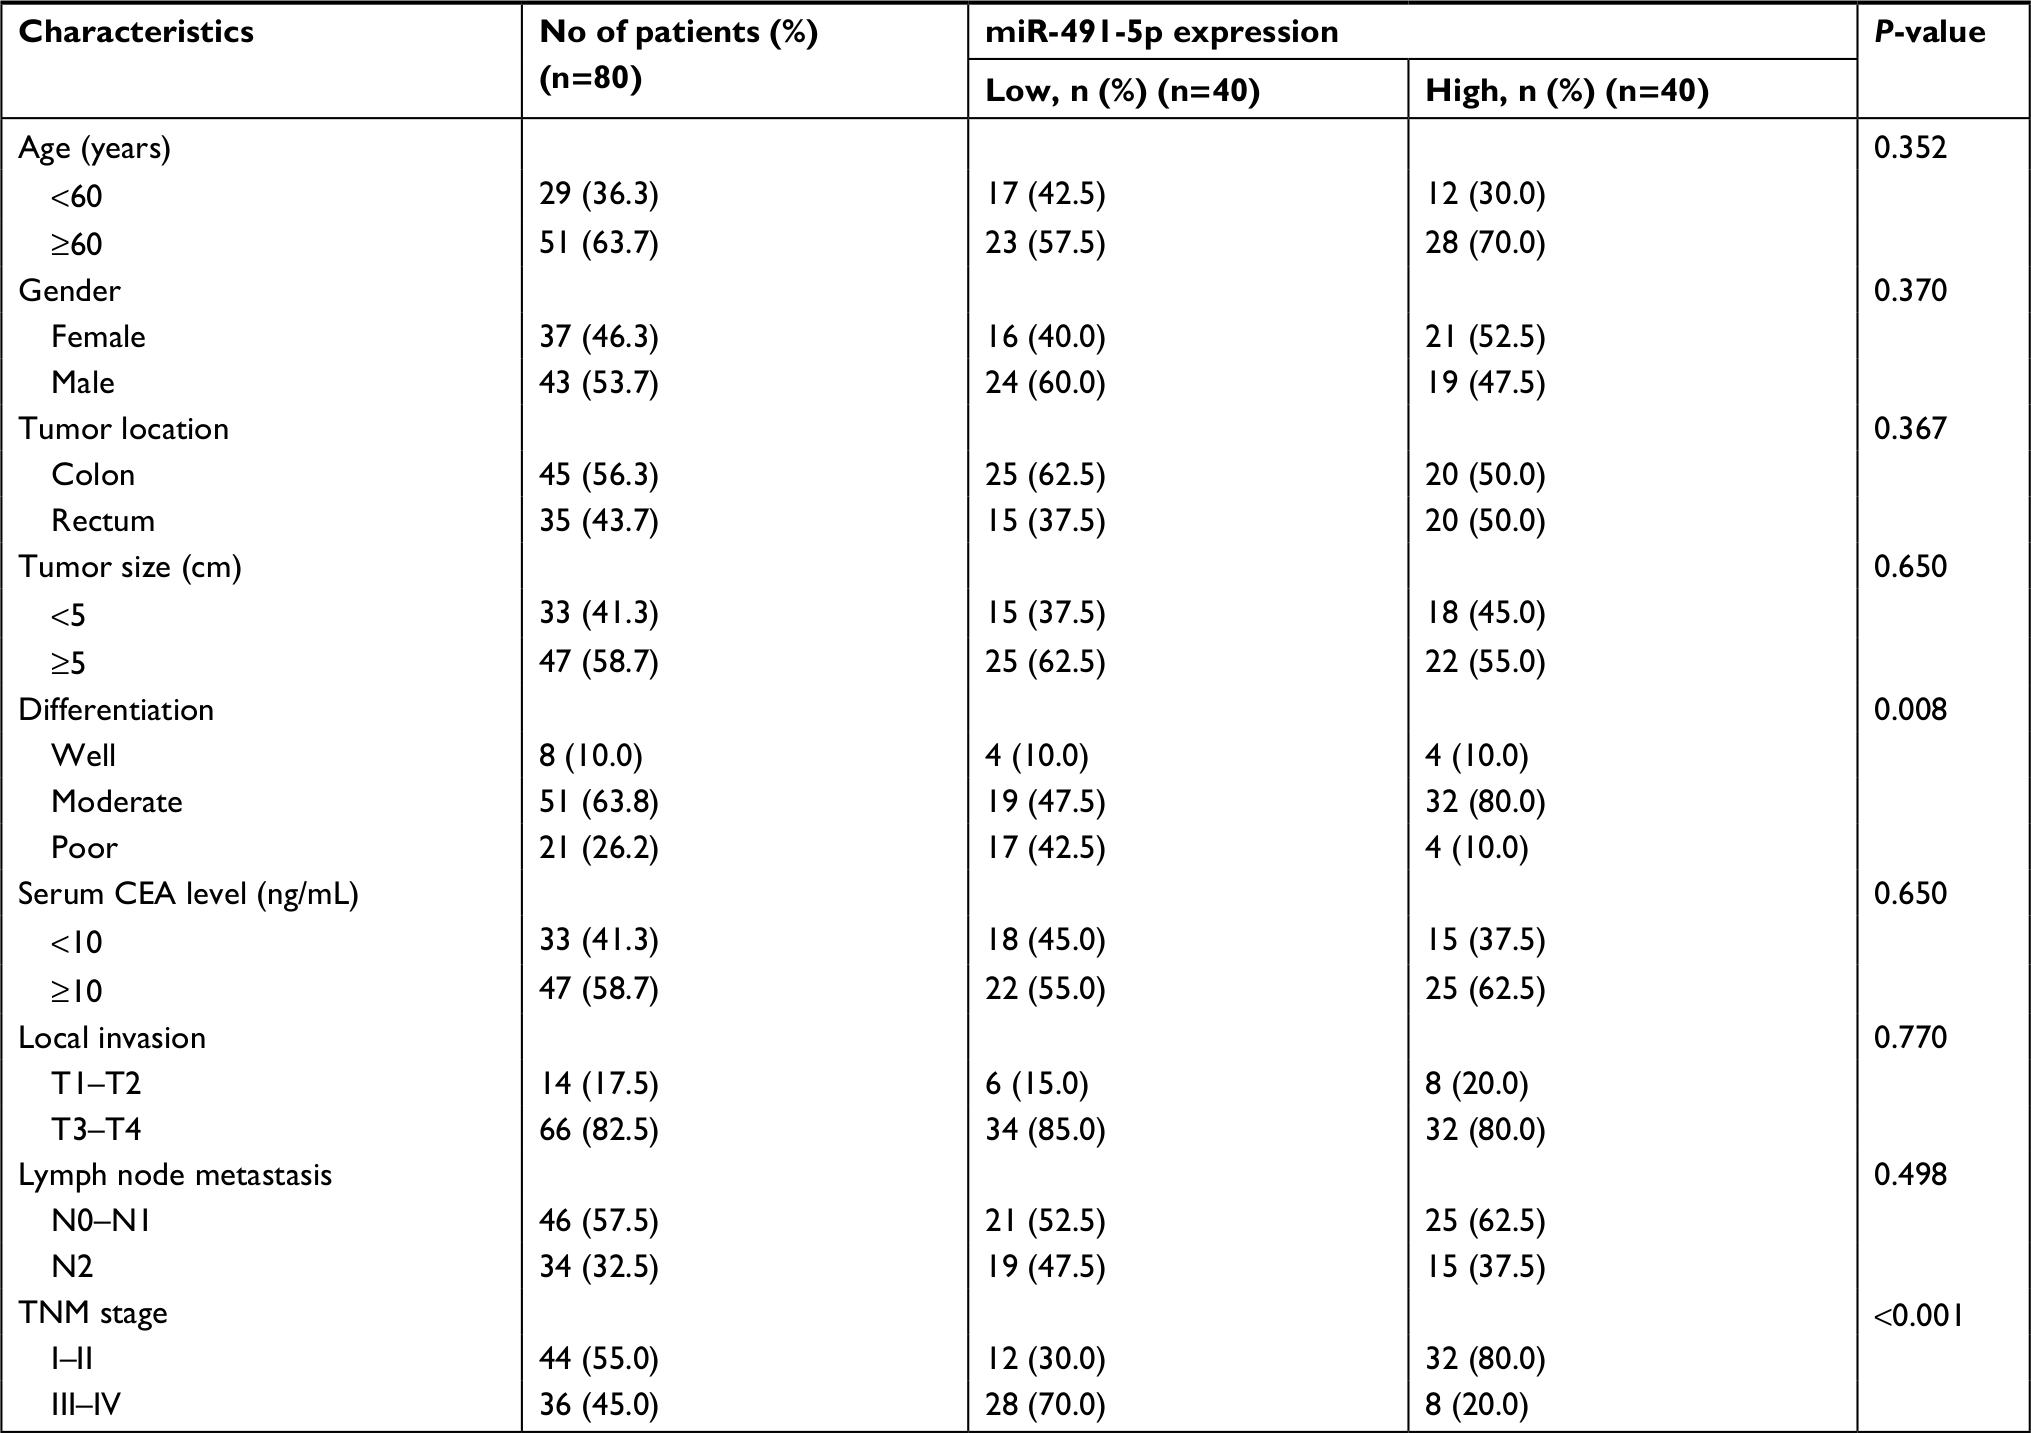 | Table 1 Correlation between miR-491-5 p expression and different clinical characteristics Abbreviation: CEA, carcinoembryonic antigen. |
Cell culture and transfection
Five human CRC cell lines (HCT116, HCT8, HT29, SW620 and SW480) and colonic mucosal epithelial cell line (FHC) were obtained from American Type Culture Collection (ATCC, Manassas, VA, USA). The cells were cultured in DMEM (KeyGen BioTECH, Nanjing, China) containing 10% FBS (HyClone™; Thermo Fisher Scientific, Waltham, MA, USA) at 37°C supplemented with 5% CO2.
Cell transfection
For transfection, 2×10⁵ HCT116 and HCT8 cells were seeded into six-well plates and transiently transfected with 20 nM of agomiR-491-5p, antagomiR-491-5p (GenePharma, Shanghai, China) and pcDNA3.1-IGF2 or agomiR-NC, antagomiR-NC and blank vector (vector) using LipofectamineTM 2000 (Thermo Fisher Scientific) in accordance with the manufacturer’s protocol.
Quantitative real-time PCR (qRT-PCR)
TRIzol Reagent (Thermo Fisher Scientific) was employed to extract total RNA from CRC tissues, cells and plasma following manufacturer’s instructions. Hairpin-itTM microRNA and U6 snRNA normalization RT-PCR quantitation kit (GenePharma) were employed to detect miR-491-5p expression levels. The IGF2 mRNA levels were assessed using PrimeScript RT reagent Kit and SYBR Premix Ex Taq (Takara, Dalian, China). All results were normalized to U6, GAPDH, and Caenorhabditis elegans miR-39 (cel-miR-39) was employed as internal control for plasma samples. The relative expression of miIR-491-5p or IGF2 mRNA was quantified using the 2–∆∆Ct method.
Western blot
Cells were lysed using lysis buffer (KeyGen BioTECH) supplemented with protease inhibitors, phosphatase inhibitor and phenylmethanesulfonyl fluoride (PMSF). Then, protein was separated using 10% SDS-PAGE gel and transferred to polyvinylidence difluoride (PVDF) membranes (EMD Millipore, Billerica, MA, USA). Then, the membranes were incubated with IGF2 and GAPDH antibody (Abcam, Cambridge, UK) overnight. The membranes were then incubated with secondary antibodies after three washes. The bands were detected using an chemiluminescent (enhanced chemiluminescence [ECL]) system (EMD Millipore).
Dual luciferase reporter assay
Two hundred ninety-three T cells were seeded into 24-well plates for 24 hours, wild-type IGF2 3′-UTR (WT-IGF2 3′-UTR) or mutant IGF2 3′-UTR (Mut-IGF2 3′-UTR) was cotransfected with agomiIR-491-5p or agomiR-NC using LipofectamineTM 2000 (Thermo Fisher Scientific) in accordance with the manufacturer’s protocol. Luciferase activity was detected using Dual-Luciferase Reporter Assay System (Promega Corporation, Fitchburg, WI, USA), and Renilla luciferase was employed for normalization.
Immunohistochemical (IHC) staining assay
Five-micrometer sections of paraffin-embedded tissues were blocked at room temperature with 5% goat serum in tris buffered saline (TBS) for 0.5 hour. Then, the sections were incubated with anti-IGF2 (ab9574; Abcam) at 4°C overnight and washed with tris buffered saline with tween 20 (TBST) (3×10 minutes) before incubation with secondary antibody (Dako Cytomation, Glostrup, Denmark) for 0.5 hour at room temperature. Finally, the sections were stained using hematoxylin and visualized under an inverted microscope at 400× (Olympus Corporation, Tokyo, Japan). The intensity of staining was scored by two independent pathologists in the following four categories: no staining =0, weak staining =1, moderate staining =2 and strong staining =3. The stain-positive was scored into the following four grades: 0 (0%), 1 (1%–33%), 2 (34%–66%) and 3 (67%–100%). The final IHC score was calculated by multiplying the percentage of positive cells with the intensity score.
Cell proliferation assay
Cell counting kit-8 (CCK-8; KeyGen BioTECH) was performed to assess the cell viability in accordance with the manufacturer’s instruction. The absorbance at 450 nm was detected using a microplate reader (Bio-Tek Instruments Inc., Winooski, VT, USA).
Colony formation assay
In order to assess colony formation, 1×10³ cells were seeded into a six-well plate and then cultured with DMEM containing 10% FBS for 2 weeks. The colonies were fixed with methanol for 15 minutes and stained using 0.1% crystal violet (Beyotime, Shanghai, China).
In vivo experiments
All animal experiments were approved by the animal care committee of the Second Affiliated Hospital of NanTong University and were performed in accordance with the animal experimental guidelines of Nantong University. 1×10⁷ HCT116 cells were subcutaneously injected into the armpit region of 24 6-week-old male BABL/c nude mice that were divided into four groups (n=6 each group), and after tumor formed (4 days after injection), 2 nmol miIR-491-5p agomir/antagomir or its negative control (agomiR-NC/antagomiR- NC) was injected into the tumors. The tumors were measured every 5 days. The volume of tumors was calculated using the following equation: V=(L×W2)/2, where L is the length and W is the width of tumor.
Statistical analyses
All experiments were performed more than three times. The data are shown as mean ± SD and analyzed by SPSS 17.0 software (SPSS Inc., Chicago, IL, USA). The Student’s t-test and one-way ANOVA were employed to estimate the differences between groups. The chi-squared test or Pearson’s Mann–Whitney U-test was used to analyze the relationship between expression of miIR-491-5p and clinicopathological features. The Kaplan–Meier method was performed to assess OS. The survival curves were compared with the log-rank test. Follow-up time was censored if the patient was lost to follow-up. Cox proportional hazards model was employed to perform multivariate analysis and calculate 95% CI. The area under the receiver operating characteristic (ROC) curve (AUC) was performed to assess the feasibility of plasma miIR-491-5p as a potential diagnostic biomarker for CRC. Values of P<0.05 were considered to be statistically significant.
Results
miR-491-5p was downregulated in CRC tissues and cell lines
To explore the role of miIR-491-5p in CRC, miIR-491-5p expression was assessed using qRT-PCR in 80 pairs of CRC tissues and matched ANTs. The relative expression of miIR-491-5p in CRC tissues was markedly downregulated in comparison with that in ANTs (Figure 1A). Moreover, we also found that miIR-491-5p was significantly decreased in CRC cell lines compared with FHC (Figure 1B).
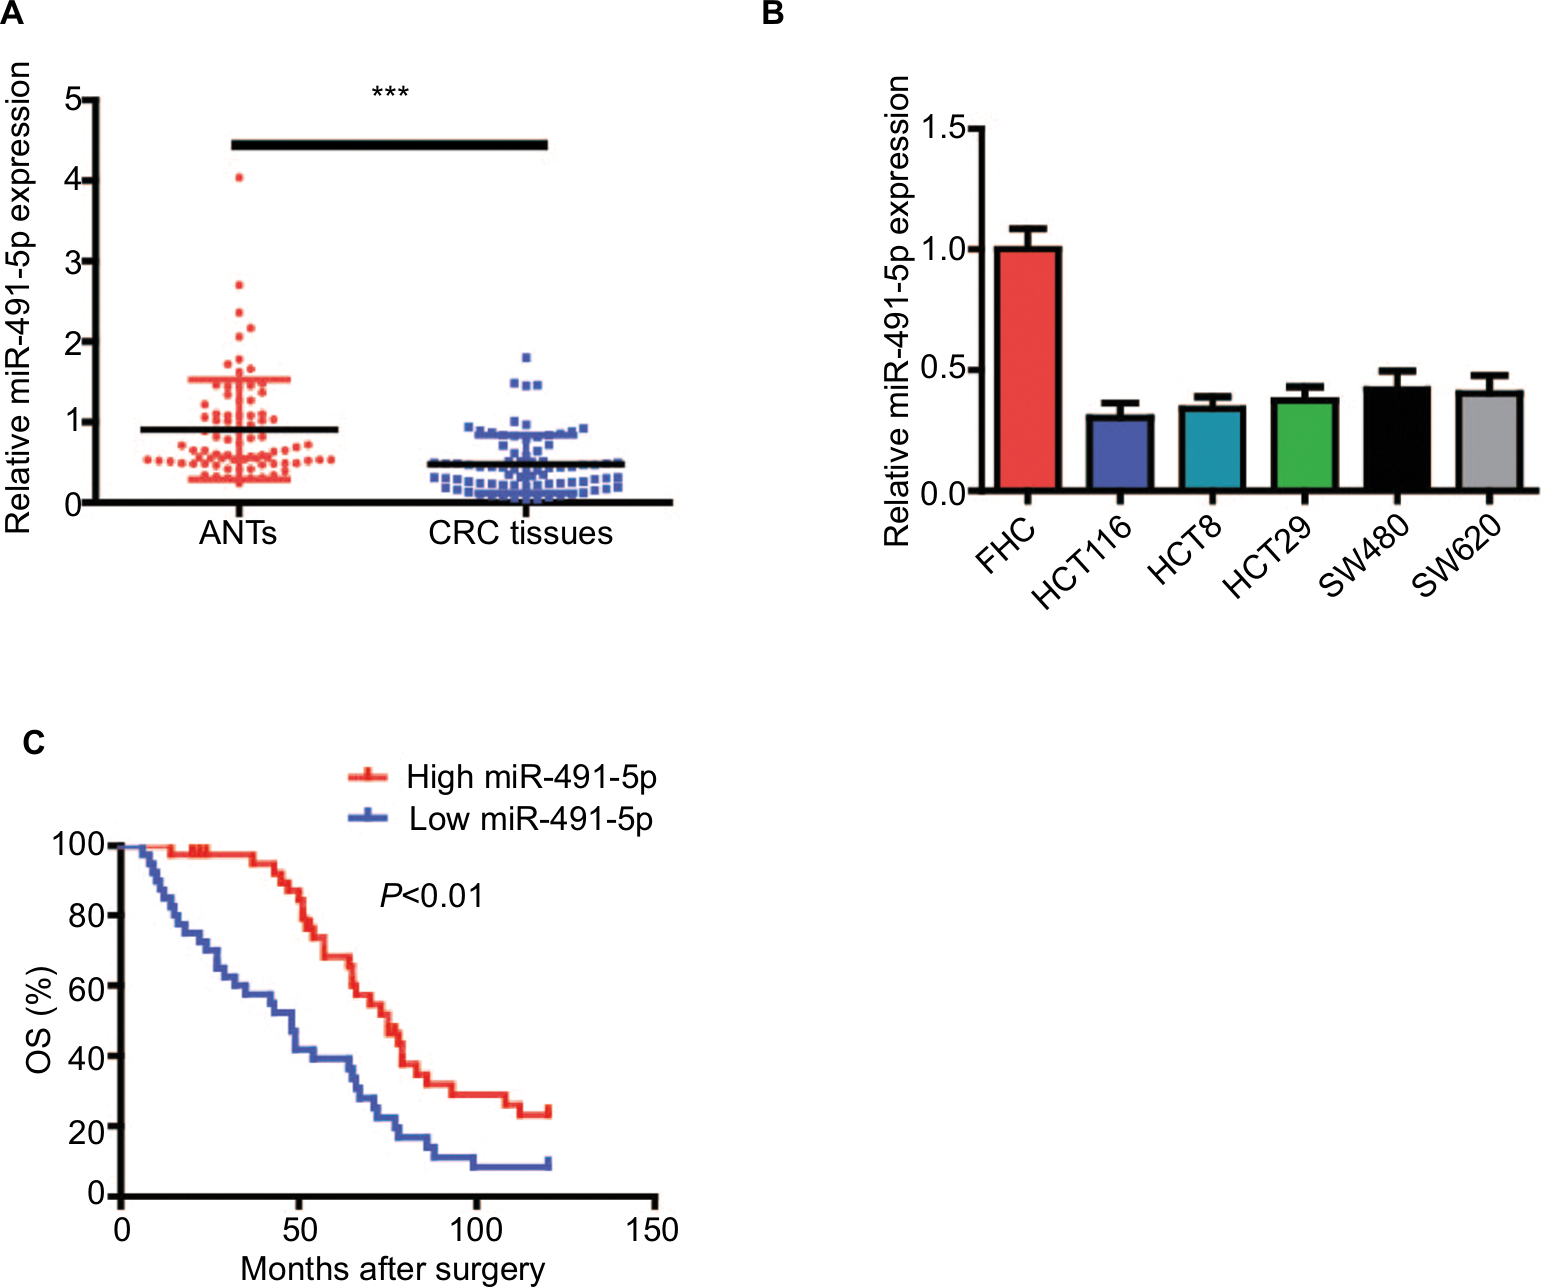 | Figure 1 miIR-491-5p was downregulated in CRC tissues and cell lines. Notes: (A) miIR-491-5p expression in CRC tissues and their matched ANTs from 80 OS patients. (B) miIR-491-5p expression in five CRC cell lines (HCT116, HCT8, HT29, SW480 and SW620) and FHC. (C) Survival analysis indicated that the CRC patients with low miIR-491-5p levels had shorter OS time when compared to those with high miIR-491-5p levels in this study. Data are shown as mean ± SD. ***P<0.001. Abbreviations: ANTs, adjacent normal tissues; CRC, colorectal cancer; OS, overall survival. |
Low expression of miR-491-5p in CRC tissues is closely associated with poor clinicopathological features and prognosis in CRC
To further explore the clinicopathological significance of miIR-491-5p levels in CRC samples, 80 CRC patients were divided into two groups (low and high miIR-491-5p groups) with the median miIR-491-5p expression levels serving as the cutoff point between the two groups. This study showed that lower levels of miIR-491-5p were markedly correlated with TNM stage and differentiation (P<0.05; Table 1). Taken together, our findings indicated that downregulated miIR-491-5p expression was closely correlated with progression of CRC.
Next, Kaplan–Meier survival curves indicated that CRC patients with low expression of miIR-491-5p showed an obviously reduced OS (Figure 1C). Moreover, a univariate analysis showed that TNM stage, differentiation and miIR-491-5p were obviously associated with OS in CRC patients (Table 2). A multivariate analysis also revealed that miIR-491-5p was an independent prognostic indicator for OS (Table 2).
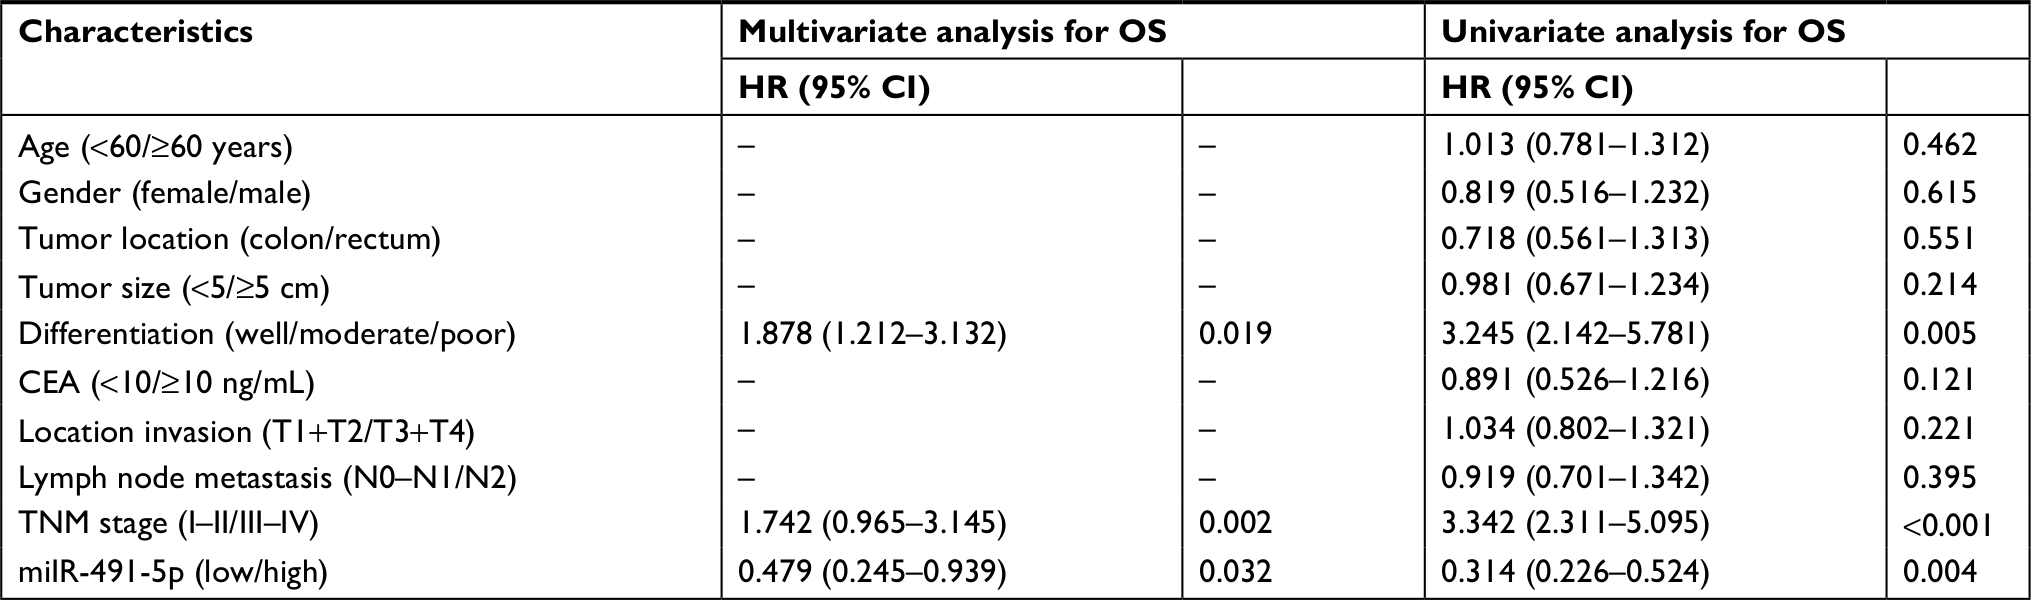 | Table 2 Univariate and multivariate analyses for OS in patients with CRC Abbreviations: CRC, colorectal cancer; OS, overall survival. |
miR-491-5p inhibited CRC cell proliferation
To investigate the potential role of miIR-491-5p in regulating CRC cell growth, first, agomiIR-491-5p was used to force miIR-491-5p expression, whereas antagomiIR-491-5p was employed to reduce the expression of miIR-491-5p, and the efficiency of transfection was assessed using qRT-PCR (Figure 2A). Then, CCK-8 and colony formation assays were performed to observe the ability of cell proliferation. CCK-8 assay indicated that overexpression of miIR-491-5p suppressed, whereas suppression of miIR-491-5p promoted CRC cell proliferation in both HCT116 and HCT8 cell lines compared to the negative control group (agomiR-NC and antagomiR-NC), respectively (Figure 2B). Additionally, we also demonstrated that miIR-491-5p inhibited cell proliferation in both cells using colony formation, in contrast, compared to the control group, knocking-down miIR-491-5p expression could promote CRC cell proliferation in both cells (Figure 2C). The abovementioned in vitro data indicated that miIR-491-5p functioned as a tumor suppressor in CRC cell lines.
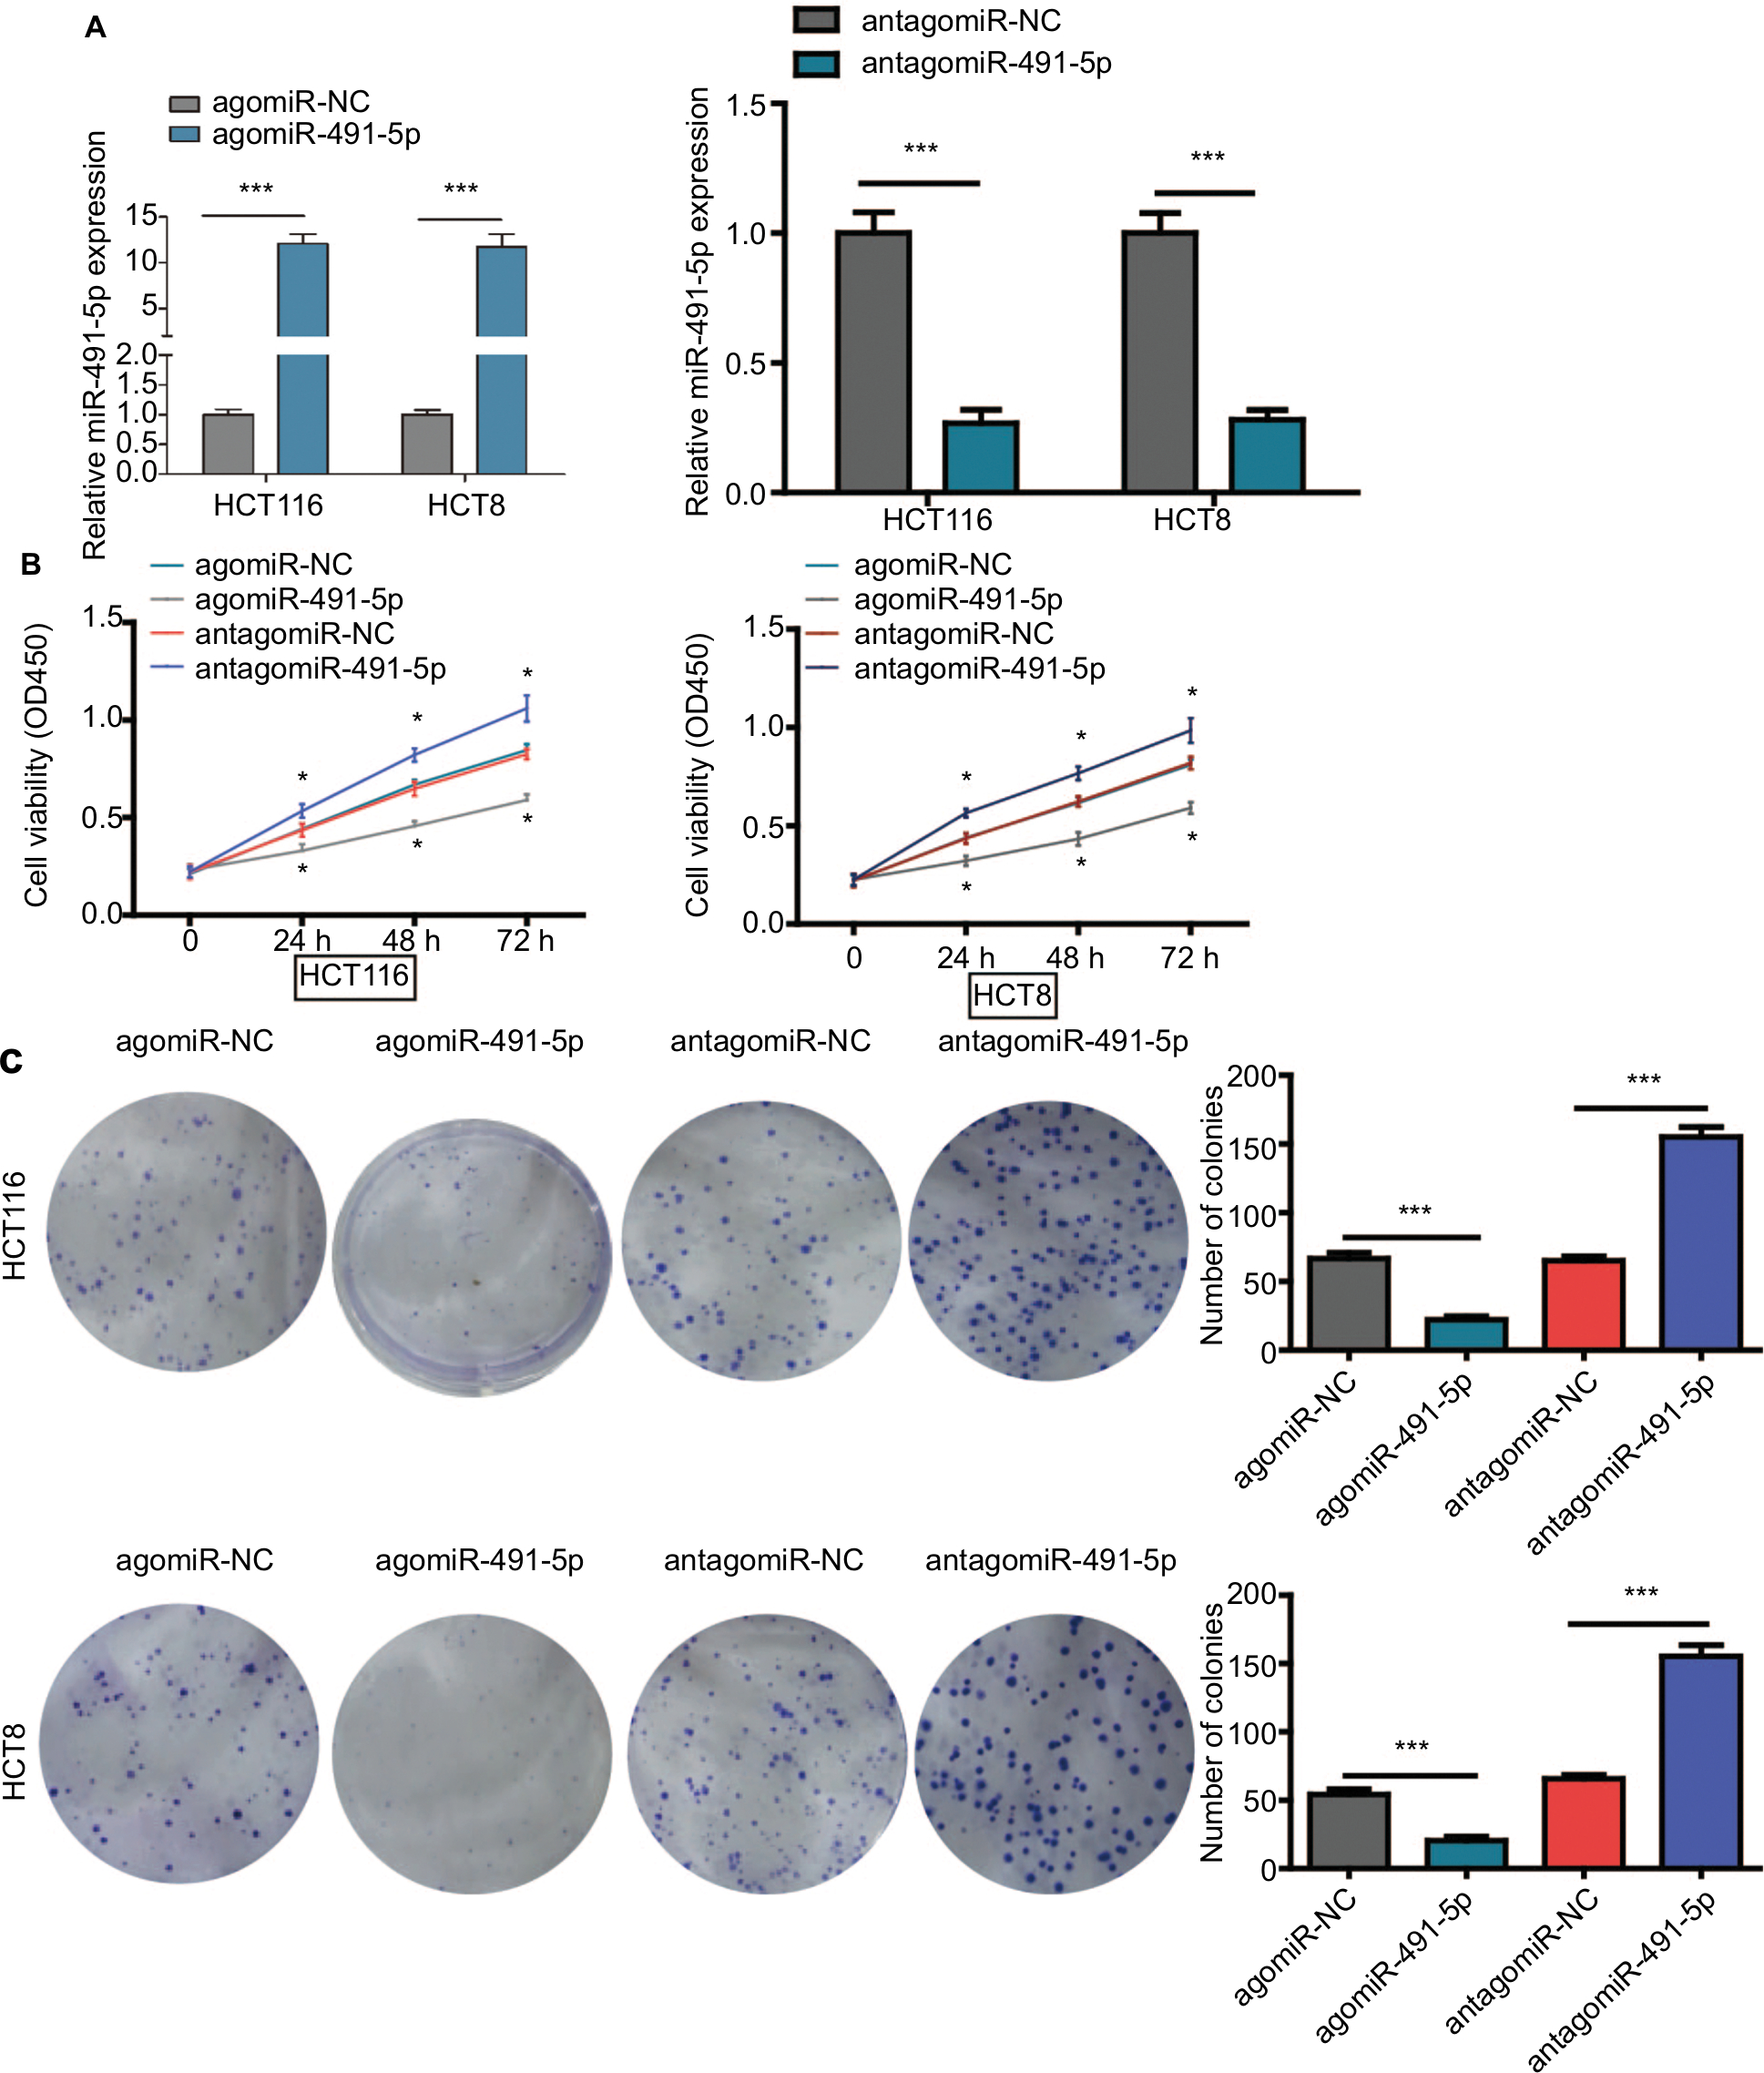 | Figure 2 miIR-491-5p inhibited CRC cell proliferation in vitro. Notes: (A) qRT-PCR analysis of miIR-491-5p expression in HCT116 and HCT8 cells after transfection of miIR-491-5p agomir/antagomir or their negative control (agomiR-NC and antagomiR-NC). (B) Cell proliferation was determined in HCT116 and HCT8 cells after transfection with miIR-491-5p agomir/antagomir or agomiR-NC/antagomiR-NC using CCK-8 assay. (C) Colony formation assay was performed to detect the ability of proliferation in HCT116 and HCT8 after transfection with miIR-491-5p agomir/antagomir or agomiR-NC/antagomiR-NC. Data are shown as mean ± SD. *P<0.05, ***P<0.001. Abbreviations: CCK-8, cell counting kit-8; CRC, colorectal cancer; NC, negative control; OS, overall survival; qRT-PCR, quantitative real-time PCR. |
miR-491-5p suppressed tumor growth in vivo
The cells were subcutaneously implanted into each nude mice in vivo, and the tumor volumes were measured every 5 days. Our results showed that miIR-491-5p overexpression obviously repressed tumorigenesis, whereas miIR-491-5p downregulation markedly promoted tumor growth (Figure 3A and B). Together, these data further demonstrated that miIR-491-5p functioned as a tumor suppressor in CRC.
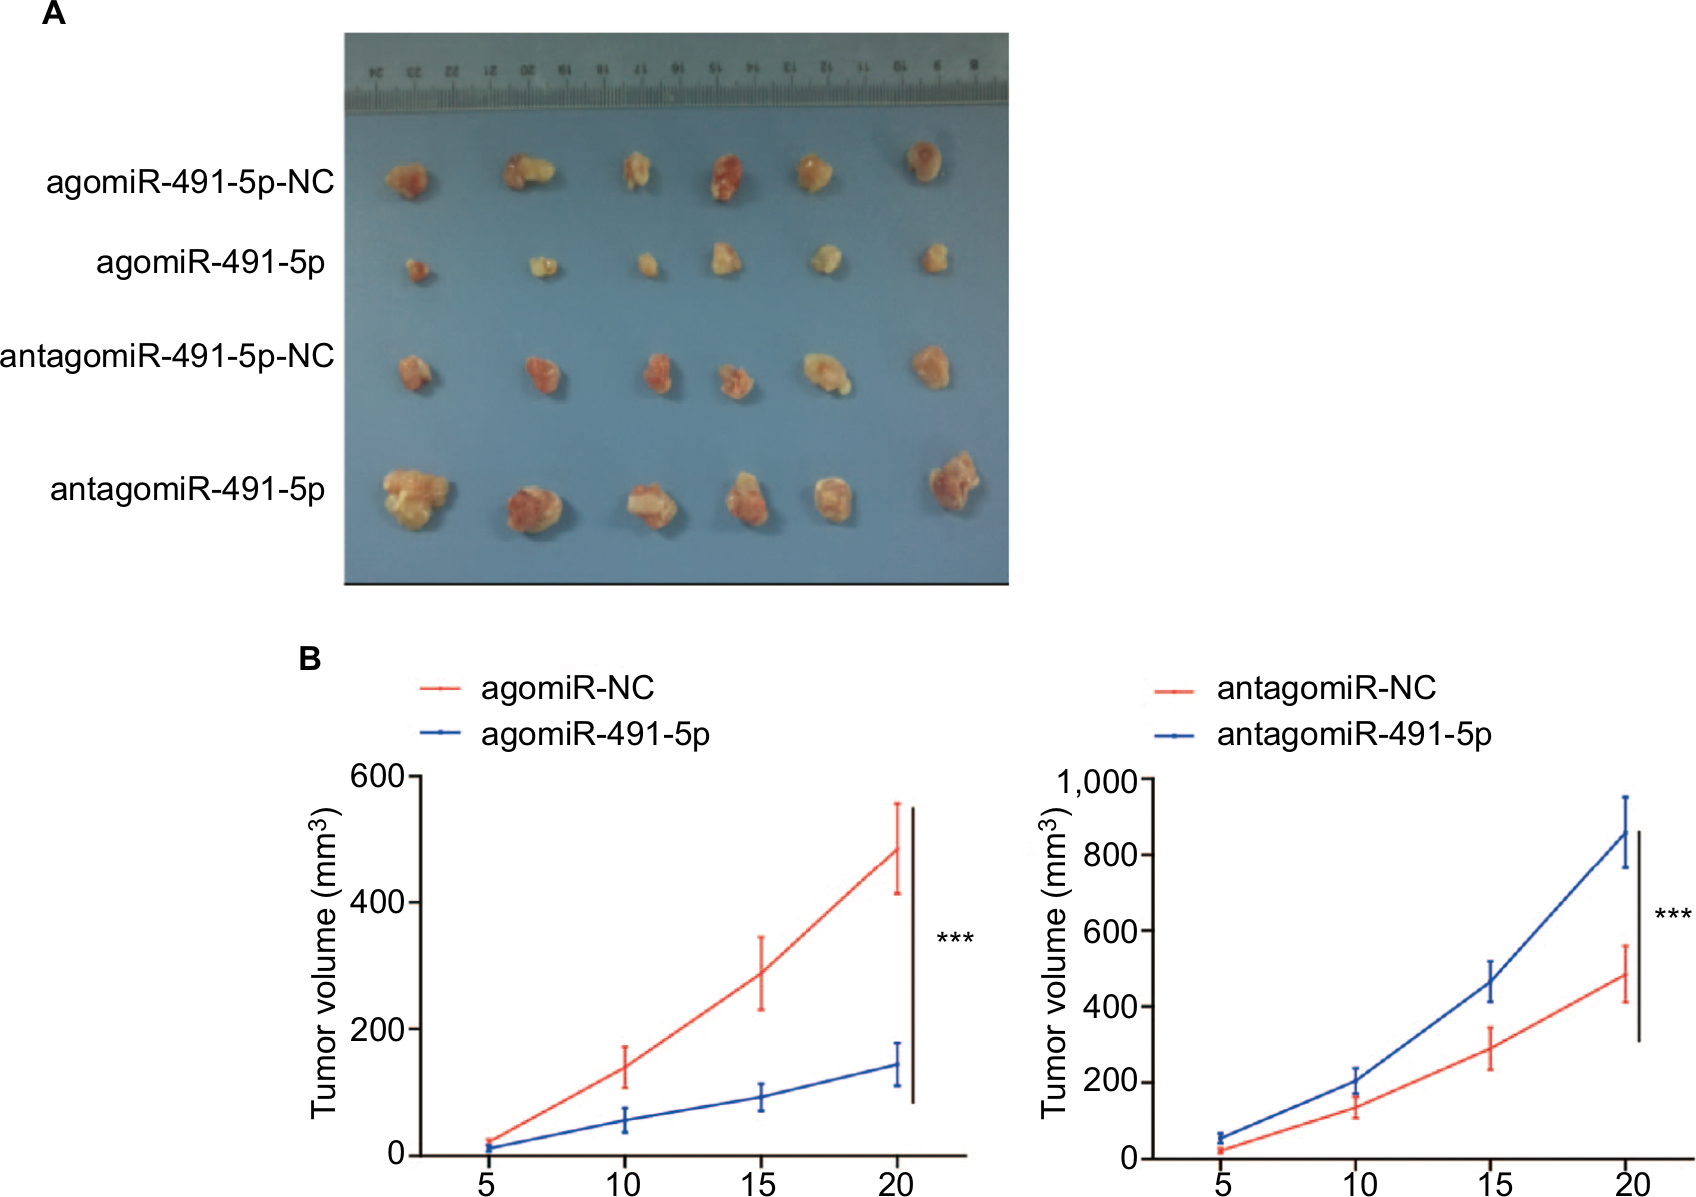 | Figure 3 miIR-491-5p suppressed OS cell growth in vivo. Notes: (A) Representative images of tumors from implanted mice. (B) Quantitative analysis of xenografted tumor volume. Data are shown as mean ± SD. ***P<0.001. Abbreviation: OS, overall survival. |
IGF2 is a direct target gene of miR-491-5p
IGF2 was selected as a potential target gene of miIR-491-5p using TargetScan and miRanda algorithms, for it was reported to promote cancer progression in various cancers. To further confirm that IGF2 is a direct target gene of miIR-491-5p, a dual-luciferase reporter assay was performed. Our results showed that miIR-491-5p overexpression significantly reduced the luciferase activity of wild-type IGF2-3′-UTR in 293 T cells, whereas it failed to repress the mutated IGF2 3′-UTR (Figure 4A). To determine whether miIR-491-5p regulated endogenous IGF2 expression in OS cell lines, mRNA and protein expression levels of IGF2 were assessed by qRT-PCR and Western blot, respectively. We found that miIR-491-5p overexpression could significantly decrease the expression of IGF2 in mRNA and protein levels, whereas miIR-491-5p downregulation could increase IGF2 expression levels both in mRNA and protein in CRC cells (Figure 4B and C).
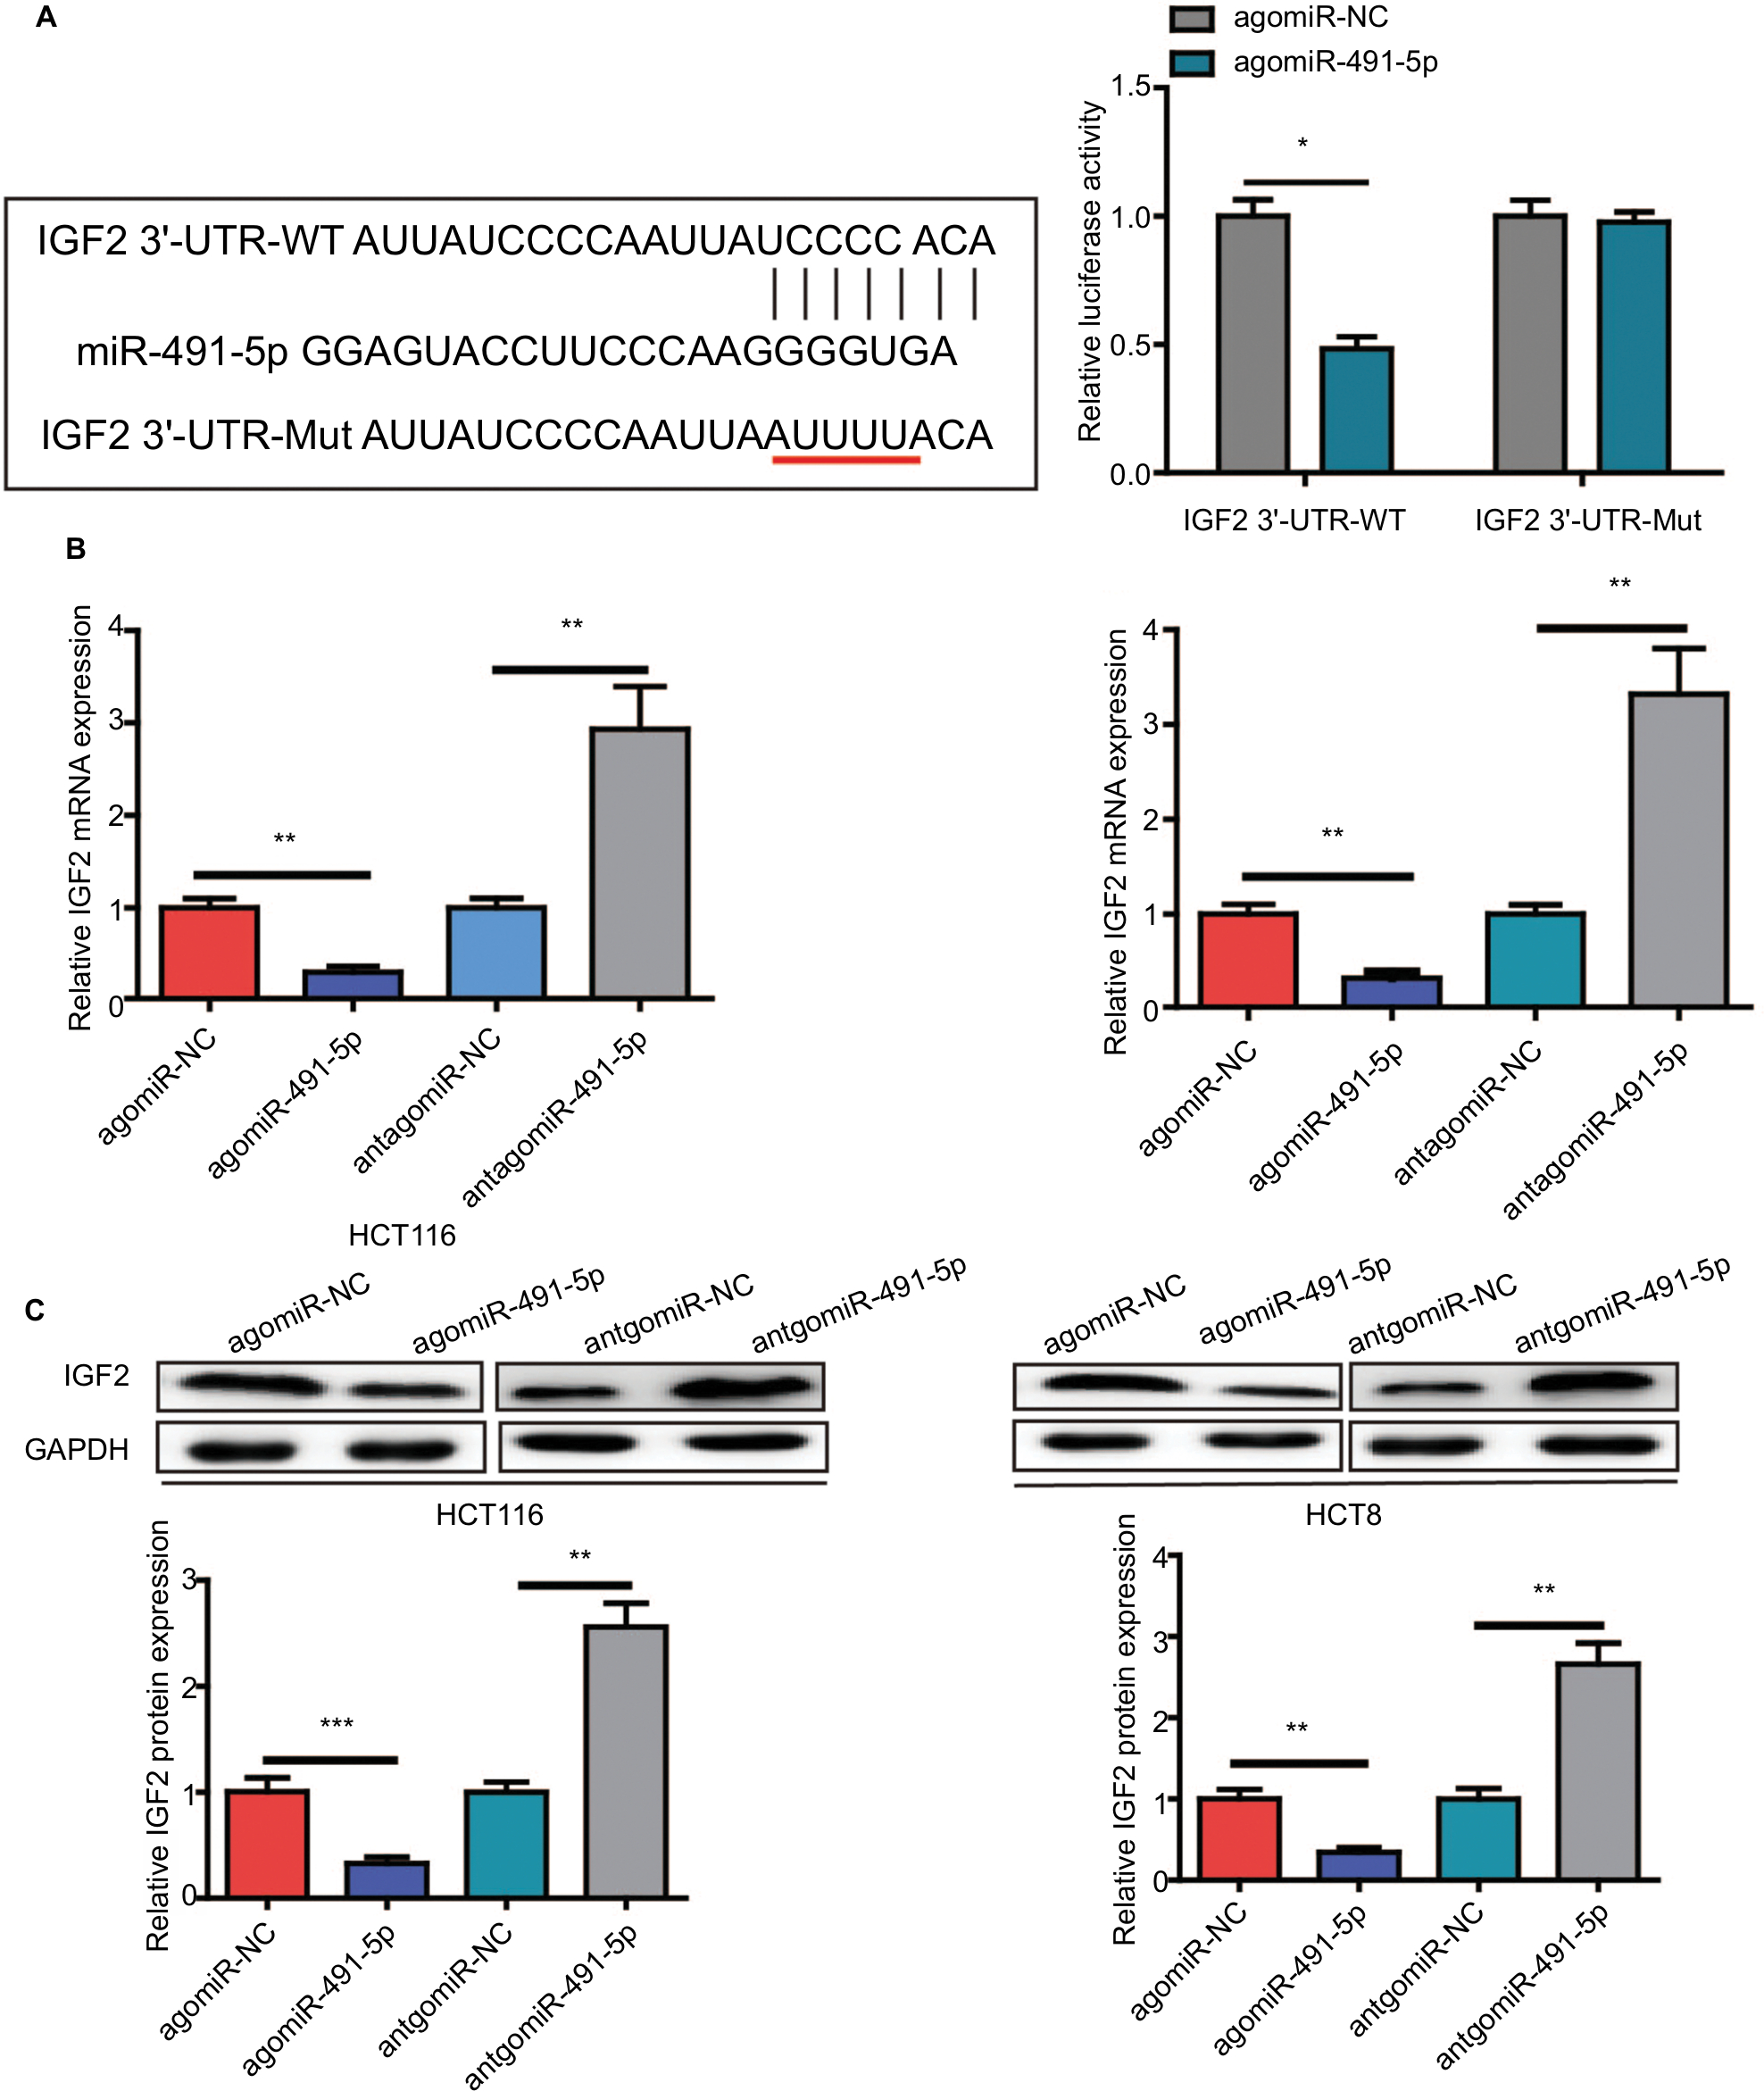 | Figure 4 IGF2 is a direct target gene of miIR-491-5p. Notes: (A) The luciferase activity was measured after cotransfecting with WT/Mut IGF2 3′-UTR plasmid and agomiIR-491-5p/agomiR-NC in 293 T cells. qRT-PCR (B) and Western blot (C) analyses were performed to detect the expression of IGF2 in HCT116 and HCT8 after transfection with agomiIR-491-5p and antagomiIR-491-5p or agomiR-NC and antagomiR-NC. Data are shown as mean ± SD of three independent experiments. *P<0.05, **P<0.01, and ***P<0.001. Abbreviations: Mut, mutant; NC, negative control; qRT-PCR, quantitative real-time PCR; WT, wild type. |
IGF2 overexpression reverses inhibitory effects of miR-491-5p in CRC
To further prove the functional connection between miIR-491-5p and IGF2, we cotransfected with IGF2 expression plasmid or blank vector (vector) and agomiIR-491-5p in HCT116 and HCT8 cell lines. The expression of IGF2 was markedly increased after cotransfection with agomiIR-491-5p and pcDNA3.1-IGF2 (Figure 5A). Overexpression of IGF2 could partially abrogate the inhibitory effect on cell proliferation caused by agomiR-491-5p (Figure 5B and C). Based on the abovementioned results, we could conclude that miIR-491-5p inhibits CRC cell growth via targeting IGF2.
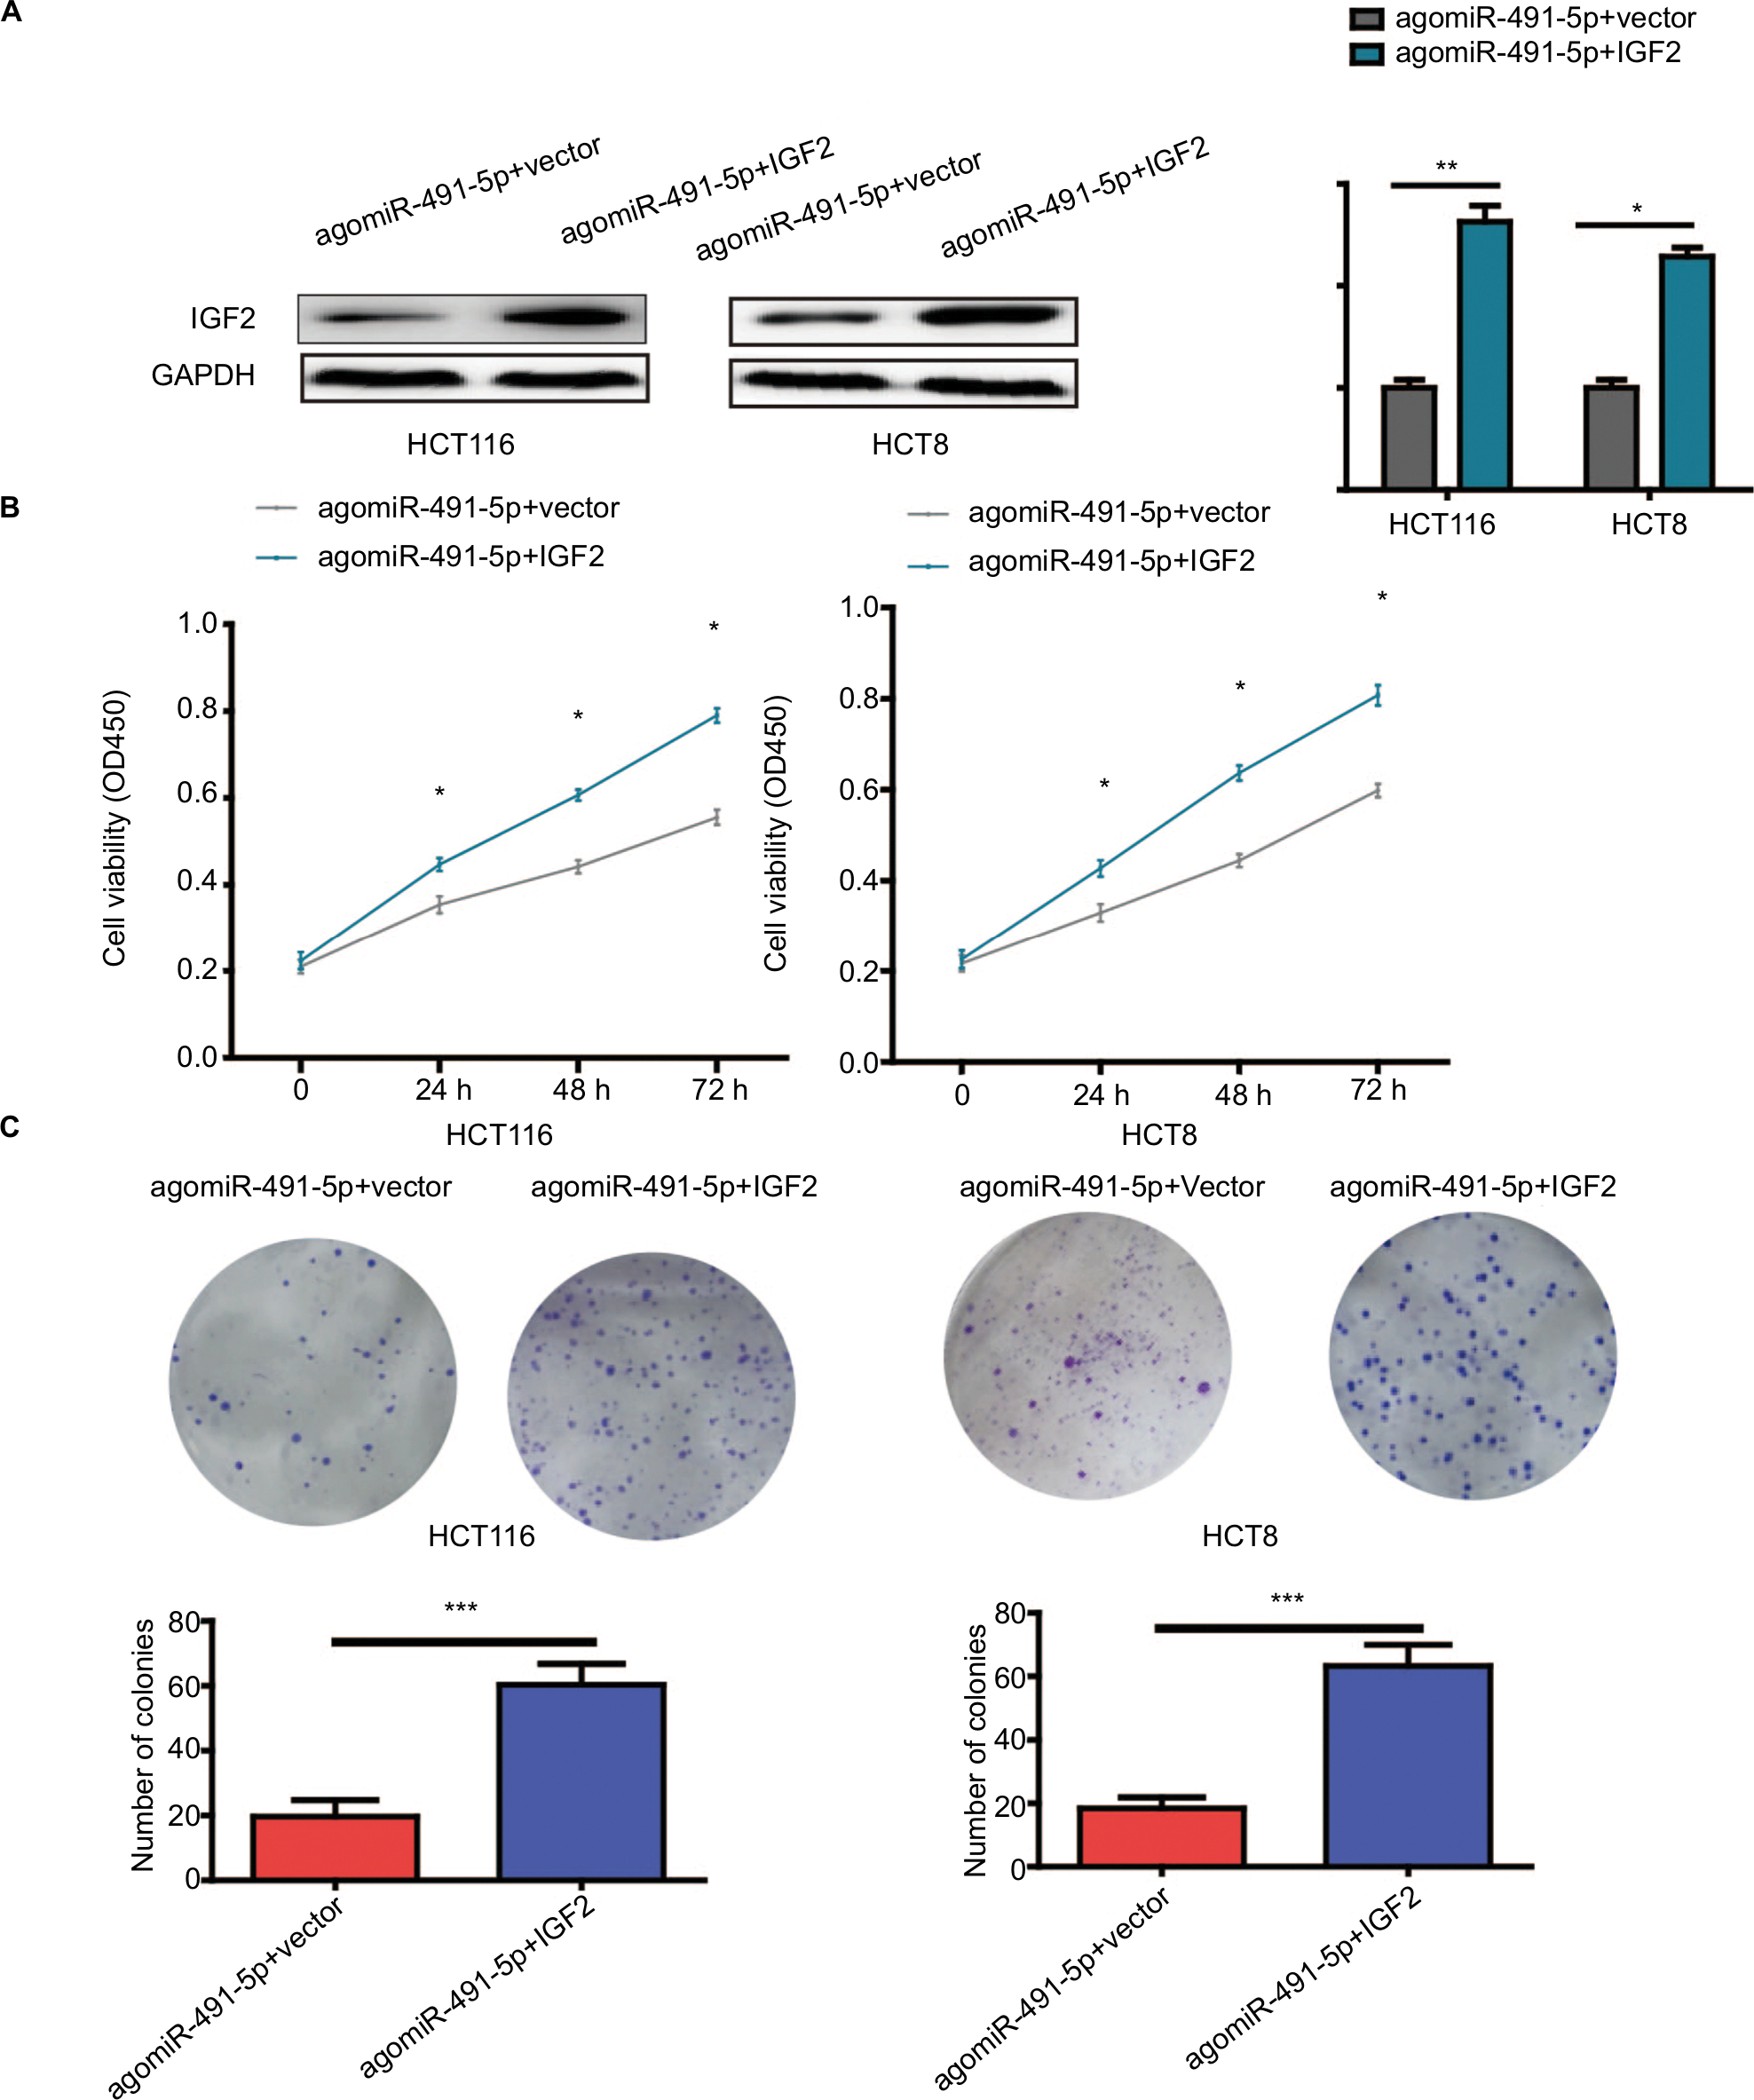 | Figure 5 Overexpression of IGF2 reverses the effects induced by miIR-491-5p overexpression in HCT116 and HCT8 cells. Notes: (A) IGF2 protein expression was detected in HCT116 and HCT8 cells cotransfected with agomiIR-491-5p and IGF2 expression plasmid or blank vector (vector). (B and C) Cell proliferation was determined in HCT116 and HCT8 cells cotransfected with agomiIR-491-5p and IGF2 expression plasmid or blank vector (vector). Data are shown as mean ± SD of three independent experiments. *P<0.05, **P<0.01, and ***P<0.001. |
The relationship between miR-491-5p and IGF2 in CRC tissues
To investigate the relationship between miIR-491-5p and IGF2, we also analyzed IGF2 protein expression in CRC tissues with different miIR-491-5p levels, the low vs high miIR-491-5p expression was defined as the median value of miIR-491-5p level according to the cohort of tested CRC patients. As shown in Figure 6A and B, the levels of IGF2 protein expression in low-miIR-491-5p CRC tissues were obviously higher than those of high-miIR-491-5p CRC tissues. Meanwhile, a significant negative correlation was found between IGF2 protein levels and miIR-491-5p expression levels in CRC tissues (Figure 6C). Additionally, the expression of IGF2 mRNA was also elevated in CRC tissues than that in ANTs, and an inverse correlation was found between IGF2 mRNA and miIR-491-5p expression levels in CRC tissues (Figure 6D and E).
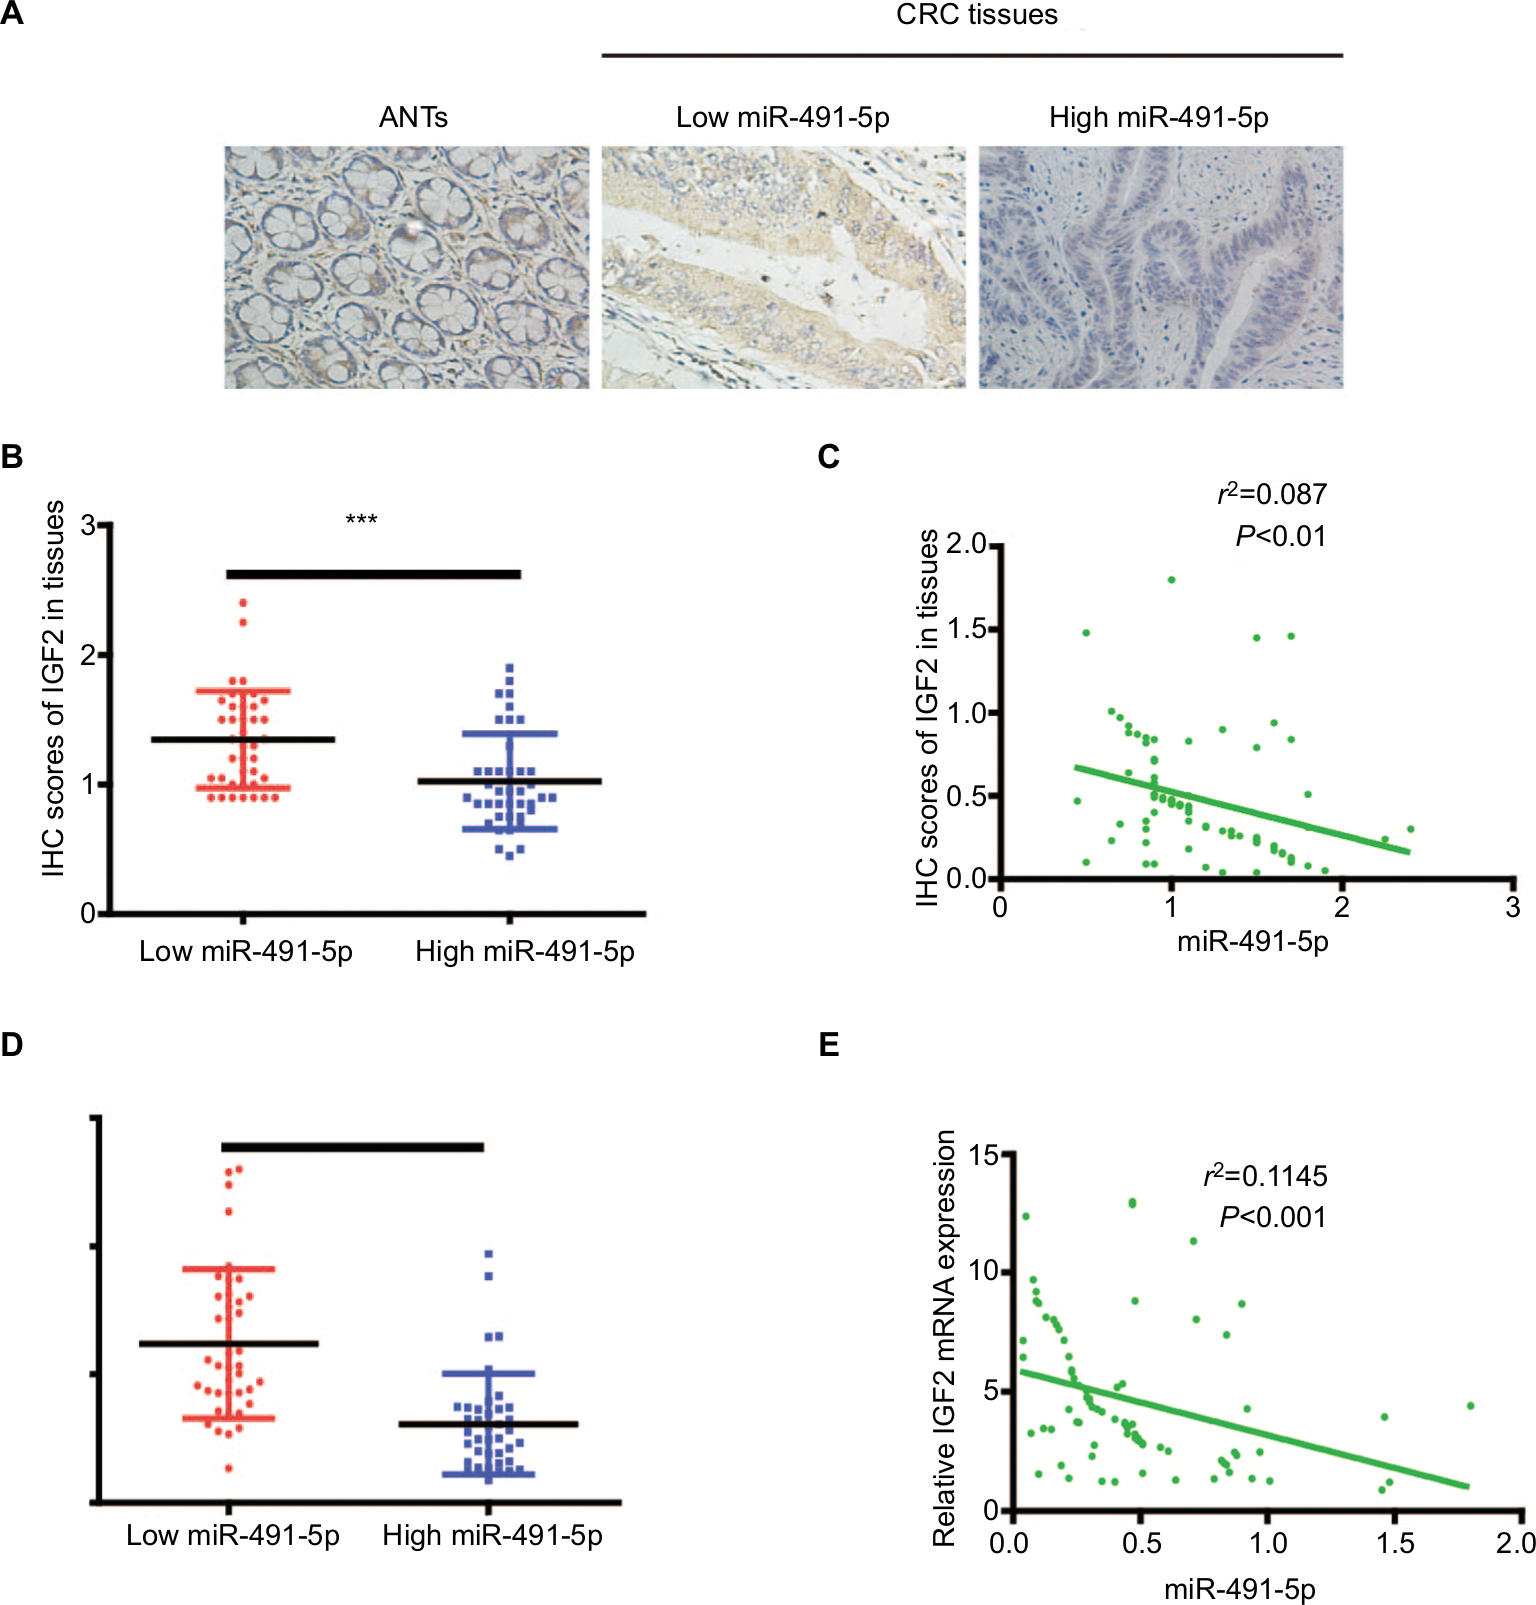 | Figure 6 The relationship between miIR-491-5p and IGF2 in CRC tissues. Notes: (A) Representative IHC staining (×200) for IGF2 from CRC tissues and matched ANTs. (B) IHC scores of IGF2 in low miIR-491-5p CRC tissues were markedly higher than those in high miIR-491-5p CRC tissues. (C) The correlation between the levels of miIR-491-5p expression and IHC scores of IGF2 in CRC tissues. (D) qRT-PCR was employed to measure the expression of IGF2 mRNA in 80 CRC specimens and corresponding ANTs. (E) The correlation analysis was performed between IGF2 mRNA and miIR-491-5p expression levels. Data are shown as mean ± SD.***P<0.001. Abbreviations: ANTs, adjacent normal tissues; CRC, colorectal cancer; IHC, immunohistochemical; NC, negative control; qRT-PCR, quantitative real-time PCR. |
miR-491-5p might be a potential diagnostic biomarker in CRC
To determine whether plasma miIR-491-5p could be a screening biomarker for CRC, we compared plasma miIR-491-5p levels between healthy volunteers and patients with CRC. Our data showed that plasma miIR-491-5p levels in the CRC patient group were significantly lower than the levels in the healthy controls group (Figure 7A). A ROC curve was performed to construct for distinguishing healthy controls from patients with CRC. The results showed that the AUC was up to 0.810 (95% CI, 0.733–0.877; P<0.001). In the cutoff values from ROC curves shown in Figure 7B, when the cutoff value of plasma miIR-491-5p was –0.205, the sensitivity was 90.0%, and the specificity was 67.5%.
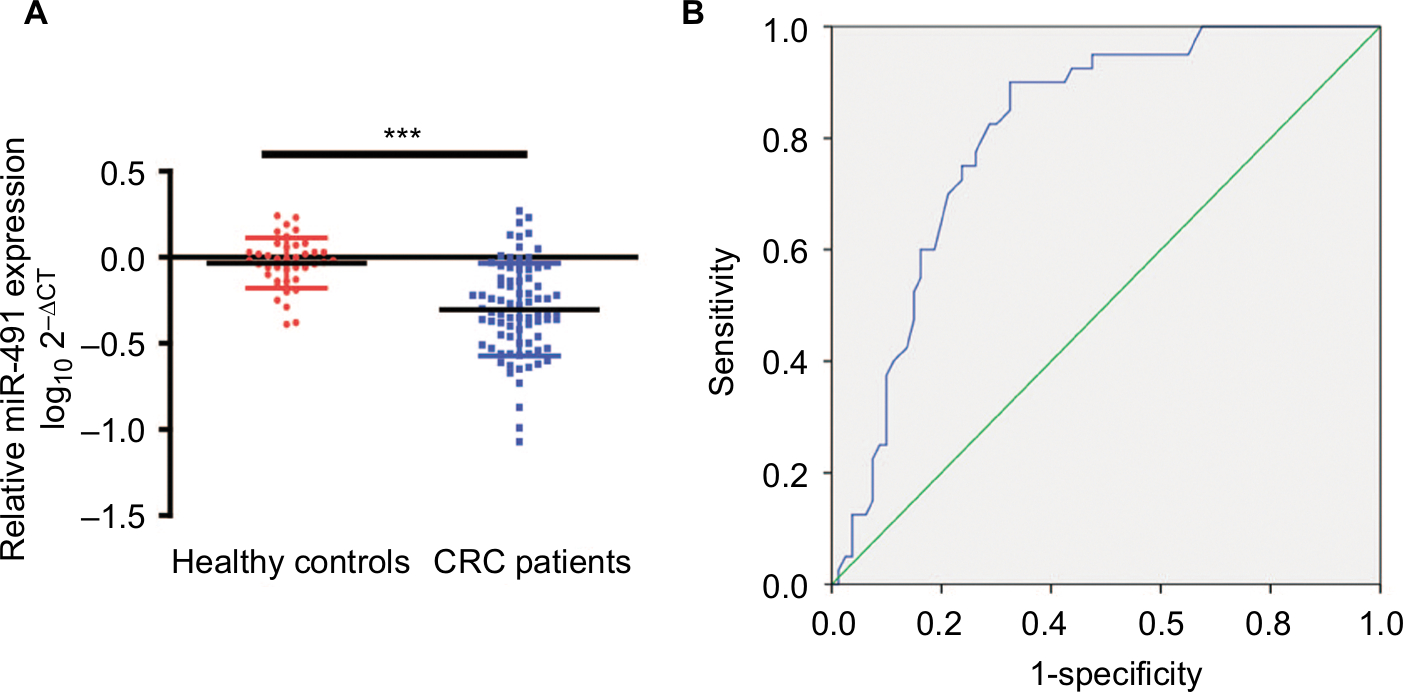 | Figure 7 Plasma levels of miIR-491-5p were downregulated in CRC patients. Notes: (A) The relative levels of miIR-491-5p in patients with CRC and healthy controls. The data are shown as log10 and normalized to cel-miR-39. (B) ROC curves for 491-5 p in 80 CRC patients and 40 healthy controls. Data are shown as mean ± SD. ***P<0.001. Abbreviations: CRC, colorectal cancer; ROC, receiver operating characteristic. |
Discussion
Accumulating studies showed that abnormally expressed miRNAs promoted or suppressed tumor development and progression, including CRC.12,13 Cao et al14 reported that miR-381 was increased in gastric cancer tissues and cells, and downregulation of miR-381 was correlated with adverse clinicopathological features and poor prognosis. Liu et al15 reported that miR-29c was downregulated in lung adenocarcinoma (LAD), and downregulated miR-29c was found to be poor prognosis in IIIA-N2 LAD. In this study, we found that miIR-491-5p was markedly downregulated in CRC tissues and cell lines. Moreover, we found that low expression of miIR-491-5p was closely associated with TNM stage and differentiation. These data preliminary showed that miRNAs functioned as a tumor suppressor in CRC.
Xu et al16 reported that miIR-491-5p inhibited cell proliferation and migration by targeting platelet-derived growth factor receptor α (PDGFRA). Hui et al17 reported that miIR-491-5p was obviously decreased in ERa-positive breast cancer tissues and cell lines, and overexpression of miIR-491-5p inhibited breast cancer cell proliferation via induction of cell cycle G1 arrest by targeting JMJD2B. Here, to further explore biological function of miIR-491-5p in CRC, in vitro and in vivo experiments were performed. Our results showed that overexpression of miIR-491-5p could significantly inhibit CRC cell growth, whereas downregulation of miIR-491-5p could markedly promote CRC cell growth, which was verified using CCK-8, colony formation and subcutaneous tumor growth assays.
It is well accepted that miRNAs exert their function primarily based on their target genes.18–20 To investigate the potential mechanism of miIR-491-5p in CRC progression, bioinformatics analysis was employed to identify potential target gene of miIR-491-5p, and IGF2 was selected as a putative miIR-491-5p target gene. Yang et al21 observed that the inhibitory effects of miR-615-5p on ESCC cell mobility were partially abrogated by the upregulation of IGF2 expression. Gebeshuber et al22 revealed that miR-100 is a regulator of the IGF2/mTOR signaling pathway and a promising target for therapeutic approaches in breast. Next, we confirmed that IGF2 was a direct target gene of miIR-491-5p using a luciferase reporter assay. miIR-491-5p overexpression could significantly reduce IGF2 expression both on protein and mRNA levels. Moreover, we found that IGF2 upregulation could reverse the tumor-suppressive effects of miIR-491-5p on CRC cells. Collectively, our findings revealed that miIR-491-5p exerted its antitumor effect on CRC cells by targeting IGF2.
Luo et al23 reported that miRNAs play key roles in oncogenesis, and the dysregulated expression of miRNAs might be indicative of the presence of CRC. In this study, we tested the diagnostic value of plasma miIR-491-5p in differentiating people without CRC from patients with CRC. We observed that plasma miIR-491-5p levels from CRC patients were obviously lower than those from healthy controls. These results revealed that plasma miIR-491-5p had a potential diagnostic value in CRC.
Conclusion
This study showed that miIR-491-5p was downregulated in CRC tissues and cells. Moreover, low miIR-491-5p expression was closely associated with the differentiation, TNM stage and poor OS. Moreover, we demonstrated that miIR-491-5p inhibited CRC cell growth by targeting IGF2. Finally, we found that the expression of plasma miIR-491-5p was decreased in CRC patients in comparison with that in healthy controls. These data may imply that miIR-491-5p might be a potential biomarker and therapeutic target for CRC.
Acknowledgment
Lei Lu and Ming Cai are co-first authors for this study.
Disclosure
The authors report no conflicts of interest in this work.
References
Siegel R, Naishadham D, Jemal A, Statistics C. Cancer statistics, 2013. CA Cancer J Clin. 2013;63(1):11–30. | ||
Bagga S, Bracht J, Hunter S, et al. Regulation by let-7 and lin-4 miRNAs results in target mRNA degradation. Cell. 2005;122(4):553–563. | ||
Bartel DP. MicroRNAs: target recognition and regulatory functions. Cell. 2009;136(2):215–233. | ||
White NM, Bao TT, Grigull J, et al. miRNA profiling for clear cell renal cell carcinoma: biomarker discovery and identification of potential controls and consequences of miRNA dysregulation. J Urol. 2011;186(3):1077–1083. | ||
Nelson KM, Weiss GJ. MicroRNAs and cancer: past, present, and potential future. Mol Cancer Ther. 2008;7(12):3655–3660. | ||
Hwang HW, Mendell JT. MicroRNAs in cell proliferation, cell death, and tumorigenesis. Br J Cancer. 2006;94(6):776–780. | ||
Hui Z, Yiling C, Wenting Y, Xuqun H, Chuanyi Z, Hui L. miR-491-5p functions as a tumor suppressor by targeting JMJD2B in ERα-positive breast cancer. FEBS Lett. 2015;589(7):812–821. | ||
Sun R, Liu Z, Tong D, et al. miR-491-5p, mediated by Foxi1, functions as a tumor suppressor by targeting Wnt3a/β-catenin signaling in the development of gastric cancer. Cell Death Dis. 2017;8(3):e2714. | ||
Livingstone C. IGF2 and cancer. Endocr Relat Cancer. 2013;20(6): R321–R339. | ||
Li G, Luo W, Abdalla BA, et al. miRNA-223 upregulated by MYOD inhibits myoblast proliferation by repressing IGF2 and facilitates myoblast differentiation by inhibiting ZEB1. Cell Death Dis. 2017;8(10):e3094. | ||
Yang B, Xie R, Wu SN, Gao CC, Yang XZ, Zhou JF. MicroRNA-615-5p targets insulin-like growth factor 2 and exerts tumor-suppressing functions in human esophageal squamous cell carcinoma. Oncol Rep. 2018;39(1):255–263. | ||
Hua KT, Hong JB, Sheen YS, et al. miR-519d promotes melanoma progression by downregulating EphA4. Cancer Res. 2018;78(1):216–229. | ||
Zhao HJ, Ren LL, Wang ZH, et al. MiR-194 deregulation contributes to colorectal carcinogenesis via targeting AKT2 pathway. Theranostics. 2014;4(12):1193–1208. | ||
Cao Q, Liu F, Ji K, et al. MicroRNA-381 inhibits the metastasis of gastric cancer by targeting TMEM16A expression. J Exp Clin Cancer Res. 2017;36(1):29. | ||
Liu L, Bi N, Wu L, et al. MicroRNA-29c functions as a tumor suppressor by targeting VEGFA in lung adenocarcinoma. Mol Cancer. 2017;16(1):50. | ||
Xu Y, Hou R, Lu Q, et al. MiR-491-5p negatively regulates cell proliferation and motility by targeting PDGFRA in prostate cancer. Am J Cancer Res. 2017;7(12):2545–2553. | ||
Hui Z, Yiling C, Wenting Y, Xuqun H, Chuanyi Z, Hui L. miR-491-5p functions as a tumor suppressor by targeting JMJD2B in ERα-positive breast cancer. FEBS Lett. 2015;589(7):812–821. | ||
Farazi TA, Spitzer JI, Morozov P, Tuschl T. miRNAs in human cancer. J Pathol. 2011;223(2):102–115. | ||
Guo H, Ingolia NT, Weissman JS, Bartel DP. Mammalian microRNAs predominantly act to decrease target mRNA levels. Nature. 2010;466(7308):835–840. | ||
Mcmanus MT. MicroRNAs and cancer. Semin Cancer Biol. 2003;13(4):253–258. | ||
Yang B, Xie R, Wu SN, Gao CC, Yang XZ, Zhou JF. MicroRNA-615-5p targets insulin-like growth factor 2 and exerts tumor-suppressing functions in human esophageal squamous cell carcinoma. Oncol Rep. 2018;39(1):255–263. | ||
Gebeshuber CA, Martinez J. miR-100 suppresses IGF2 and inhibits breast tumorigenesis by interfering with proliferation and survival signaling. Oncogene. 2013;32(27):3306–3310. | ||
Luo X, Burwinkel B, Tao S, Brenner H. MicroRNA signatures: novel biomarker for colorectal cancer? Cancer Epidemiol Biomarkers & Prev. 2011;20(7):1272–1286. |
 © 2019 The Author(s). This work is published and licensed by Dove Medical Press Limited. The
full terms of this license are available at https://www.dovepress.com/terms
and incorporate the Creative Commons Attribution
- Non Commercial (unported, 3.0) License.
By accessing the work you hereby accept the Terms. Non-commercial uses of the work are permitted
without any further permission from Dove Medical Press Limited, provided the work is properly
attributed. For permission for commercial use of this work, please see paragraphs 4.2 and 5 of our Terms.
© 2019 The Author(s). This work is published and licensed by Dove Medical Press Limited. The
full terms of this license are available at https://www.dovepress.com/terms
and incorporate the Creative Commons Attribution
- Non Commercial (unported, 3.0) License.
By accessing the work you hereby accept the Terms. Non-commercial uses of the work are permitted
without any further permission from Dove Medical Press Limited, provided the work is properly
attributed. For permission for commercial use of this work, please see paragraphs 4.2 and 5 of our Terms.