Back to Journals » Cancer Management and Research » Volume 12
miR-489-3p Inhibits Prostate Cancer Progression by Targeting DLX1
Authors Bai P, Li W, Wan Z, Xiao Y, Xiao W ![]() , Wang X, Wu Z, Zhang K
, Wang X, Wu Z, Zhang K ![]() , Wang Y, Chen B, Xing J, Wang T
, Wang Y, Chen B, Xing J, Wang T
Received 25 November 2019
Accepted for publication 31 March 2020
Published 23 April 2020 Volume 2020:12 Pages 2719—2729
DOI https://doi.org/10.2147/CMAR.S239796
Checked for plagiarism Yes
Review by Single anonymous peer review
Peer reviewer comments 4
Editor who approved publication: Professor Seema Singh
This paper has been retracted.
Peide Bai, 1 Wei Li, 1 Zhenghua Wan, 2 Yujuan Xiao, 3 Wen Xiao, 1 Xuegang Wang, 1 Zhun Wu, 1 Kaiyan Zhang, 1 Yongfeng Wang, 1 Bin Chen, 1 Jinchun Xing, 1 Tao Wang 1
1The Key Laboratory of Urinary Tract Tumors and Calculi, Department of Urology Surgery, The First Affiliated Hospital, School of Medicine, Xiamen University, Xiamen 361003, People’s Republic of China; 2Xiang’an Branch, The First Affiliated Hospital, School of Medicine, Xiamen University, Xiamen 361101, People’s Republic of China; 3Department of Pediatrics, The First Affiliated Hospital, School of Medicine, Xiamen University, Xiamen 361003, People’s Republic of China
Correspondence: Jinchun Xing; Tao Wang
The First Affiliated Hospital of Xiamen University, Xiamen, Fujian 361003, People’s Republic of China
Tel/Fax +86-592-2139814; +86-592-2137125
Email [email protected]; [email protected]
Purpose: Prostate cancer (PCa) is the third most common cancer in men and the second leading cause of cancer-related death in men. DLX1 belongs to the DLX homeobox family and exhibits antitumor activity in many kinds of tumors. MicroRNAs (miRNAs) play important roles in the progression of cancer. However, whether miRNAs affect the development of PCa by targeting DLX1 has not been determined. In this study, we aimed to investigate the role of miR-489-3p in the regulation of DLX1 expression and PCa progression and to provide a potential therapeutic target for PCa treatment.
Methods and Materials: The Cancer Genome Atlas database was used to analyze the divergent expression of DLX1 in carcinomas and adjacent normal tissues. The expression level of DLX1 in malignant and normal prostate cells was also measured using RT-qPCR and Western blotting. A dual-luciferase reporter assay was performed to determine whether miR-489-3p directly targets DLX1. We transfected 22Rv1 and DU145 cells with miR-489-3p mimics to overexpress miR-489-3p and then evaluated its effect on cellular function. MTT, EdU, colony formation and cell cycle assays were used to evaluate cell growth. JC-1 and ROS assays with flow cytometry were performed to indirectly analyze apoptosis. Transwell assays were conducted to investigate metastasis.
Results: The expression level of DLX1 was upregulated in both PCa tissues and cell lines. MiR-489-3p directly targeted DLX1 and downregulated its expression. Overexpression of miR-489-3p significantly suppressed cell growth. MiR-489-3p induced apoptosis through mitochondrial function impairment. Overexpression of miR-489-3p also inhibited cell migration and invasion. DLX1 overexpression reversed the above effects induced by miR-489-3p.
Conclusion: We identified the involvement of the miR-489-3p/DLX1 pathway in PCa for the first time. In this pathway, miR-489-3p acts as a tumor suppressor by negatively regulating the expression of DLX1. MiR-489-3p may be a potential therapeutic target for PCa treatment.
Keywords: prostate cancer, DLX1, miR-489-3p, growth, apoptosis, migration, invasion
Introduction
Prostate cancer (PCa) is the third leading malignancy diagnosed in men and the second most common cause of cancer-related mortality in men.1 It is a disease mostly occurring in older men, with 6 cases of 10 being diagnosed in those 65 years or older. Current statistics show that 1 in 39 men will die from PCa.2 In the United States, there are 181,000 new cases of PCa and 26,000 deaths yearly.3 PCa is characterized by abnormally dividing cells in the prostate gland, exhibiting abnormal growth. Metastasis is the main cause of death. Indeed, the cancer cells can spread to other tissues or organs, including the pelvic and retroperitoneal lymph nodes, spinal cord, bladder, rectum, and brain.2 Although new therapeutic strategies, such as angiogenesis inhibitors, inhibitors of the cell signalling pathway, vaccines, and gene therapy, have been developed, there is a lack of efficacy in PCa treatment. In general, a better understanding of the molecular mechanism of cancer progression would benefit therapy.
DLX1 is a member of the DLX homeobox family, which also includes DLX2, DLX3, DLX5, DLX6 and DLX7.4 DLX proteins are a group of transcription factors that share homology with Drosophila distal-less factors.5–7 Studies have demonstrated that DLX proteins play important roles in embryo development.8–10 Recent studies also show that DLXs act as oncogenes regulating cancer development in several types of cancers.11–14 For example, the expression level of DLX2 is associated with breast cancer metastasis.11 DLX4 and DLX5 can promote the growth and metastasis of ovarian cancer cells.12,13 DLX6 has metastatic potential in prostate cancer.14 However, within the DLX family, little is known about the role of DLX1 in cancer. Recent reports have revealed that DLX1 is essential for the proliferation and migration of GABAergic cortical interneurons.15 In this study, we investigated the effect of DLX1 on prostate cancer for the first time.
MicroRNAs (miRNAs) are a family of endogenous non-coding single-stranded RNA molecules with a length of 19–22 nucleotides that act as either tumor suppressors or oncogenes, depending on the function of their target genes.16 Our study demonstrated that miR-489-3p functions as a tumor suppressor in PCa by targeting DLX1 and downregulating its expression. MiR-489-3p inhibited the proliferation, migration, and invasion of prostate cancer cells but promoted apoptosis. Moreover, overexpression of DLX1 reversed these effects. Thus, our findings reveal for the first time that the miR-489-3p/DLX1 pathway is involved in PCa and provide a potential therapeutic target for the treatment of PCa.
Methods and Materials
Cell Lines and Cell Culture
RWPE-2, 22Rv1, DU145, and PC3 cell lines were obtained from ATCC. 22Rv1 and DU145 cells were maintained in DMEM (Gibco, Detroit, MI, USA) containing 10% FBS (Gibco), 100 U/mL penicillin, 100 U/mL streptomycin, and 2 mM l-glutamine. RWPE-2 cells were cultured in K-SFM (Gibco) containing 10% FBS, 0.05 mg/mL BPE (Gibco) and 5 ng/mL EGF (Gibco). All cells were placed at 37°C in a 5% CO2 atmosphere with 21% oxygen.
Plasmid Constructs
The 3′UTR of the human DLX1 gene was amplified by PCR from human genomic DNA using the primers listed in Table 1. The DLX1 3′UTR fragment was cloned downstream of the firefly luciferase reporter gene in the pmirGLO vector (Promega, Madison, WI, USA). The mutant version of the DLX1-3′UTR was created using a QuikChange II Site-Directed Mutagenesis Kit (Agilent Technologies, Santa Clara, CA, USA).
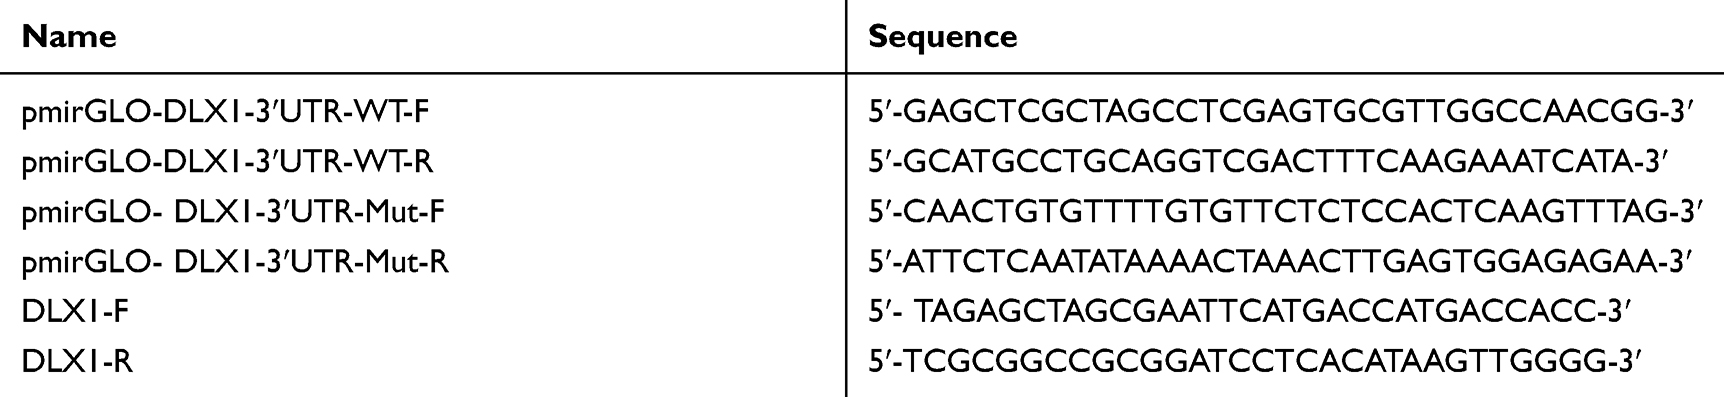 |
Table 1 Primers for Plasmid Constructs |
The lentivirus-based vector pCDH-EF1-MCS-T2A-Puro was used for overexpression of DLX1. The DLX1 gene was amplified by PCR using the primers listed in Table 1.
Transfection
MiR-489-3p mimics and the appropriate negative control (miR-NC) were purchased from RiboBio (Guangzhou, Guangdong, China). 22Rv1 and DU145 cells were seeded into a 6-well plate. The next day, miR-489-3p mimic or miR-NC (200 pmol/well) with or without 2 μg of pCDH-DLX1 were transfected into 22Rv1 and DU145 cells using Lipofectamine™ 2000 (Invitrogen, Carlsbad, NY, USA).
qRT-PCR Assay
Total RNA was isolated using RNA isolate Total RNA Extraction Reagent (Vazyme, Nanjing, Jiangsu, China). cDNAs of DLX1 were synthesized using a HiScript II 1st Strand cDNA Synthesis Kit (Vazyme). The reverse transcription reaction for miR-489-3p was performed using a miRNA 1st Strand cDNA Synthesis Kit (Vazyme) according to the manufacturer’s instructions. qPCR was conducted using an iQ5 Real-Time PCR Detection System (Bio-Rad Laboratories, Hercules, CA, USA) with a ChamQ SYBR qPCR Master Mix kit (Vazyme). The thermocycling conditions were 94°C for 3 min, followed by 40 cycles of 94°C for 15 sec, 60°C for 20 sec and 72°C for 20 sec. Each detection was carried out in triplicate. The primers used in the reverse transcription reaction and qPCR are listed in Table 2. Expression levels were normalized to U6 or 18S rRNA levels.
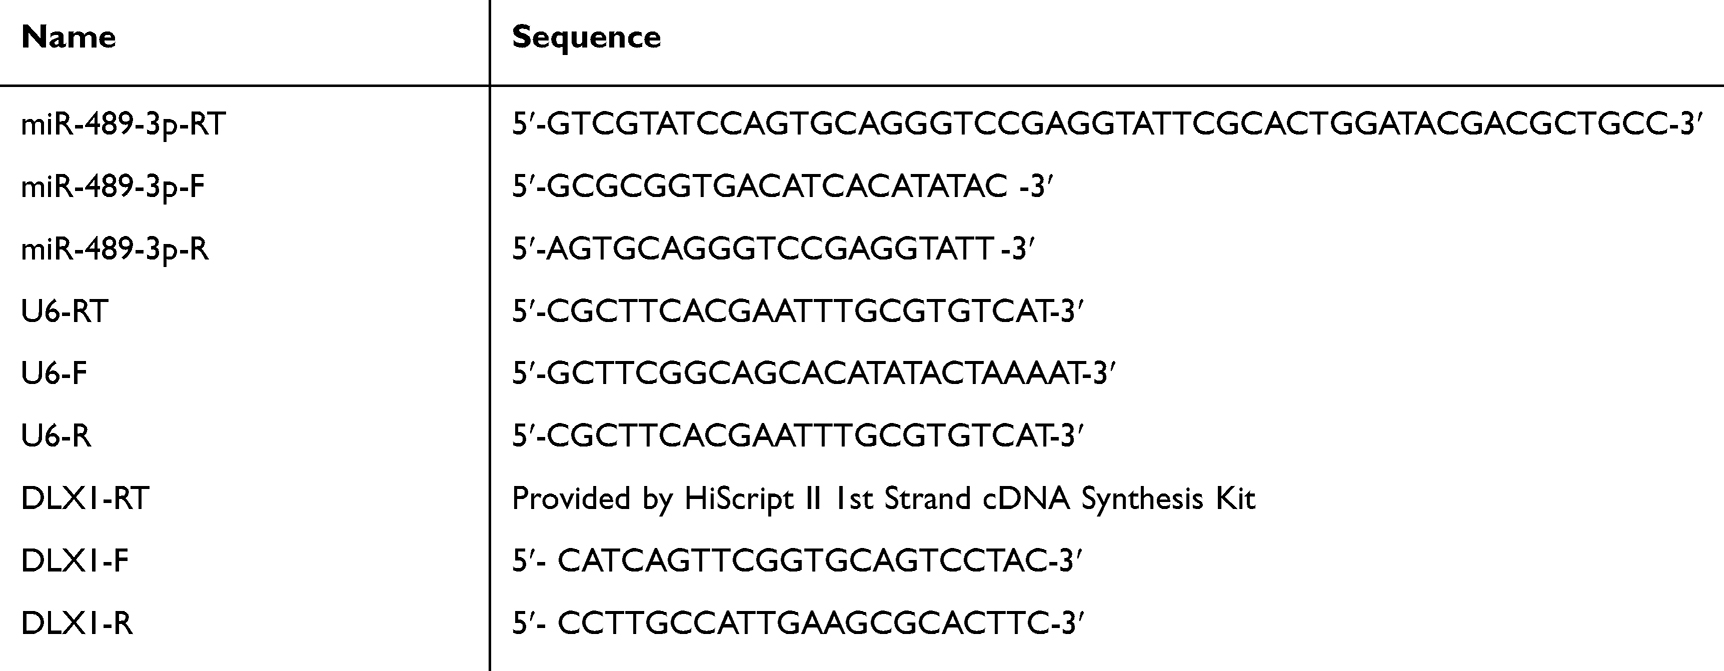 |
Table 2 Primers for RT-qPCR |
Western Blot Analysis
Cells were lysed in ice-cold RIPA buffer, and 20 µg protein was separated by electrophoresis on 8–12% denaturing SDS-PAGE gels. The blots were probed with primary antibodies overnight at 4ºC, followed by incubation with the appropriate secondary antibodies at room temperature for 1 h. The antibodies used in this study included DLX1 (Cat: 13046-1-AP, Proteintech) and GAPDH (Cat: YM3029, Immunoway).
Dual-Luciferase Reporter Assay
22Rv1 and DU145 cells were seeded into a 24-well plate and cotransfected with miRNA mimics or mimics control, pGL4.74[hRluc/TK] and pmirGLO-DLX1-3ʹUTR plasmids. The cells were lysed at 48 h post-transfection, and luciferase activity was measured using Dual-Glo Luciferase Assay System (Promega) and normalized to Renilla luciferase activity.
EdU Assay
Cells were incubated at 37°C for 4 h with DMEM containing EdU (50 µm, RiboBio). The cells were then fixed with 4% formaldehyde for 20 min, followed by the addition of glycine for 5 min. After treatment with 0.5% Triton X-100 at 28°C for 10 min, the cells were washed twice with PBS. Then, 200 μL of 1X Apollo reaction cocktail was added to each well for 20 min. Subsequently, nuclear DNA was stained with DAPI (5 μg/mL). Images were obtained with a fluorescence microscope (MOTIC, Hong Kong, China).
Cell Viability Assay (MTT)
Cells were seeded in 96-well plates at an initial density of 3 × 10³ cells/well. The cells were stained with MTT (Cat: QF0025, Qiancheng Biotech, Shanghai) at each time point for 1 h at 37°C. Absorbance was measured at 490 nm. All experiments were performed in triplicate.
Colony Formation Assay
Cells were seeded into 6-well plates at a density of 5000 cells per well and cultured for 1–2 weeks. When the colonies could be seen with the naked eye, they were fixed with methanol for 20 min and then stained with 0.5% crystal violet. The colonies were then photographed. The experiments were performed thrice independently, and the numbers of colonies were counted for analysis.
Cell Cycle Assay
Cells were seeded at a density of 2 × 10⁵ cells in 6-well plates. After 24 h, the cells were harvested and fixed in 70% ethanol at 4°C overnight. The fixed cells were incubated with 0.5 mL PBS containing 10 μg/mL RNase and 0.2% Triton X-100 for 30 min at 37°C, stained with 20 μg/mL PI for 30 min in the dark at room temperature and finally analysed by FACS.
Reactive Oxygen Species (ROS) Assay
The ROS content in cells was detected using a Cellular ROS Assay Kit (ab113851, Abcam) according to the manufacturer’s instructions.
Analysis of Mitochondrial Membrane Potential Alteration
A JC-1 staining assay kit (C2006, Beyotime) was used to detect alterations in mitochondrial membrane potential. Cells were resuspended in 500 μL DMEM and then mixed with 500 μL JC-1 working solution. After incubation for 20 min at 37°C without light, the cells were washed twice with JC-1 staining buffer, resuspended in 300 μL JC-1 staining buffer and analysed by FACS.
Transwell Assay
Migration and invasion assays were performed using Transwell plates (Corning) with 8 μm-pore size membranes without (for migration assays) or with (for invasion assays) Matrigel. A sample of 2-5x10⁵ 22Rv1 and DU145 cells were plated in the upper chambers of the Transwell device. After 24 hours of incubation, migrated cells were stained with 0.5% toluidine blue and counted from six random fields. For the invasion assay, the membrane of the upper chambers was precoated with 5-fold diluted Matrigel (BD Biosciences, Sparks, MD) before use. The migrating or invading cells were counted and photographed.
Statistical Analysis
All statistics were analysed using SPSS software 22.0 (IBM SPSS, Armonk, NY, USA). Student’s t-test (unpaired) was used for pairwise comparisons of groups. Two-way analysis of variance (ANOVA) was applied to identify significant differences among multiple groups. P < 0.05 was considered statistically significant. GraphPad Prism 5.01 (GraphPad Software, Inc., La Jolla, CA, USA) was employed to prepare graphs.
Results
DLX1 Is Upregulated in Prostate Cancer Tissues and Prostate Cancer Cell Lines
We used the PCa dataset from The Cancer Genome Atlas (TCGA) to analyse the expression levels of DLX1 in PCa. As shown in Figure 1A, the average expression level of DLX1 mRNA in 499 PCa tissues was higher than that in 52 adjacent normal tissues (ANT). Moreover, the expression level of DLX1 mRNA in PCa tissues was higher than that in matched adjacent normal tissues (Figure 1B). We used qRT-PCR and Western blot assays to compare the mRNA and protein expression levels of DLX1 between prostate cancer cell lines (PC3, DU145, 22Rv1) and the normal prostate cell line RWPE-2, respectively. As shown in Figure 1C and D, the DLX1 expression level was higher in prostate cancer cell lines than in RWPE-2 cells. Taken together, these data suggest that DLX1 may act as an oncogene in prostate cancer.
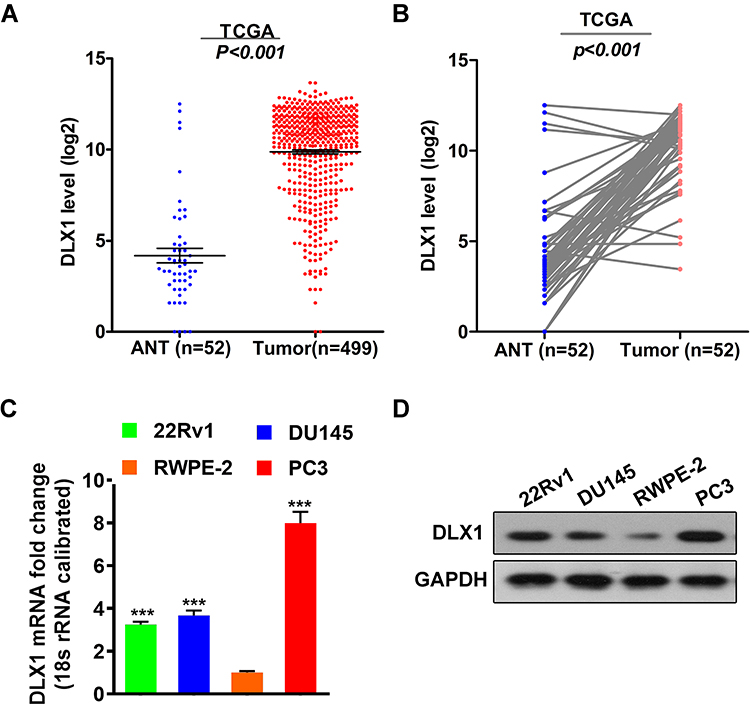 |
Figure 1 DLX1 is upregulated in prostate cancer tissues and prostate cancer cell lines. (A) The expression levels of DLX1 mRNA in 499 PCa tissues and 52 adjacent normal tissues (ANT) were analysed using the PCa dataset from The Cancer Genome Atlas (TCGA). (B) The expression level of DLX1 mRNA in PCa tissues and matched adjacent normal tissues was assessed. (C) The mRNA expression level of DLX1 in both prostate cancer cell lines (PC3, DU145, 22Rv1) and a normal prostate cell line (RWPE-2) was detected using qRT-PCR. (D) The protein expression level of DLX1 in both prostate cancer cell lines and a normal prostate cell line (RWPE-2) was detected using Western blotting. The data are presented as the mean± s.d. Unpaired two-tailed t-test: ***p<0.001. |
miR-489-3p Targets DLX1 and Downregulates Its Expression
MiRNAs can target tumour-associated genes to regulate the progression of cancer. Thus, we performed a screen using TargetScan software to identify possible miRNAs that target DLX1. The results showed miR-153-3p, miR-19-3p, miR-23-3p, and miR-489-3p to be potential candidates. A previous study reported that miR-489-3p suppresses the proliferation and invasion of bladder cancer cells.17 We hypothesized that miR-489-3p may also act as an anti-oncogene in prostate cancer, opposite to the function of DLX1. Therefore, we chose miR-489-3p for further study and confirmed whether it directly targets DLX1 using a dual-luciferase reporter assay. As shown in Figure 2A and B, relative luciferase activity decreased markedly in 22Rv1 and DU145 cells when the pmirGLO-DLX1-3ʹUTR WT plasmid was co-transfected with miR-489-3p mimics but not with negative-control mimics (miR-NC). Moreover, mutation of the miR-489-3p binding site reversed this decrease. These data indicate that miR-489-p directly targets DLX1 and negatively regulates it. In addition, we examined the effect of miR-489-3p on expression of DLX1 in miR-489-3p-overexpressing cells using qRT-PCR and Western blotting. The results showed that the mRNA and protein levels of DLX1 in these cells were reduced by mir-489-3p; overexpression of DLX1 reversed this reduction (Figure 2C and D).
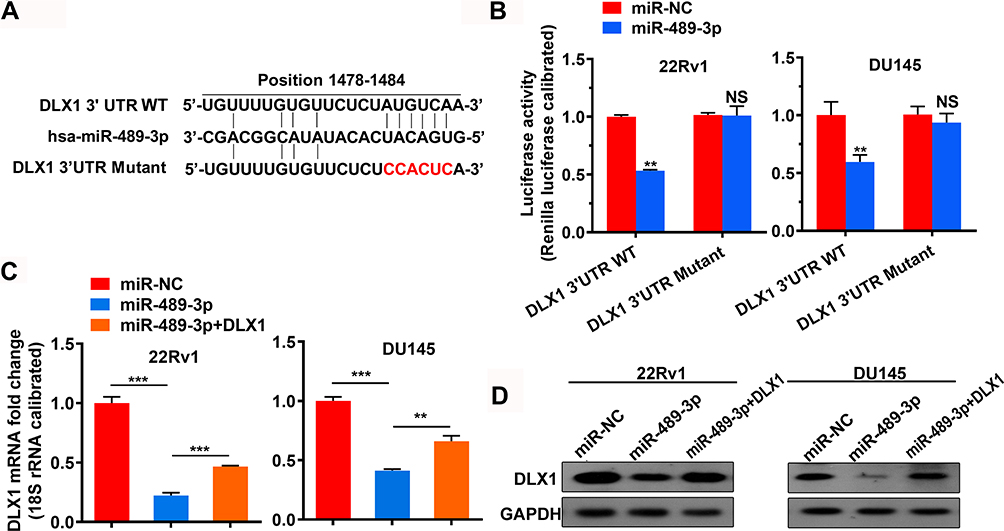 |
Figure 2 miR-489-3p targets DLX1 and downregulates its expression. (A) A screen was performed using TargetScan software to confirm possible miRNAs that target DLX1, and miR-489-3p was chosen for further testing. (B) A dual-luciferase reporter assay was used to confirm the TargetScan prediction in 22Rv1 and DU145 cells at 48 h post-transfection. The cells were cotransfected with pmirGLO-DLX1-3ʹUTR WT or pmirGLO-DLX1-3ʹUTR Mutant and negative control mimics or miR-489-3p mimics. The data are presented as the mean± s.d. Unpaired two-tailed t-test: **p<0.01. (C, D) After 48 h of transfection, mRNA and protein expression levels of DLX1 in 22Rv1 and DU145 cells were examined by qRT-PCR and Western blotting, respectively. The cells were transfected with miR-NC, miR-489-3p or both miR-489-3p and pCDH-DLX1 plasmids. The data are presented as the mean± s.d. Unpaired two-tailed t-test: **p<0.01; ***p<0.001. |
miR-489-3p Inhibits the Viability of Prostate Cancer Cells and Affects the Cell Cycle
To examine the effect of miR-489-3p on cell growth, we used EdU, MTT and colony formation assays with 22Rv1 and DU145 cells. miR-489-3p reduced the percentage of EdU+ (replicating) cells (Figure 3A and B), and the MTT assay showed that miR-489-3p decreased the OD490 value (Figure 3C). Moreover, according to colony formation assays, the colony number was decreased in cells overexpressing mir-489-3p (Figure 4A and B). Thus, overexpression of miR-489-3p inhibits proliferation in 22Rv1 prostate cancer cells and DU145 metastatic prostate cancer cells. We next performed a cell cycle analysis using flow cytometry and observed that the percentage of G0/G1 phase cells was higher in miR-489-3p-overexpressing cells than in the cells of the other two groups (Figure 4C and D). These findings indicate that miR-489-3p induces G0/G1-phase arrest. Moreover, the effect of miR-489-3p was reversed by overexpression of DLX1 (Figures 3 and 4A and B).
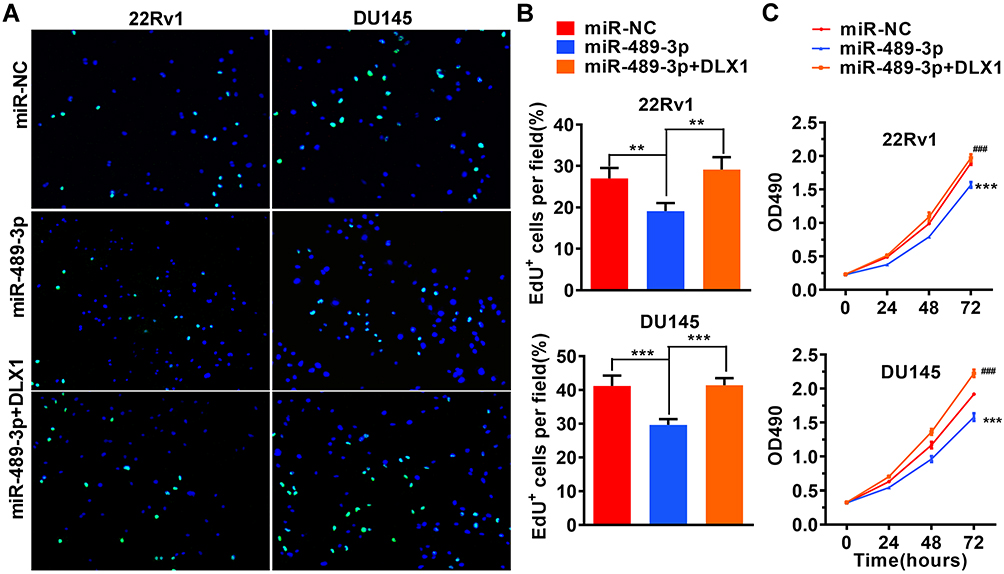 |
Figure 3 miR-489-3p inhibits the growth of prostate cancer cells. (A) The effect of miR-489-3p on the proliferation of prostate cancer cells was analysed using EdU proliferation assays. (B) Statistical analysis of the EdU assays is shown in Figure 3A. The data are presented as the mean± s.d. Unpaired two-tailed t-test: **p<0.01, ***p<0.001 (C) 22Rv1 and DU145 cells were transfected with miR-NC, miR-489-3p or both miR-489-3p and pCDH-DLX1 plasmids, respectively. The MTT assay was used to detect cell viability at different time points. The data are presented as the mean± s.d. Unpaired two-tailed t-test: ***p<0.001, miR-NC group vs miR-489-3p group; ###p<0.001, miR-489-3p group vs miR-489-3p+DLX1 group. |
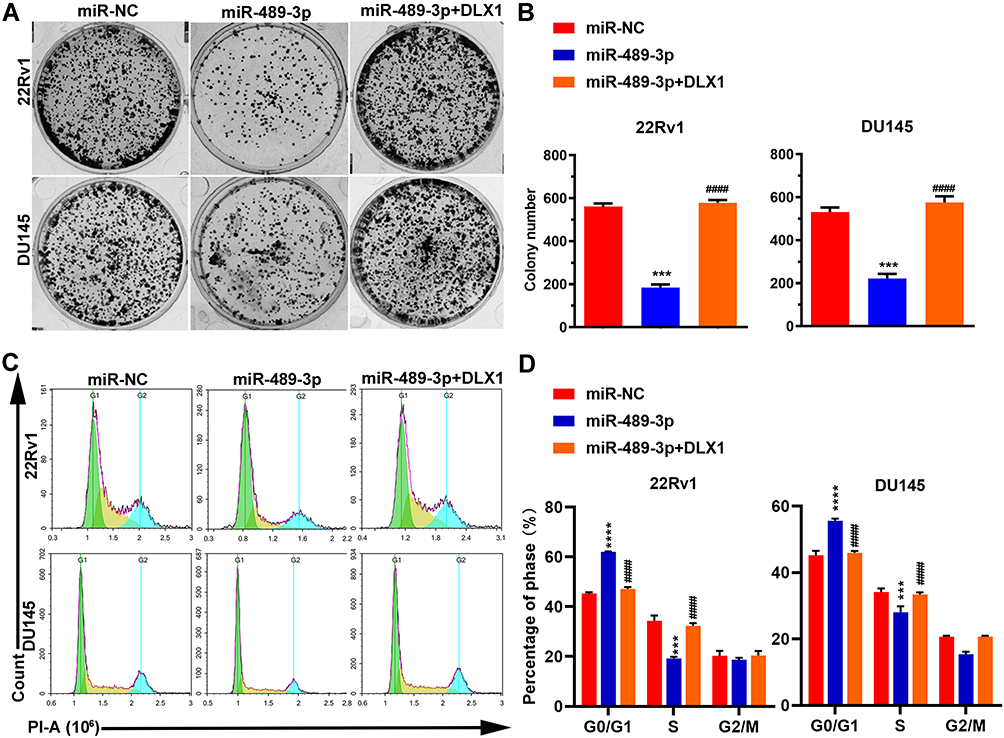 |
Figure 4 MiR-489-3p inhibits colony formation and affects the cell cycle. (A) Representative images of the colony formation assay. 22Rv1 and DU145 cells were transfected with miR-NC, miR-489-3p or both miR-489-3p and pCDH-DLX1 plasmids. The colonies were stained with crystal violet 1–2 weeks after transfection. (B) Statistical analysis of the colony formation assay shown in Figure 4A. The data are presented as the mean± s.d. Unpaired two-tailed t-test: ***p<0.001, miR-NC group vs miR-489-3p group; ####p<0.0001, miR-489-3p group vs miR-489-3p+DLX1 group. (C) Representative images of the cell cycle assay by flow cytometry. Cells were harvested and analysed using flow cytometry at 24 h after transfection. (D) MiR-489-3p induces arrest at S phase. The data are presented as the mean± s.d. Unpaired two-tailed t-test: ***p<0.001, ****p<0.0001, miR-NC group vs miR-489-3p group; ####p<0.0001, miR-489-3p group vs miR-489-3p+DLX1 group. |
miR-489-3p Increases ROS Generation via Impaired Mitochondrial Function
Mitochondria-related apoptosis is always related to mitochondrial dysfunction.18 In our study, JC-1 staining was performed to investigate changes in mitochondrial membrane potential in 22Rv1 and DU145 cells, whereby the presence of green fluorescence represents a decrease. As depicted in Figure 5A and B, overexpression of miR-489-3p obviously reduced the mitochondrial membrane potential, which indicated that miR-489-3p promotes apoptosis. To determine whether ROS were generated in miR-489-3p overexpression-induced apoptosis, we measured ROS levels in 22Rv1 and DU145 cells by DCF-DA staining. Our data demonstrated that overexpression of miR-489-3p indeed increased ROS generation (Figure 5C and D). According to these results, we conclude that miR-489-3p increases ROS generation via impaired mitochondrial function. In addition, the effect of miR-489-3p can be eliminated by DXL1 overexpression (Figure 5).
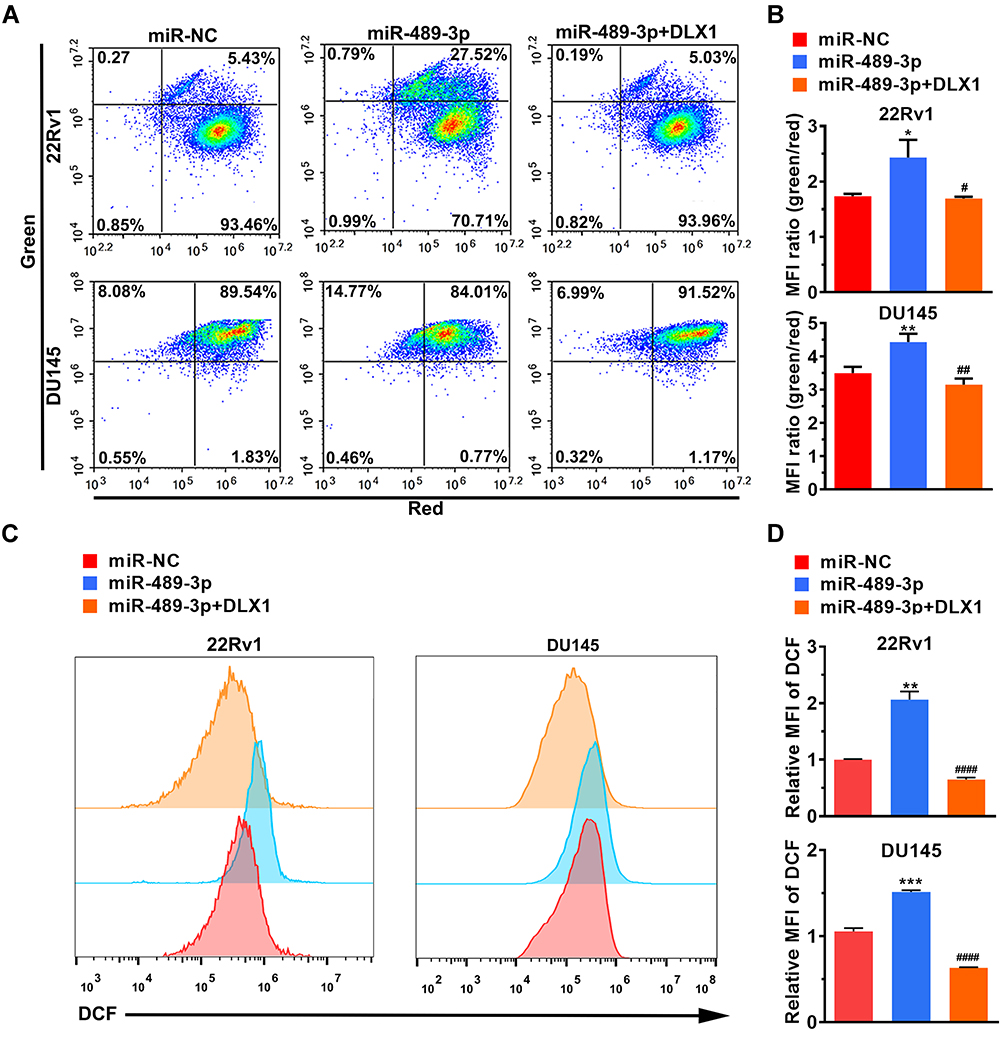 |
Figure 5 miR-489-3p increases ROS generation via impaired mitochondrial function. (A) Representative images of JC-1 assay by flow cytometry. Cells were harvested and analysed 24 h after transfection. (B) The MFI ratio was statistically evaluated for the JC-1 assay shown in Figure 5A. MFI, median fluorescence intensity. MiR-489-3p increased the MFI ratio, indicating impaired mitochondrial function. The data are presented as the mean± s.d. Unpaired two-tailed t-test: *p<0.05, **p<0.01, miR-NC group vs miR-489-3p group; #p<0.05, ##p<0.01, miR-489-3p group vs miR-489-3p+DLX1 group. (C) Representative images of the ROS assay by flow cytometry. Cells were harvested and analysed at 24 h after transfection. (D) MiR-489-3p increases ROS generation. The data are presented as the mean± s.d. Unpaired two-tailed t-test: **p<0.01, ***p<0.001, miR-NC group vs miR-489-3p group; ####p<0.0001, miR-489-3p group vs miR-489-3p+DLX1 group. |
miR-489-3p Inhibits Cell Migration and Invasion
The above results show that overexpression of miR-489-3p in prostate cancer cell lines inhibits cell proliferation and promotes apoptosis. To prove whether miR-489-3p affects cell migration and invasion, Transwell migration assays and Matrigel invasion assays were used to study the function of miR-489-3p in metastasis. As illustrated in Figure 6, overexpression of miR-489-3p reduced the number of both migrated cells and invasive cells, indicating that miR-489-3p suppresses the migration and invasion of prostate cancer cells. In addition, overexpression of DLX1 reversed the effect of miR-489-3p on metastatic behaviour in these cells (Figure 6).
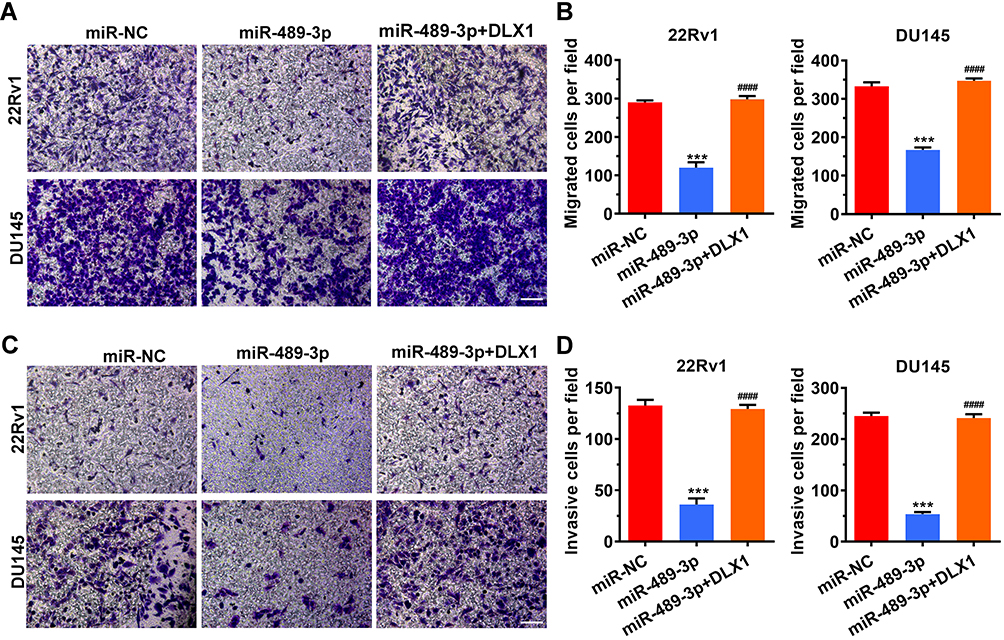 |
Figure 6 MiR-489-3p inhibits cell migration and invasion. (A) Representative images of the Transwell migration assay. Magnification: 100×. After 24 h of transfection, cells were harvested and placed into the upper chambers of the Transwell device. The migrated wells were stained and photographed the next day. (B) Histogram of migrated cells per field. The data are presented as the mean± s.d. Unpaired two-tailed t-test: ***p<0.001, miR-NC group vs miR-489-3p group; ####p<0.0001, miR-489-3p group vs miR-489-3p+DLX1 group. (C) Representative images of the Matrigel invasion assay. After a 24 h period of transfection, cells were harvested and placed into the upper chambers precoated with 5-fold diluted Matrigel. The invasive cells were stained and photographed the next day. Magnification: 100×. (D) Histogram of invasive cells per field. The data are presented as the mean± s.d. Unpaired two-tailed t-test: ***p<0.001, miR-NC group vs miR-489-3p group; ####p<0.0001, miR-489-3p group vs miR-489-3p+DLX1 group. |
Discussion
PCa is the third most common cancer in men and the second leading cause of cancer-related death.1 PCa is still a major clinical challenge, and understanding the molecular mechanism of cancer progression would facilitate the development of therapies. In the present study, we found that the expression level of DLX1 was upregulated in PCa tissues and cell lines such as 22Rv1, DU145 and PC3 cells. Thus, we suggest that DLX1 may function as an oncogene in PCa, similar to ovarian cancer.19 Then, we identified miR-489-3p as a miRNA that directly targets DLX1 and downregulates its expression, which suggests that miR-489-3p may act as a tumour suppressor. Finally, we proved our hypothesis by a series of cell function experiments. The results reveal that miR-489-3p indeed promotes ROS generation and inhibits proliferation, migration and invasion in prostate cancer cells. Moreover, the above miR-489-3-mediated effects were reversed by DLX1 overexpression.
Cell cycle analysis showed that miR-489-3p overexpression increased the percentage of cells in G0/G1 phase and reduced the percentage of cells in S phase (Figure 3), which indicates that miR-489-3p suppresses cell growth by inducing G0/G1 arrest.
There are two major apoptotic pathways: the extrinsic and intrinsic pathways. The intrinsic pathway is also called the mitochondrial pathway due to the essential involvement of mitochondria.20,21 Mitochondria-related apoptosis is always associated with a change in mitochondrial membrane potential.18 In the JC-1 staining assay, green fluorescence indicates a decrease in mitochondrial membrane potential. The results of our analysis demonstrate that miR-489-3p promoted the transition to green fluorescence (Figure 4A and B), which suggests that miR-489-3p induces apoptosis. It is well known that the mitochondrial pathway is especially susceptible to ROS.22 In our study, miR-489-3p significantly boosted the generation of ROS (Figure 4C and D), indicating that miR-489-3p-induced apoptosis in prostate cancer cells is closely associated with the production of ROS and that miR-489-3p may serve as an upstream signal molecule to initiate mitochondria-mediated apoptosis.
Overexpression of DLX1 eliminated G0/G1 arrest and increased apoptosis, indicating that DLX1 may play an important role in cell cycle progression and apoptosis. The Wnt signalling pathway is an important cascade that is tightly associated with the development of cancer. The Wnt pathway requires Wnt ligand binding to Frizzled receptors to initiate nuclear translocation of β-catenin. Translocated β-catenin interacts with transcription factor 4 (TCF4) and activates Wnt-targeted genes, which are linked to cell proliferation and apoptosis.23–25 The study of Liang et al revealed that DLX1 binds to β-catenin and enhances the interaction between β-catenin and TCF4.26 Based on the above information, we hypothesize that DLX1 may regulate cell cycle progression and apoptosis by promoting Wnt signalling.
A given miRNA can target numerous genes. Several targets of miR-26 have been reported, such as PAX3, MMP7 and HDAC7. MiR-489-3p has been shown to negatively regulate expression of PAX3 to suppress osteosarcoma metastasis.27 In addition, miR-489-3p exhibits anti-metastatic activity in human hepatocellular carcinoma by targeting MMP7.28 MiR-489-3p also inhibits growth and invasion by targeting HDAC7 in colorectal cancer.29 Thus, miR-489-3p may exert antitumor activity via the regulation of not only DLX1 but also other oncogenes.
Conclusion
We identified involvement of the miR-489-3p/DLX1 pathway in PCa for the first time. In this pathway, miR-489-3p acts as a tumour suppressor by negatively regulating expression of DLX1. MiR-489-3p may be a potential therapeutic target for PCa treatment.
Abbreviations
PCa, prostate cancer; miRNAs, microRNAs; ROS, reactive oxygen species; TCGA, The Cancer Genome Atlas; MFI, median fluorescence intensity.
Acknowledgments
This work was granted by the Xiamen Science and Technology Plan (#3502Z20184014 and #3502Z20194006), Young and Middle-aged Backbone Foundation of the Fujian Provincial Health and Family Planning Commission (#2017-ZQN-81 and #2019-ZQNB-26) and the Natural Science Foundation of Fujian Province (#2017D0010 and #2017J01355).
Disclosure
The authors have declared that no competing interests exist in this work.
References
1. Fendler A, Jung M, Stephan C, et al. miRNAs can predict prostate cancer biochemical relapse and are involved in tumor progression. Int J Oncol. 2011;39(5):1183–1192. doi:10.3892/ijo.2011.1128
2. Li HZ, Zhang YS. Review of hot topics in the diagnosis and treatment of prostate cancer in 2016. Zhonghua Wai Ke Za Zhi. 2017;55(1):59–62. doi:10.3760/cma.j.issn.0529-5815.2017.01.015
3. Barry MJ, Simmons LH. Prevention of prostate cancer morbidity and mortality: primary prevention and early detection. Med Clin North Am. 2017;101(4):787–806. doi:10.1016/j.mcna.2017.03.009
4. Stock DW, Ellies DL, Zhao Z, Ekker M, Ruddle FH, Weiss KM. The evolution of the vertebrate Dlx gene family. Proc Natl Acad Sci USA. 1996;93(20):10858–10863. doi:10.1073/pnas.93.20.10858
5. Merlo GR, Zerega B, Paleari L, Trombino S, Mantero S, Levi G. Multiple functions of Dlx genes. Int J Dev Biol. 2000;44(6):619–626.
6. Fujimoto S, Oisi Y, Kuraku S, Ota KG, Kuratani S. Non-parsimonious evolution of hagfish Dlx genes. BMC Evol Biol. 2013;13(1):15. doi:10.1186/1471-2148-13-15
7. Lezot F, Thomas BL, Blin-Wakkach C, et al. Dlx homeobox gene family expression in osteoclasts. J Cell Physiol. 2010;223(3):779–787. doi:10.1002/jcp.22095
8. Merlo GR, Mantero S, Zaghetto AA, Peretto P, Paina S, Gozzo M. The role of Dlx homeogenes in early development of the olfactory pathway. J Mol Histol. 2007;38(6):612–623. doi:10.1007/s10735-007-9154-x
9. Jackman WR, Stock DW. Transgenic analysis of Dlx regulation in fish tooth development reveals evolutionary retention of enhancer function despite organ loss. Proc Natl Acad Sci USA. 2006;103(51):19390–19395. doi:10.1073/pnas.0609575103
10. Kraus P, Lufkin T. Dlx homeobox gene control of mammalian limb and craniofacial development. Am J Med Genet A. 2006;140(13):1366–1374. doi:10.1002/ajmg.a.31252
11. Morini M, Astigiano S, Gitton Y, et al. Mutually exclusive expression of DLX2 and DLX5/6 is associated with the metastatic potential of the human breast cancer cell line MDA-MB-231. BMC Cancer. 2010;10(1):649. doi:10.1186/1471-2407-10-649
12. Zhang L, Yang M, Gan L, et al. DLX4 upregulates TWIST and enhances tumor migration, invasion and metastasis. Int J Biol Sci. 2012;8(8):1178–1187. doi:10.7150/ijbs.4458
13. Tan Y, Cheung M, Pei J, Menges CW, Godwin AK, Testa JR. Upregulation of DLX5 promotes ovarian cancer cell proliferation by enhancing IRS-2-AKT signaling. Cancer Res. 2010;70(22):9197–9206. doi:10.1158/0008-5472.CAN-10-1568
14. Leyten GH, Hessels D, Smit FP, et al. Identification of a candidate gene panel for the early diagnosis of prostate cancer. Clin Cancer Res. 2015;21(13):3061–3070. doi:10.1158/1078-0432.CCR-14-3334
15. Maira M, Long JE, Lee AY, Rubenstein JL, Stifani S. Role for TGF-beta superfamily signaling in telencephalic GABAergic neuron development. J Neurodev Disord. 2010;2(1):48–60. doi:10.1007/s11689-009-9035-6
16. Nohata N, Hanazawa T, Kikkawa N, et al. Caveolin-1 mediates tumor cell migration and invasion and its regulation by miR-133a in head and neck squamous cell carcinoma. Int J Oncol. 2011;38(1):209–217.
17. Li J, Qu W, Jiang Y, et al. miR-489 suppresses proliferation and invasion of human bladder cancer cells. Oncol Res. 2016;24(6):391–398. doi:10.3727/096504016X14666990347518
18. Jeong SY, Seol DW. The role of mitochondria in apoptosis. BMB Rep. 2008;41(1):11–22. doi:10.5483/BMBRep.2008.41.1.011
19. Chan DW, Hui WW, Wang JJ, et al. DLX1 acts as a crucial target of FOXM1 to promote ovarian cancer aggressiveness by enhancing TGF-beta/SMAD4 signaling. Oncogene. 2017;36(10):1404–1416. doi:10.1038/onc.2016.307
20. Danial NN, Korsmeyer SJ. Cell death: critical control points. Cell. 2004;116(2):205–219. doi:10.1016/S0092-8674(04)00046-7
21. Hengartner MO. The biochemistry of apoptosis. Nature. 2000;407(6805):770–776. doi:10.1038/35037710
22. Zhang C, Jia X, Bao J, et al. Polyphyllin VII induces apoptosis in HepG2 cells through ROS-mediated mitochondrial dysfunction and MAPK pathways. BMC Complement Altern Med. 2016;16(1):58. doi:10.1186/s12906-016-1036-x
23. Farin HF, Van Es JH, Clevers H. Redundant sources of Wnt regulate intestinal stem cells and promote formation of Paneth cells. Gastroenterol. 2012;143(6):1518–1529. doi:10.1053/j.gastro.2012.08.031
24. Fenderico NA-O, van Scherpenzeel RC, Goldflam M, et al. Anti-LRP5/6 VHHs promote differentiation of Wnt-hypersensitive intestinal stem cells. Nat Commun. 2019;10(1):1–13. doi:10.1038/s41467-018-08172-z
25. van Kappel ECA-O, Maurice MMA-O. Molecular regulation and pharmacological targeting of the beta-catenin destruction complex. Br J Pharmacol. 2017;174(24):4575–4588. doi:10.1111/bph.13922
26. Liang M, Sun Y, Yang H-L, Zhang B, Wen J, Shi B-K. DLX1, a binding protein of beta-catenin, promoted the growth and migration of prostate cancer cells. Exp Cell Res. 2018;363(1):26–32. doi:10.1016/j.yexcr.2018.01.007
27. Liu Q, Yang G, Qian Y. Loss of MicroRNA-489-3p promotes osteosarcoma metastasis by activating PAX3-MET pathway. Mol Carcinog. 2017;56(4):1312–1321. doi:10.1002/mc.22593
28. Lin Y, Liu J, Huang Y, Liu D, Zhang G, Kan H. MicroRNA-489 plays an anti-metastatic role in human hepatocellular carcinoma by targeting matrix metalloproteinase-7. Transl Oncol. 2017;10(2):211–220. doi:10.1016/j.tranon.2017.01.010
29. Gao S, Liu H, Hou S, et al. MiR-489 suppresses tumor growth and invasion by targeting HDAC7 in colorectal cancer. Clin Transl Oncol. 2018;20(6):703–712. doi:10.1007/s12094-017-1770-7
 © 2020 The Author(s). This work is published and licensed by Dove Medical Press Limited. The
full terms of this license are available at https://www.dovepress.com/terms
and incorporate the Creative Commons Attribution
- Non Commercial (unported, 3.0) License.
By accessing the work you hereby accept the Terms. Non-commercial uses of the work are permitted
without any further permission from Dove Medical Press Limited, provided the work is properly
attributed. For permission for commercial use of this work, please see paragraphs 4.2 and 5 of our Terms.
© 2020 The Author(s). This work is published and licensed by Dove Medical Press Limited. The
full terms of this license are available at https://www.dovepress.com/terms
and incorporate the Creative Commons Attribution
- Non Commercial (unported, 3.0) License.
By accessing the work you hereby accept the Terms. Non-commercial uses of the work are permitted
without any further permission from Dove Medical Press Limited, provided the work is properly
attributed. For permission for commercial use of this work, please see paragraphs 4.2 and 5 of our Terms.