Back to Journals » OncoTargets and Therapy » Volume 13
miR-383 Down-Regulates the Oncogene CIP2A to Influence Glioma Proliferation and Invasion
Received 2 February 2020
Accepted for publication 19 April 2020
Published 12 May 2020 Volume 2020:13 Pages 4063—4074
DOI https://doi.org/10.2147/OTT.S248116
Checked for plagiarism Yes
Review by Single anonymous peer review
Peer reviewer comments 4
Editor who approved publication: Prof. Dr. Nicola Silvestris
Shihua Zhang,* Kejian Wang*
Department of Neurosurgery, The First Affiliated Hospital of Jiamusi University, Jiamusi 154002, People’s Republic of China
*These authors contributed equally to this work
Correspondence: Shihua Zhang Email [email protected]
Background: Recent evidence showed cancerous inhibitor of protein phosphatase 2A (CIP2A) plays carcinogenesis roles in several types of human cancer. However, the expression and function of CIP2A in gliomas are unknown.
Methods: qRT-PCR, IHC and Western blot were used to evaluate CIP2A expression in glioma tissues and cell lines. The influence of CIP2A on prognosis was analyzed by KM curve and Cox regression. CCK8, clonal formation, transwell and tumor xenograft assays were used to analyze cell proliferation and invasion. The upstream microRNA of CIP2A was verified by luciferase and RIP assays.
Results: CIP2A was overexpressed in gliomas and associated with tumor size, WHO grade and postoperative overall survival rate. Depletion of CIP2A inhibited glioma cellular proliferation, invasion and xenograft tumorigenicity. miR-383 could bind to the 3ʹ-UTR of CIP2A and inhibit CIP2A expression by forming an RNA-induced silencing complex with Ago2.
Conclusion: CIP2A plays a carcinogenesis role in glioma progression and is one of the potential targets of miR-383.
Keywords: CIP2A, miR-383, glioma, proliferation, invasion, prognosis
Introduction
Glioma is the most common type of brain tumor, which represent more than 30% of the central nervous system tumors, and accounted for 80% of the intracranial malignant tumors.1 Despite great advances in glioma treatment, the prognosis and survival rate of glioma patients are still unsatisfactory due to invasion, metastasis, and recurrence.2 Therefore, it is of great significance to identify predictive biomarkers for the prognosis of glioma patients and improving the effectiveness of targeted therapy.
The cancerous inhibitor of protein phosphatase 2A (CIP2A) is an endogenous protein, which interacts with protein phosphatase 2A (PP2A).3 It is encoded by KIAA1524 and functions through an “oncogenic nexus”.4 The “oncogenic nexus” consists of various functions of CIP2A, including the inhibitory effects on PP2A and interactions with MYC protein.5 Researches showed that CIP2A is over-expressed in several types of malignant tumors such as liver cancer, gastric cancer, and breast cancer.6–8 However, there have been no studies on the expression and function of CIP2A in gliomas.
In current study, we detected the expression of CIP2A in gliomas and investigated the functions of CIP2A that involves cellular proliferation and invasion in glioma cells. Furthermore, we proved CIP2A was a targeted regulatory gene of miR-383. These results suggest that miR-383/CIP2A axis may act as a potential therapeutic target and prognostic biomarker for gliomas.
Methods
Patient Tissue Samples
One hundred and twenty glioma tissue slices were collected from patients who underwent glioma resection in the Department of Neurosurgery, The First Affiliated Hospital of Jiamusi University between January 2012 and December 2014. The clinicopathological features of the patients are listed in Table 1 and the follow-up was 60 months. The pathological differentiation based on the WHO classification system.9 Forty-two pairs of gliomas and adjacent para-carcinoma tissue samples were collected between January 2018 and December 2019. These tissues were instantly placed into liquid nitrogen to protect RNA integrity and stored at −80°C for further analysis. All patient sample collections were approved by the ethics committee of The First Affiliated Hospital of Jiamusi University.
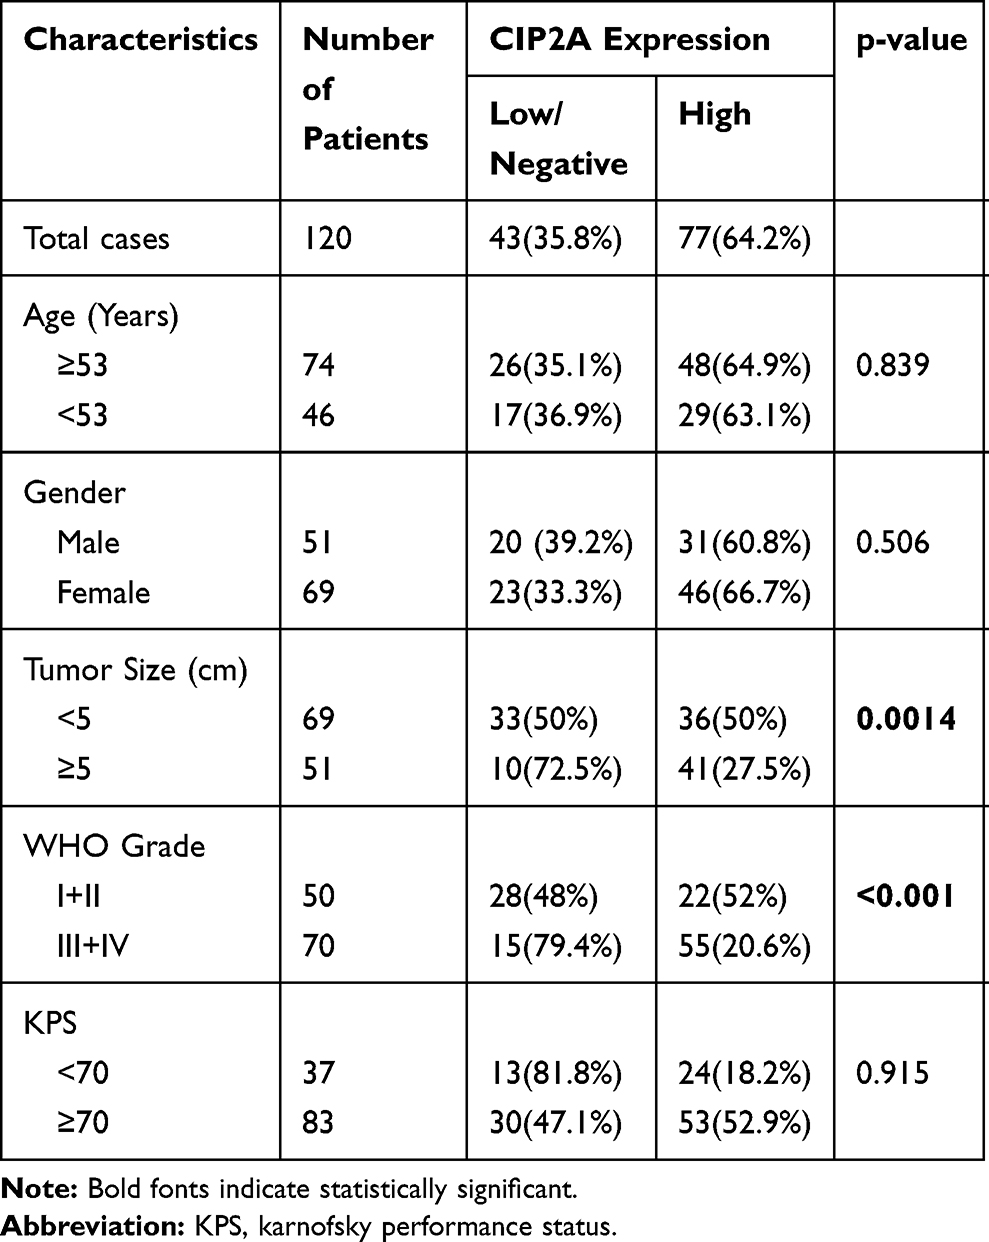 |
Table 1 Association Between CIP2A Expression According to Immunohistochemical and Conventional Clinicopathological Parameters in 120 Patients with Glioma |
Cell Lines and Transfection
Human primary neurogliocyte icell-n009 and four glioma cell lines (U87, U251, LN229, HS683) were purchased from Shanghai Cell Bank (Shanghai, China). For CIP2A depletion, the cells were transfected by lentivirus-CIP2A-shRNA or lentivirus-CIP2A-NC (GenePharma, China). Transfection efficiency on CIP2A knockdown was tested by qRT-PCR.
RNA Preparation and Quantitative Real-Time PCR
Total RNAs were extracted from tissues and cells using TRIzol reagent (Invitrogen, USA). The first-strand cDNA was reverse transcribed from RNAs using reverse transcriptase kit (Takara, Japan). qRT-PCR was performed using SYBR Green SuperMix (Roche, Switzerland) as the manufacturer’s protocols. GAPDH and U6 were, respectively, used as the internal control for CIP2A and miR-383. The relative mRNA expressions were expressed as a function of the threshold cycle (Ct) and analyzed by the 2−ΔΔCt method.10
Immunohistochemistry
Immunohistochemistry (IHC) was used to test CIP2A expression in 120 glioma tissue slices. Paraffin slices (4 μm) were deparaffinized in xylene and dehydrated by graded ethanol. The slices were heated for 5 min between 92°C and 98°C to repair the antigen and incubated by normal goat serum (PBS diluted) at room temperature for 15 min. The primary antibody (anti-CIP2A, 1:200, Abcam, UK) was added and incubated at 37°C for 2~3 h or 4°C overnight. Then, the slices were incubated by secondary antibody (biotinylated goat anti-rabbit IgG, 1:300, Abcam, UK) for 2h at room temperature. After washing, DAB rendering kit (Sangon, China) was used to develop the peroxidase reaction according to instructions.
Western Blot
Tissues or cell samples were lysed in radio immunoprecipitation assay lysis buffer (Beyotime, China). The protein concentration was determined by the Enhanced BCA Protein Assay Kit (Beyotime, China), and equal amounts of protein were separated by SDS-polyacrylamide gel electrophoresis and transferred to polyvinylidene difluoride (PVDF) membranes (Millipore, USA). After blocking with 5% nonfat milk for 1 h, the membranes were incubated with the primary antibodies overnight at 37°C for 2~3 h or 4°C overnight. Then, the membranes were washed three times with TBST and incubated with secondary antibodies for 2 h at room temperature. Protein bands were visualized using an enhanced ECL system (Pierce, USA). β-actin (Cell Signaling Technology, USA) was used as a loading control.
Cell Cycle Analysis
After 48 h of transfection, the collected cells were washed with 1×PBS for 3 times. Then, cells were centrifuged and the supernatant was discarded. Next, the cells were resuspended with 0.5 mL 1×PBS and rapidly injected into 3.5 mL 70% precooled ethanol. The cells were blown evenly and stored overnight at 4°C. One-milliliter PI/Triton x-100 staining solution containing 0.2 mg RNase A (20 g PI/0.1% Triton x-100) was used to resuscitate cells and stained at 37°C for 15 min. The fluorescence-activated cell sorting (FACS) Calibur (Becton Dickinson, USA) was used to detect and record the fluorescence upon excitation at 488 nm.
Clonal Formation Assay
A total of 500 cells were plated into 6-well plates. After culture for 14 days in a humidified 37°C incubator with 5% CO2, the colonies were fixed with 10% formaldehyde for 30 min and then stained with 0.5% crystal violet (Beyotime, China) for 30 min. The colonies were photographed by the camera (Olympus, Japan).
CCK8 Assay
Twenty-four hours after transfection, cell proliferation capacity was evaluated by CCK8 Kit (Dojindo, Japan) according to instructions. Cells were seeded at a density of 2×10³/well in 96-well plates. Cells were cultured for indicated times (24, 48 or 72 h). Then, 10 μL of CCK8 solution was added to each well and incubated for 1 h at 37°C before the absorbance was measured at 450 nm wavelength with the microplate reader (BioTek, USA).
Transwell Assay
Transwell chambers (Millipore, USA) coated with matrigel (BD biosciences, USA) were prepared as the manufacturer’s instructions. After starvation, 1×10⁵ cells in 200 μL of serum-free medium were placed in the top chamber. The chamber was inserted into a 12-well filled with 600 μL medium added with 10% FBS. After 24 h incubation, methanol was used to fix the invasive cells on the lower membrane and cotton swabs were used to remove the noninvasive cells in the upper membrane. The invasive cells were stained with 0.5% crystal violet (Beyotime, China), photographed and counted under five random 200× fields per well using a microscope (Nikon, Japan). The cell migration assay was simultaneously conducted as above, except for the chambers without matrigel.
Luciferase Assays
293T Cells were plated into 24-well plates at 80% confluence 24 h before transfection. The wild-type CIP2A-3ʹUTR (WT) and mutant CIP2A-3ʹUTR (MUT) containing the binding site of miR-383 were established and cloned into a Firefly luciferase-expressing vector (GenePharma, China). A mixture of 200 ng WT or MUT, 700 ng pGV214-miR-383 and 100 ng Renilla luciferase plasmid were transfected into 293T cells using Lipofectamine® 2000. After 36 h transfection, luciferase activities were analyzed using the Dual-Luciferase Reporter Assay System (Promega, USA) as the manufacturer’s protocol.
RNA Immunoprecipitation (RIP) Assay
Magna RNA-binding protein immunoprecipitation kit (Millipore, USA) was used to conduct RIP assay according to instructions. Briefly, cell lysates were incubated with RIP buffer containing magnetic beads conjugated with negative control normal IgG or Anti-Ago2-ChIP Grade (Abcam, UK). The samples were then incubated with Proteinase K to isolate the immunoprecipitated RNA. Finally, purified RNAs were extracted and subjected to PCR and real-time PCR to confirm the presence of the binding targets.
Tumor Xenograft Experiments
The experimental animals were 6-week old BALB/c-Nude nude mice. The glioma cells of each experimental treatment group were washed, resuspended, and 1x10⁷ cells/0.1 mL single-cell suspension was counted and inoculated into the armpit of nude mice. The long diameter (a) and short diameter (b) of the subcutaneous xenograft tumor were measured weekly. After 4 weeks, the nude mice were sacrificed and transplanted. The weight of the tumors were weighed and pictures were taken. The animal maintenance, husbandry, and experimental procedures were performed in accordance with the rules of Jiamusi University for the Use of Experimental Animals and approved by the Medical Animal Care and Use Committee of Jiamusi University (Jiamusi, China).
Statistical Analyses
SPSS 21.0 software was used for all data analyses. Clinicopathological correlations were calculated by the Pearson Chi-square Test (Linear Regression). The significance of difference was calculated with Student’s t-teCIP2Ast unless otherwise indicated. P values less than 0.05 were considered significant (*p < 0.05; **p < 0.01). The data show the mean ± standard deviation.
Results
CIP2A Expression in Glioma Tissues and Cell Lines
We first examined the CIP2A mRNA expression in 42 pairs of glioma fresh tissue samples by qRT-PCR. Compared with the tumor and noncancerous tissues, CIP2A was over-expressed in 33 cases (78.6%) and low-expressed in 9 cases (21.4%) (Figure 1A). Moreover, the mean expression levels of CIP2A mRNA were remarkably upregulated in glioma tissues as compared with the normal tissues (p < 0.01, Figure 1B) which was consistent with that in the four glioma cell lines (U87, U251, LN229, HS683) relative to that in human primary neurogliocyte icell-n009 (Figure 1E). Western blot was used to test CIP2A protein expression in 12 pairs of glioma fresh tissue samples randomly selected from all the 42 pairs, which showed eleven pairs with high expression and one pair with low expression (Figure 1C). We also used IHC to evaluate CIP2A protein expression in 120 glioma patients with 5-year follow-up data. Results showed CIP2A was mainly expressed in glioma cell cytoplasm (Figure 1D) and highly expressed in 64.2% patients (77/120), low or negatively expressed in the remaining 43 patients (35.8%) (Table 1).
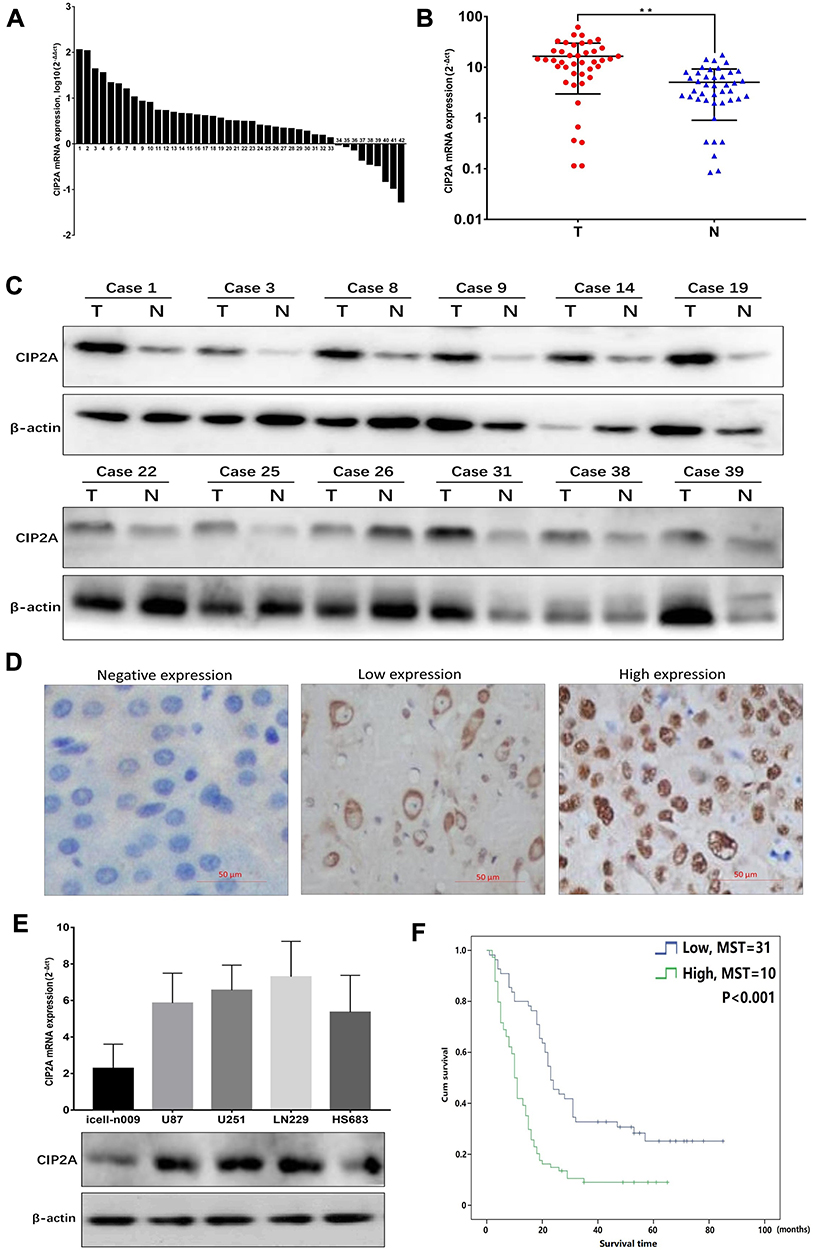 |
Figure 1 CIP2A expression in glioma samples and cell lines. (A) The expression levels of CIP2A mRNA in 42 paired fresh glioma tissues according to qRT-PCR; (B) The average mRNA expression levels of CIP2A in 42 glioma tissues and the corresponding normal tissues according to qRT-PCR (**p < 0.01); (C) The expression levels of CIP2A protein in 12 cases glioma tissues and the corresponding normal tissues according to Western blotting; (D) According to IHC in 120 glioma paraffin section specimens, CIP2A protein appeared to be expressed in the cytoplasm of tumor cells; (E) CIP2A was high expressed in 4 glioma cell lines (U87, U251, LN229 and HS683) than the human primary neurogliocyte icell-n009; (F) According to IHC in 120 glioma paraffin section specimens, the overall survival in patients with high CIP2A expression was significantly lower than in patients with low CIP2A expression (p < 0.01, KM survival curve) (MST: median survival time). |
Clinical Significance of CIP2A Expression in Gliomas
To further explore the clinical and prognostic significance of CIP2A expression in gliomas, we analyzed the association between CIP2A expression and various clinicopathological factors according to IHC results in 120 patients. We found CIP2A expression levels were positively correlated WHO grade (p < 0.001) and tumor size (p = 0.0014, Table 1). Kaplan Meier curve and Cox regression were used to investigate the influence of CIP2A on glioma patient postoperative prognosis. Results showed the overall survival was significantly lower in patients with high CIP2A expression than in those with low expression (p < 0.01, Figure 1F) and CIP2A was a significant prognostic factor for glioma patients (p = 0.003, Table 2).
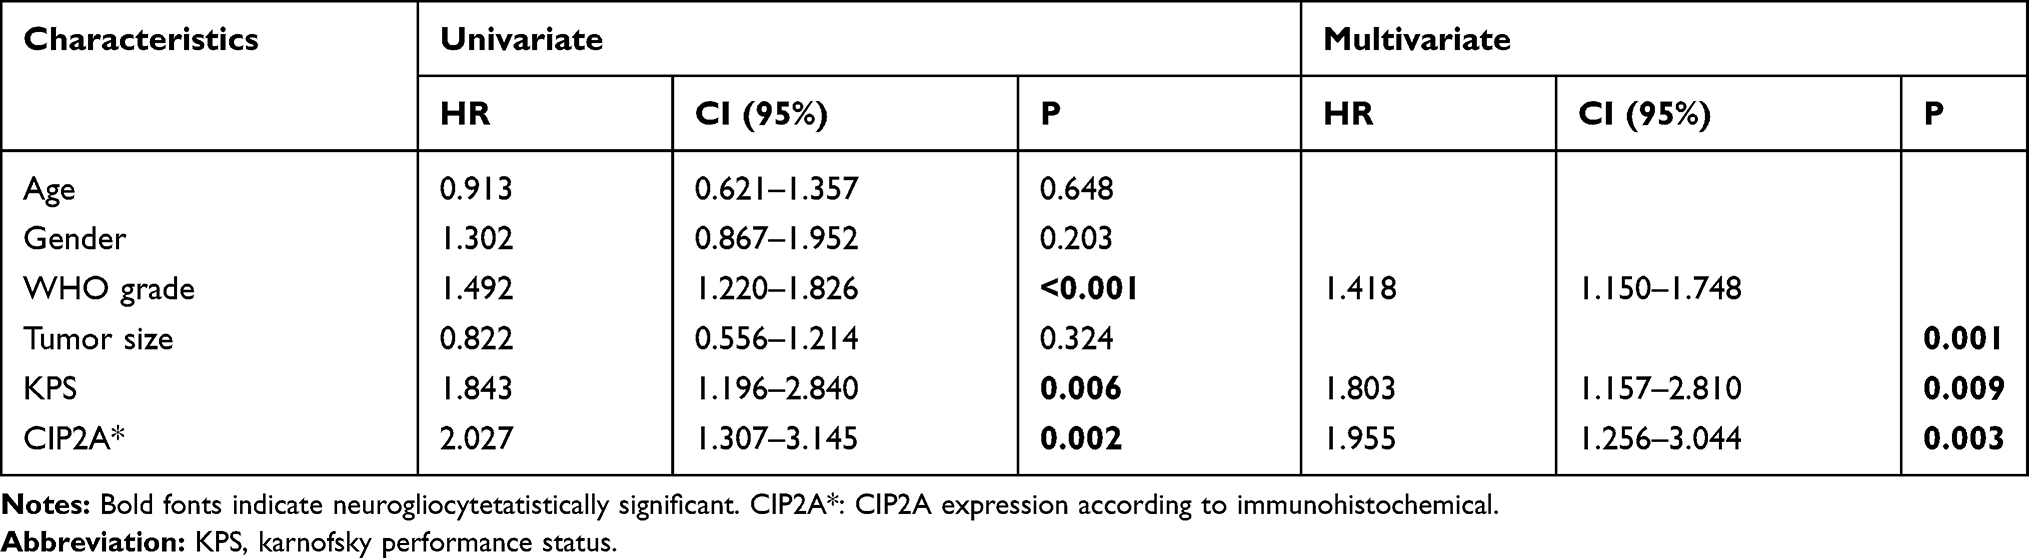 |
Table 2 COX Regression Analysis on the Relationship of Clinicopathologic Characteristics and Prognosis |
CIP2A Influences Glioma Cellular Invasion
To explore the role of CIP2A in gliomas, we performed loss of function experiments in U251 and LN229 cells which were relatively high expressed CIP2A. Transwell assays were performed to explore the influence of CIP2A depletion on glioma cellular migration and invasion. Results showed CIP2A knockdown by Lv-CIP2A-shRNA remarkably reduced the number of invasive and migrated cells (p < 0.01, Figure 2). Moreover, we chose U87 cell line which with relative lower CIP2A expression and transfected pcDNA-CIP2A to upregulated CIP2A expression. Transwell assays showed CIP2A overexpression could promote glioma cellular migration and invasion (p < 0.01, Figure 2).
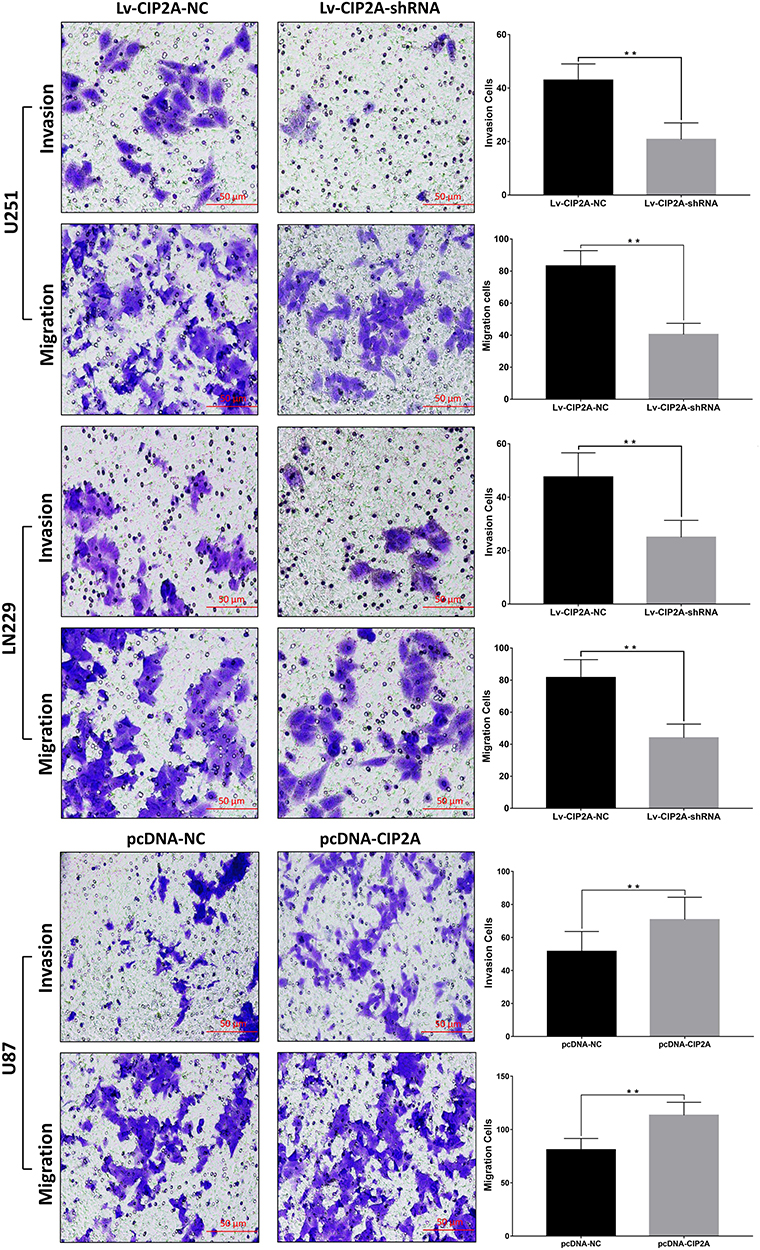 |
Figure 2 CIP2A influences glioma cellular invasion. Transwell assays showed lower invasion and migration abilities were observed in U251 and LN229 cells transfected with Lv-CIP2A-shRNA compared with Lv-CIP2A-NC (**p < 0.01). pcDNA-CIP2A was used to upregulate CIP2A expression in U87 cells and results showed CIP2A overexpression could promote glioma cellular migration and invasion (**p < 0.01). |
CIP2A Influences Glioma Cellular Proliferation
CCK8 assay results demonstrated that knockdown of CIP2A significantly decreased the capacity of cell proliferation in U251 and LN229 cells (p < 0.01, Figure 3A) and CIP2A overexpression promoted cellular proliferation in U87 cells (p < 0.01, Figure 3A). Colony formation assay indicated that downregulated CIP2A inhibited the colony numbers of U251 and LN229 cells (p < 0.01, Figure 3B) and upregulated CIP2A increased the colony numbers of U87 cells (p < 0.01, Figure 3B). The effect of CIP2A on the cell cycle was tested using flow cytometry analysis. In glioma cells, depletion of CIP2A showed an increase in the number of cells in G1 phase and decrease in the number of S phase in U251 and LN229 cells (p < 0.01, Figure 4) and CIP2A overexpression showed a reverse trend in U87 cells (p < 0.01, Figure 4), which revealed CIP2A could promote cellular proliferation by affecting G1/S phase. To validate the in vivo function of CIP2A in glioma progression, a xenograft model was established by subcutaneously injecting glioma cells. After 28 days post cell injection, CIP2A knockdown in U251 and LN229 cells showed lower tumor weight and volume (p < 0.01, Figure 5) and CIP2A overexpression in U87 cells showed higher tumor weight and volume (p < 0.01, Figure 5).
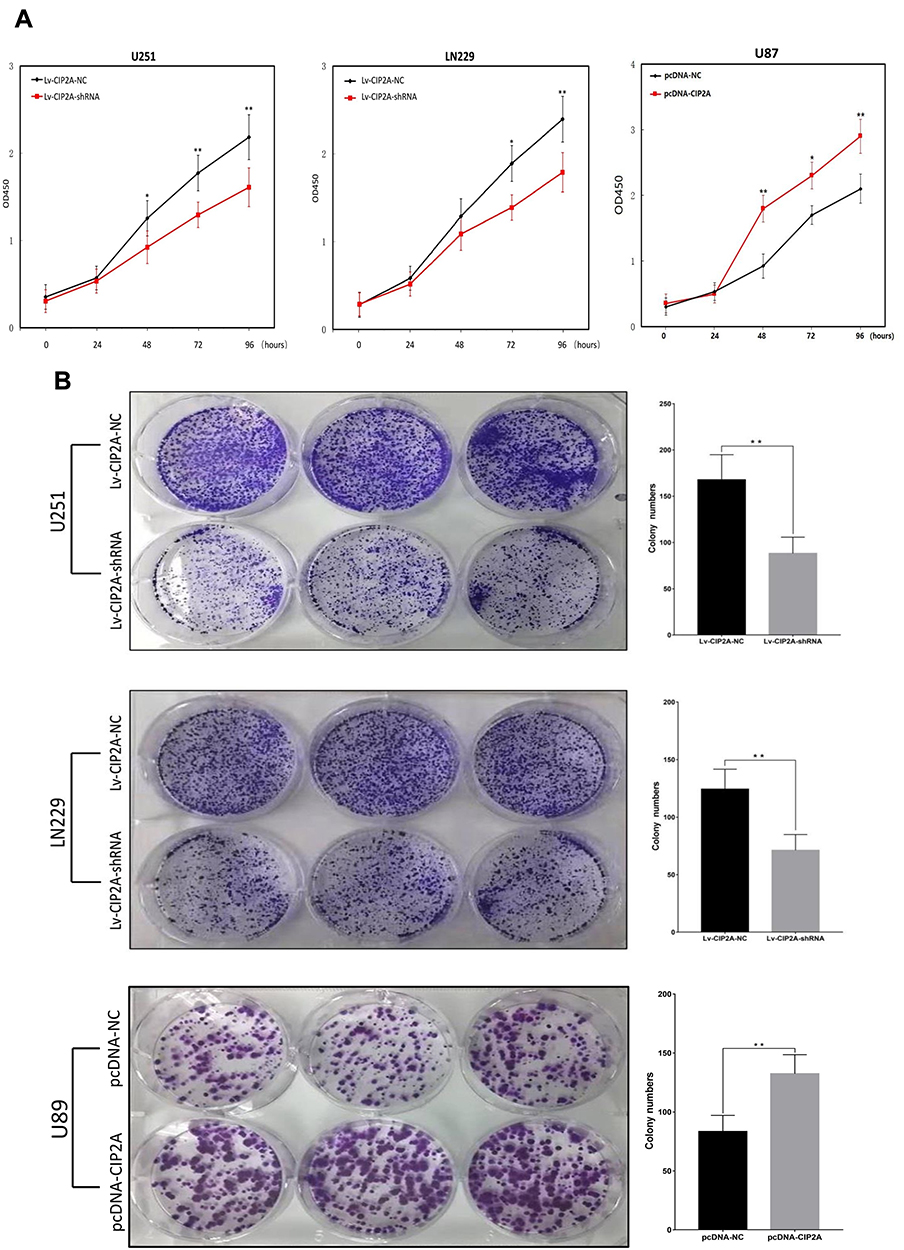 |
Figure 3 CIP2A influences glioma cellular proliferation. (A) According to CCK8 assays, significant decreased proliferation rate was observed 48 h post transfection with Lv-CIP2A-shRNA compared with Lv-CIP2A-NC in U251 and LN229 cells (*p < 0.05, **p < 0.01). CIP2A overexpression could increase proliferation rate in U87 cells (*p < 0.05, **p < 0.01); (B) Clonal formation assays were performed with glioma cells. Lower number of colonies were found in U251 and LN229 cells treated with Lv-CIP2A-shRNA compared with Lv-CIP2A-NC (**p < 0.01). Higher number of colonies were found in U87 cells treated with pcDNA-CIP2A compared with pcDNA-NC (**p < 0.01). |
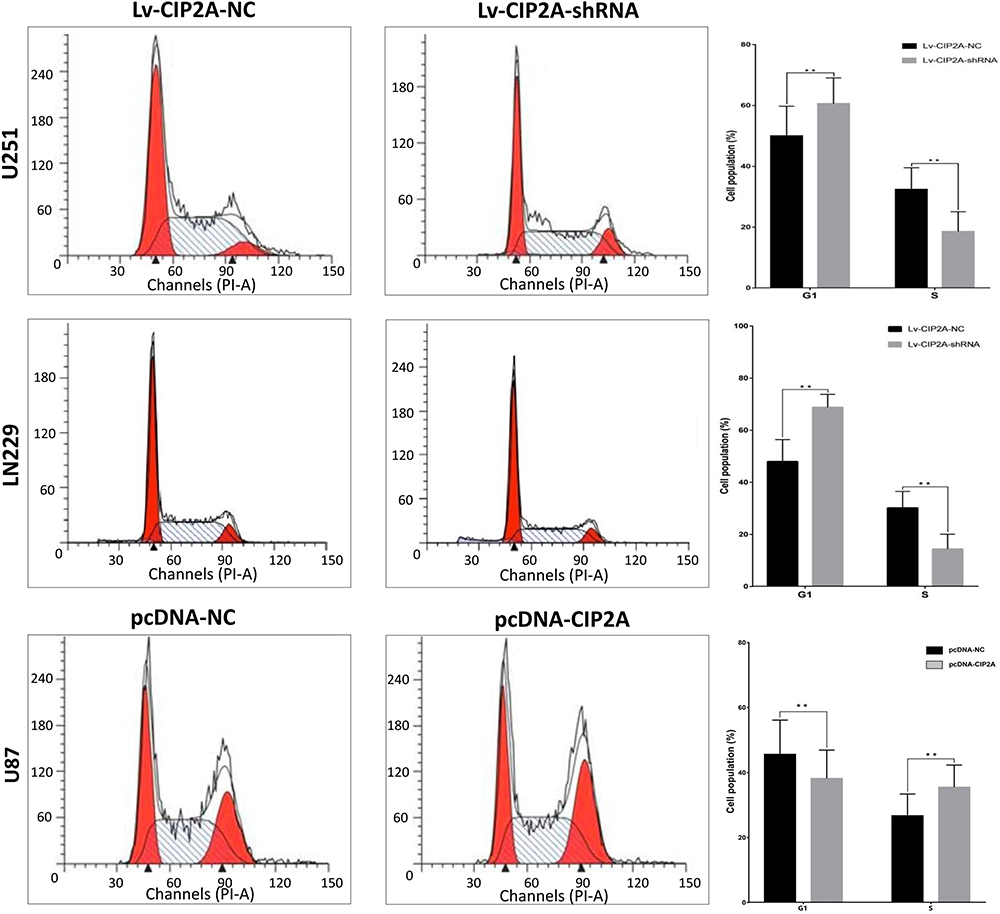 |
Figure 4 CIP2A affected glioma cellular cycle. The effect of CIP2A on the cell cycle was tested using flow cytometry analysis. In U251 and LN229 cells, CIP2A depletion cells showed an increase in the number of cells in G1 phase and decrease in the number of cells in S phase when compared with the Lv-CIP2A-NC groups (**p < 0.01). In U87 cells, CIP2A overexpression cells showed a decrease in the number of cells in G1 phase and an increase in the number of cells in S phase when compared with the pcDNA-NC groups (**p < 0.01). |
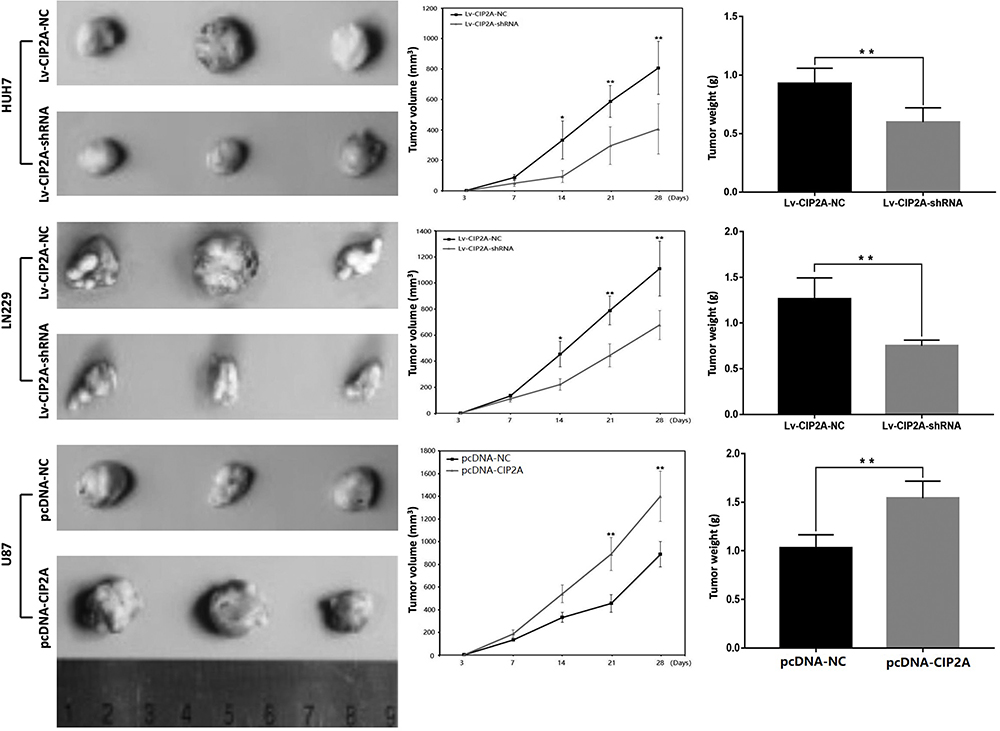 |
Figure 5 CIP2A affected glioma cellular xenograft tumorigenicity. Subcutaneous tumorigenicity experiments in nude mice showed 28 days after cell injection, lower tumor volume and weight were observed in Lv-CIP2A-shRNA groups compared with Lv-CIP2A-NC groups in U251 and LN229 cells (*p < 0.05, **p < 0.01). Higher tumor volume and weight were observed in pcDNA-CIP2A groups compared with pcDNA-NC groups (**p < 0.01). |
CIP2A Was a Direct Downstream Target for miR-383
In order to investigate the mechanism of CIP2A ectopic overexpression, we focused on the upstream microRNAs of CIP2A. According to prediction websites (TargetScan), CIP2A contains one potential miR-383 binding site in its 3′-UTR and the sequence is highly conserved (Figure 6A). Therefore, luciferase assays were performed to test whether miR-383 directly bound to CIP2A. The vectors containing the wild-type and mutant 3ʹ‑UTR of CIP2A fused downstream of the firefly luciferase gene are shown in Figure 6A. The results indicated that miR-383 decreased the relative luciferase activity of the wild-type CIP2A 3ʹ-UTR compared with the mutant 3ʹ-UTR (p < 0.01, Figure 6B). miR-383 mimics were subsequently transfected into glioma cells to upregulate miR-383 expression. The results showed overexpression of miR-383 decreased the expression of CIP2A at both the mRNA and protein levels (P<0.01, Figure 6C and D). It is well known that miRNAs regulate the expression of target genes by forming an RNA-induced silencing complex (RISC)11 and the Ago2 protein is a key protein in the RISC complex.12 Therefore, we used the RIP assay to verify whether miR-383 can bind to Ago2. PCR and qRT-PCR results both detected miR-383 expression in Ago2 immunoprecipitate (Figure 6E). We also found that the miR-383 was low expressed in glioma patients (Figure 6F) and negatively correlated with CIP2A mRNA expression (R2 = 0.457, P < 0.001, Figure 6G). Taken together, these results confirmed that CIP2A was a direct target of miR-383.
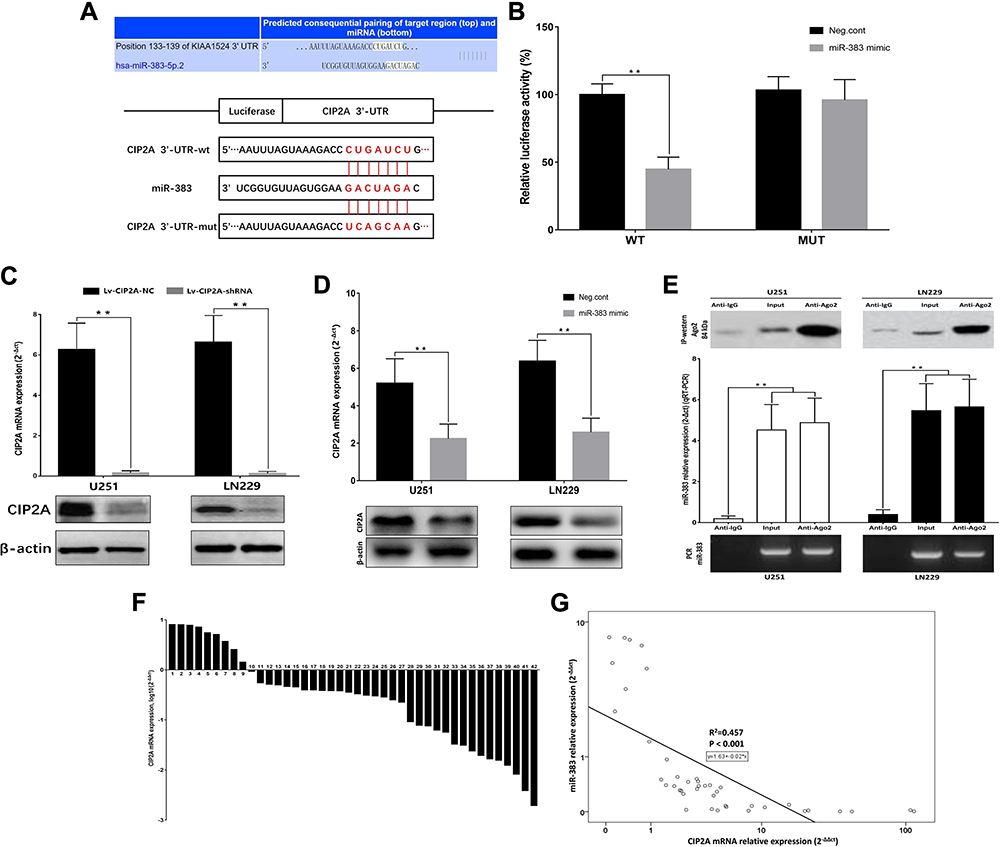 |
Figure 6 CIP2A was a direct downstream target for miR-383. (A) TargetScan predicted that CIP2A contained one potential miR-383 binding site in its 3ʹ-UTR. Wild-type and miR-383 binding site-mutated 3ʹ-UTR of CIP2A. (Mutations are red font); (B) miR‑383 significantly decreased the relative luciferase activity of the wild‑type CIP2A 3ʹ‑UTR compared with the mutant 3ʹ-UTR in 293T cells (**p < 0.01); (C) Interference efficient of Lv-CIP2A-shRNA on mRNA and protein levels were tested by qRT-PCR and Western blot (**p < 0.01); (D) Overexpression of miR-383 decreased the expression of CIP2A at both the mRNA and protein levels in glioma cell lines (**p < 0.01); (E) RIP assays were used to verify whether miR-383 can bind to Ago2. IP-western detection of Ago2 expression in anti-Ago2 beads captures in glioma cells lysates. PCR and qRT-PCR were both used to detect the expression of miR-383 in the immunoprecipitated and the same expression trends were observed. IgG was the negative control and input was a positive control (**p < 0.01); (F) The expression levels of miR-383 in 42 paired fresh glioma tissues according to qRT-PCR; (G) miR-383 relative expression is negatively correlated with CIP2A mRNA relative expression. Data were analyzed by Spearman regression according to the results of qRT-PCR in 42 paired glioma fresh tissue samples. |
Discussion
It has been well documented that the aberrant overexpression of CIP2A can promote cell proliferation and metastasis by inhibiting PP2A activity, which leads to the phosphorylation of several oncogenes, including c-myc, Akt, Plk1, E2F1 and mTORC1.13,14 Recent evidence demonstrated that CIP2A is a novel candidate oncogene and possibly a therapeutic target for several types of human cancer.15,16 However, the abnormal expression of CIP2A and its possible carcinogenesis in gliomas have not been studied thus far.
In the current study, CIP2A expression in glioma tissues and cell lines were detected by different methods including qRT-PCR, Western blot and IHC. All of the results suggested CIP2A was highly expressed in gliomas. To further explore the prognostic significance of CIP2A expression in gliomas, we analyzed the association between CIP2A expression and postoperative survival rate according to IHC results in 120 patients with complete 5-year follow-up data. We found CIP2A expression significantly affected the overall survival rate and was a poor prognostic factor for glioma patients. All the evidence suggests CIP2A may play carcinogenesis roles in glioma progression.
Then, we analyzed the influence of CIP2A on glioma cellular malignant biological behavior in vitro experiment. Series of assays revealed that CIP2A knockdown in U251 and LN229 cells by transfecting Lv-CIP2A-shRNA could notably suppress the capacities of cellular invasion and proliferation. In vivo experiment, we found CIP2A knockdown suppressed the tumorigenicity of glioma cells in xenograft mouse model. Based on the above findings, we first verified the oncogene role of CIP2A in gliomas.
In order to investigate the mechanism of CIP2A ectopic overexpression, we focused on the upstream microRNAs. MicroRNAs (miRNAs) represent a class of endogenous, highly conserved, small nonprotein-coding RNAs that regulate the expression of target genes by binding to the 3ʹ-UTR of the target gene and forming an RNA-induced silencing complex (RISC).17,18 According to prediction websites (TargetScan), CIP2A contains one potential miR-383 binding site in its 3′-UTR. Recent studies demonstrated that miR-383 was a cancer suppressor gene in many types of human cancers.19,20 In the current study, luciferase assays showed miR-383 could bind to the 3ʹ-UTR of CIP2A and miR-383 overexpression inhibited CIP2A expression. RIP assays suggested miR-383 and Ago2 formed RISC in glioma cells. Furthermore, miR-383 was low expressed in glioma patients and negatively correlated with CIP2A mRNA expression. Taken together, these results confirmed that CIP2A was a direct target of miR-383 and the CIP2A ectopic overexpression may be induced by miR-383 abnormal expression.
In conclusion, taken together, the above findings suggest that CIP2A acts as an oncogene in glioma progression. We have also demonstrated, for the first time, a novel miR-383/CIP2A regulatory axis involved in the development of gliomas. These findings provide a theoretical basis for the development of alternative strategies for the clinical treatment of glioma.
Ethics and Consent Statement
All patient sample collections were approved by the ethics committee of The First Affiliated Hospital of Jiamusi University. All patients provided written informed consent, and that this was conducted in accordance with the Declaration of Helsinki.
Acknowledgments
This study was funded by the Heilongjiang provincial health commission project (No. 2019-325).
Author Contributions
All authors made substantial contributions to conception and design, acquisition of data, or analysis and interpretation of data; took part in drafting the article or revising it critically for important intellectual content; gave final approval of the version to be published; and agree to be accountable for all aspects of the work.
Disclosure
All the authors declare that they have no conflicts of interest in this work.
References
1. Siegel RL, Miller KD, Jemal A. Cancer statistics, 2020. CA Cancer J Clin. 2020;1–24.
2. Wu Y, Song Z, Sun K, et al. A novel scoring system based on peripheral blood test in predicting grade and prognosis of patients with glioma. Onco Targets Ther. 2019;12:11413–11423. doi:10.2147/OTT.S236598
3. Elgendy M, Cirò M, Hosseini A, et al. Combination of hypoglycemia and metformin impairs tumor metabolic plasticity and growth by modulating the PP2A-GSK3β-MCL-1 axis. Cancer Cell. 2019;35(5):798–815.e5. doi:10.1016/j.ccell.2019.03.007
4. De P, Carlson JH, Leyland-Jones B, et al. Role of “oncogenic nexus” of CIP2A in breast oncogenesis: how does it work? Am J Cancer Res. 2015;5(9):2872–2891.
5. Soofiyani SR, Hejazi MS, Baradaran B. The role of CIP2A in cancer: a review and update. Biomed Pharmacother. 2017;96:626–633. doi:10.1016/j.biopha.2017.08.146
6. Yang X, Qu K, Tao J, et al. Inhibition of CIP2A attenuates tumor progression by inducing cell cycle arrest and promoting cellular senescence in hepatocellular carcinoma. Biochem Biophys Res Commun. 2018;495(2):1807–1814. doi:10.1016/j.bbrc.2017.11.124
7. Ji J, Zhen W, Si Y, et al. Increase in CIP2A expression is associated with cisplatin chemoresistance in gastric cancer. Cancer Biomark. 2018;21(2):307–316. doi:10.3233/CBM-170416
8. Guo B, Wu S, Zhu X, et al. Micropeptide CIP2A-BP encoded by LINC00665 inhibits triple-negative breast cancer progression. EMBO J. 2020;39(1):e102190. doi:10.15252/embj.2019102190
9. Dissaux G, Basse V, Schick U, et al. Prognostic value of 18F-FET PET/CT in newly diagnosed WHO 2016 high-grade glioma. Medicine (Baltimore). 2020;99(5):e19017. doi:10.1097/MD.0000000000019017
10. Schmittgen TD, Livak KJ. Analyzing real-time PCR data by the comparative C(T) method. Nat Protoc. 2008;3(6):1101–1108. doi:10.1038/nprot.2008.73
11. Stavast CJ, Erkeland SJ. The non-canonical aspects of MicroRNAs: many roads to gene regulation. Cells. 2019;8(11). doi:10.3390/cells8111465
12. Perconti G, Rubino P, Contino F, et al. RIP-Chip analysis supports different roles for AGO2 and GW182 proteins in recruiting and processing microRNA targets. BMC Bioinformatics. 2019;20(Suppl 4):120. doi:10.1186/s12859-019-2683-y
13. Ramos F, Villoria MT, Alonso-Rodríguez E, et al. Role of protein phosphatases PP1, PP2A, PP4 and Cdc14 in the DNA damage response. Cell Stress. 2019;3(3):70–85. doi:10.15698/cst2019.03.178
14. Kauko O, Westermarck J. Non-genomic mechanisms of protein phosphatase 2A (PP2A) regulation in cancer. Int J Biochem Cell Biol. 2018;96:157–164. doi:10.1016/j.biocel.2018.01.005
15. Cha G, Xu J, Xu X, et al. High expression of CIP2A protein is associated with tumor aggressiveness in stage I-III NSCLC and correlates with poor prognosis. Onco Targets Ther. 2017;10:5907–5914. doi:10.2147/OTT.S148250
16. Wang X, Yang R, Wang Q, et al. Aberrant expression of vasculogenic mimicry, PRRX1, and CIP2A in clear cell renal cell carcinoma and its clinicopathological significance. Medicine (Baltimore). 2019;98(36):e17028. doi:10.1097/MD.0000000000017028
17. Kobayashi H, Tomari Y. RISC assembly: coordination between small RNAs and argonaute proteins. Biochim Biophys Acta. 2016;1859(1):71–81. doi:10.1016/j.bbagrm.2015.08.007
18. Liu H, Lei C, He Q, et al. Nuclear functions of mammalian MicroRNAs in gene regulation, immunity and cancer. Mol Cancer. 2018;17(1):64. doi:10.1186/s12943-018-0765-5
19. Tian Y, Xia S, Ma M, et al. LINC00096 promotes the proliferation and invasion by sponging miR-383-5p and regulating RBM3 expression in triple-negative breast cancer. Onco Targets Ther. 2019;12:10569–10578. doi:10.2147/OTT.S229659
20. Cui Y, Chen LG, Yao HB, et al. Upregulation of microRNA-383 inhibits the proliferation, migration and invasion of colon cancer cells. Oncol Lett. 2018;15(1):1184–1190. doi:10.3892/ol.2017.7409
 © 2020 The Author(s). This work is published and licensed by Dove Medical Press Limited. The
full terms of this license are available at https://www.dovepress.com/terms
and incorporate the Creative Commons Attribution
- Non Commercial (unported, 3.0) License.
By accessing the work you hereby accept the Terms. Non-commercial uses of the work are permitted
without any further permission from Dove Medical Press Limited, provided the work is properly
attributed. For permission for commercial use of this work, please see paragraphs 4.2 and 5 of our Terms.
© 2020 The Author(s). This work is published and licensed by Dove Medical Press Limited. The
full terms of this license are available at https://www.dovepress.com/terms
and incorporate the Creative Commons Attribution
- Non Commercial (unported, 3.0) License.
By accessing the work you hereby accept the Terms. Non-commercial uses of the work are permitted
without any further permission from Dove Medical Press Limited, provided the work is properly
attributed. For permission for commercial use of this work, please see paragraphs 4.2 and 5 of our Terms.