Back to Journals » OncoTargets and Therapy » Volume 12
MiR-223-3p targeting epithelial cell transforming sequence 2 oncogene inhibits the activity, apoptosis, invasion and migration of MDA-MB-468 breast cancer cells
Received 24 May 2019
Accepted for publication 8 August 2019
Published 18 September 2019 Volume 2019:12 Pages 7675—7684
DOI https://doi.org/10.2147/OTT.S217019
Checked for plagiarism Yes
Review by Single anonymous peer review
Peer reviewer comments 2
Editor who approved publication: Prof. Dr. Takuya Aoki
Xiaorui Wang,1–6 Zhongsheng Tong,1–5 Hong Liu2–7
1Department of Breast Oncology, Tianjin Medical University Cancer Institute and Hospital, Tianjin City 300060, People’s Republic of China; 2National Clinical Research Center for Cancer, Tianjin City 300060, People’s Republic of China; 3Key Laboratory of Breast Cancer Prevention and Therapy, Tianjin City 300060, People’s Republic of China; 4Tianjin’s Clinical Research Center for Cancer, Tianjin City 300060, People’s Republic of China; 5Key Laboratory of Cancer Prevention and Therapy, Tianjin City 300060, People’s Republic of China; 6Tianjin Medical University, Ministry of Education, Tianjin City 300060, People’s Republic of China; 7The Second Department of Breast Cancer, Tianjin Medical University Cancer Institute and Hospital, Tianjin City 300060, People’s Republic of China
Correspondence: Hong Liu
The Second Department of Breast Cancer, Tianjin Medical University Cancer Institute and Hospital, National Clinical Research Center for Cancer, Key Laboratory of Breast Cancer Prevention and Therapy, Tianjin’s Clinical Research Center for Cancer, Key Laboratory of Cancer Prevention and Therapy, Tianjin Medical University, Ministry of Education, Huanhu West Road, Hexi District, Tianjin City 300060, People’s Republic of China
Tel +86 136 5215 8035
Fax +86 0 222 334 0123
Email [email protected]
Zhongsheng Tong
Department of Breast Oncology, Tianjin Medical University Cancer Institute and Hospital, National Clinical Research Center for Cancer, Key Laboratory of Breast Cancer Prevention and Therapy, Tianjin’s Clinical Research Center for Cancer, Key Laboratory of Cancer Prevention and Therapy, Huanhu West Road, Hexi District, Tianjin City 300060, People’s Republic of China
Tel +86 18622221181
Fax +86 022 23340123
Email [email protected]
Purpose: This research was to investigate the role of miR-223-3p targeting epithelial cell transforming sequence 2 oncogene (ECT2) in activity, apoptosis, invasion and migration of MDA-MB-468 breast cancer (BC) cells.
Methods: The human BC cell lines MDA-MB-468 were used for the experiment. They were divided into six groups: blank group (no plasmid transfection), NC group (negative control, transfected empty plasmid), miR-223-3p mimic group (transfected miR-223-3p mimic plasmid), miR-223-3p inhibitor group (transfected miR-223-3p inhibitor plasmid), si-ECT2 group (transfected si ECT2 plasmid) and miR-223-3p mimic+oe-ECT2 group (transfected with miR-223-3p mimic plasmid and ECT2 plasmid).
Results: Compared with the NC group, the mRNA and protein expression of Bax in miR-223-3p mimic and si-ECT2 groups were significantly increased, while the mRNA and protein expression of ECT2, Bcl-2, vascular endothelial growth factor (VEGF), and TGF-β1 were significantly decreased (all P<0.05). Compared with the NC group, the expression of miR-223-3p and the mRNA and protein expression of Bax were significantly decreased in the miR-223-3p inhibitor group, while the mRNA and protein expression of ECT2, Bcl-2, VEGF and TGF-β1 were significantly increased (both P<0.05). Compared with the single processing group, the mRNA and protein expression of Bax in the miR-223-3p mimic+si-ECT2 group were significantly increased, while the mRNA and protein expression of ECT2, Bcl-2, VEGF, and TGF-β1 were significantly decreased (all P<0.05).
Conclusion: MiR-223-3p targets and inhibits the expression of ECT2, thus inhibiting the invasion and migration of BC cells, and promoting cell apoptosis. miR-223-3p plays a protective role in BC.
Keywords: miR-223-3p, ECT2, breast cancer, invasion, migration
Introduction
Breast cancer (BC) is one of the most common gynecological tumors that pose a major threat to women’s health in clinic; in recent years, the incidence of BC has been increasing and gradually showing a younger trend.1,2 Although the early diagnosis and comprehensive treatment of BC have made some progress in recent years, the long-term survival rate of BC patients is still not high.3,4 Tumor invasion and migration refers to the process in which tumors move away from the primary site and continue to proliferate and grow in other tissues.5 Invasion and migration are important factors affecting the prognosis of patients with tumor; therefore, it is important to study the mechanism of invasion and migration of BC for finding effective targets, improving the therapeutic effect of patients and prolonging their survival period.6,7
MiR-223 is mainly located in the q12 segment of the human X chromosome, and its expression is regulated by multiple transcription factors such as PU.1, C/EBPa and NFI-A.8 Study has confirmed that miR-223 can participate in the function regulation of various systems, such as the human immune system, cardiovascular system, muscle and bone.9 At the same time, miR-223 also acts as a tumor suppressor gene in a variety of tumors. Li et al. demonstrated in the study that miR-223 was less expressed in osteosarcoma, and could inhibit the proliferation of cancer cells and promote apoptosis by inhibiting the transcription of Hsp90-B1 in osteosarcoma cells.10 Fabris et al. confirmed in their study on BC that overexpression of miR-223 could inhibit the recurrence of BC by mediating the EGF signaling pathway, suggesting that it also plays an important role in the progression of BC.11 ECT2 has been confirmed by many studies to play an important role in the pathogenesis and progression of BC and is an important gene for promoting the development of cancer.12 Study has confirmed that miR-223 can inhibit the progression of osteosarcoma by targeting ECT2.13 However, whether miR-223 can regulate the pathogenesis of BC by mediating ECT2 is still unclear. Based on the above research, this study confirmed the targeting relationship between miR-223-3p and ECT2 by targeting prediction website and luciferase report, and also confirmed that miR-223-3p and ECT2 could participate in the invasion and migration process of BC cells, which has certain significance for molecular targeting therapy of BC.
Materials and methods
Cell line screening
Human normal breast cells, BC cell lines and HEK-293T cells were purchased from the Institute of Basic Medicine, Chinese Academy of Medical Sciences. Human normal breast epithelial cells MCF-10A and BC cell lines MCF-7, MDA-MB-468, SK-BR-3 and MDA-MB-231 were cultured in RPMI 1640 monolayer culture medium. Fetal bovine serum (10%), 100 mg/mL streptomycin and 100 U/mL penicillin were added into the culture medium and cultured in a constant temperature incubator containing 5% CO2 at 37°C. The medium was changed once every 1–2 days, and subculture was conducted when the cell fusion degree reached 80–90%. MDA-MB-468 cell lines with the highest expression of ECT2 were screened by quantitative real-time polymerase change reaction (qRT-PCR) and Western blot for subsequent experiments. This study was approved by the ethics committee of Tianjin Medical University Cancer Institute and Hospital.
Cell grouping and transfection
BC MDA-MB-468 cells were divided into six groups: blank group (no plasmid transfection), NC group (negative control, transfected empty plasmid), miR-223-3p mimic group (transfected with miR-223-3p mimic plasmid), miR-223-3p inhibitor group (transfected with miR-223-3p inhibitor plasmid), si-ECT2 group (transfected with si ECT2 plasmid) and miR-223-3p mimic+oe-ECT2 group (transfected with miR-223-3p mimic plasmid and ECT2 plasmid). The target plasmids used for cell transfection were purchased from Dharmacon company. MDA-MB-468 cells were inoculated into a six-well plate at a density of 3×10⁵/well. When the cell fusion degree reached 80%, the cells were transfected with Lipofectamine 2,000 kit (Invitrogen Company, USA). The 4 μg of target plasmids and 10 μL of Lipofectamine 2,000 were diluted with 250 μL of serum-free Opti-MEM medium (Gibco Company, USA), then blended lightly; let stand at room temperature for 5 min and mixed them evenly; after 20 min, the mixed solution was added to the culture pore and cultured in a 37°C and 5% CO2 incubator; after 6 h, the 250 μL of serum-free Opti-MEM medium was replaced with complete culture medium; after 48 h, the cells were collected.
Dual luciferase reporter gene assay
The target gene of miR-223-3p was evaluated using the Targetscan online prediction website (http://www.targetscan.org/vert_70/) to verify whether miR-223-3p targets and inhibits ECT2. The full length of the 3ʹ-UTR region of the ECT2 amplified gene was cloned. The PCR products were cloned into the downstream polyclonal sites of the pmirGLO Luciferase gene using SpeI and Hind III endonuclease sites to construct the p ECT2-Wt vector. The PCR site-directed mutagenesis was used to construct the p ECT2-Mut vector. Rellina plasmids and the correctly sequenced luciferase reporter plasmids WT and MUT were co-transfected into HEK-293T cells with miR-223-3p, respectively. After transfection for 48 h, cells were collected and lysed, and centrifuged for 3–5 min to obtain the supernatant. Luciferase activity was detected using luciferase assay kit (Shanghai Biyutian biotechnology Co., Ltd., China).
qRT-PCR
Total RNA was extracted from each group using a Trizol kit (Invitrogen Company, USA). Reverse transcription was carried out using PrimescriptTM RT reagent Kit (Bao Bioengineering (Dalian) Co., Ltd.). The target gene and internal reference gene were amplified by fluorescence quantitative PCR. U6 was used as the internal reference for miR-223-3p, and GAPDH was used as the internal reference for other factors. The mRNA expression levels of miR-223-3p, ECT2, Bax, Bcl-2, vascular endothelial growth factor (VEGF) and TGF-β1 were calculated using the 2–ΔΔCt formula. The formula is as follows: ΔΔCT = ΔT experimental group – ΔCt control group, ΔCt = Ct target gene – Ct internal reference gene. Ct is the number of amplification cycles when the real-time fluorescence intensity of the reaction reaches a set threshold. The experiment was repeated three times. The primer sequences were shown in Table 1.
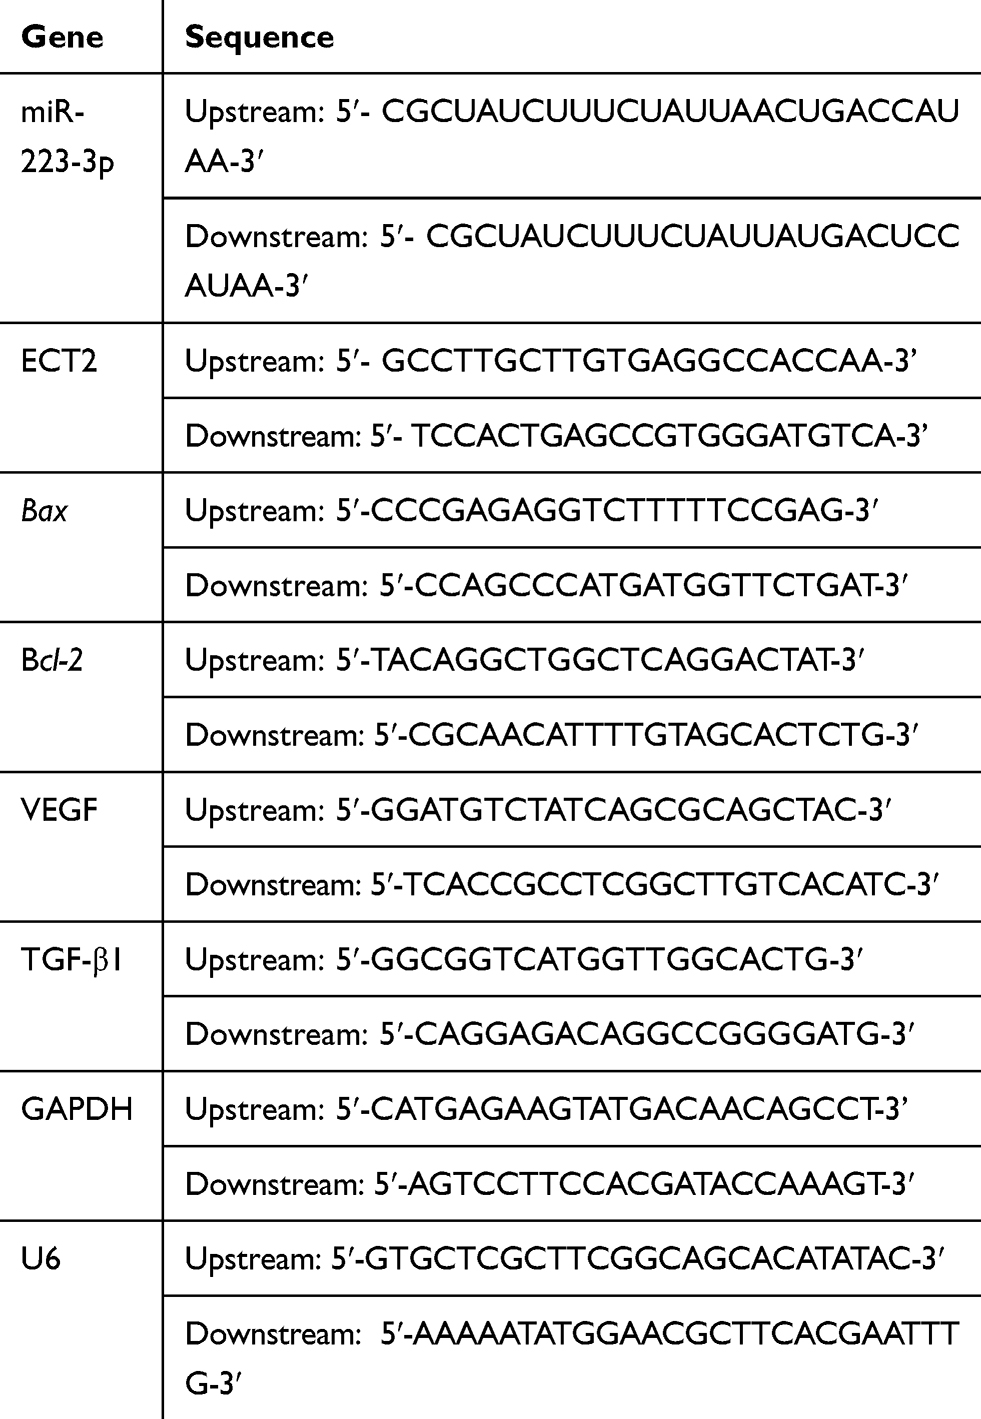 |
Table 1 PCR primer sequences |
Western blot
Total protein was extracted from cells by protein lysate and quantified by BCA method, then separated through electrophoresis and transferred into the membrane. The membrane was blocked with 5% skim milk powder for 1 h, and incubated with 1:2,000 dilute mouse anti-human ECT2 monoclonal antibody, 1:1,000 dilute mouse anti-human Bax monoclonal antibody, 1:1,000 dilute mouse anti-human Bcl-2 monoclonal antibody, 1:1,000 dilute rabbit anti-human VEGF monoclonal antibody and 1:2,000 dilute mouse anti-human TGF-β1 monoclonal antibody for the night at 4°C. Next day, after being washed with TBST three times, for 5 min each time, the membrane was incubated with HRP-labeled goat anti-mouse secondary antibody (1:500 dilution) or HRP-labeled goat anti-rabbit secondary antibody (1:500 dilution) for 1.5 h at room temperature. GAPDH was used as internal reference. All the antibodies were purchased from Abcam company. The membrane was washed with TBST three times and subjectived to a luminescence reaction using the ECL kit (Amersham Life Sciences Company, USA), then placed in an imaging analyzer for development imaging. Analysis was performed using Quantity One software.
CCK-8 method
The MDA-MB-468 cells of each group after transfection for 24 h were placed on a 96-well culture plate, and the cell density was adjusted to 2×10³/mL, and 100 μL of the cell culture medium was added to each well. The culture plate was cultured in a 37°C cell culture incubator, and the cell viability was measured at 0, 24, 48 and 72 h. Ten microliters of CCK8 reagent were added to each well, then incubated at 37°C for 2 h, before detection with a microplate reader and the values being recorded. The optical density (OD) value was 450 nm. Three parallel wells were set in each group, and the average value was taken. The experiment was repeated three times. The cell viability curve was drawn with the time point as the abscissa and OD value as the ordinate.
Flow cytometry
After 24 h of transfection, MDA-MB-468 cells in each group were digested with trypsinase without EDTA and collected in a flow tube. The supernatant was discarded after centrifugation for 30 min at 3,000 r/min. The cells were washed with cold PBS three times, centrifuged at 3,000 r/min for 15 min, and the supernatant was discarded. According to the instructions of Annexin-V-FITC Apoptosis Detection Kit (Sigma Company, USA), Annexin-V-FITC, PI and HEPES buffer solution were prepared into Annexin-V-FITC/PI dye solution at the ratio of 1:2:50. Resuspended 1×10⁶ cells per 100 μL of the dye solution, then shaked and mixed evenly, after incubation at room temperature for 15 mins, 1 mL HEPES buffer solution was added, then shaked and mixed evenly. Annexin-V-FITC and PI (apoptotic cells) fluorescence were, respectively, detected with a band pass filter at 525 nm and 620 nm which excited at a wavelength of 488 nm, and the apoptosis was detected by PI red fluorescence.
Scratch assay
After 24 h of transfection, the cells in each group were inoculated into six-well plates with 5×10⁵/well. When the cell growth fusion degree reached about 90%, the 20-μL sterile tip was used to slightly cross the central axis of the well. Washed the cells with PBS three times to remove the scratched cells, then the serum-free medium was added and cultured in an incubator of 37°C and 5% CO2. Samples were taken at 0 and 24 h. Photographs were taken under an inverted microscope and the scratch distances were measured.
Transwell assay
The 50 mg/L of Matigel matrix glue (Sigma Company, USA) was diluted at a ratio of 1:8. Each chamber was covered with 60 μL diluent on the upper surface of the basement membrane and air-dried at room temperature. The residual liquid in the culture plate was absorbed, and 50 μL of 10 g/L bovine serum albumin (BSA) serum-free medium was added to each well, and left at 37°C for 30 min. After transfection for 24 h, the cells of each group were cultured to the logarithmic growth phase. The logarithmic growth phase cells of each group were taken, and the cell density was adjusted to 1×10⁵ cells/mL with 10 g/L of BSA serum-free medium, and 200 μL cell suspension was added to each transwell chamber. The 500 μL of culture medium containing 10% fetal bovine serum was added into the chamber under 24-well plate, and the transwell chamber was placed in the culture plate and incubated for 24 h in the 37°C and 5% CO2 incubator. After removing the chamber and wiping cells near the surface of the PVPF membrane with a cotton swab, the cells were fixed at room temperature with 95% alcohol for 30 min, stained with crystal violet (Sigma Company, USA) for 20 min, washed with clean water three times, observed and counted under an inverted microscope and photographed.
Statistical analysis
Statistical data were processed and analyzed by SPSS21.0 statistical software. The results of various parameters of the measurement data were expressed as mean ± standard deviation ( ±s). One-way ANOVA was used for comparison among groups, and independent t test was used for comparison between two groups. The enumeration data were expressed by percentage (%). Chi-square test was used for comparison among groups. There is a significant difference at P<0.05.
Results
Dual luciferase reporter gene assay
The biological prediction website http://www.targetscan.org/vert_70/ showed the sequence of the 3ʹ-UTR region of the ECT2 targeted by miR-223-3p, as shown in Figure 1A. The results of the dual luciferase reporter gene system showed that the luciferase signal of the miR-223-3p mimic and p ECT2-Wt co-transfection group was significantly decreased compared with the NC group (P<0.05), while the luciferase signal of the mutant p ECT2-Mut showed no significant difference between the groups (P>0.05), as shown in Figure 1B. Therefore, miR-223-3p can target ECT2.
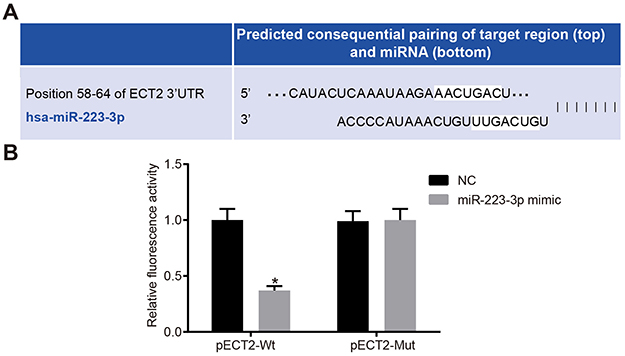 |
Figure 1 Verification of the targeting relationship between miR-223-3p and ECT2. (A) Binding site of miR-223-3P and the 3ʹ-UTR region of ECT2; (B) dual luciferase reporter chart. *Compared with NC group, P<0.05. Abbreviation: ECT2, epithelial cell transforming sequence 2 oncogene. |
The highest expression of ECT2 in MDA-MB-468 cell line
mRNA and protein expressions of ECT2 in each group were detected by qRT-PCR and Western blot (Figure 2), and the mRNA and protein expression of ECT2 in each BC cell line was significantly increased compared with MCF-10A in human normal breast epithelial cells (all P<0.05). Compared with the MDA-MB-468 cell line, the expression of ECT2 in each group was significantly decreased (all P<0.05).
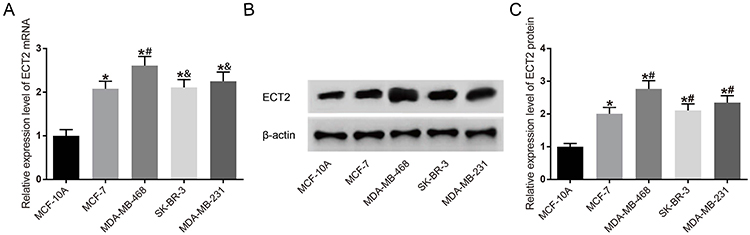 |
Figure 2 Detection of ECT2 expression level in each cell line. (A) mRNA expression of ECT2 in each cell line; (B) Western blot of ECT2; (C) ECT2 protein expression chart. *Compared with MCF-10A group, P<0.05. #Compared with MCF-7 group, P<0.05. &Compared with MDA-MB-468 group, P<0.05. Abbreviation: ECT2, epithelial cell transforming sequence 2 oncogene. |
mRNA expression of related gene after transfection in each group
The results of qRT-PCR showed that there was no significant difference in the mRNA expression of related gene between blank group and NC group (P>0.05, Figure 3). Compared with the NC group, the mRNA expression of Bax in miR-223-3p mimic and si-ECT2 groups were significantly increased, while the mRNA expression of ECT2, Bcl-2, VEGF and TGF-β1 were significantly decreased (all P<0.05). The expression levels of miR-223-3p in the miR-223-3p mimic group and the miR-223-3p mimic+oe-ECT2 group were significantly higher than those in the NC group (P<0.05). There was no significant difference in the expression of miR-223-3p between si-ECT2 group and NC group (both P>0.05). Compared with NC group, the expression of miR-223-3p and Bax mRNA in the miR-223-3p inhibitor group was significantly decreased, while the mRNA expression of ECT2, Bcl-2, VEGF and TGF-β1 were significantly increased (both P<0.05).
 |
Figure 3 mRNA expression of related gene after transfection of each group of cells. *Compared with NC group, P<0.05. #Compared with miR-223-3p mimic group, P<0.05. &Compared with miR-223-3p inhibitor group, P<0.05. %Compared with si-ECT2 group, P<0.05. |
Protein expression of related gene after transfection in each group
Western blot results showed that there was no significant difference in the expression of related gene between the blank group and the NC group (P>0.05, Figure 4). Compared with the NC group, the protein expression of Bax in miR-223-3p mimic and si-ECT2 groups were significantly increased, while the protein expression of ECT2, Bcl-2, VEGF and TGF-β1 were significantly decreased (all P<0.05). Compared with the NC group, the protein expression of Bax in miR-223-3p inhibitor group was significantly decreased, while the protein expression of ECT2, Bcl-2, VEGF and TGF-β1 were significantly increased (both P<0.05). There was no significant difference in the expression of related gene between miR-223-3p mimic+oe-ECT2 group and NC group (both P>0.05).
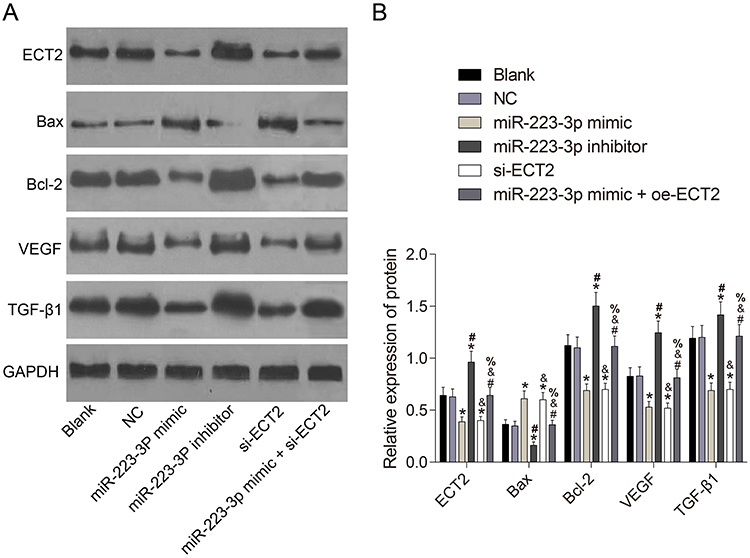 |
Figure 4 Protein expression of related gene after transfection of each group of cells. (A) Western blot; (B) protein expression chart. *Compared with NC group, P<0.05. #Compared with miR-223-3p mimic group, P<0.05. &Compared with miR-223-3p inhibitor group, P<0.05. %Compared with si-ECT2 group, P<0.05. |
Cell viability condition after transfection in each group
There was no significant difference in cell viability between the blank group and the NC group at all time points (P>0.05). Compared with NC group, the cell viability of miR-223-3p mimic and si-ECT2 groups were decreased significantly at 24, 48 and 72 h (all P<0.05), while the cell viability of miR-223-3p inhibitor group was increased significantly at 24, 48 and 72 h (P<0.05). There was no significant difference at all time points between the miR-223-3p mimic+oe-ECT2 group and the NC group (P>0.05). See Figure 5.
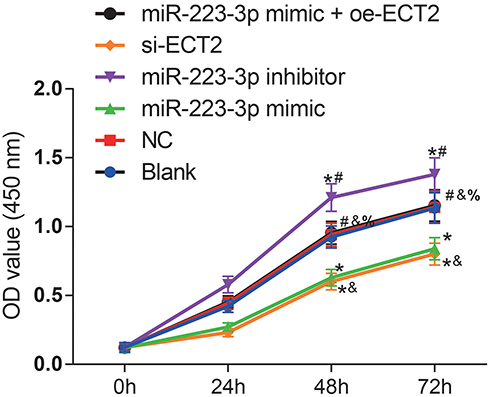 |
Figure 5 Cell viability line chart of each group. *Compared with blank group at the same time point, P<0.05. #Compared with miR-223-3p mimic group at the same time point, P<0.05. &Compared with miR-223-3p inhibitor group at the same time point, P<0.05. %Compared with si-ECT2 group at the same time point, P<0.05. |
Detection of apoptosis after transfection in each group
There was no significant difference in apoptosis rate between the blank group and the NC group (P>0.05). Compared with the NC group, the apoptosis rate of the miR-223-3p mimic and si-ECT2 groups were significantly increased (all P<0.05), while the apoptosis rate of the miR-223-3p inhibitor group was significantly decreased (P<0.05). There was no significant difference in apoptosis rate between the miR-223-3p mimic+oe-ECT2 group and the NC group (P>0.05). See Figure 6.
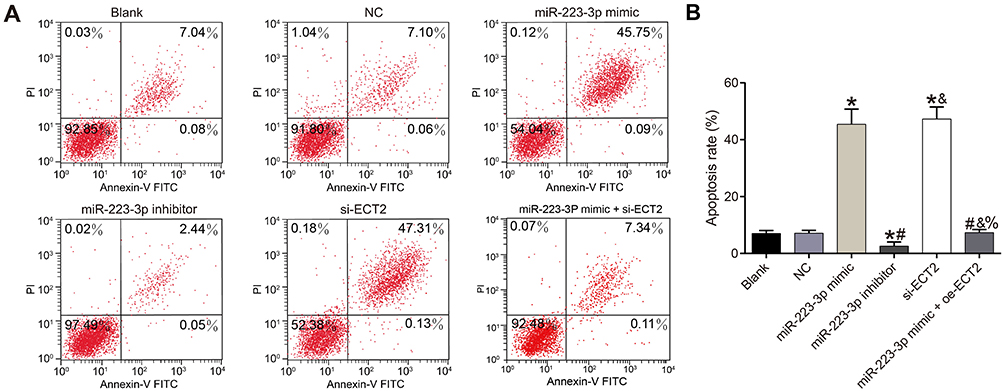 |
Figure 6 Experiment results of flow cytometry. (A) Detection of apoptosis by flow cytometry in each group; (B) Chart of cell apoptosis in each group. *Compared with NC group, P<0.05. #Compared with miR-223-3p mimic group, P<0.05. &Compared with miR-223-3p inhibitor group, P<0.05. %Compared with si-ECT2 group, P<0.05. |
Detection of migration ability after transfection in each group
There was no significant difference in migration ability between the blank group and the NC group (P>0.05). Compared with the NC group, the migration ability of miR-223-3p mimic and si-ECT2 groups were significantly decreased (all P<0.05), while the migration ability of miR-223-3p inhibitor group was significantly increased (P<0.05). There was no significant difference in migration ability between the miR-223-3p mimic+oe-ECT2 group and the NC group (P>0.05). See Figure 7.
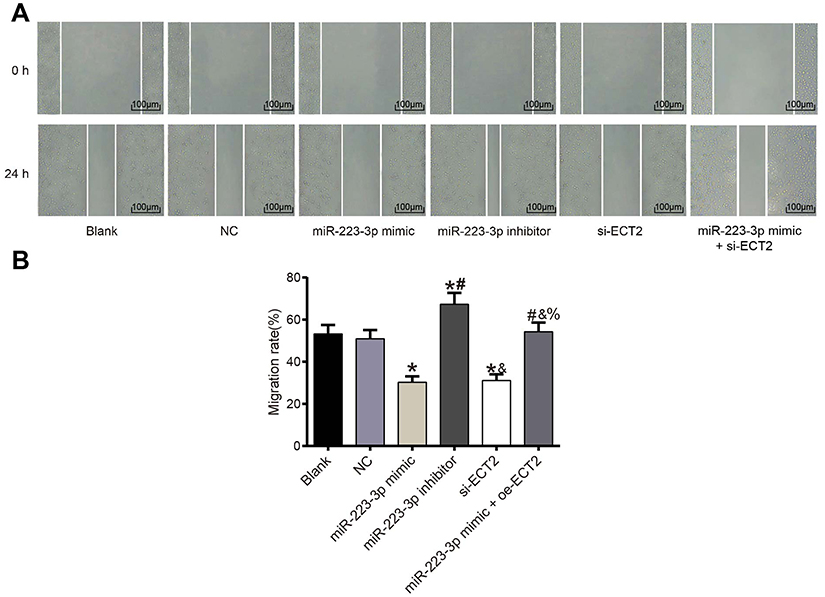 |
Figure 7 Results of cell scratch assay (×100). (A) Scratch assay chart; (B) cell migration and healing rate in each group. *Compared with NC group, P<0.05. #Compared with miR-223-3p mimic group, P<0.05. &Compared with miR-223-3p inhibitor group, P<0.05. %Compared with si-ECT2 group, P<0.05. |
Detection of invasion ability after transfection in each group
There was no significant difference in invasion ability between the blank group and the NC group (P>0.05). Compared with the NC group, the invasion ability of the miR-223-3p mimic and si-ECT2 groups was significantly decreased (all P<0.05), while the invasion ability of the miR-223-3p inhibitor group was significantly increased (P<0.05). There was no significant difference in invasion ability between the miR-223-3p mimic+oe-ECT2 group and the NC group (P>0.05). See Figure 8.
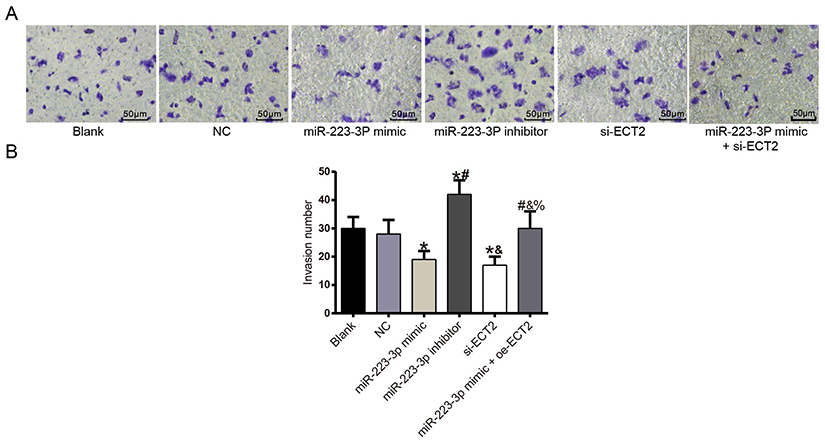 |
Figure 8 Cell invasion experiment diagram (×200). (A) Invasion experiment results; (B) number of cell invasion in each group. *Compared with NC group, P<0.05. #Compared with miR-223-3p mimic group at the same time point, P<0.05. &Compared with miR-223-3p inhibitor group, P<0.05. %Compared with si-ECT2 group, P<0.05. |
Discussion
Breast cancer (BC) refers to the malignant tumor located in the epithelial tissue of the breast. The incidence of BC has been increasing in recent years and the majority of BC patients are women, which has become one of the major public health issues in the current society.14 Surgical treatment, radiotherapy and chemotherapy, and endocrine therapy are common therapies in clinic. With deepening understanding of the biological behavior of BC, the application of biological targeting therapy is gradually becoming widespread.15 miRNA is an endogenous, small-molecule non-coding RNA discovered in recent years which can regulate gene expression and translation and thus participate in biological activities such as proliferation and apoptosis of tumor cells.16 The migration and invasion of tumor cells has been confirmed to be an important factor in the recurrence and metastasis of tumors, while distant metastasis is an important cause of poor prognosis and death of tumor patients.17–19 Based on the molecular mechanism of invasion and migration of BC cells, this study confirmed that miR-223-3p can protect the invasion and migration of BC cells by targeting and inhibiting ECT2.
Shi et al. found high expression of ECT2 in lung cancer patients’ tissues through genomic scale analysis, and ECT2 could be used as an important marker for diagnosis and prognosis of human lung cancer.20 In addition, it has also been confirmed that ECT2 silencing can inhibit invasion and migration of BC cells by regulating actin cytoskeleton remodeling.21 First, this study detected the expression of ECT2 in each BC cell line and found that the expression was highest in MDA-MB-468 cell line, so this cell line was selected for subsequent experiments.
Vascular endothelial growth factor (VEGF) is secreted by some tumor cells and has the function of inducing angiogenesis. It can promote the production of tumor vessels and the proliferation of tumor cells by binding the corresponding receptors in vascular endothelium.22–24 When discussing the relationship between TGF-β1 and the characteristics of BC stem cells, some studies have found that TGF-β1 can promote the ability of self-renewal, invasion and migration of BC stem cells, as well as enhancing the stem cell characteristics, thus playing a significant role in the progress of BC disease.25–27 qRT-PCR and Western blot experiments confirmed that compared with the blank group, the mRNA and protein expression of apoptosis-promoting gene Bax were significantly increased in the miR-233-3p overexpression group and the ECT2 gene silencing group, while the mRNA and protein expression of apoptosis-inhibiting genes Bcl-2, VEGF and TGF-β1 were significantly decreased and the changes in the combined group were more significant (P<0.05). The significant downregulation of ECT2 expression in the miR-223-3p mimic group further confirmed that miR-223-3p could regulate the expression of ECT2. The biological behavior of cancer cells is an important marker reflecting the progress and severity of cancer.28–30 In order to explore how miR-223-3p and ECT2 are involved in the regulation of biological characteristics of BC cells, CCK8 and flow cytometry were used to detect the cell viability and apoptosis in each group. It was found that overexpression of miR-223-3p or inhibition of ECT2 expression could inhibit the enhancement of BC cell viability and promote cell apoptosis. Scratch and transwell experiments confirmed the value of miR-223-3p overexpression and inhibition of ECT2 gene expression in inhibiting cell migration and invasion. The above studies confirmed that miR-223-3p could target and inhibit ECT2 and regulate the invasion and migration of BC cells. This study confirmed the role of miR-223-3p and ECT2 in BC from the level of cell experiments, which has certain guiding significance for clarifying the molecular mechanism of BC pathogenesis and progress.
In conclusion, miR-223-3p can target and inhibit the expression of ECT2, promotes the apoptosis of BC cells, inhibits the proliferation, invasion and migration of BC cells, and plays a protective role in the progression of BC. This study provides a new molecular targeted therapeutic target for the treatment of BC, but whether miR-223-3p affects the biological characteristics of BC cells through downstream signaling pathways needs further research.
Acknowledgements
We are particularly grateful to all the people who have given us help on our article. This work was supported by Natural Science Foundation of Tianjin (18JCYBJC91600).
Disclosure
The authors report no conflicts of interest in this work.
References
1. Clement JH, Sänger J, Höffken K. Expression of bone morphogenetic protein 6 in normal mammary tissue and breast cancer cell lines and its regulation by epidermal growth factor. Int J Cancer. 1999;80:250–256. doi:10.1002/(sici)1097-0215(19990118)80:2<250::aid-ijc14>3.0.co;2-d
2. Zhu Z, Shen W, Tian S, Yang B, Zhao H. F3, a novel active fraction of Valeriana jatamansi Jones induces cell death via DNA damage in human breast cancer cells. Phytomedicine. 2018;57:245–254. doi:10.1016/j.phymed.2018.12.041
3. Hong J, Kim Y, Cho J, et al. Clinical features and prognosis of breast cancer with gastric metastasis. Oncol Lett. 2019;17:1833–1841. doi:10.3892/ol.2018.9754
4. Xu Y, Zhang Y, Cai X, et al. Large-scale synthesis of monodisperse Prussian blue nanoparticles for cancer theranostics via an “in situ modification” strategy. Int J Nanomedicine. 2018;14:271–288. doi:10.2147/IJN.S183858
5. Chou SD, Murshid A, Eguchi T, Gong J, Calderwood SK. HSF1 regulation of β-catenin in mammary cancer cells through control of HuR/elavL1 expression. Oncogene. 2015;34:2178–2188. doi:10.1038/onc.2014.177
6. Burstein HJ, Elias AD, Rugo HS, et al. Phase II study of sunitinib malate, an oral multitargeted tyrosine kinase inhibitor, in patients with metastatic breast cancer previously treated with an anthracycline and a taxane. J Clin Oncol. 2008;26:1810–1816. doi:10.1200/JCO.2007.14.5375
7. Rezaei M, Cao J, Friedrich K, et al. The expression of VE-cadherin in breast cancer cells modulates cell dynamics as a function of tumor differentiation and promotes tumor-endothelial cell interactions. Histochem Cell Biol. 2018;149:15–30. doi:10.1007/s00418-017-1619-8
8. Guan X, Gao Y, Zhou J, et al. miR-223 regulates adipogenic and osteogenic differentiation of mesenchymal stem cells through a C/EBPs/miR-223/FGFR2 regulatory feedback loop. Stem Cells. 2015;33:1589–1600. doi:10.1002/stem.1947
9. Han J, Zhao F, Zhang J, et al. miR-223 reverses the resistance of EGFR-TKIs through IGF1R/PI3K/Akt signaling pathway. Int J Oncol. 2016;48:1855–1867. doi:10.3892/ijo.2016.3401
10. Li G, Cai M, Fu D, et al. Heat shock protein 90B1 plays an oncogenic role and is a target of microRNA-223 in human osteosarcoma. Cell Physiol Biochem. 2012;30:1481–1490. doi:10.1159/000343336
11. Fabris L, Berton S, Citron F, et al. Radiotherapy-induced miR-223 prevents relapse of breast cancer by targeting the EGF pathway. Oncogene. 2016;35:4914–4926. doi:10.1038/onc.2016.23
12. Mansour M, Haupt S, Chan AL, et al. The E3-ligase E6AP represses breast cancer metastasis via regulation of ECT2-Rho signaling. Cancer Res. 2016;76:4236–4248. doi:10.1158/0008-5472.CAN-15-1553
13. Xu J, Yao Q, Hou Y, et al. MiR-223/Ect2/p21 signaling regulates osteosarcoma cell cycle progression and proliferation. Biomed Pharmacother. 2013;67:381–386. doi:10.1016/j.biopha.2013.03.013
14. Donnelly SK, Cabrera R, Mao SPH, et al. Rac3 regulates breast cancer invasion and metastasis by controlling adhesion and matrix degradation. J Cell Biol. 2017;216:4331–4349. doi:10.1083/jcb.201704048
15. Khanna C. Leveraging comparative oncology in the hopes of improving therapies for breast cancer. Semin Oncol. 2017;44:301. doi:10.1053/j.seminoncol.2017.11.003
16. Wu X, Zeng R, Wu S, Zhong J, Yang L, Xu J. Comprehensive expression analysis of miRNA in breast cancer at the miRNA and isomiR levels. Gene. 2015;557:195–200. doi:10.1016/j.gene.2014.12.030
17. Deng X, Zhao Y, Wang B. miR-519d-mediated downregulation of STAT3 suppresses breast cancer progression. Oncol Rep. 2015;34:2188–2194. doi:10.3892/or.2015.4160
18. Renjie W, Haiqian L. MiR-132, miR-15a and miR-16 synergistically inhibit pituitary tumor cell proliferation, invasion and migration by targeting Sox5. Cancer Lett. 2015;356:568–578. doi:10.1016/j.canlet.2014.10.003
19. Rahal OM, Wolfe AR, Mandal PK, et al. Blocking interleukin (IL)4- and IL13-mediated phosphorylation of STAT6 (Tyr641) decreases M2 polarization of macrophages and protects against macrophage-mediated radioresistance of inflammatory breast cancer. Int J Radiat Oncol Biol Phys. 2018;100:1034–1043. doi:10.1016/j.ijrobp.2017.11.043
20. Shi YX, Yin JY, Shen Y, Zhang W, Zhou HH, Liu ZQ. Genome-scale analysis identifies NEK2, DLGAP5 and ECT2 as promising diagnostic and prognostic biomarkers in human lung cancer. Sci Rep. 2017;7:8072. doi:10.1038/s41598-017-08615-5
21. Wang HK, Liang JF, Zheng HX, Xiao H. Expression and prognostic significance of ECT2 in invasive breast cancer. J Clin Pathol. 2018;71:442–445. doi:10.1136/jclinpath-2017-204569
22. Toi M, Kondo S, Suzuki H, et al. Quantitative analysis of vascular endothelial growth factor in primary breast cancer. Cancer. 1996;77:1101–1106. doi:10.1002/(sici)1097-0142(19960315)77:6<1101::aid-cncr15>3.0.co;2-5
23. Simon T, Gagliano T, Giamas G. Direct effects of anti-angiogenic therapies on tumor cells: VEGF signaling. Trends Mol Med. 2017;23:282–292. doi:10.1016/j.molmed.2017.01.002
24. Kim J, Hong SW, Kim S, et al. Cyclooxygenase-2 expression is induced by celecoxib treatment in lung cancer cells and is transferred to neighbor cells via exosomes. Int J Oncol. 2018;52:613–620. doi:10.3892/ijo.2017.4227
25. Taylor MA, Sossey-Alaoui K, Thompson CL, Danielpour D, Schiemann WP. TGF-β upregulates miR-181a expression to promote breast cancer metastasis. J Clin Invest. 2013;123:150–163. doi:10.1172/JCI64946
26. Zu X, Zhong J, Tan J, et al. TGF-β1 induces HMGA1 expression in human breast cancer cells: implications of the involvement of HMGA1 in TGF-β signaling. Int J Mol Med. 2015;35:693–701. doi:10.3892/ijmm.2015.2062
27. Aula H, Skyttä T, Tuohinen S, et al. Decreases in TGF-β1 and PDGF levels are associated with echocardiographic changes during adjuvant radiotherapy for breast cancer. Radiat Oncol. 2018;13:201. doi:10.1186/s13014-018-1150-7
28. Hamurcu Z, Delibaşı N, Geçene S, et al. Targeting LC3 and Beclin-1 autophagy genes suppresses proliferation, survival, migration and invasion by inhibition of Cyclin-D1 and uPAR/Integrin β1/Src signaling in triple negative breast cancer cells. J Cancer Res Clin Oncol. 2018;144:415–430. doi:10.1007/s00432-017-2557-5
29. Ekambaram P, Lee JL, Hubel NE, et al. The CARMA3-Bcl10-MALT1 signalosome drives NFκB activation and promotes aggressiveness in angiotensin II receptor-positive breast cancer. Cancer Res. 2018;78:1225–1240. doi:10.1158/0008-5472.CAN-17-1089
30. Pal A, Dziubinski M, Di Magliano MP, et al. Usp9x promotes survival in human pancreatic cancer and its inhibition suppresses pancreatic ductal adenocarcinoma in vivo tumor growth. Neoplasia. 2018;20:152–164. doi:10.1016/j.neo.2017.11.007
 © 2019 The Author(s). This work is published and licensed by Dove Medical Press Limited. The
full terms of this license are available at https://www.dovepress.com/terms
and incorporate the Creative Commons Attribution
- Non Commercial (unported, 3.0) License.
By accessing the work you hereby accept the Terms. Non-commercial uses of the work are permitted
without any further permission from Dove Medical Press Limited, provided the work is properly
attributed. For permission for commercial use of this work, please see paragraphs 4.2 and 5 of our Terms.
© 2019 The Author(s). This work is published and licensed by Dove Medical Press Limited. The
full terms of this license are available at https://www.dovepress.com/terms
and incorporate the Creative Commons Attribution
- Non Commercial (unported, 3.0) License.
By accessing the work you hereby accept the Terms. Non-commercial uses of the work are permitted
without any further permission from Dove Medical Press Limited, provided the work is properly
attributed. For permission for commercial use of this work, please see paragraphs 4.2 and 5 of our Terms.