Back to Journals » Journal of Pain Research » Volume 9
Minimally important differences for Patient Reported Outcomes Measurement Information System pain interference for individuals with back pain
Authors Amtmann D, Kim J, Chung H, Askew R, Park R, Cook K ![]()
Received 27 August 2015
Accepted for publication 19 January 2016
Published 27 April 2016 Volume 2016:9 Pages 251—255
DOI https://doi.org/10.2147/JPR.S93391
Checked for plagiarism Yes
Review by Single anonymous peer review
Peer reviewer comments 3
Editor who approved publication: Dr Michael Schatman
Dagmar Amtmann,1 Jiseon Kim,1 Hyewon Chung,2 Robert L Askew,3 Ryoungsun Park,4 Karon F Cook5
1Department of Rehabilitation Medicine, University of Washington, Seattle, WA, USA; 2Department of Education, Chungnam National University, Daejeon, Republic of Korea; 3Department of Psychology, Stetson University, Deland, FL, USA; 4Theoretical and Behavioral Foundations Division, Wayne State University, Detroit, MI, USA; 5Department of Medical Social Science, Northwestern University, Chicago, IL, USA
Background: The minimally important difference (MID) refers to the smallest change that is sufficiently meaningful to carry implications for patients' care. MIDs are necessary to guide the interpretation of scores. This study estimated MID for the Patient Reported Outcomes Measurement Information System (PROMIS) pain interference (PI).
Methods: Study instruments were administered to 414 people who participated in two studies that included treatment with low back pain (LBP; n=218) or depression (n=196). Participants with LBP received epidural steroid injections and participants with depression received antidepressants, psychotherapy, or both. MIDs were estimated for the changes in LBP. MIDs were included only if a priori criteria were met (ie, sample size ≥10, Spearman correlation ≥0.3 between anchor measures and PROMIS-PI scores, and effect size range =0.2–0.8). The interquartile range (IQR) of MID estimates was calculated.
Results: The IQR ranged from 3.5 to 5.5 points. The lower bound estimate of the IQR (3.5) was greater than mean of standard error of measurement (SEM) both at time 1 (SEM =2.3) and at time 2 (SEM =2.5), indicating that the estimate of MID exceeded measurement error.
Conclusion: Based on our results, researchers and clinicians using PROMIS-PI can assume that change of 3.5 to 5.5 points in comparisons of mean PROMIS-PI scores of people with LBP can be considered meaningful.
Keywords: minimally important differences, pain interference, back pain, Patient Reported Outcomes Measurement Information System, responsiveness, PROMIS
Introduction
Low back pain (LBP) is a common problem that most people experience at some point during their life. LBP has an enormous impact at individual and societal level throughout the world. The social, cognitive, emotional, and physical consequences of pain on daily living have been referred to as pain interference (PI).1,2 The National Institutes of Health (NIH) funded a Patient Reported Outcomes Measurement Information System (PROMIS) initiative, which developed an Item Response Theory (IRT)-based item bank for measuring PI that has demonstrated the validity and reliability.3,4 IRT-based instruments reduce respondents’ burden by allowing the computerized adaptive testing (CAT) and tailored short forms while maintaining adequate reliability.5,6
Minimally important difference (MID) provides an estimate of how much change or difference people consider meaningful.7 MID has been estimated for the 10-item PROMIS-PI short form in a sample of patients with advanced-stage cancer (4–6 points).8
There are multiple methods of estimating MIDs, but two of the most common are the anchor-based and distribution-based approaches, which are often used in conjunction.9,10 In the anchor-based approach, known indicators (called anchors) are used as a reference to evaluate the MID, while the distribution-based method employs statistical characteristics of the spread of data such as the standard deviation, the standard error of measurement (SEM), or effect size to estimate important differences.9,11,12 Each of these methods has shortcomings and advantages. The detailed discussion of these approaches is given elsewhere.13–16
In this study, we estimated PROMIS-PI MID using data collected by CAT in two clinical samples undergoing treatment for back pain and depression. The two studies used a harmonized data collection protocol because pain and depression often co-occur, and one of the purposes of the original data collection was to examine the relationship between depression and pain.17–20 To maximize the sample size, we combined data from two studies. Even though the sample of participants with depression received a treatment for depression, participants were asked to specifically rate pain intensity of their back pain and we used their rating of back pain in estimating MID.
MIDs are often context specific and depend on the population of interest. The purpose of this study was to estimate MID for people with LBP to provide clinicians and researchers with guidance on interpretation of the PROMIS-PI scores.
Methods
Participants
Data from two studies designed to examine sensitivity to change of the PROMIS instruments were used to estimate the MID of LBP: epidural steroid injection (n=218) and depression (n=196) study. Participants in both studies received a treatment in order to examine sensitivity to change, but the studies were not designed to examine treatment effectiveness. Study measures were administered to research participants at baseline (n=414) and 368 participants completed follow-up 1 month later. Inclusion criteria for both studies were: age 18 or older, willing and able to give informed consent, and English-speaking (able to read and understand English). The participants in the LBP participants were required to have had LBP for at least 6 weeks and be scheduled for a spinal injection. Inclusion criteria for the depression study required participants to be in outpatient treatment for major depressive disorder with a minimum score of 12 on the 17-item Hamilton Rating Scale for Depression21,22 and receiving treatment with antidepressants, psychotherapy, or both, within the first 4-month duration at the Western Psychiatric Institute and Clinic and its affiliates.23 Because the study protocols were harmonized, participants in the depression study were also asked about back pain. The LBP study was conducted at the University of Washington in Seattle and the depression study was conducted at the University of Pittsburgh.
All participants provided informed consent to participate in this research. All study procedures were approved by the human subjects division of the University of Washington and the University of Pittsburgh. Per Federal regulations 45 CFR 46.117(d)(2), the human subjects division granted the research a waiver of documentation of informed consent (see http://www.hhs.gov/ohrp/humansubjects/guidance/45cfr46.html#46.117). This research activity met the requirements for a waiver, given the following: the research involved no more than minimal risk of harm to subjects, and the research involved no procedures for which written consent is normally required outside of the research context. Thus, while participants provided informed consent, it was not ‘written’; participants were provided with a written information statement regarding the research, as required by the human subjects division.
Measures
The PROMIS-PI is a set of 44 items calibrated to IRT. PROMIS scores are reported on an IRT-based T-score metric (mean =50; standard deviation [SD] =10) with the mean representing the US general population matched on sex, age, and race to the 2000 US Census.5,24 Centering the PROMIS T-scores on the general population mean provides an immediate reference point (eg, a score of 60 in PROMIS-PI is one SD worse than is the score reported by the US general population).
The PROMIS-PI was administered using CAT. CAT maximizes precision and minimizes response burden, by tailoring items to individual levels of the trait being measured.6 Participants answered a minimum of four items. The CAT stopped when 12 items had been reached or the SEM was ≤3.0. These were the rules used by all PROMIS studies and they are the default settings for the PROMIS Assessment Center.
Several anchor measures were used for estimating MID values. Pain intensity was assessed by asking, “In the past 7 days, when you had back/leg pain, how would you rate your average pain?” and “In the past 7 days, how intense was your worst back/leg pain?”. A 0–10 response scale was used with higher scores indicating greater pain intensity. The Brief Pain Inventory (BPI) PI subscale25 was also administered. Higher scores on the BPI indicate greater PI. The Roland-Morris Disability Questionnaire is a 24-item disability measure.26 Respondents indicate whether an item is true for them or not. Higher scores mean greater levels of disability.
Analyses
The minimally important change refers to meaningful change based on the longitudinal within-person scores, while the MID is used to refer to meaningful differences based on cross-sectional between-person scores.27,28 This study uses both cross-sectional and longitudinal analyses in estimating meaningful differences. As a result, we use the term MID to communicate that cross-sectional anchors were used in the estimate.
Cross-sectional analyses compared scores in clinically distinct subgroups within each time point. Longitudinal analyses compared changes in scores between time 1 and time 2. To ensure the robustness of our results, we only estimated MIDs when three a priori criteria were met: 1) Spearman correlations between scores on the anchor measures and PROMIS-PI scores were at least 0.3; 2) sample sizes for comparison groups were at least 10; and 3) the absolute values of the effect sizes were within a plausible range defined as 0.2–0.8.8,29,30
Cross-sectional analyses
We defined three clinically distinct subgroups based on average and worst back (or leg) pain intensity: 0–3=none/mild; 4–6=moderate; 7–10=severe.8,31 MID estimates were defined as the absolute mean score differences between adjacent subgroups. Effect sizes were calculated by dividing mean adjacent subgroup score differences by the overall SD for the sample at each time point.13 Analyses were conducted for both time 1 and time 2.
Longitudinal analyses
For longitudinal MID estimate calculations, subsets of participants were selected who had a certain amount of score changes on anchor measures (eg, greater than published MID estimates, but not substantially greater).8 For average and worst back (or leg) pain intensity items, this was operationalized as a two- or three-point change (either positive or negative).8,32 For multi-item measures, it was defined as increase or decrease at least as great as the published MID, but no more than two times the MID8; for the Roland-Morris Disability Questionnaire, this was a change of 5–10 points.33 For the BPI PI subscale, this was set as a change of at least 1/2 SD (ie, 1.48 points at time 1 in our study), but no more than 1 SD (ie, 2.96 points in our study).8,11 In each subsample defined by the above criteria, we calculated the absolute mean changes in PROMIS-PI scores. Effect sizes were estimated by dividing mean changes by the overall SD at time 1.13
Summary and comparisons
We computed the interquartile range (IQR) of all usable MID estimates that met a priori criteria, rounded to the nearest half-integer.8 We then compared results with two mean SEMs (ie, lower bound estimate was compared with the baseline SEM, and to follow-up SEM).
If the lower bound estimate was smaller than the two mean SEMs, then the lower bound would be set to the larger mean SEM and be increased to the next half-integer to make certain that MID estimates exceeded measurement error.8 Data management, preparation, and all statistical analyses were carried out using SAS version 9.3 (SAS Institute Inc., Cary, NC, USA).34
Results
Participants
Table 1 shows the demographics and clinical characteristics of the whole sample as well as by diagnosis. Based on the Patient Health Questionnaire-9 score,35 53% of the participants were categorized as having at least moderate depression (≥10). Approximately 68% had experienced moderate-to-severe back pain in the past 7 days (ie, average back pain intensity ≥4).
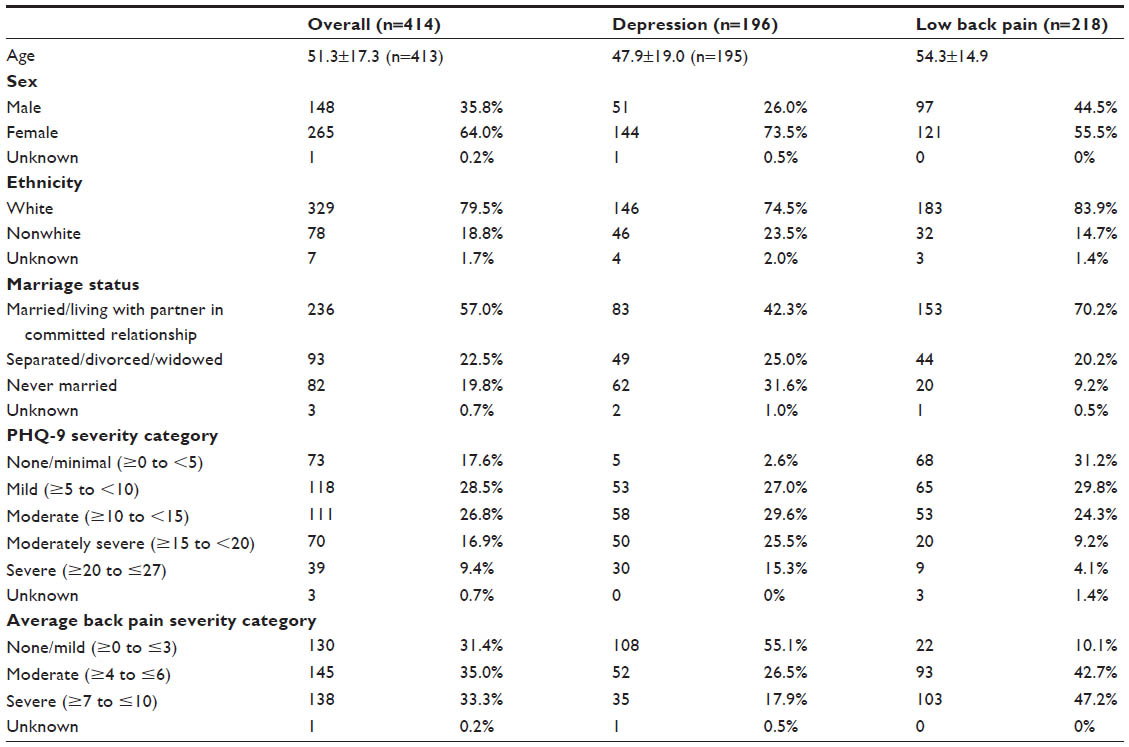 | Table 1 Sample characteristics of overall, low back pain, and depression groups at time 1 |
MID estimates
Of 28 potential MID estimates, 15 (54%) met a priori criteria for inclusion. The most common reason for not including MID estimates was that the effect sizes were out of the suggested range; seven were larger than 0.8 and four were smaller than 0.2. For 2 of the 28, correlations between anchor measure scores and PROMIS-PI scores were <0.3. None were excluded because of sample size smaller than 10. The IQR of MID estimates for the PROMIS-PI ranged from 3.5 to 5.5 points (after being rounded to the nearest half-integer), with the corresponding effect size ranging from 0.34 to 0.54 SD.
The lower bound estimate of this IQR (3.5) was greater than the two mean SEMs (ie, 2.3 at time 1 and 2.5 at time 2), indicating that the range of MID exceeded measurement error.
Discussion
MIDs provide important information for interpreting differences in mean scores. MID estimates for PI can be used to evaluate treatment effectiveness and differences between groups. This study estimated the MID for PROMIS-PI scores in people with LBP to range from 3.5 to 5.5 points (effect size of 0.34–0.54 SD). The estimated range is similar to the PROMIS-PI MID estimated in people with cancer (ie, 4–6 points) and the MIDs are similar for scores based on the short form and CAT administration.8 In addition, these estimates are similar to the 1/2 SD estimates that have been suggested as reflecting meaningful change in health-related quality of life measures for people with chronic diseases.11
The results should be interpreted in the context of limitations of the study. To achieve adequate sample size, we combined data from two studies. The treatments in the two studies differed. The epidural steroid injection was intended to lower pain, but the depression treatment did not target pain, though treatments for depression have been reported to lower pain.36
And finally, we included MID estimates only if a priori criteria previously used by Yost et al8 for estimating MID for selected PROMIS measures were met. As a result, MID estimates with corresponding effect sizes <0.2 were excluded because they are not likely to be important and MID estimates with corresponding effect sizes >0.8 were removed because they are not minimal.8 While these rules are reasonable, excluding too small or too big effect sizes may have moved the MID estimates to the vicinity of 0.5 SD. As a result, the support for the general MID of 0.5 SD may be somewhat weaker.
In summary, we found change of 3.5 points or more on PROMIS-PI to be a reasonable estimate of what constitutes a meaningful change. These results can inform future studies by informing power analyses and defining responders.
Acknowledgments
Research reported in this paper was supported by the National Institutes of Health (NIH) through the NIH Roadmap for Medical Research, Grant U01AR052171 to University of Washington. Information on the “Dynamic Assessment of Patient-Reported Chronic Disease Outcomes” can be found at http://nihpromis.org. The content is solely the responsibility of the authors and does not necessarily represent the official views of the NIH.
Disclosure
The authors report no conflicts of interest in this work.
References
Riley WT, Rothrock N, Bruce B, et al. Patient-reported outcomes measurement information system (PROMIS) domain names and definitions revisions: further evaluation of content validity in IRT-derived item banks. Qual Life Res. 2010;19(9):1311–1321. | |
Dworkin RH, Turk DC, Farrar JT, et al. Core outcome measures for chronic pain clinical trials: IMMPACT recommendations. Pain. 2005;113(1–2):9–19. | |
Kim J, Chung H, Amtmann D, Revicki DA, Cook KF. Measurement invariance of the PROMIS pain interference item bank across community and clinical samples. Qual Life Res. 2013;22(3):501–507. | |
Amtmann D, Cook KF, Jensen MP, et al. Development of a PROMIS item bank to measure pain interference. Pain. 2010;150(1):173–182. | |
Pilkonis PA, Choi SW, Reise SP, et al. Item banks for measuring emotional distress from the Patient-Reported Outcomes Measurement Information System (PROMIS®): depression, anxiety, and anger. Assessment. 2011;18(3):263–283. | |
Cook KF, O’Malley KJ, Roddey TS. Dynamic assessment of health outcomes: time to let the CAT out of the bag? Health Serv Res. 2005;40(5 Pt 2):1694–1711. | |
Wyrwich KW, Bullinger M, Aaronson N, et al. Estimating clinically significant differences in quality of life outcomes. Qual Life Res. 2005;14(2):285–295. | |
Yost KJ, Eton DT, Garcia SF, Cella D. Minimally important differences were estimated for six Patient-Reported Outcomes Measurement Information System-Cancer scales in advanced-stage cancer patients. J Clin Epidemiol. 2011;64(5):507–516. | |
Bedard G, Zeng L, Lam H, et al. Meaningful change in oncology quality-of-life instruments: a systematic literature review. Expert Rev Pharmacoecon Outcomes Res. 2012;12(4):475–483. | |
Wong K, Zeng L, Zhang L, et al. Minimal clinically important differences in the brief pain inventory in patients with bone metastases. Support Care Cancer. 2013;21(7):1893–1899. | |
Norman GR, Sloan JA, Wyrwich KW. Interpretation of changes in health-related quality of life: the remarkable universality of half a standard deviation. Med Care. 2003;41(5):582–592. | |
Copay AG, Subach BR, Glassman SD, Polly DW Jr, Schuler TC. Understanding the minimum clinically important difference: a review of concepts and methods. Spine J. 2007;7(5):541–546. | |
Yost KJ, Eton DT. Combining distribution- and anchor-based approaches to determine minimally important differences: the FACIT experience. Eval Health Prof. 2005;28(2):172–191. | |
Eton DT, Cella D, Yost KJ, et al. A combination of distribution- and anchor-based approaches determined minimally important differences (MIDs) for four endpoints in a breast cancer scale. J Clin Epidemiol. 2004;57(9):898–910. | |
de Vet HC, Ostelo RW, Terwee CB, et al. Minimally important change determined by a visual method integrating an anchor-based and a distribution-based approach. Qual Life Res. 2007;16(1):131–142. | |
Cella D, Eton DT, Lai JS, Peterman AH, Merkel DE. Combining anchor and distribution-based methods to derive minimal clinically important differences on the Functional Assessment of Cancer Therapy (FACT) anemia and fatigue scales. J Pain Symptom Manage. 2002;24(6):547–561. | |
Edwards RR, Klick B, Buenaver L, et al. Symptoms of distress as prospective predictors of pain-related sciatica treatment outcomes. Pain. 2007;130(1-2):47–55. | |
Turner RJ, McLean PD. Physical disability and psychological distress. Rehabil Psychol. 1989;34(4):225–242. | |
Banks SM, Kerns RD. Explaining high rates of depression in chronic pain: a diathesis–stress framework. Psychol Bull. 1996;119(1):95–110. | |
Ohayon MM, Schatzberg AF. Using chronic pain to predict depressive morbidity in the general population. Arch Gen Psychiatry. 2003;60(1):39–47. | |
Hamilton M. A rating scale for depression. J Neurol Neurosurg Psychiatry. 1960;23(1):56–62. | |
Hamilton M. Development of a rating scale for primary depressive illness. Br J Soc Clin Psychol. 1967;6(4):278–296. | |
Pilkonis PA, Yu L, Dodds NE, Johnston KL, Maihoefer CC, Lawrence SM. Validation of the depression item bank from the Patient-Reported Outcomes Measurement Information System (PROMIS®) in a three-month observational study. J Psychiatr Res. 2014;56:112–119. | |
Liu H, Cella D, Gershon R, et al. Representativeness of the patient-reported outcomes measurement information system internet panel. J Clin Epidemiol. 2010;63(11):1169–1178. | |
Cleeland C. Measurement of pain by subjective report. In: Chapman C, Loeser J, eds. Advances in Pain Research and Therapy. Volume 12: Issues in Pain Measurement. New York: Raven Press; 1989:391–403. | |
Roland M, Morris R. A study of the natural history of back pain. Part I: development of a reliable and sensitive measure of disability in low-back pain. Spine (Phila Pa 1976). 1983;8(2):141–144. | |
de Vet HC, Beckerman H, Terwee CB, Terluin B, Bouter LM. Definition of clinical differences. J Rheumatol. 2006;33(2):434; author reply 435. | |
Beaton DE, Bombardier C, Katz JN, et al. Looking for important change/differences in studies of responsiveness. OMERACT MCID Working Group. Outcome Measures in Rheumatology. Minimal Clinically Important Difference. J Rheumatol. 2001;28(2):400–405. | |
Yost KJ, Cella D, Chawla A, et al. Minimally important differences were estimated for the Functional Assessment of Cancer Therapy-Colorectal (FACT-C) instrument using a combination of distribution- and anchor-based approaches. J Clin Epidemiol. 2005;58(12):1241–1251. | |
Revicki D, Hays RD, Cella D, Sloan J. Recommended methods for determining responsiveness and minimally important differences for patient-reported outcomes. J Clin Epidemiol. 2008;61(2):102–109. | |
Butt Z, Wagner LI, Beaumont JL, et al. Use of a single-item screening tool to detect clinically significant fatigue, pain, distress, and anorexia in ambulatory cancer practice. J Pain Symptom Manage. 2008;35(1):20–30. | |
Farrar JT, Young JP Jr, LaMoreaux L, Werth JL, Poole RM. Clinical importance of changes in chronic pain intensity measured on an 11-point numerical pain rating scale. Pain. 2001;94(2):149–158. | |
Stratford PW, Binkley JM, Riddle DL, Guyatt GH. Sensitivity to change of the Roland-Morris Back Pain Questionnaire: part 1. Phys Ther. 1998;78(11):1186–1196. | |
SAS Institute Inc. Base SAS® 9.3 Procedures Guide. Cary, NC: SAS Institute Inc.; 2011. | |
Spitzer RL, Kroenke K, Williams JB. Validation and utility of a self-report version of PRIME-MD: the PHQ primary care study. Primary Care Evaluation of Mental Disorders. Patient Health Questionnaire. JAMA. 1999;282(18):1737–1744. | |
Teh CF, Zaslavsky AM, Reynolds CF, Cleary PD. Effect of depression treatment on chronic pain outcomes. Psychosom Med. 2010;72(1):61–67. |
 © 2016 The Author(s). This work is published and licensed by Dove Medical Press Limited. The
full terms of this license are available at https://www.dovepress.com/terms
and incorporate the Creative Commons Attribution
- Non Commercial (unported, 3.0) License.
By accessing the work you hereby accept the Terms. Non-commercial uses of the work are permitted
without any further permission from Dove Medical Press Limited, provided the work is properly
attributed. For permission for commercial use of this work, please see paragraphs 4.2 and 5 of our Terms.
© 2016 The Author(s). This work is published and licensed by Dove Medical Press Limited. The
full terms of this license are available at https://www.dovepress.com/terms
and incorporate the Creative Commons Attribution
- Non Commercial (unported, 3.0) License.
By accessing the work you hereby accept the Terms. Non-commercial uses of the work are permitted
without any further permission from Dove Medical Press Limited, provided the work is properly
attributed. For permission for commercial use of this work, please see paragraphs 4.2 and 5 of our Terms.