Back to Journals » Therapeutics and Clinical Risk Management » Volume 19
Mini Percutaneous Nephrolithotomy vs Standard Percutaneous Nephrolithotomy: A Perioperative Decision Support System for Surgical Success Comparison
Authors Gencer K ![]()
Received 25 October 2023
Accepted for publication 17 December 2023
Published 29 December 2023 Volume 2023:19 Pages 1075—1086
DOI https://doi.org/10.2147/TCRM.S444519
Checked for plagiarism Yes
Review by Single anonymous peer review
Peer reviewer comments 2
Editor who approved publication: Professor Garry Walsh
Kerem Gencer
Afyonkarahisar Health Sciences University, Department of Distance Education Application and Research Center, Afyonkarahisar, Turkey
Correspondence: Kerem Gencer, Email [email protected]
Purpose: This study aimed to rank the features that are important in terms of safety and effectiveness in choosing the surgical method and providing appropriate care to the patient by using the variables examined before and after the surgery to evaluate the success of mini percutaneous nephrolithotomy and standard percutaneous nephrolithotomy surgeries.
Patients and Methods: The features evaluated before and after surgery were ranked according to their importance in the features considered, using Multivariate Adaptive Regression Splines (MARS), LASSO, Ridge, Elastic_net, and Random Forest algorithms as variable selection techniques. There are 278 samples in the relevant data set.
Results: Type of surgery (100%), intercostal access (97.75%), kidney opening procedure (94.25%), postoperative creatinine (59.22%), hydronephrosis (52.23%), the number of entries (41.61%), and pre- and post-operative hemoglobin difference (45.13%) were determined as the most critical variables. The MARS algorithm showed the most successful performance, with the lowest mean absolute error (MAE) value of 0.3622, the lowest root mean square error (RMSE) value of 0.3960, and the highest R2 value of 0.3405.
Conclusion: Clinical decision support systems can be helpful in eliminating errors and reducing costs. It can also improve the quality of healthcare and aid in the early diagnosis of diseases. Computer-aided decision-making systems can be developed using the results of such products. These systems can provide doctors with better information about their patient’s treatment options and improve decision-making. It can contribute to patients being better informed about the surgery results and taking an active role. In conclusion, this study provides essential information that should be included in the surgical decision-making process for patients using medications and with a history of percutaneous nephrolithotomy.
Keywords: digital decision in healthcare, percutaneous nephrolithotomy, surgery success, machine learning, MARS
Introduction
Surgical methods have been used for many years in the treatment of diseases. The experience of each patient during the operation period is different. Many factors determine this. Which disease is treated, which surgical intervention is performed, and which patient’s general health status is the most critical risk factor affecting the operation? Surgical intervention may be required for the treatment of many different diseases. Multiple surgical interventions can be applied in the treatment of additional conditions. Therefore, some surgical interventions are various. It is aimed at ensuring that both the doctor and the patient can get the best result. It is essential for the patient to prepare himself for the surgery and to know what he expects from the surgery. While some patients pay attention to every detail while making this decision, others hope their relatives will find the best for them without participating in any decision. Usually, after the patient’s diagnosis, a certain period passes for surgical intervention. During this period, some laboratory tests and radiological tests are performed. During this period, the patient can obtain information about their health problems from their environment and from some former patients. They can discuss the course of the disease and treatment alternatives with their relatives. Thus, he feels psychologically ready for surgical intervention. There are essential points that every patient should talk to and learn from their doctor before surgery. The patient should ask his doctor to give him information about his illness. In addition, he should discuss all kinds of treatment possibilities and possible side effects of this disease with his doctor and decide what is the best option for him. For the patient to permit surgical intervention from his doctor, the doctor must inform the patient about the condition of the disease, why surgical intervention is required, what the purpose of the surgical intervention is, how the surgery will be performed, the benefits of the surgical intervention, the risks of the surgical intervention, and other reasons. When all these are evaluated, significant benefits can be achieved in improving the quality of healthcare services, early diagnosis of diseases, preventing medical errors, providing appropriate treatment to patients, and reducing costs.1
In this article, information is provided about a research study that compares the results of mini percutaneous nephrolithotomy and standard percutaneous nephrolithotomy methods based on the findings of a clinical study.
Some of the key benefits and objectives of such studies may include:
Patient Safety: Research endeavors to determine which treatment method is safer. Patient safety is a significant component of healthcare services, and reducing or preventing side effects is paramount. Specific precautions and protocols that can be implemented during such a study to ensure patient safety include ethical permissions and human experiments, experienced surgeons and staff, risk assessment, infection control, data security, tracking and tracing, medication management, information and communication, and an incident reporting system. Such precautions and protocols help protect patient safety and ensure surgical research is performed safely and ethically. It should be applied meticulously to minimize the risks of surgical interventions and maximize patient care.2–4
Comparing Treatment Options: Studies of this nature assist in evaluating how different treatment options can be reached regarding patient safety, effectiveness, and success rates. The goal is to provide the best possible care to patients.
Improving Treatment Outcomes: Such studies contribute to developing more effective and successful treatments by evaluating the outcomes of surgical interventions. Consequently, patients’ recovery processes and quality of life may improve.
Early Disease Diagnosis: Research findings can provide valuable insights into the early diagnosis and intervention of diseases. This can lead to patients receiving treatment at an earlier stage, potentially preventing disease progression.
Data Analysis Methods: The data analysis methods mentioned in the article (Ridge, Lasso, Elastic_net, MARS, Random Forest) can assist in identifying which factors influence treatment success. This, in turn, allows for the development of better treatment strategies.
Decision Support Systems: The results of such research can be used to develop clinical decision support systems. These systems can provide doctors with better information about their patient’s treatment options and enhance decision-making.
In conclusion, studies of this nature offer the potential for patients to receive improved care, more effective treatment of diseases, and enhanced guidance for healthcare professionals. Additionally, data analysis methods and computer-assisted decision-making play a significant role in medicine, contributing to improving treatment processes.
Materials and Methods
This study aimed to compare the effectiveness and reliability of mini and standard percutaneous nephrolithotomies in patients with a history of percutaneous nephrolithotomies and open kidney surgery. The variables assessed before and after the surgery were sequenced according to significance. Focusing on some embedded algorithms such as random forest, multivariate adaptive regression curves, LASSO, Ridge, Elastic_net, and Random Forest, their performances in variable selection were compared. These methods represent different approaches. While Ridge and Elastic_net use regularization to highlight essential variables in the dataset and reduce overfitting, Lasso also performs variable selection. While MARS handles complexity in the dataset, Random Forest combines predictions from multiple trees as an ensemble method and provides variable-importance sequencing. Since these algorithms are sensitive to different analysis angles and data set characteristics, they can provide a more comprehensive analysis. They complement each other because they have different strengths and weaknesses, so it is possible to obtain more robust results when used together. This section briefly describes the algorithms and machine-learning techniques used in the study.
Multivariate Adaptive Regression Splines
A fully data-driven, non-linear, non-parametric regression method is multivariate adaptive regression curves (MARS).5 For x ϵ R, below is the basis function.

The point is that each function in the expression k above is worth a fragmented linear twist. This bending goal, expressed in the xj pair and xij, is attained by value nodes. The sum of all fundamental operations is represented here.
Above in the expression k is each function k worth fragmented linear is twist is the point. This bending purpose reflected xj couple xjiis to obtain through nodes of value. The combination of all essential functions is shown below.
Random Forest
Breiman suggested the RF algorithm as an ensemble learning method.6 This method trains and forecasts the sample data using several decision trees with the same distribution.7 Combining decision-making guidelines from a collection of information with tags and qualities, a non-parametric supervised learning technique known as a decision tree uses the tree’s structure to solve classification and regression issues. The ensemble model’s base learner (regression tree) should be as uncorrelated as possible to achieve an ensemble model with excellent generalizability.8
Least Absolute Shrinkage and Selection Operator (LASSO)
In 1996,9 by LASSO, Robert Tibshirani developed small squares of the method aim L1 normed to the function adds a penalty term. According to the LASSO estimate maker,

Equation with is specified. Here,

is
LASSO, in its definition, is understandable about variable selection, and this feature him-her-it variable the number of lots is biological data of the sets in the analysis most lots choice made an inconsistent vote of the methods someone he has done. But LASSO is a high dimensional data set for benefit, although there are multiple connection problems in the presence of many recommendations.10
Ridge Regression
The ridge regression method is biased, which is the parameter estimation with the slightest variance in the presence of multiple linear correlations. The Ridge regression method was first developed by Hoerl and Kennard (1970) in 1970.11 Hoerl and Kennard presented a detailed discussion of the unbiased estimation problem in regression.12 The solution technique of Ridge regression is similar to the simple least squares method. In the Ridge regression method, the reversal is performed before calculating the coefficient estimates by adding a small and positive constant to the diagonal elements of the (X’X) matrix formed by the variables in standard form. (β0,β1,…,βp)T chosen to minimize the remaining sum of squares (RSS):yi result and xi=(xi1,xi2,…,xip)T i. Let be the covariate vector for the case. The most popular estimation method is known as the least squares fitting procedure with coefficients (β0,β1,…,βp)T chosen to minimize the remaining sum of squares (RSS):
Ridge regression of coefficients is a little different, and most members download predictions to be made apart from the smallest to square lots that are similar to ridge regression coefficient predictions i most member downloading values.

Here, λ≥0 is the regularization parameter or complexity parameter that controls the amount of shrinkage to be set separately (the setting parameter): λ The larger the value, the more significant the amount of shrinkage.
Ridge regression over makes up to reduce significant regression coefficients by shrinking prediction his mistake improves. Still, partner variable selection does not perform, so the model is more to make it an interpretable helper, not.13–15
Elastic_net
Ridge and LASSO regression of your methods interbreeding aspect expression that can be this The method was proposed by Zou and Hastie in 2005.16 Elastic-net estimation maker,

Equation with is specified. Here λ shrinkage parameter expression. α a punishment parameter is the LASSO estimate when α =1 when α =0 is selected. If Ridge guesses, the originator is done. Elastic_net estimation originator for Values of α between 0 and 1 (different from 0 and 1) to receive means is coming. In this case, the Elastic_net method, to a certain extent, multiple connections your problem that it solves and the variable selection duty you have undertaken shows. λ and α parameters of optimization for usually k -k-story cross from the k-fold cross-validation technique are used.
Feature Selection
Feature selection has received a lot of attention lately. Large data sets have created new problems and increased the demand for efficient machine-learning techniques. Methods for feature selection are becoming increasingly necessary.17 Some of the original features are selected 18 using the feature selection approach.
By utilizing an index to compare various feature subsets, traditional feature selection methods select the best one. Depending on whether the selection process is supervised or unsupervised, the index often assesses the ability of relevant subsets to be grouped or classified. The significant computational complexity of the search in these methods presents a challenge when used on large datasets.18,19 Genetic algorithms (GA) have recently been used to provide reliable methods for determining the best subset for any given evaluation indices.20 For big and medium datasets, GA-based feature selection approaches have typically been proven to perform better than other heuristics; however, they also take a significant amount of computation time for large datasets.21
Since these data often have high dimensions, analyzing and making decisions becomes difficult. In theory and practice, feature selection has succeeded in processing high-dimensional data and improving learning efficiency.20,21
In their 1997 work, Dash and Liu17 identified potential areas for feature selection research, introduced newcomers to the discipline, and paved the way for practitioners seeking suitable approaches for domain-specific real-world applications. An unsupervised feature selection approach ideal for large data sets size was introduced by Mitra et al in 2002.19 Numerous fields use feature selection, including image recognition,22,23 image capture,24,25 intrusion detection,26 bioinformatics data processing,27 and diagnostics.28 Additionally, feature selection approaches are statistical according to the theoretical idea.29,30 It has been used in various fields, including information theory.31
Filter, Wrapper, and Embedded algorithms are the three categories in which feature selection methods are most frequently included in the literature. “embedded methods” refers to algorithms that use internal measurements to determine the most critical details.
Ridge and Elastic_net
These regression methods consider the relationship between multiple independent variables (predictor variables) in the data set. Ridge regression uses L2 regularization, while Elastic_net combines L1 and L2 regularization. These algorithms help identify essential variables in the data set and reduce overfitting.
Lasso
Lasso regression automates variable selection by making some independent variables in the data set zero, using L1 regularization. Therefore, it is used to eliminate unimportant or redundant arguments.
Mars
This algorithm is a regression method that can handle the complexity of data and capture interactions between variables. It helps identify complex relationships and examine interactions of variables. Many studies in the literature use this method.32–35
Random Forest
Random Forest is a tree-based ensemble learning method that combines multiple decision tree predictions. This algorithm detects essential features in the data set and improves prediction performance.
These methods represent different approaches. These algorithms are sensitive to different analysis angles and dataset characteristics, so they can provide a more comprehensive analysis when used together. They complement each other because they have different strengths and weaknesses, so it is possible to achieve more robust results when used together.
Experiment
This study was carried out with consent from the ethics committee. Every stage of the preparation and conduct of the study was carried out by the World Medical Association’s Declaration of Helsinki. All participants gave written informed consent before participating in the study.
The study included 278 individuals who underwent secondary percutaneous nephrolithotomy. The trial was not open to children with coagulopathy, skeletal or urinary system abnormalities, pregnant women, or children under 18 years of age. R 4.0.2 was used as the software environment for statistical calculation and visualization. Features were selected using five algorithms: MARS, Random Forest, Ridge, Lasso, and Elastic_net.
Comparing metrics such as MAE (Mean Absolute Error), RMSE (Root Mean Square Error), and R2 to evaluate the performance of variable selection is essential to assess the results of the analyses and assist in method selection. These measurements show how accurate the predictions are and how well the model fits. However, considering the clinical or practical significance of differences between these measurements is also essential.
MAE (Mean Absolute Error): MAE represents the average absolute differences between predicted and actual values. A lower MAE indicates that the estimates are closer. Clinically, lower MAE may help predict patients’ health status more accurately and make better treatment decisions.
RMSE (Root Mean Square Error): RMSE represents the mean of the root mean square errors between predicted and actual values. A lower RMSE indicates that the estimates are closer. RMSE is a measure of accuracy similar to MAE.
R2 measures how well the independent variables explain the dependent variable. An R2 approach indicates that the independent variables explain the dependent variable well. This shows how well the model fits. Clinically, a high R2 may mean the model better explains patients’ health conditions.
Results
Descriptive statistics for quantitative variables are shown in Figure 1. Stone length, stone width, hydronephrosis, pre-and post-operative HGB difference, post-operative Hemoglobin (HGB), post-operative hematocrit (HTC), post-operative Blood Urea Nitrogen (BUN), post-operative creatinine, surgery time (min), nephrostomy time and length of hospital stay are included in this chart. Mean values are shown on the graph.
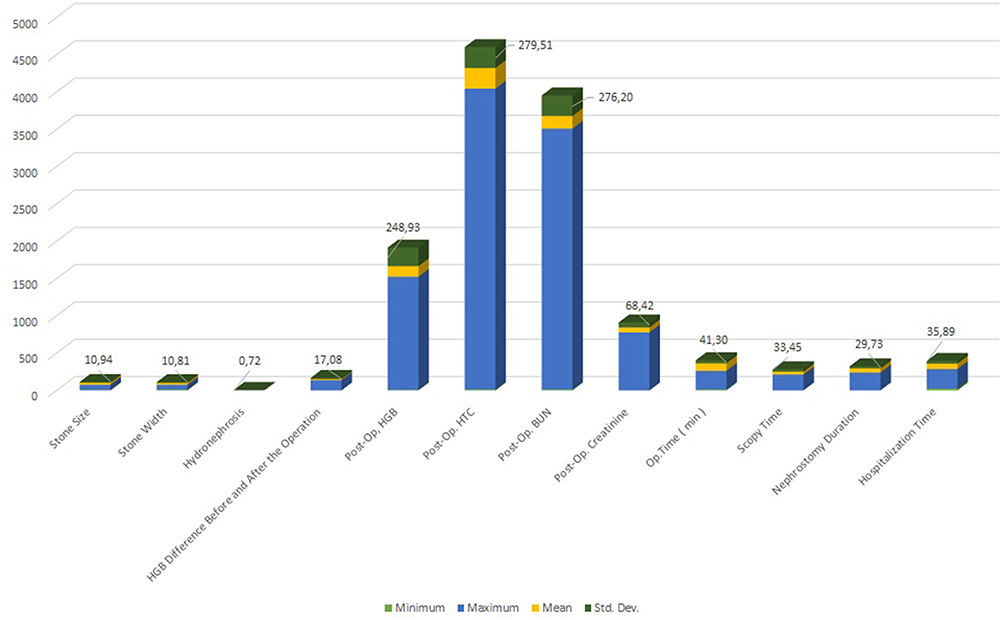 |
Figure 1 Quantitative Variables for Descriptive Statistics. |
Descriptive statistics for qualitative variables are presented in Figure 2. The variables in this figure are the type of operation, the procedure used to open the kidney, the entry site, the number of entries, the intercostal access, the lithotripsy device, the method used to remove the stone, and the surgical outcome. Percentages and frequencies of qualitative variables are given in the chart.
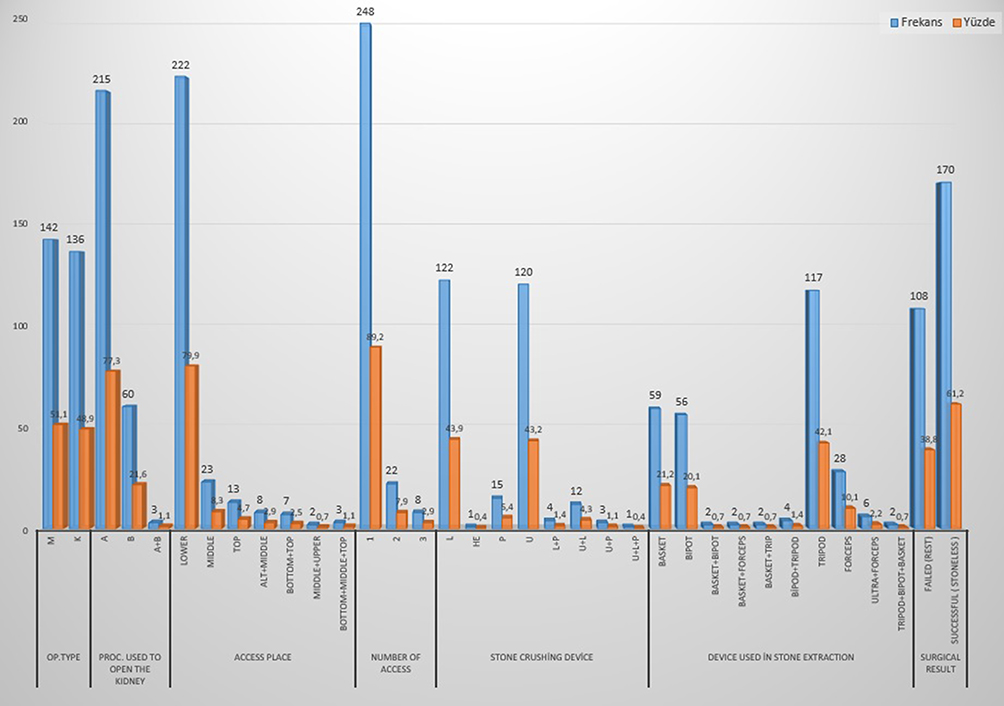 |
Figure 2 Qualitative Variables for Descriptive Statistics. |
Variable importance evaluation findings for the Ridge, Lasso, and Elastic_net algorithms are presented in Table 1. Operation Type, Intercostal Access, Renal Opening Procedure, postoperative creatinine, and hydronephrosis are the top 5 features of the Ridge algorithm type of operation, intercostal access, creatinine after surgery, lithotripsy equipment, and HGB. The five most crucial characteristics were determined using the Lasso algorithm by comparing the differences before and after the procedure. Operation Type, Intercostal Access, Kidney Opening Method, post-operative creatinine, and Hydronephrosis are the five most essential features obtained with the Elastic_net algorithm. The lithotripsy device and the HGB Difference before and after the operation, which differ from the other two methods in the Lasso algorithm, are noteworthy.
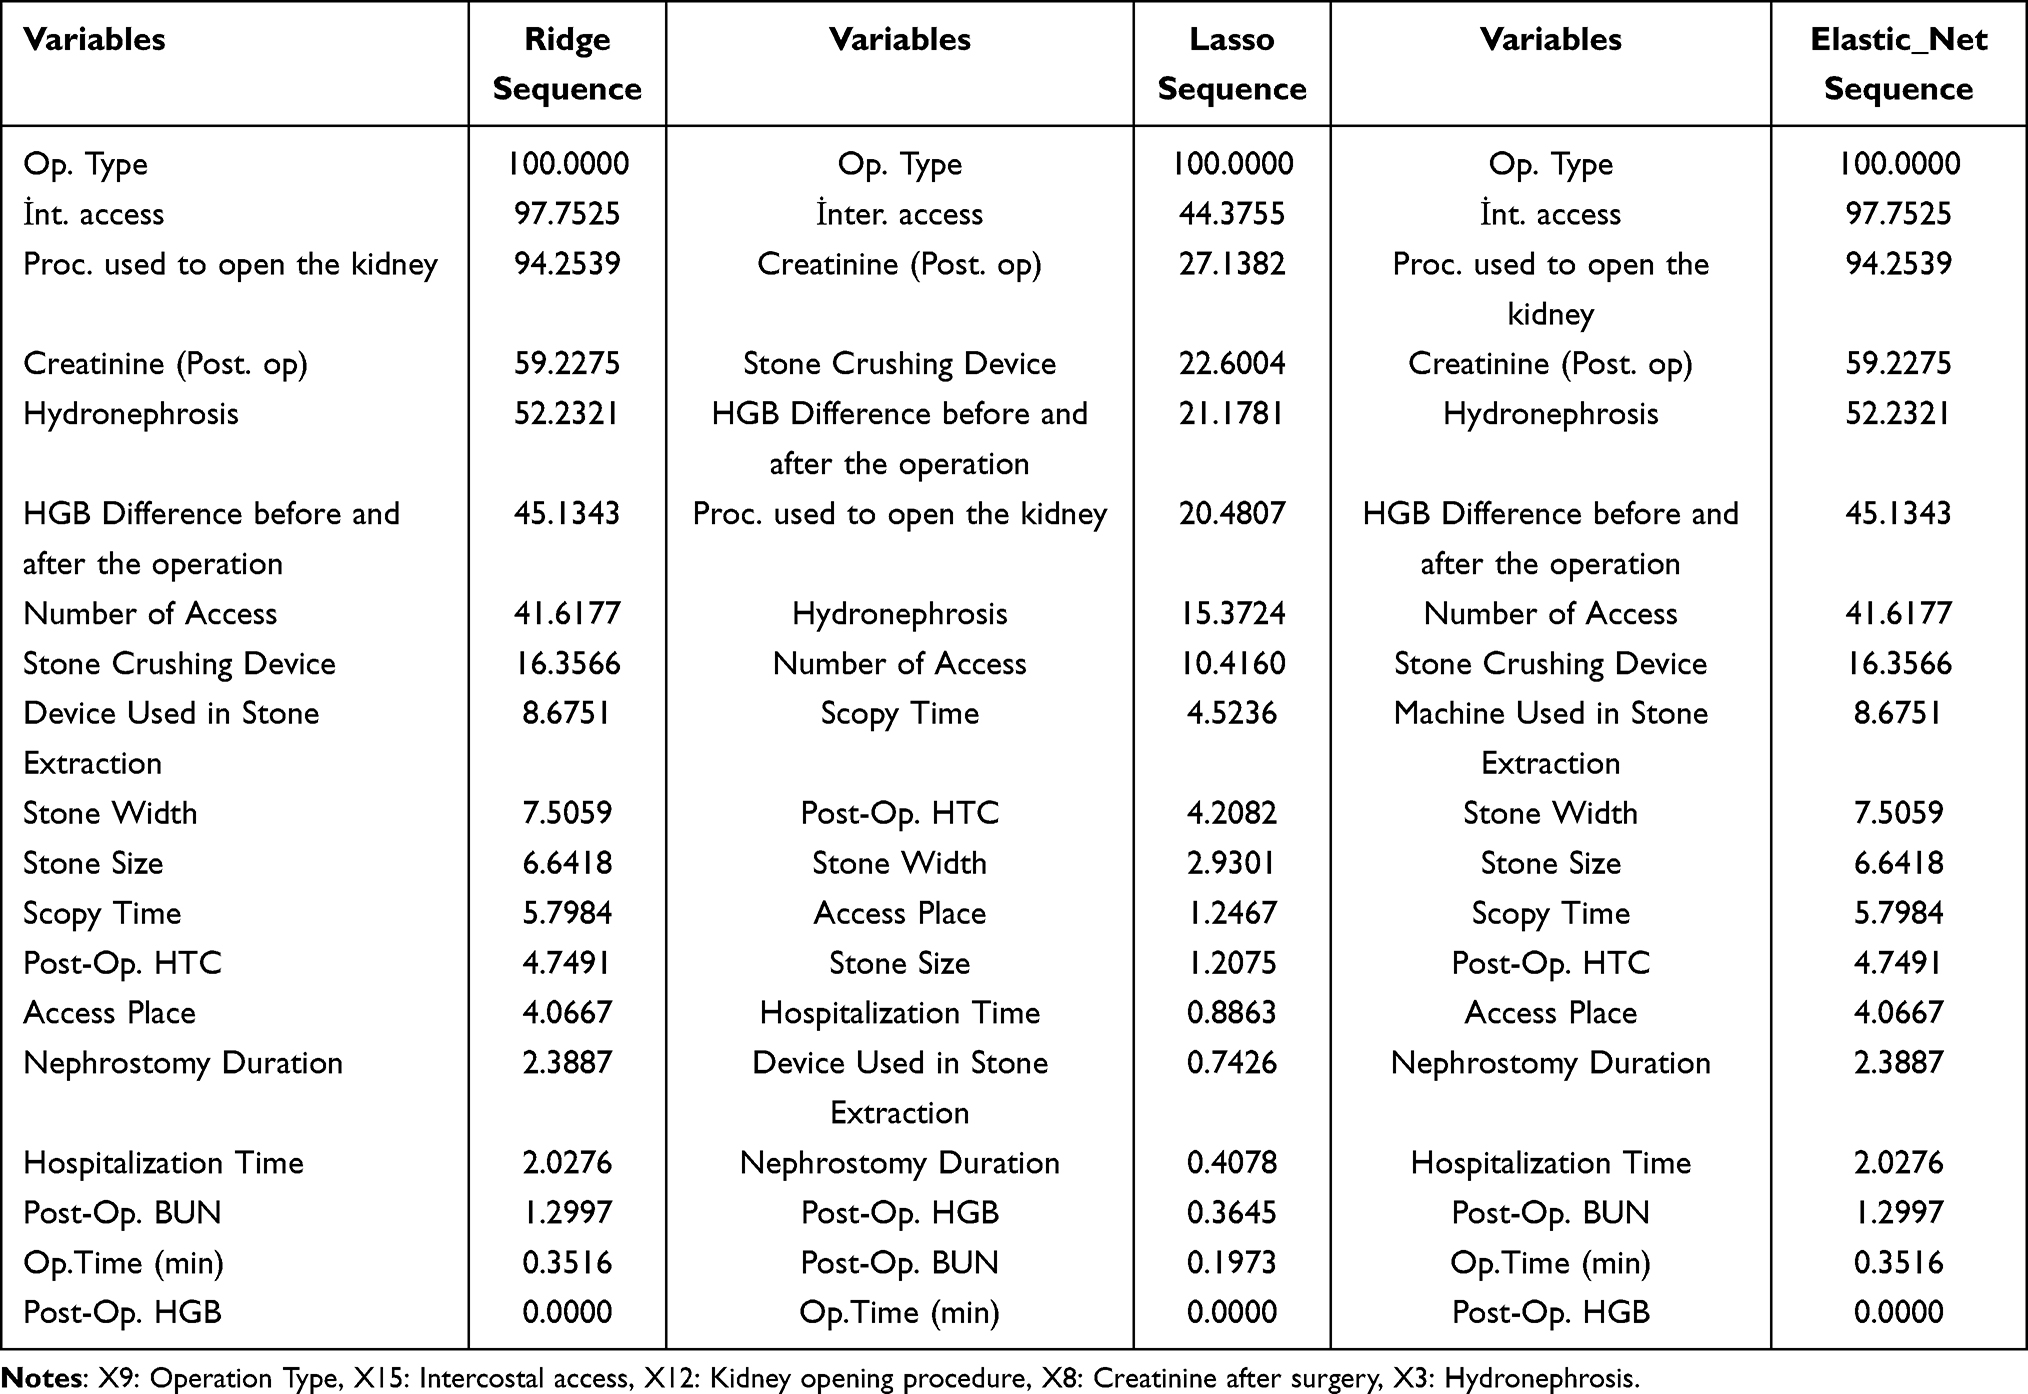 |
Table 1 Results of Variable Importance Evaluation for Ridge, Lasso, and Elastic_net Algorithms |
Regression algorithms such as Ridge, Lasso, and Elastic Net were used to prevent the model’s overfitting and determine the importance of the variables. Variables with higher sequencings contribute more to the model’s predictions and are, therefore, more critical. That is, the higher the sequence value of a variable, the greater the effect of the variable on the model results.
Factors that vary in common importance in the three algorithms are Operation Type, Intercostal Access, and Hydronephrosis. The ridge algorithm and Elastic_net algorithm obtained variables with the same extent. Additionally, the variable importance performances of the Ridge, Lasso, and Elastic_net algorithms are given in Figure 3.
 |
Figure 3 Variable Significance Performances for Lasso, Ridge, and Elastic_net algorithms, respectively. |
In Table 2, variable selection performance comparisons were made for Ridge, LASSO, Elastic_net, Random Forest, and MARS algorithms used in feature selection. For model comparison, MAE, RMSE, and R2 performances were evaluated. The MARS algorithm, which had the lowest MAE and RMSE of 0.3622 and 0.3960 and the highest R2 value of 0.3405, showed the most successful performance, respectively. 0.4169 MAE and 0.4543 Elastic_net algorithm showed the lowest performance. The MARS algorithm has the highest performance.
 |
Table 2 Performance Comparison of Variable Selection for Algorithms Used in Feature Selection |
Figure 4 shows the RMSE Performances for Ridge, Lasso, and Elastic_net algorithms.
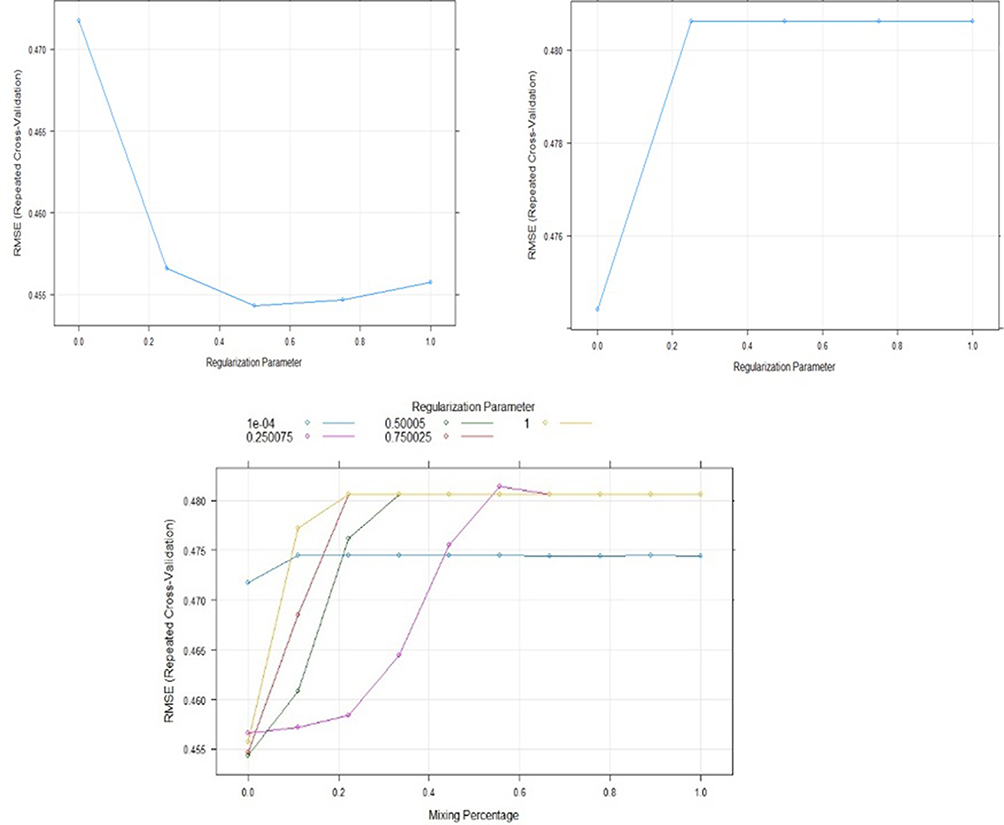 |
Figure 4 RMSE Performances for Ridge, Lasso, and Elastic_net algorithms. |
Recommendations
Based on the study’s results, the effects of the variables identified in the survey of surgical success can be examined for future research directions and potential applications of the findings in clinical practice. This information can help surgeons optimize their operations and help patients recover faster. Study results can be used in the development of clinical decision support systems. These systems can help doctors recommend the best surgical approach for patients. The need for patients to be prepared before surgery and be aware of the procedure, emphasized in the study, deserves further research for patient education and awareness. This can help patients make more informed decisions. The findings could be used to develop personalized medicine applications. Customized treatment plans that consider the importance of variables can be created to determine the most appropriate treatment approach for each patient. This can help intervene in the early stages of diseases and make treatment more effective. The study may also play a role in developing computer-assisted medicine applications. Analyzing data more quickly and effectively can help doctors make better decisions. These recommendations can be starting points for further integrating the study’s results into clinical practice and medical research. Future research may contribute to further appreciating these findings and better patient care and treatment.
Discussion
In this study, stone length, stone width, hydronephrosis, pre-and post-operative HGB difference, post-operative HGB, post-operative HTC, post-operative BUN, post-operative creatinine, surgery time (min), nephrostomy time and hospital stay, type of surgery, kidney Variables such as the procedure used in the opening, entry location, number of entries, intercostal entry, lithotripsy device, stone removal device are listed in order of importance using different techniques. Clinicians commonly use hydronephrosis to guide decision-making. Leo et al, 201736 obtained additional findings regarding the stone’s inability to fall on its own and its relationship with the size of the stone. Jendeberg et al (2017)37 showed that the location and size of the stone play a vital role in self-excretion. In our study, the Stone Crushing Device and the Device Used for Stone Removal are among the essential features of the Elastic_net method. Li et al (2020)38 found that risk factors for bleeding requiring selective artery embolization include the number of ports, stone type, HT, and urinary tract infections. In our study, access number Ridge (41.67%) and Elastic_net (41.61%) sequence are first among the essential features. Zehri’s (2011)39 study is one of the studies showing that stone burden is a risk factor for bleeding. In our research, Stone Width and Stone Size Ridge are the prominent features of Lasso and Elastic_net methods. Meng et al40 argued in their studies that the only parameter that could predict blood loss after percutaneous nephrolithotomy was a stone burden. Srivastava et al41 reported that it caused an increase in the number of maneuvers and access required to clear the pelvicalyceal system from stone fragments completely. Consistent with the literature, the number of accesses was verified for all three methods in our study. Kandemir et al42 found that the length of hospital stay was statistically significant. In our study, hospital stay is among the essential variables, with a rate of (2%).
Conclusion
This study evaluated variable selection using Ridge, Lasso, Elastic_net, MARS, and Random Forest applications. The results revealed that the MARS algorithm showed the best performance. Important parameters in the surgical decision-making process were determined and monitored. These results can guide physicians in choosing the most appropriate care and surgical approach for medicated patients.
Computer-aided decision-making systems can be developed using the results of such products. These systems can provide doctors with better information about their patient’s treatment options and improve decision-making. Patient education and awareness are critical to providing accurate details on preoperative preparation and procedure results. This study may contribute to patients being better informed about the effects of surgery and taking an active role. In conclusion, important information is presented to include in the surgical decision-making process regarding medications with a history of percutaneous nephrolithotomy. Future research may examine how this can be integrated into clinical practice and patient care.
Data Sharing Statement
The corresponding author will provide the datasets used and analyzed during the current work upon reasonable request.
Ethics Approval and Consent Statements
The study protocol was approved by Haseki Training and Research Hospital (Istanbul, Turkey). All participants gave written informed consent before participating in the study.
Acknowledgments
The author appreciates Dr. Emre Kandemir’s counsel and help. This article’s guarantor is KG.
Funding
The study has not received any funding, according to the author.
Disclosure
There are no declared conflicts of interest with this article or the author.
References
1. Kuzu A. Surgery and treatment; 2023. Available from: https://www.kolonrektum.com/ameliyat-oncesi-yapilmasi-gerekenler/.
2. Corrigan JM, Adams K. Priority areas for national action: transforming health care quality. Health Affairs. 2003;22:116. doi:10.1377/hlthaff.22.2.116
3. Donaldson MS, Corrigan JM, Kohn LT. To err is human: building a safer health system. Ann Nutrition Metab. 2000;44:229. doi:10.1159/000046689
4. Woodin KE. Patient safety comes first in clinical trials. Drug Benefit Trends. 2000;12(4):59–60.
5. Jerome HF. Multivariate adaptive regression splines. Ann Stat. 1991;19(1):1–67. doi:10.1214/aos/1176347963
6. Breiman L. Random forests. Mach Learn. 2001;45(1):5–32. doi:10.1023/A:1010933404324
7. Kuhn M, Johnson K. Applied Predictive Modeling. Springer; 2013.
8. Breiman L. Using iterated bagging to debias regressions. Mach Learn. 2001;45(3):261–277. doi:10.1023/A:1017934522171
9. Tibshirani R. Regression shrinkage and selection via the lasso. J R Stat Soc Series B Stat Methodol. 2018;58(1):267–288. doi:10.1111/j.2517-6161.1996.tb02080.x
10. Leitão PJ, Schwieder M, Suess S, et al. Mapping beta diversity from space: Sparse Generalised Dissimilarity Modelling (SGDM) for analysing high-dimensional data. Methods Ecol Evol. 2015;6(7):764–771. doi:10.1111/2041-210X.12378
11. Hoerl AE, Kennard RW. Ridge regression: biased estimation for nonorthogonal problems. Technometrics. 1970;12(1):55–67. doi:10.1080/00401706.1970.10488634
12. Özkale MR. Çoklu iç ilişki ile ilgili problemler. Çukurova Üniversitesi; 2007.
13. Hastie T, Tibshirani R, Friedman J. The Elements of Statistical Learning. Springer; 2003.
14. Melkumova LE, Shatskikh SY. Comparing Ridge and LASSO estimators for data analysis. Procedia Eng. 2017;201:746–755. doi:10.1016/j.proeng.2017.09.615
15. Moreno-Salinas D, Moreno R, Pereira A, Aranda J, de la Cruz JM. Modelling of a surface marine vehicle with kernel ridge regression confidence machine. Appl Soft Comput. 2019;76:237–250. doi:10.1016/j.asoc.2018.12.002
16. Zou H, Hastie T. Regularization and variable selection via the elastic net. J R Stat Soc Series B Stat Methodol. 2005;67(2):301–320. doi:10.1111/j.1467-9868.2005.00503.x
17. Dash M, Liu H. Feature selection for classification. Intell Data Anal. 1997;1(1):131–156. doi:10.1016/S1088-467X(97)00008-5
18. Aha DW, Bankert RL A comparative evaluation of sequential feature selection algorithms.
19. Mitra P, Murthy CA, Pal SK. Unsupervised feature selection using feature similarity. IEEE Trans Pattern Anal Mach Intell. 2002;24(3):301–312. doi:10.1109/34.990133
20. Pal A, Pal SK. Pattern recognition: evolution, mining and big data. Pattern recognition and big data. World Sci. 2017;1–36.
21. Kudo M, Sklansky J. Comparison of algorithms that select features for pattern classifiers. Pattern Recognit. 2000;33(1):25–41. doi:10.1016/S0031-3203(99)00041-2
22. Goltsev A, Gritsenko V. Investigation of efficient features for image recognition by neural networks. Neural Netw. 2012;28:15–23. doi:10.1016/j.neunet.2011.12.002
23. Khotanzad A, Hong YH. Rotation invariant image recognition using features selected via a systematic method. Pattern Recognit. 1990;23(10):1089–1101. doi:10.1016/0031-3203(90)90005-6
24. Rashedi E, Nezamabadi-pour H, Saryazdi S. A simultaneous feature adaptation and feature selection method for content-based image retrieval systems. Knowl Based Syst. 2013;39:85–94. doi:10.1016/j.knosys.2012.10.011
25. Swets DL, Weng JJ. Efficient content-based image retrieval using automatic feature selection. Ann Nutrition Metab. 1995:85–90.
26. Alazab A, Hobbs M, Abawajy J, Alazab M. Using feature selection for intrusion detection system.
27. Zhang WG, Goh ATC. Multivariate adaptive regression splines for analysis of geotechnical engineering systems. Comput Geotech. 2013;48:82–95. doi:10.1016/j.compgeo.2012.09.016
28. Zhang K, Li Y, Scarf P, Ball A. Feature selection for high-dimensional machinery fault diagnosis data using multiple models and radial basis function networks. Neurocomputing. 2011;74(17):2941–2952. doi:10.1016/j.neucom.2011.03.043
29. Khoshgoftaar T, Dittman D, Wald R, Fazelpour A. First order statistics based feature selection: a diverse and powerful family of feature seleciton techniques.
30. Vasconcelos M, Vasconcelos N. Natural image statistics and low-complexity feature selection. IEEE Trans Pattern Anal Mach Intell. 2009;31(2):228–244. doi:10.1109/TPAMI.2008.77
31. Fleuret F. Fast binary feature selection with conditional mutual information. Article. J Mach Learn Res. 2004;5(9):1531–1555.
32. Gencer G, Gencer K, Dumanlı A. Variable selection in gender and age decision-making for traumatic spine and thoracic pathologies after various accidents with Multivariate Adaptive Regression Spline (Mars). Health Sci Q. 2023;3(3):187–193. doi:10.26900/hsq.2047
33. Gencer K, Gencer G. Topluluk makine öğrenme yöntemleri kullanılarak gebelerde anemi tespiti. Yapay Zeka Uygulamalarında Güncel Konular Ve Araştırmalar. Çizgi Kitabevi. 2021;118–135.
34. Gencer K, Gencer G Machine learning assisted decision making in patients with polycystic ovary syndrome.
35. Gencer K, Gencer G, Serin AN, Birge Ö. Classifying anemia using bagging mars with machine learning methods in syrian immigrant pregnant women.
36. Leo MM, Langlois BK, Pare JR, et al. Ultrasound vs. computed tomography for severity of hydronephrosis and its importance in renal colic. West J Emerg Med. 2017;18(4):559–568. doi:10.5811/westjem.2017.04.33119
37. Jendeberg J, Geijer H, Alshamari M, Cierzniak B, Lidén M. Size matters: the width and location of a ureteral stone accurately predict the chance of spontaneous passage. Eur Radiol. 2017;27(11):4775–4785. doi:10.1007/s00330-017-4852-6
38. Li Z, Wu A, Liu J, et al. Risk factors for hemorrhage requiring embolization after percutaneous nephrolithotomy: a meta-analysis. Transl Androl Urol. 2020;9(2):210–217. doi:10.21037/tau.2020.01.10
39. Zehri AA, Biyabani SR, Siddiqui KM, Memon A. Triggers of blood transfusion in percutaneous nephrolithotomy. J Coll Physicians Surg Pak. 2011;21(3):138–141.
40. Meng X, Bao J, Mi Q, Fang S. The analysis of risk factors for hemorrhage associated with minimally invasive percutaneous nephrolithotomy. Biomed Res Int. 2019;2019:8619460. doi:10.1155/2019/8619460
41. Srivastava A, Singh KJ, Suri A, et al. Vascular complications after percutaneous nephrolithotomy: are there any predictive factors? Urology. 2005;66(1):38–40. doi:10.1016/j.urology.2005.02.010
42. Kandemir E, Savun M, Sezer A, Erbin A, Akbulut MF, Sarılar Ö. Comparison of miniaturized percutaneous nephrolithotomy and standard percutaneous nephrolithotomy in secondary patients: a randomized prospective study. J Endourol. 2020;34(1):26–32. doi:10.1089/end.2019.0538
 © 2023 The Author(s). This work is published and licensed by Dove Medical Press Limited. The
full terms of this license are available at https://www.dovepress.com/terms
and incorporate the Creative Commons Attribution
- Non Commercial (unported, 3.0) License.
By accessing the work you hereby accept the Terms. Non-commercial uses of the work are permitted
without any further permission from Dove Medical Press Limited, provided the work is properly
attributed. For permission for commercial use of this work, please see paragraphs 4.2 and 5 of our Terms.
© 2023 The Author(s). This work is published and licensed by Dove Medical Press Limited. The
full terms of this license are available at https://www.dovepress.com/terms
and incorporate the Creative Commons Attribution
- Non Commercial (unported, 3.0) License.
By accessing the work you hereby accept the Terms. Non-commercial uses of the work are permitted
without any further permission from Dove Medical Press Limited, provided the work is properly
attributed. For permission for commercial use of this work, please see paragraphs 4.2 and 5 of our Terms.