Back to Journals » International Journal of Chronic Obstructive Pulmonary Disease » Volume 11 » Issue 1
Mid-arm and calf circumferences are stronger mortality predictors than body mass index for patients with chronic obstructive pulmonary disease
Authors Ho S, Wang J, Kuo H, Huang C, Lee K ![]() , Chuang H, Feng P, Chen T, Hsu M
, Chuang H, Feng P, Chen T, Hsu M ![]()
Received 27 February 2016
Accepted for publication 8 May 2016
Published 31 August 2016 Volume 2016:11(1) Pages 2075—2080
DOI https://doi.org/10.2147/COPD.S107326
Checked for plagiarism Yes
Review by Single anonymous peer review
Peer reviewer comments 2
Editor who approved publication: Prof. Dr. Richard Russell
Shu-Chuan Ho,1,2 Jiun-Yi Wang,3,4 Han-Pin Kuo,5 Chien-Da Huang,5 Kang-Yun Lee,2,6 Hsiao-Chi Chuang,1,2 Po-Hao Feng,2,6 Tzu-Tao Chen,2,* Min-Fang Hsu7,*
1School of Respiratory Therapy, College of Medicine, 2Division of Pulmonary Medicine, Department of Internal Medicine, Shuang Ho Hospital, Taipei Medical University, New Taipei City, 3Department of Healthcare Administration, Asia University, Wufeng, 4Department of Medical Research, China Medical University Hospital, China Medical University, Taichung, 5Department of Thoracic Medicine, Chang Gung Memorial Hospital, Chang Gung University College of Medicine, 6Department of Internal Medicine, School of Medicine, College of Medicine, Taipei Medical University, 7Department of Nursing, Yuanpei University of Medical Technology, Hsinchu City, Taiwan
*These authors contributed equally to this work
Background: Chronic obstructive pulmonary disease (COPD) is currently the third most common cause of death in the world. Patients with COPD experience airflow obstruction, weight loss, skeletal muscle dysfunction, and comorbidities. Anthropometric indicators are risk factors for mortality in geriatric assessment.
Purpose: This study examined and compared the associations of anthropometric indicators, such as low body mass index (BMI), low mid-arm circumference (MAC), and low calf circumference (CC), with the prediction of a 3-year follow-up mortality risk in patients with COPD.
Methods: We recruited nonhospitalized patients with COPD without acute conditions from a general hospital in Taiwan. The BMI, MAC, and CC of all patients were measured, and they were followed for 3 years through telephone interviews and chart reviews. The Kaplan–Meier survival curves stratified by BMI, MAC, and CC were analyzed. Variables univariately associated with survival were entered into a multivariate Cox regression model. The Bayesian information criterion was used to compare the predictive ability of the three anthropometric indicators to predict mortality rate.
Results: In total, 104 patients were included (mean ± standard deviation age, 74.2±6.9 years; forced expiratory volume in 1 second [%], 58.4±20.4 predicted; males, 94.2%); 22 patients (21.2%) died during the 36-month follow-up. During this long-term follow-up, the three anthropometric indicators could predict mortality risk in patients with COPD (low BMI [<21 kg/m2], hazard ratio [HR] =2.78, 95% confidence interval [CI] =1.10–7.10; low MAC [<23.5 cm], HR =3.09, 95% CI =1.30–7.38; low CC [<30 cm], HR =4.40, 95% CI =1.82–10.63). CC showed the strongest potential in predicting the mortality risk, followed by MAC and BMI.
Conclusion: Among the three anthropometric variables examined, CC can be considered a strong predictor of mortality risk in patients with COPD.
Keywords: anthropometric indicator, BMI, calf circumference, COPD, mid-arm circumference, mortality
Introduction
Chronic obstructive pulmonary disease (COPD) is currently the third most common cause of death in the world.1 COPD is a global health concern and a slowly progressive inflammatory disease caused by airflow obstructions.2 COPD is not fully reversible and can lead to progressively worsening breathlessness, which affects daily activities and the health-related quality of life.3 Many patients with COPD experience multiple conditions (eg, weight loss and skeletal muscle dysfunction)4 and comorbidities (eg, cardiovascular disease, osteoporosis, and depression), which are known to influence the mortality and morbidity rates, hospitalization, and health-related quality of life.5
Anthropometric indicators are essential for evaluating malnutrition,6 functional decline, and chronic health conditions, which are risk factors for mortality in geriatric assessment.7 Body mass index (BMI), mid-arm circumference (MAC), and calf circumference (CC) are accurate indicators of weight change, terminal functional decline, and functional status, respectively.8,9 The association between an increased mortality risk and low BMI in old age is well established.10,11 The association between BMI and mortality risk in patients with COPD has been a subject of research interest for decades.12 In patients with COPD, independent of other prognostic variables, a mid-thigh muscle cross-sectional area of ≤70 cm2 increases the mortality risk fourfold.13 In patients with stable COPD, the prognostic influence of the mid-arm muscle area estimated using anthropometric parameters is a more accurate predictor of mortality risk than BMI.14 CC can be used to assess muscle mass,15 because low muscle mass is more strongly related to mortality risk in adults than is low fat mass.16
Apart from BMI, scant data is available on MAC and CC, all of which are comparable anthropometric predictors of mortality risk in patients with COPD. We therefore examined and compared the associations of anthropometric indicators, namely low BMI, MAC, and CC, with the prediction of mortality risk in patients with COPD in a 3-year follow-up period.
Materials and methods
Study design and patients
We conducted a cohort study in patients with COPD who were recruited from the pulmonary outpatient unit of a medical center in Northern Taiwan between January 2011 and December 2014. Patients diagnosed with susceptible COPD on the basis of the Global Initiative for Chronic Obstructive Lung Disease (GOLD) guidelines, were sampled.17 Patients with forced expiratory volume in 1 second (FEV1)/forced vital capacity <0.70 confirmed by post-bronchodilator spirometry were eligible for inclusion. Patients with an acute infection or exacerbation were excluded. In total, 104 eligible patients (98 males and six females) agreed to participate. All the patients were ambulatory in stable conditions and were undergoing standard pharmacological treatment for COPD. The study protocol was approved by the Ethics Committee of the Chang-Gung Memorial Hospital, and all the patients provided written informed consent before participation.
Procedures and measurements
Each patient was interviewed face-to-face for recording demographic, lifestyle, and disease-related data. Their weight, height, fat-free mass index (FFMI), MAC, and CC were measured, following which they underwent the pulmonary functional test. We confirmed the patients with COPD and those with with other diseases, including cardiovascular disorder, skeletal muscle dysfunction, metabolic syndrome and diabetes, osteoporosis, anxiety and depression, lung cancer, and so on, according to medical charts. Current medication was recorded from the patients’ statement and mortality data were collected from the chart records at the medical center and confirmed through telephonic follow-up.
BMI was calculated as the weight in kilograms divided by the square of their height in meters (kg/m2). MAC and CC were measured to the nearest 0.1 cm using a flexible but nonstretch measuring tape.18 MAC was measured with a millimeter tape at the midpoint of the nondominant arm, between the olecranon and acromion. CC was measured by wrapping the tape around the widest part of the calf with the patient in a sitting position, left knee raised at a right angle, and the calf uncovered by rolling up the trouser leg. We used the threshold values of the anthropometric cut-off points according to the Mini Nutritional Assessment Taiwan Version-II (BMI <21 kg/m2 for low BMI, MAC<23.5 cm for low MAC, CC <30 cm for low CC).19
Body fat percentage was determined through a bioelectrical impedance analysis (BF-800 body fat monitor, Tanita, Tokyo, Japan),6 and the FFMI was calculated by subtracting fat mass from the body weight.10
A pulmonary function test was performed using Spirotrac V (Vitalograph Inc, Lenexa, KS, USA) after a 10-minute rest. The most satisfactory (ie, difference within 200 mL or <5%) of at least three reproducible FEV1 and forced vital capacity values were used in the analysis.
Statistical analysis
All data were statistically analyzed using SPSS statistics for Windows, version 19.0 (SPSS Inc. Chicago, IL, USA) and Prism5 (GraphPad Software, La Jolla, CA, USA). Descriptive data were expressed as mean ± standard deviation or percentage. Kaplan–Meier survival curves were stratified by BMI, MAC, and CC for analyses. After adjustment for age, smoking habit, and disease severity, Cox regression analyses were performed to evaluate the relative mortality risks among patients with low BMI, MAC, or CC. The Bayesian information criterion (BIC) was used to compare the extent of association between mortality rate and the anthropometric indicators considered in this study. A lower BIC value indicates a higher predictive ability or a stronger association of the indicator with the mortality risk.20 Statistical significance was set at 0.05 in all analyses.
Results
Table 1 lists the characteristics of the study patients. The average age was 74.2±6.9 years, and only 5.8% were female patients. Patients’ smoking statuses were as follows: 11.5% nonsmokers, 71.2% ex-smokers, and 17.3% smokers. Over one-half of the patients had mild or moderate COPD, approximately one-third (31.7%) exhibited severe COPD, and only 6.7% exhibited very severe COPD; the mean (%) FEV1 was 58.4±20.3; over half (55.8%) of patients had one or two comorbidities. In medication treatment, most of the patients had bronchodilator (83.7%) or steroid (81.7%) use. The mean ± standard deviation anthropometric values were as follows: 23.4±3.7 kg/m2, BMI; 26.3±3.2 cm, MAC; 32.9±3.1 cm, CC; and 17.6±2.2 kg/m2 FFMI.
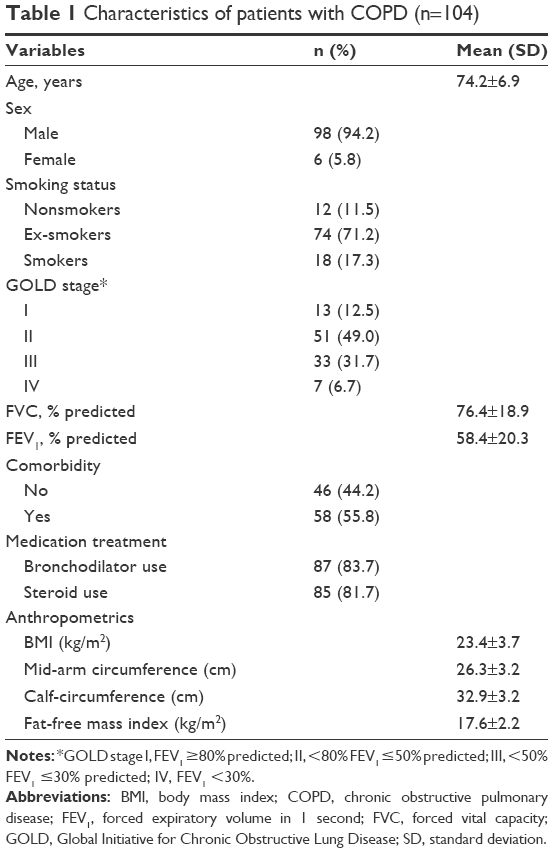 | Table 1 Characteristics of patients with COPD (n=104) |
Table 2 shows the characteristics of patients with COPD stratified by survival; during the 3-year follow-up period, 22 of the 104 patients died. The mean age of the surviving and dead patients was similar (73.8±7.1 vs 75.4±5.9 years, P>0.05). Most surviving and dead patients had a history of smoking. Both FEV1 (%) and GOLD stages differed significantly between the surviving and dead patients (61.4±19.5 vs 47.4±19.6, P<0.01). The three indicators (BMI, MAC, and CC) differed significantly between the surviving and dead patients (23.9±3.5 vs 21.6±3.8; 26.8±2.9 vs 24.2±3.7; 33.4±2.9 vs 30.9±3.8, respectively, all P<0.01). Some factors had no significant differences between the surviving and dead patients, including FFMI that did not differ significantly between the surviving and dead patients (17.8±1.9 vs 16.9±3.2, P>0.05), comorbidities coexistence, bronchodilator, and steroid use (all P>0.05).
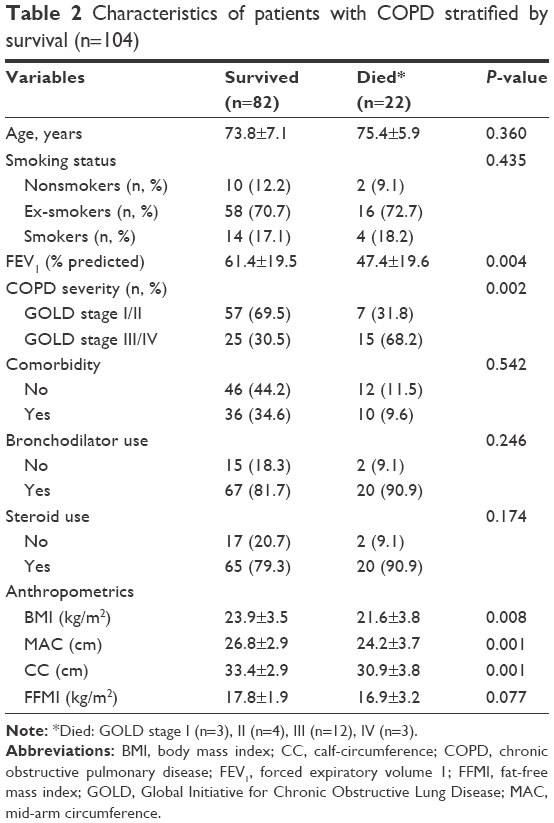 | Table 2 Characteristics of patients with COPD stratified by survival (n=104) |
Figure 1 shows the 3-year follow-up Kaplan–Meier survival curves stratified by BMI, MAC, and CC. The survival rates of the patients with low BMI (<21 kg/m2), low MAC (<23.5 cm), or low CC (<30 cm) revealed a significantly high mortality during the 3-year follow-up period.
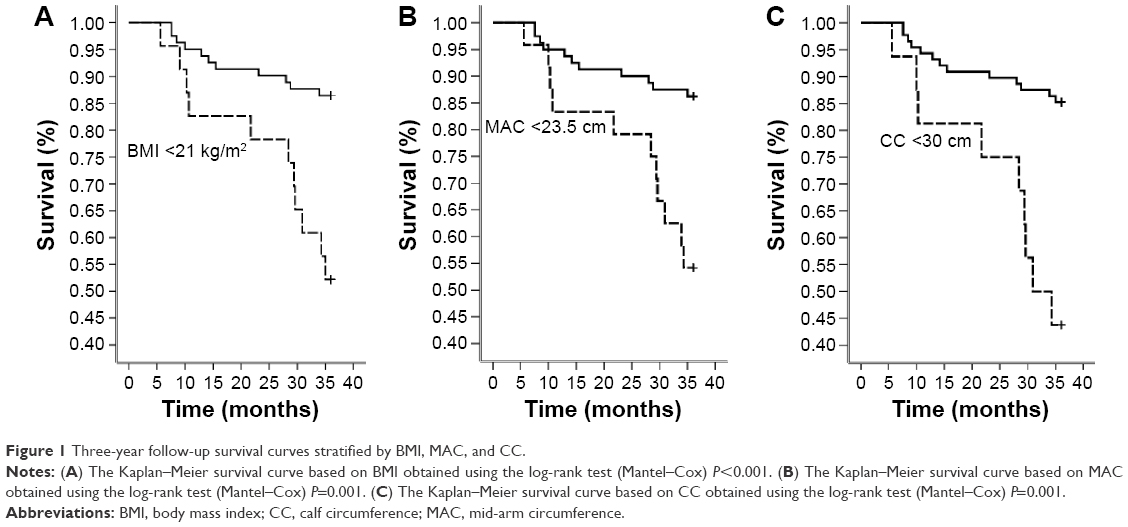 | Figure 1 Three-year follow-up survival curves stratified by BMI, MAC, and CC. |
Table 3 shows the hazard ratios and 95% confidence intervals based on the multivariate Cox regression analysis and the BIC value for the predictors of the mortality in patients with COPD. All the models were adjusted for age, smoking status, and disease severity (FEV1, % predicted). FEV1 was a significant factor on mortality risk in models I, II, and III respectively. A low BMI (<21 kg/m2) was significantly associated with a higher risk of mortality (Hazard ratio [HR]=2.8, P<0.05). In model II, a low MAC (<23.5 cm) was positively associated with a 3.0-fold increase in the mortality risk (P<0.05), whereas in model III, a low CC (<30 cm) was positively associated with an approximately 4.5-fold increase in mortality (P<0.01). Moreover, age or smoking status was not significantly associated with mortality in these three models. The differences in the BIC values between models III and I, III and II, and II and I were 4.9, 3.33, and 1.58, respectively.
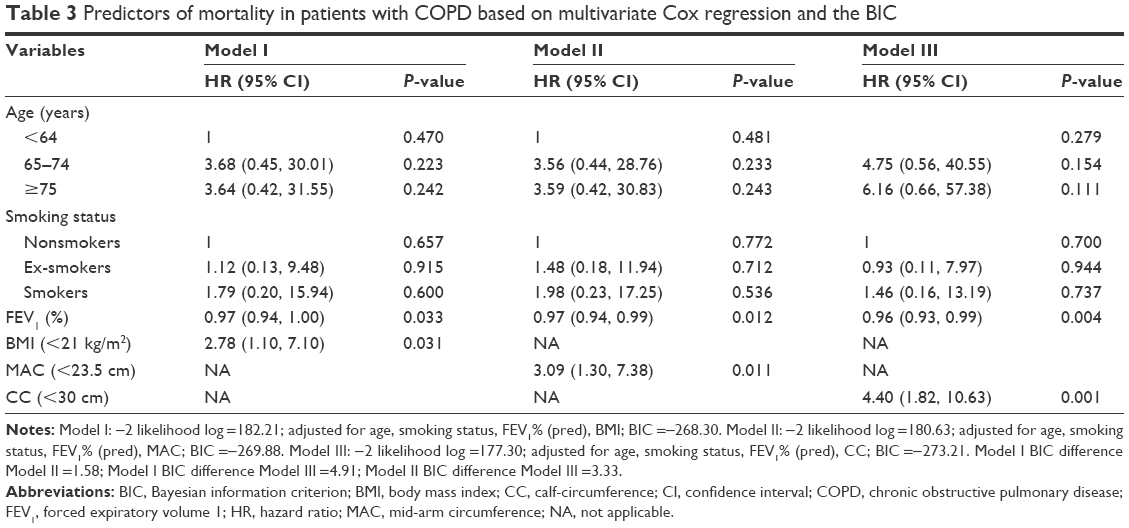 | Table 3 Predictors of mortality in patients with COPD based on multivariate Cox regression and the BIC |
Discussion
In this study, we evaluated the predictive association between the anthropometric indicators and mortality risk in patients with COPD. The results suggest that the three anthropometric variables considered in this study can predict the long-term follow-up mortality in patients with COPD. When stratified by the cut-off points, low CC and low MAC were more effective predictors than was low BMI, showing significantly higher mortality risk during the 3-year follow-up period compared with that associated with normal CC, MAC, and BMI.
Many factors, such as aging, physical activity, nutrition, and chronic health disease, influence anthropometric indicators.21 Tsai et al19 demonstrated that low CC (<30 cm in males and <27 cm in females) and low MAC (<23.5 cm in males and <22 cm in females) were more effective than was low BMI (<21 kg/m2) in predicting the follow-up mortality risk in patients aged 65–74 years. However, low CC and low BMI were more effective than low MAC was in patients >75 years, and low BMI was more effective than low MAC or low CC was in Taiwanese patients aged 53–64 years. Advanced aging is often accompanied by unplanned weight loss and body protein loss.22 In the current study, MAC and CC were more accurate predictors of health status and mortality risk in the institutionalized older Taiwanese people than was BMI.8 The average age of the patients in our study was 74.2 years, and our results are consistent with those of Tsai et al,19 where low CC and low MAC were more effective predictors of 3-year follow-up mortality risk than was low BMI after adjustment for age, smoking status, and disease severity.
The association between increased mortality and low BMI in old age is well established.10,11 No consensus exists on the causality of this association among patients with COPD.23 Apart from BMI, low MAC14 and low CC24 have been recommended as alternative and more accurate predictors of mortality in older participants25 and patients with COPD.14 The accuracy of BMI measurement can be low in the older population for such reasons as spinal deformities, difficulties when standing, and fluid retention.25 BMI and the cause-specific mortality risk were adjusted for age, sex, and smoking status.23 The degree of functional impairment between the upper and lower limbs differs among patients with COPD. Lower limb muscles appear to be associated with muscle endurance and daily functional performance, whereas upper limb muscles have been correlated with both physical and pulmonary functional indicators.26 Raftery (1995) suggested that a lower BIC value of 2–6 is a positive evidence for a model.20 Because the differences in BIC values between the model with CC and the model with BMI were 4.9, the results of the present study indicated that CC had a stronger association with mortality rate in patients with COPD.
FEV1 is an important factor associated with mortality in our study. Esteban et al also found that FEV1 was the main predictor of mortality among patients with stable COPD.27 We also found that patients rated as GOLD stage I–II (69.5%) have higher survival rate than GOLD stage III–IV (30.5%). Mattila et al demonstrated a strong association between the severity of the GOLD stage and mortality risk in a follow-up study.2 FEV1 is the most crucial physiologic indicator of the severity of airflow obstruction in COPD.28 Although, no single physiological survey has captured multiple factors that elevate the mortality in patients with COPD, a low FEV1 has a long-existing association with increased mortality.29
The results of the present study indicated that among the investigated indicators, CC has the highest accuracy for predicting mortality in patients with COPD. Measurement of CC is easy, inexpensive, and noninvasive.
Limitation of the study
This study has a few limitations. First, the study sample was small and drawn from one hospital, which may have led to some bias during sample selection and therefore might not represent the entire spectrum of patients with COPD; this prevented us from conducting a subgroup analysis. Second, our results were based on data analyses obtained mainly from male patients, and the applicability of the study results to female patients requires additional investigations. Third, the influence of some COPD symptoms, such as dyspnea symptoms, exercising tolerance was not considered. Because patients with an acute infection or exacerbation were excluded, the data of acute exacerbation were not analyzed in the present study. In the future, we may use cluster analysis to predict mortality risks in patients with COPD.
Conclusion
Three anthropometric indicators, namely BMI, MAC, and CC, can predict long-term follow-up mortality risk in patients with COPD, among which CC is the most accurate, followed by MAC and BMI.
Acknowledgment
The authors thank the patients and personnel of the hospital unit for their cooperation. The study was supported by a grant from the Chang Gung Memorial Hospital (CMRPG391921), Ministry of Science and Technology (MOST 103-2314-B-038-066), Taipei Medical University–Shuang Ho Hospital (103TMU-SHH-01-4 & 104TMU-SHH-24), and the Taipei Medical University (TMU102-AE1-B45 & TMU103-AE1-B31). All authors have read and approved the final version of the manuscript.
Disclosure
The authors report no conflicts of interest in this work.
References
Lozano R, Naghavi M, Foreman K, et al. Global and regional mortality from 235 causes of death for 20 age groups in 1990 and 2010: a systematic analysis for the Global Burden of Disease Study 2010. Lancet. 2012;380(9859):2095–2128. | ||
Mattila T, Vasankari T, Kanervisto M, et al. Association between all-cause and cause-specific mortality and the GOLD stages 1–4: A 30-year follow-up among Finnish adults. Respir Med. 2015;109(8):1012–1018. | ||
Criner GJ, Bourbeau J, Diekemper RL, et al. Executive summary: prevention of acute exacerbation of COPD: American College of Chest Physicians and Canadian Thoracic Society Guideline. Chest. 2015;147(4):883–893. | ||
Cazzola M, Bettoncelli G, Sessa E, Cricelli C, Biscione G. Prevalence of comorbidities in patients with chronic obstructive pulmonary disease. Respiration. 2010;80(2):112–119. | ||
Almagro P, Cabrera FJ, Diez J, et al. Comorbidities and short-term prognosis in patients hospitalized for acute exacerbation of COPD: the EPOC en Servicios de medicina interna (ESMI) study. Chest. 2012;142(5):1126–1133. | ||
Hsu MF, Ho SC, Kuo HP, Wang JY, Tsai AC. Mini-nutritional assessment (MNA) is useful for assessing the nutritional status of patients with chronic obstructive pulmonary disease: a cross-sectional study. COPD. 2014;11(3):325–332. | ||
Seidell JC, Visscher TL. Body weight and weight change and their health implications for the elderly. Eur J Clin Nutr. 2000;54(Suppl 3):S33–S39. | ||
Tsai AC, Lai MC, Chang TL. Mid-arm and calf circumferences (MAC and CC) are better than body mass index (BMI) in predicting health status and mortality risk in institutionalized elderly Taiwanese. Arch Gerontol Geriatr. 2012;54(3):443–447. | ||
Ho SC, Hsu MF, Kuo HP, et al. The relationship between anthropometric indicators and walking distance in patients with chronic obstructive pulmonary disease. Int J Chron Obstruct Pulmon Dis. 2015;10:1857–1862. | ||
Corrada MM, Kawas CH, Mozaffar F, Paganini-Hill A. Association of body mass index and weight change with all-cause mortality in the elderly. Am J Epidemiol. 2006;163(10):938–949. | ||
Thinggaard M, Jacobsen R, Jeune B, Martinussen T, Christensen K. Is the relationship between BMI and mortality increasingly U-shaped with advancing age? A 10-year follow-up of persons aged 70–95 years. J Gerontol A Biol Sci Med Sci. 2010;65(5):526–531. | ||
Cao C, Wang R, Wang J, Bunjhoo H, Xu Y, Xiong W. Body mass index and mortality in chronic obstructive pulmonary disease: a meta-analysis. PLoS One. 2012;7(8):e43892. | ||
Marquis K, Debigare R, Lacasse Y, et al. Midthigh muscle cross-sectional area is a better predictor of mortality than body mass index in patients with chronic obstructive pulmonary disease. Am J Respir Crit Care Med. 2002;166(6):809–813. | ||
Soler-Cataluna JJ, Sanchez-Sanchez L, Martinez-Garcia MA, Sanchez PR, Salcedo E, Navarro M. Mid-arm muscle area is a better predictor of mortality than body mass index in COPD. Chest. 2005;128(4):2108–2115. | ||
Chumlea WC, Guo SS, Vellas B, Guigoz Y. Techniques of assessing muscle mass and function (sarcopenia) for epidemiological studies of the elderly. J Gerontol A Biol Sci Med Sci. 1995;50:45–51. | ||
Bigaard J, Frederiksen K, Tjonneland A, et al. Body fat and fat-free mass and all-cause mortality. Obesity Res. 2004;12(7):1042–1049. | ||
Rabe KF, Hurd S, Anzueto A, et al. Global strategy for the diagnosis, management, and prevention of chronic obstructive pulmonary disease: GOLD executive summary. Am J Respir Crit Care Med. 2007;176(6):532–555. | ||
Lee RD, Nieman DC. Assessment of the hospitalized patient. In: Lee RD, Nieman DC, editors. Nutritional Assessment. 3rd ed. New York: McGraw Hill; 2003. | ||
Tsai AC, Chang TL. The effectiveness of BMI, calf circumference and mid-arm circumference in predicting subsequent mortality risk in elderly Taiwanese. Br J Nutr. 2011;105(2):275–281. | ||
Raftery AE. Bayesian model selection in social research. Sociol Methodol. 1995;25:111–163. | ||
Tsai HJ, Tsai AC, Nriagu J, Ghosh D, Gong M, Sandretto A. Associations of BMI, TV-watching time, and physical activity on respiratory symptoms and asthma in 5th grade schoolchildren in Taipei, Taiwan. J Asthma. 2007;44(5):397–401. | ||
Roubenoff R. Sarcopenia and its implications for the elderly. Eur J Clin Nutr. 2000;54(Suppl 3):S40–S47. | ||
Whitlock G, Lewington S, Sherliker P, et al; Prospective Studies Collaboration. Body-mass index and cause-specific mortality in 900,000 adults: collaborative analyses of 57 prospective studies. Lancet. 2009;373(9669):1083–1096. | ||
Bonnefoy M, Jauffret M, Kostka T, Jusot JF. Usefulness of calf circumference measurement in assessing the nutritional state of hospitalized elderly people. Gerontology. 2002;48(3):162–169. | ||
Wijnhoven HA, van Bokhorst-de van der Schueren MA, Heymans MW, et al. Low mid-upper arm circumference, calf circumference, and body mass index and mortality in older persons. J Gerontol A Biol Sci Med Sci. 2010;65(10):1107–1114. | ||
Miranda EF, Malaguti C, Corso SD. Peripheral muscle dysfunction in COPD: lower limbs versus upper limbs. J Bras Pneumol. 2011;37(3):380–388. | ||
Esteban C, Quintana JM, Aburto M, et al. Predictors of mortality in patients with stable COPD. J Gen Intern Med. 2008;23(11):1829–1834. | ||
Celli BR. Predictors of mortality in COPD. Respir Med. 2010;104(6):773–779. | ||
Anthonisen NR, Wright EC, Hodgkin JE. Prognosis in chronic obstructive pulmonary disease. Am Rev Respir Dis. 1986;133(1):14–20. |
 © 2016 The Author(s). This work is published and licensed by Dove Medical Press Limited. The
full terms of this license are available at https://www.dovepress.com/terms
and incorporate the Creative Commons Attribution
- Non Commercial (unported, 3.0) License.
By accessing the work you hereby accept the Terms. Non-commercial uses of the work are permitted
without any further permission from Dove Medical Press Limited, provided the work is properly
attributed. For permission for commercial use of this work, please see paragraphs 4.2 and 5 of our Terms.
© 2016 The Author(s). This work is published and licensed by Dove Medical Press Limited. The
full terms of this license are available at https://www.dovepress.com/terms
and incorporate the Creative Commons Attribution
- Non Commercial (unported, 3.0) License.
By accessing the work you hereby accept the Terms. Non-commercial uses of the work are permitted
without any further permission from Dove Medical Press Limited, provided the work is properly
attributed. For permission for commercial use of this work, please see paragraphs 4.2 and 5 of our Terms.