")
Back to Journals » International Journal of Nanomedicine » Volume 11
Microstructural, spectroscopic, and antibacterial properties of silver-based hybrid nanostructures biosynthesized using extracts of coriander leaves and seeds
Authors Luna C, Barriga-Castro ED, Gómez-Treviño A, Núñez N, Mendoza-Reséndez R
Received 27 January 2016
Accepted for publication 12 March 2016
Published 20 September 2016 Volume 2016:11 Pages 4787—4798
DOI https://doi.org/10.2147/IJN.S105166
Checked for plagiarism Yes
Review by Single anonymous peer review
Peer reviewer comments 2
Editor who approved publication: Dr Thomas Webster
Carlos Luna,1 Enrique Díaz Barriga-Castro,2 Alberto Gómez-Treviño,3 Nuria O Núñez,4 Raquel Mendoza-Reséndez1
1Research Center of Mathematics and Physics, Faculty of Mathematics and Physics, Autonomous University of Nuevo León, Nuevo León, Mexico; 2Central Laboratory of Analytical Instrumentation, Research Center for Applied Chemistry, Coahuila, Mexico; 3Laboratory of Molecular Biology, Faculty of Chemistry, Autonomous University of Nuevo León, Nuevo León, Mexico; 4Colloidal Materials Research Group, Institute of Materials Science of Seville, Spanish National Research Council, University of Seville, Seville, Spain
Abstract: Coriander leaves and seeds have been highly appreciated since ancient times, not only due to their pleasant flavors but also due to their inhibitory activity on food degradation and their beneficial properties for health, both ascribed to their strong antioxidant activity. Recently, it has been shown that coriander leaf extracts can mediate the synthesis of metallic nanoparticles through oxidation/reduction reactions. In the present study, extracts of coriander leaves and seeds have been used as reaction media for the wet chemical synthesis of ultrafine silver nanoparticles and nanoparticle clusters, with urchin- and tree-like shapes, coated by biomolecules (mainly, proteins and polyphenols). In this greener route of nanostructure preparation, the active biocompounds of coriander simultaneously play the roles of reducing and stabilizing agents. The morphological and microstructural studies of the resulting biosynthesized silver nanostructures revealed that the nanostructures prepared with a small concentration of the precursor Ag salt (AgNO3 =5 mM) exhibit an ultrafine size and a narrow size distribution, whereas particles synthesized with high concentrations of the precursor Ag salt (AgNO3 =0.5 M) are polydisperse and formation of supramolecular structures occurs. Fourier transform infrared and Raman spectroscopy studies indicated that the bioreduction of the Ag- ions takes place through their interactions with free amines, carboxylate ions, and hydroxyl groups. As a consequence of such interactions, residues of proteins and polyphenols cap the biosynthesized Ag nanoparticles providing them a hybrid core/shell structure. In addition, these biosynthesized Ag nanomaterials exhibited size-dependent plasmon extinction bands and enhanced bactericidal activities against both Gram-positive and Gram-negative bacteria, displaying minimal inhibitory Ag concentrations lower than typical values reported in the literature for Ag nanoparticles, probably due to the synergy of the bactericidal activities of the Ag nanoparticle cores and their capping ligands.
Keywords: silver, nanoparticles, coriander, bactericide, minimal inhibitory concentration
Introduction
For thousands of years, seeds (ripe fruits) and leaves of coriander (Coriandrum sativum L), also known as “cilantro” or “Chinese parsley”, have been extensively used by different cultures as functional food ingredients due to their pleasant flavors, beneficial properties for health, and efficient inhibition of the deterioration of food caused by oxidation processes and microorganisms.1 In fact, the therapeutic benefits of coriander for various diseases due to its analgesic, antiinflammatory, lipolytic, antihyperglycemic, digestive, bactericidal, and fungicidal activities have been particularly highlighted in recent studies.2–8
The antioxidant activity in extracts from coriander seeds and leaves has been studied by employing several analytic methods.9 These studies have indicated that extracts of coriander leaves exhibit stronger antioxidant activity than the extracts of seeds, and their antioxidant activity is positively correlated with the total phenolic content.9
In very recent studies, it has been shown that the potent antioxidant activity of coriander can be exploited in the greener preparation and stabilization of advanced materials. In summary, gold10 and silver11 nanoparticles have been biosynthesized using aqueous coriander leaf extracts. These results are very relevant because the nanostructures are rapidly gaining importance in a wide variety of scientific and technological fields, and the conventional methods to prepare functional nanostructures invariably imply the use of hazardous reagents. In fact, in recent years, the biosynthesis of nanostructures mediated by plant extracts12–14 and other natural-derived products, such as bee products,15–17 has emerged as a noteworthy research field in the pursuit of more sustainable routes for synthesis and processing of functional nanostructured materials with applications as antimicrobial agents,17,18 elements in nonlinear optical devices,11,14 and nanoplatforms for the surface-enhanced Raman scattering (SERS)-based diagnosis and biodetection,19 among many others. In this regard, the unique properties of coriander and its abundance could play an essential role. However, it is necessary to clarify the different particle formation mechanisms that are involved in the crystallization of small particles from natural product extracts, which are complex reaction media where different types of biomolecules (such as proteins, carbohydrates, phenols, chlorophyll, aromatic compounds, polysaccharides, and vitamins, among many others) can simultaneously participate in the crystallization and stabilization of small particles.
In the present study, the particle formation mechanism of silver nanostructures synthesized at room temperature using concentrated extracts of coriander leaves and seeds has been explored, and the microstructural, spectroscopic, and antibacterial properties of such nanostructures have been studied in detail to evaluate their potential technological applications.
Materials and methods
Chemical reagents
Fresh leaves and brown dehydrated ripe fruits (seeds) of coriander (C. sativum L) of the variety vulgare Alef were acquired from a local herbal store in northeastern Mexico. Silver nitrate (AgNO3, 99+%) was purchased from Sigma-Aldrich Co. (St Louis, MO, USA) and was used as received. Double-distilled water was used for all the experiments.
Preparation of the extracts of coriander leaves and seeds
In a typical preparation of a coriander extract, coriander leaves or seeds were carefully washed with double-distilled water and dried at 40°C. Then, 20 g of purified biomass was chopped into fine portions and mixed with 100 mL of double-distilled water under moderate stirring. Afterwards, the mixtures were boiled for 30 minutes under vigorous stirring. Subsequently, the heating source was removed, and the mixtures were allowed to cool to room temperature naturally. Then, the mixtures were kept overnight at room temperature in capped tubes. Subsequently, the solid residues were removed by double filtration, and the resulting extract was directly used in the Ag nanostructure synthesis.
Preparation of nanosized materials mediated by coriander extracts
In a typical synthesis, 10 mL of concentrated coriander extracts (of leaves or seeds) were poured into 10 mL of 0.5 M or 5 mM aqueous AgNO3 solution under vigorous magnetic stirring at room temperature. After few minutes, the resultant solution took a murky brownish color indicating the formation of nanosized metallic silver. The solutions were kept at room temperature under moderate stirring for 4 hours. The resulting products were purified by successive centrifugation and redispersed in distilled water. The final colloids obtained using coriander leaf extract and 0.5 M and 5 mM AgNO3 solutions were named “L-0.5M” and “L-5mM”, respectively. The samples obtained using extracts of coriander seeds and 0.5 M and 5 mM AgNO3 solutions were named “S-0.5M” and “S-5mM”, respectively. All the experiments were carried out in triplicate to ensure reproducibility of the experiments.
Characterization techniques
The presence of crystalline phases in the samples was examined by powder X-ray diffraction using a PANalytical X’Pert PRO diffractometer with Cu-K α (λ=1.5418 Å) radiation. In these studies, a portion of the purified colloidal sample was dried at 50°C overnight on a glass substrate in the dark. The values of the mean coherence length perpendicular to the silver crystallographic planes (111), L111, were estimated using the Scherrer equation:20
|
|

where λ is the X-ray wavelength, β is the broadening of the diffraction peak (after subtracting the instrumental broadening), and θ is the Bragg angle. Conventional and high-resolution transmission electron microscopy (TEM and HRTEM, respectively) micrographs and selected-area electron diffraction (SAED) patterns were taken with a FEI-TITAN 80–300 kV microscope operated at 300 kV. Also, spectra of energy dispersive spectrometry (EDS) were recorded with an EDS analyzer attached to the TEM. For these characterizations, a drop of the colloidal sample was deposited on a lacey-carbon copper grid. There was no evidence of structural or chemical transformations of the samples during the TEM examination. The processing of the TEM micrographs and the analysis of the HRTEM images by fast Fourier transform (FFT) were carried out using the Digital Micrograph 3.7.0 software (Gatan Software, Inc, Pleasanton, CA, USA), and the FFT images and the SAED patterns were interpreted with patterns simulated using the Web-based Electron Microscopy Application Software (Web-EMAPS).21 The vibrational band analysis of the coriander extracts and the final nanostructures was carried out by Fourier transform infrared (FTIR) and Raman spectroscopies. The FTIR spectra were recorded in a Nicolet 510 Fourier transform spectrometer after diluting the specimens in KBr pellets. The studied wave number range was 400–4,000 cm−1. Raman spectra were collected in a Horiba HR800 UV Confocal Raman microscope over the range 200–4,000 cm−1. For these measurements, a green laser (532.14 nm), working at 600 line/mm, 100× objective, 20 mW, and 0.1 mm pinhole, was used. The optical properties of the silver nanostructures were analyzed by ultraviolet-visible (UV-vis) spectroscopy using a Thermo Nicolet 60S.
Biological assays
The bactericidal properties of the coriander extracts and the biosynthesized colloids of Ag nanoparticles were proved against experimental models of Gram-positive and Gram-negative bacteria, specifically Salmonella typhimurium (ATCC 14028) and Staphylococcus aureus (ATCC 25923). Radial diffusion assays were performed using a bacterial density of 0.6 optical density units for both the strains. These experiments were carried out separately in 100×15 mm Petri dishes poured with 20 mL nutrient agar media and inoculated with each one of the bacterial strains. A 20 μL aliquot of the coriander extracts or 20 μL of aqueous colloidal suspensions of the biosynthesized nanoparticles with a concentration of 10 mg·mL−1 was dropped in the middle of each dish. All preparations were incubated for 24 hours at 37°C. Afterwards, growth inhibition areas were measured to establish the antibacterial effect of the biosynthesized nanoparticles.
Minimal inhibitory concentration (MIC) assays were also carried out to determine the lowest concentration of nanoparticles required to obtain a visible inhibition in the bacterial proliferation. For these assays, cultures were prepared in Trypticase soy broth media in 96-well plates and were immediately incubated at 37°C for 24 hours. Samples were tested against both bacterial strains from 132 μg·mL−1 to 0.13 μg·mL−1 of silver. After incubation, the absorbance of the wells was read at 540 nm. The minimal concentration required for growth inhibition was estimated by reference to the positive control of each strain.
Results and discussion
Representative X-ray diffraction patterns of samples prepared by using coriander seed and leaf extracts are shown in Figure 1. In these patterns, well-defined diffraction peaks corresponding to the (111), (200), (220), and (311) planes of face-centered cubic (fcc) metallic silver (Joint Committee on Power Diffraction Standards [JCPDS] file number: 04-0783) are clearly observed.14 The mean (± SD) length (L) perpendicular to the (111) planes calculated using the Scherrer equation for the samples L-0.5M and S-0.5M were 18(±2) and 16(±2) nm, respectively. The relative intensities of the Bragg peaks were strikingly different from those observed in the bulk standard reference sample (JCPDS file number: 04-0783), indicating that the (111) Bragg peaks in both biosynthesized samples were more intense than those found in the reference sample. Thus, the relative intensities of the Bragg peaks associated to the (200), (220), and (311) planes with respect to the intensity of the (111) diffraction peak were 10%, 22%, and 15% for the sample L-0.5M and 20%, 22%, and 20% for the sample S-0.5M, respectively, whereas the relative intensities of these peaks in the standard bulk sample were 40%, 25%, and 26%, respectively (JCPDS file number: 04-0783). These features indicate crystalline texture in the biosynthesized nanoparticles where the (111) crystal faces are predominantly exposed, probably promoted by the reduction in the surface energy of the particles since the close-packed (111) surface exhibits the lowest surface energy for the fcc metals.22,23
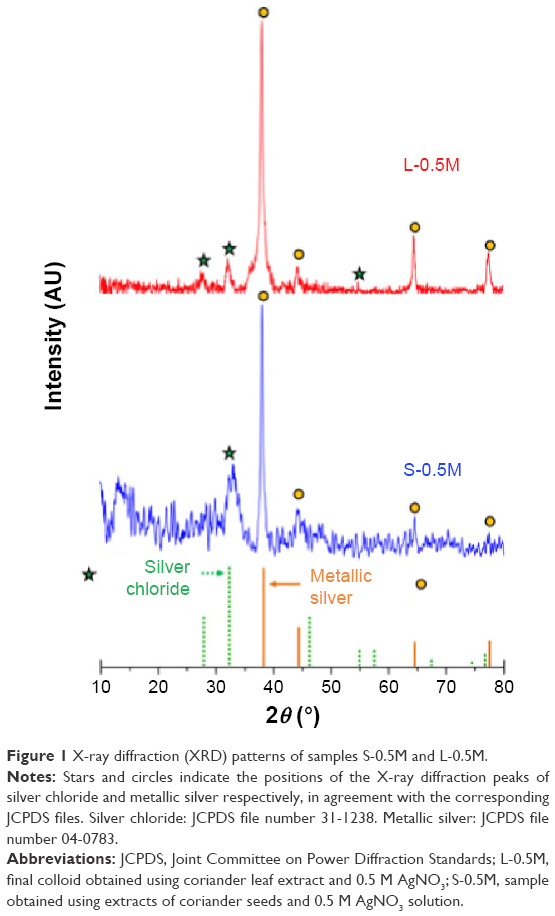 | Figure 1 X-ray diffraction (XRD) patterns of samples S-0.5M and L-0.5M. |
Additional small and very broad peaks at around 27.8°, 32.2°, and 46.2° were found. The appearance of similar peaks has been observed in other “biogenic-synthesized” Ag nanoparticles, and they have been ascribed to the crystallization of crystalline organometallic phase.13,17,24 However, the additional diffraction peaks observed in Figure 1 can be resolved and ascribed to an fcc phase of silver chloride, probably produced by the presence of sodium chloride in the coriander extracts.
Figure 2A depicts a representative TEM image of sample L-5mM. In this micrograph, the biosynthesized nanoparticles appear as well-dispersed dark dots embedded into an amorphous matrix associated to residual material of the coriander leaf extract. Most particles exhibited an ultrafine size with a mean diameter of 2.9(6) nm (Figure 2B represents the diameter distribution of these particles). However, a small fraction of the observed particles (<1%) exhibited sizes of several tens of nanometers (shown in the inset of Figure 2A). The appearance of these bigger particles could be reduced further by size-selection procedures such as ultracentrifugation. Figure 2C depicts a typical HRTEM of these nanoparticles showing lattice fringes associated to the fcc silver phase. Very similar features were observed for sample S-5mM (Figure 2D) with a mean diameter of 7(2) nm (shown in the inset of Figure 2D).
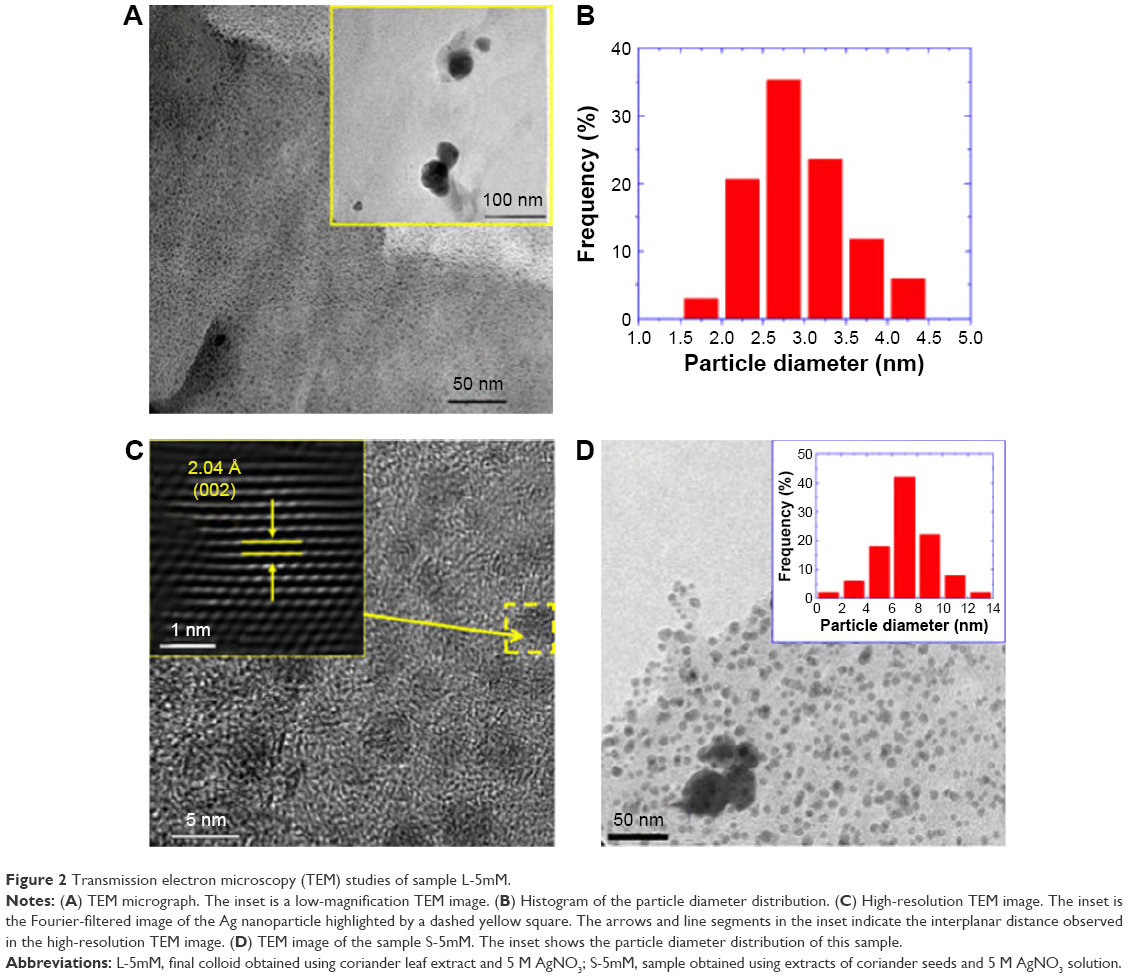 | Figure 2 Transmission electron microscopy (TEM) studies of sample L-5mM. |
An increase in the concentration of AgNO3 during biosynthesis with respect to the concentration of coriander leaf or seed extracts resulted in an increase in the degree of polydispersity of the resulting nanoparticles, owing to the occurrence of secondary particle growth by aggregation and coalescence, and probably by Ostwald ripening.25 In this manner, a broad and asymmetric size distribution was found for sample L-0.5M (Figure 3A and B). However, most particles of this sample (~90%) displayed diameters smaller than 10 nm, and ~45% exhibited sizes smaller than 5 nm. This is an interesting characteristic of this sample because previous results have indicated that the Ag nanoparticles of sizes smaller than 10 nm exhibit potent antibacterial26 and catalytic27 activities. On the other hand, the biggest particles (with sizes of tens of nanometers) tended to coalesce into elongated particles, whose surface served as preferential sites for nanoparticle aggregation (shown in the inset of Figure 3C), forming supramolecular branched structures (Figure 3C shows a typical TEM image of these structures). EDS analysis of these nanoparticle aggregates corroborated that their principal component is Ag (Figure 3D). Figure 3E shows a SAED pattern of a branch of the particle aggregate shown in Figure 3C. In this pattern, bright spots that can be indexed to the (111) zone axis of the metallic silver are observed, suggesting that the aggregation of the Ag nanoparticles occurs by a spontaneous oriented attachment, as it has been reported in other nanoparticle systems.28,29 Interestingly, some of the diffraction spots are associated to 1/3(224) forbidden reflections, which are usually observed in very thin nanostructures of fcc metals with (111) stacking faults.13,17,30
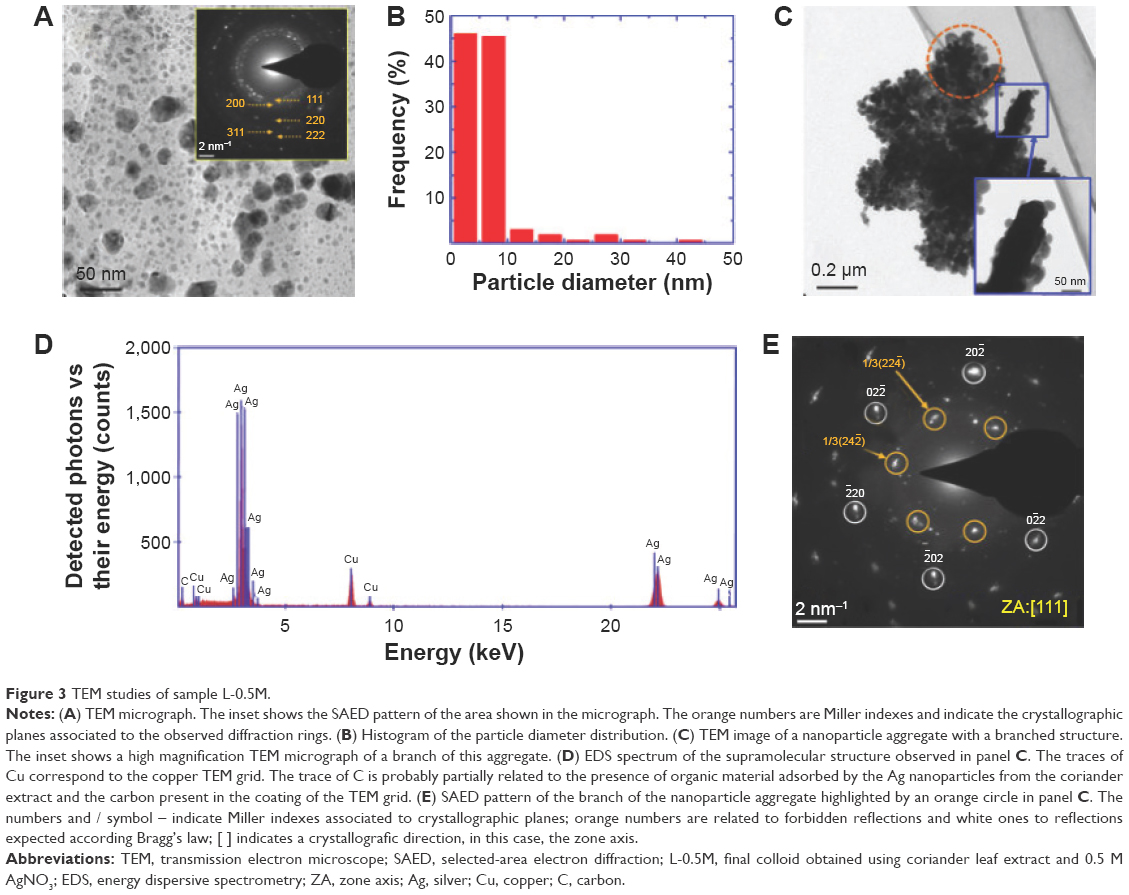 | Figure 3 TEM studies of sample L-0.5M. |
Figure 4A is a representative SAED pattern of sample S-0.5M. This is constituted by spotty rings associated to the (111), (002), (022), (113), and (222) planes of the fcc metallic silver. Moreover, some spots related to the additional crystalline phase detected by X-ray diffraction were also found. This sample also showed a broad and asymmetric size distribution (Figure 4B and C). In fact, particles with different morphologies and crystalline properties were observed. In this regard, most of the particles of this sample exhibited faceted morphologies and twinning boundaries. Figure 4D shows an HRTEM micrograph of a typical particle with these features. The FFT images of different zones showed that this particle is constituted by two twinned crystals viewed along the (110) direction (Figure 4E and F). Also, monocrystalline nanoparticles with a circular disc-like shape (Figure 5A) or with a rounded triangular morphology (Figure 5B) were observed. The FFT images of the HRTEM micrographs of these nanoparticles showed that these particles were usually viewed along the same crystallographic directions: the circular nanodiscs viewed down the (211) zone axis (Figure 5C), and the rounded nanotriangles viewed down the (111) zone axis (Figure 5D). Interestingly, some spots observed in these FFT images were associated to 1/2(113) (Figure 5C) or 1/3(224) (Figure 5D) forbidden reflections. In fact, the exposed faces of the rounded nanotriangles were related to the 3× (224) superlattices (Figure 5B and D). These features are in agreement with a flattened morphology.17,30 In addition, a minor fraction of particles exhibited rod-like shapes (Figure 5E) characterized by the presence of (111) stacking faults (Figure 5F). Some micrometric urchin-like (Figure 6A) and tree-like (Figure 6B) structures formed by aggregated and coalesced particles were also observed. The SAED patterns of these structures displayed spots that form arcs of ~30° (shown in the inset of Figure 6A), suggesting that these structures grew by oriented attachment of particles.
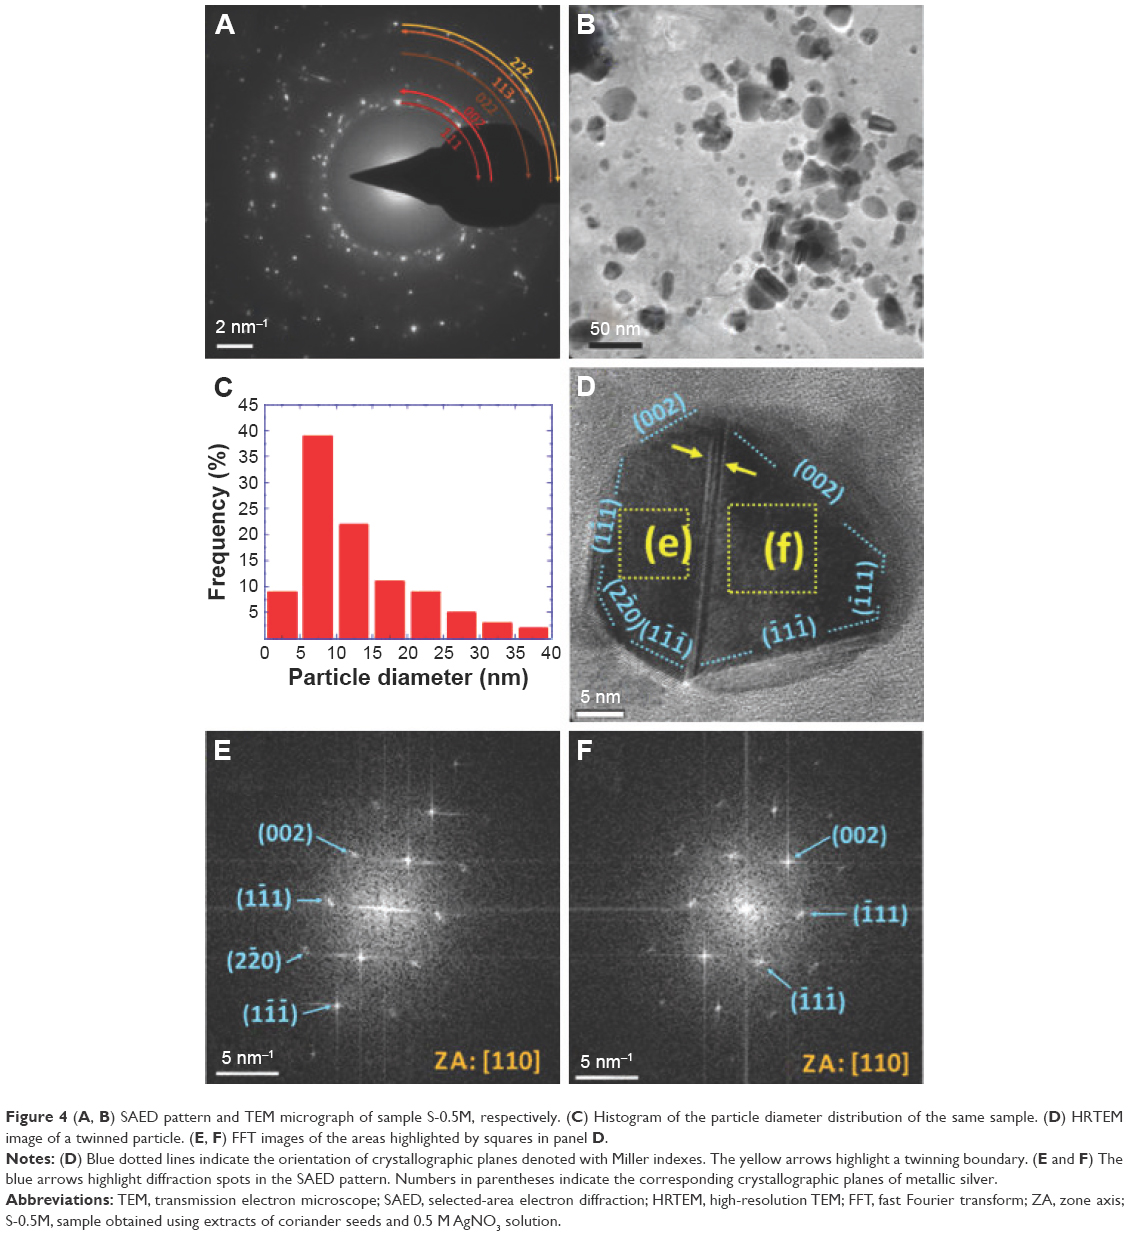 | Figure 4 (A, B) SAED pattern and TEM micrograph of sample S-0.5M, respectively. (C) Histogram of the particle diameter distribution of the same sample. (D) HRTEM image of a twinned particle. (E, F) FFT images of the areas highlighted by squares in panel D. |
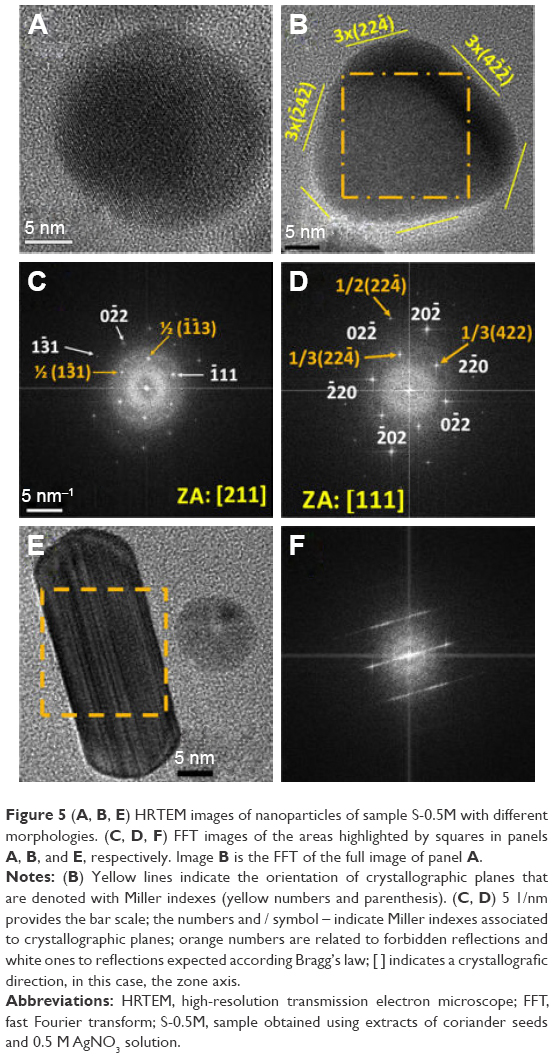 | Figure 5 (A, B, E) HRTEM images of nanoparticles of sample S-0.5M with different morphologies. (C, D, F) FFT images of the areas highlighted by squares in panels A, B, and E, respectively. Image B is the FFT of the full image of panel A. |
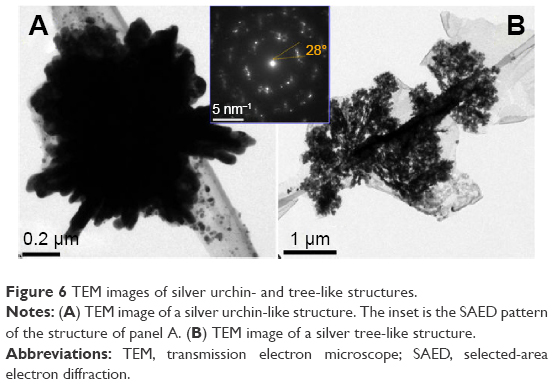 | Figure 6 TEM images of silver urchin- and tree-like structures. |
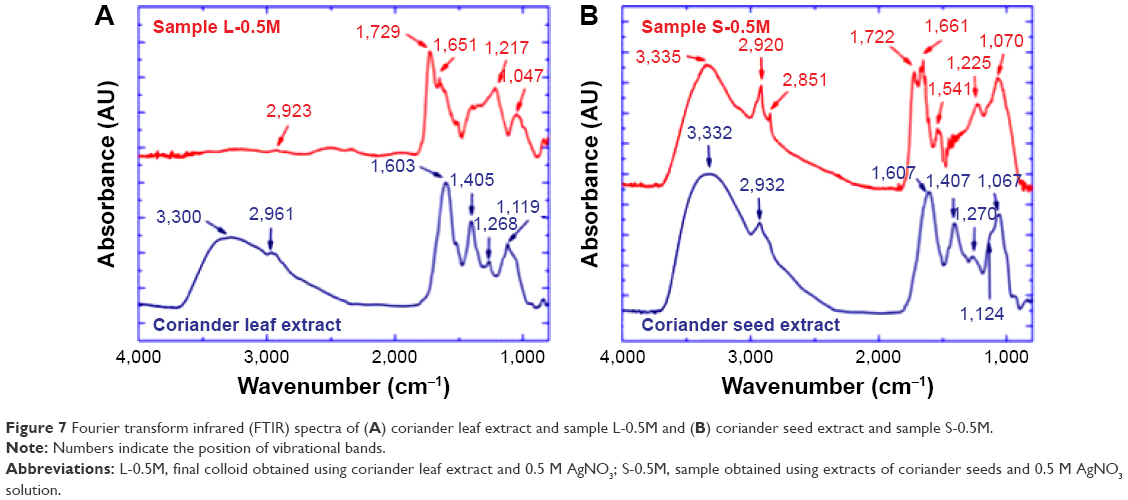
FTIR and Raman spectroscopic studies were carried out to identify the functional groups responsible for the bioreduction of Ag+ ions and the stabilizing action of Ag nanoparticles. Figure 7A presents the FTIR spectra of the coriander leaf extract and sample L-0.5M. In the spectrum of the leaf extract, the broad band observed in the wavenumber range of 3,700–2,500 cm−1 and centered around 3,300 cm−1 can be mainly attributed to N–H and O–H stretching vibrations of coriander proteins and phenols. The peak at 2,961 cm−1 is associated to stretching vibrations of methyl groups, and the absorbance bands observed at 1,603, 1,405, and 1,119 cm−1 can be associated to C=O stretching vibrations (from amide I of proteins), C–OH bending vibrations (from phenols, polysaccharides, and polyols), and –C–O and C–O–H stretching vibrations of alcohols, respectively. Also, the band at 1,119 cm−1 could have contributions from C–N stretching vibrations of amine. The weak peak at 1,268 cm−1 could correspond to the C–H vibration of methyl group and/or C–O stretching band.
 | Figure 7 Fourier transform infrared (FTIR) spectra of (A) coriander leaf extract and sample L-0.5M and (B) coriander seed extract and sample S-0.5M. |
In the FTIR spectrum of sample L-0.5M, the broad band at 3,300 cm−1 and the peaks at 1,405 and 1,119 cm−1 are absent. On the other hand, a peak at 2,923 cm−1 that can be assigned to aldehydic C–H stretching; a sharp band at 1,729 cm−1 that is assigned to the stretch vibration of –C=O of carboxylic acid groups; a peak at 1,651 cm−1 that corresponds to carbonyl stretch (amide I band); a wide band around 1,217 cm−1 that can be associated to stretching vibrations of C–O in polyols and phenols, δ(CH), and δ(CN); and a band at 1,047 cm−1 that could be related to –C–O vibration of alcoholic groups are observed. From these results, we can conclude that organic molecules, mainly residues of polyphenols and proteins, cap the Ag nanoparticles providing them a hybrid core/shell structure. Specifically, the appearance of a sharp band at 1,729 cm−1 and the presence of a band at 1,047 cm−1 indicate that the coriander biomolecules linked to the nanoparticle surface have carboxylic acid groups. This fact, together with the observation of some bands corresponding to polyphenols and proteins and the inhibition of the bands associated to the amino and hydroxyl groups, suggests that the bioreduction of Ag− ions takes place through their interactions with proteins (through free amine groups) and polyphenols (through the hydroxyl groups). This hypothesis is supported by the presence of high content of proteins and polyphenols in coriander.9
Figure 7B depicts the FTIR spectra of the coriander seed extract and sample S-0.5M. The extract spectrum displays absorbance bands similar to those observed for the coriander leaf extract (centered at 3,332, 2,932, 1,607, 1,407, 1,270, 1,124, and 1,067 cm−1). On the other hand, the FTIR spectrum of sample S-0.5M (Figure 7B) presents absorbance bands similar to those exhibited by sample L-0.5M (centered at 2,920, 1,722, 1,661, 1,225, and 1,070 cm−1). In addition, the amide II band is observed at 1,541 cm−1, and a band at 2,851 cm−1, which could be associated to stretching vibrations of methylene groups, is also observed. In addition, in contrast with the FTIR spectrum of sample L-0.5M (Figure 7A), the broad band found in the wave number range of 3,700–2,500 cm−1 for the coriander extracts remains in the spectrum of sample S-0.5M. This could be due to the conjugation of proteins of the coriander seed extract with the Ag nanoparticles through the carboxylate ion (–COO–) groups. Therefore, we can conclude that proteins and polyphenols of coriander seed extract are also responsible for the interaction with the Ag− ions.15
Figure 8A and B shows the Raman spectra of the coriander extracts and samples L-0.5M and S-0.5M. In both spectra of the biosynthesized samples, two very pronounced bands at around 1,350 and 1,585 cm−1 are observed. They can be associated to symmetric and asymmetric C=O stretching vibrations of the COO− ions,31,32 respectively, and/or phenyl ring stretch.32,33 The high intensity of these bands clearly confirms that the Ag nanoparticle surface and carboxylate ions and/or phenyl groups are directly bound, the Raman signals of which are amplified by the SERS effect.19 In addition, the appearance of a band at around 235 cm−1, which has been associated with the stretching vibrations of Ag–N31,32,34 and Ag–O32,33 vibrations, confirms the formation of bonds between Ag nanoparticle surface and the nitrogen atom of amine groups34 and the oxygen of carboxylate ions32 and/or hydroxyl ions.
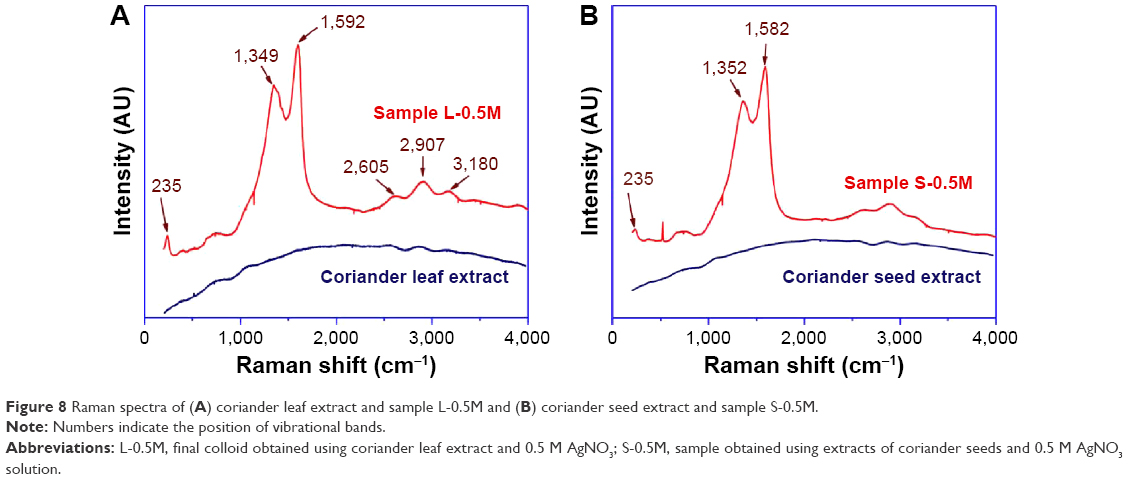 | Figure 8 Raman spectra of (A) coriander leaf extract and sample L-0.5M and (B) coriander seed extract and sample S-0.5M. |
Figure 9 shows the UV-visible spectra of the Ag samples and the two extracts. These spectra disclose that the biosynthesized colloids exhibit extinction peaks that are not observed in the spectra of the initial coriander extracts and that they are originated by the surface plasmon absorption of very fine Ag particles. Samples obtained with higher concentrations of AgNO3, L-0.5M and S-0.5M, exhibited broader extinction bands at larger wavelengths (at 470 and 458 nm) in comparison to samples obtained with lower concentrations of AgNO3, L-5mM and S-5mM, the plasmon extinction bands of which were centered at 440 and 437 nm, respectively.
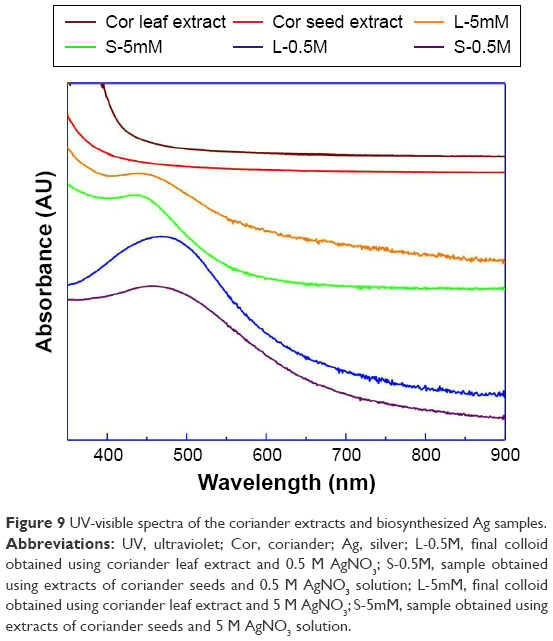 | Figure 9 UV-visible spectra of the coriander extracts and biosynthesized Ag samples. |
The biological assays showed that the biosynthesized silver samples displayed a significant antibacterial effect against Gram-negative (S. typhimurium) and Gram-positive (S. aureus) bacteria, whereas the coriander extracts exhibited a weak antibacterial activity. Figures 10 and 11 depict photographs of the bacteria grown on agar plates in the presence and absence of 20 μL of the coriander extracts or 20 μL of aqueous colloidal suspensions of the biosynthesized nanoparticles at a concentration of 10 mg·mL−1. Interestingly, for both bacteria, the agar plates incubated in the presence of coriander leaf extract exhibited regions in which the bacterial growth was clearly inhibited (Figures 10B and 11B) in comparison with the control experiment (Figures 10A and 11A), whereas this effect was much less marked for agar plates incubated in the presence of coriander seed extract (Figures 10C and 11C). However, clear nongrowth halos were observed in the agar plates for both bacteria when incubated in the presence of biosynthesized silver samples.
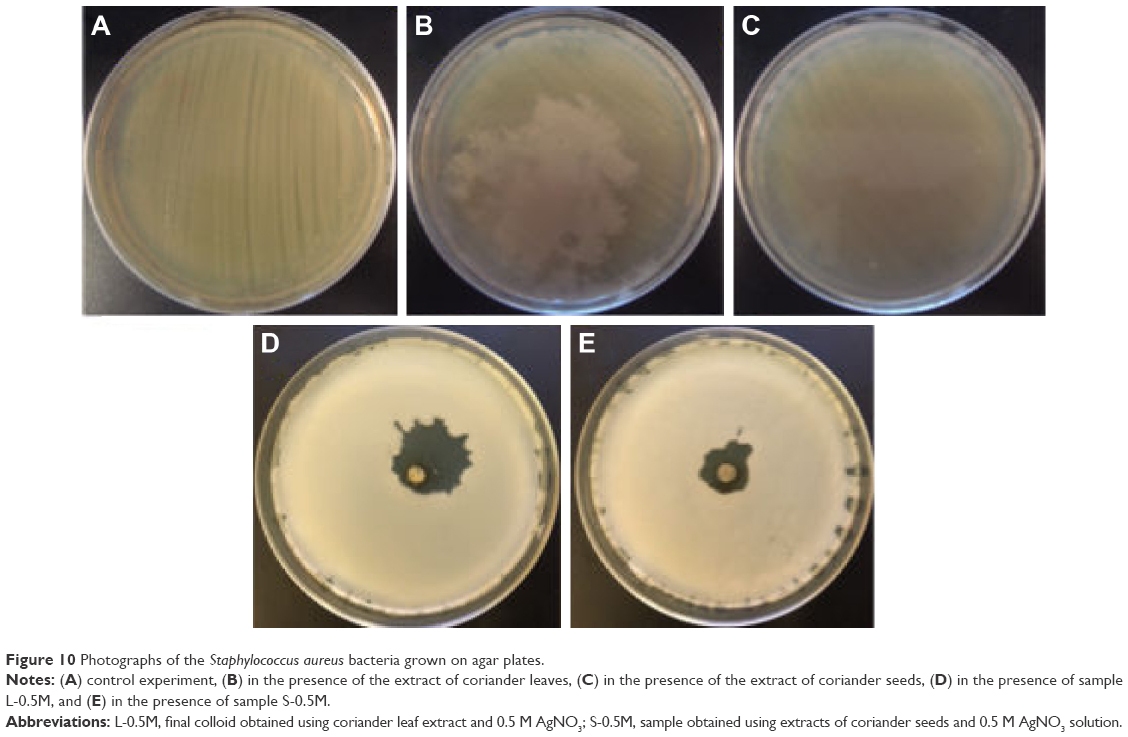 | Figure 10 Photographs of the Staphylococcus aureus bacteria grown on agar plates. |
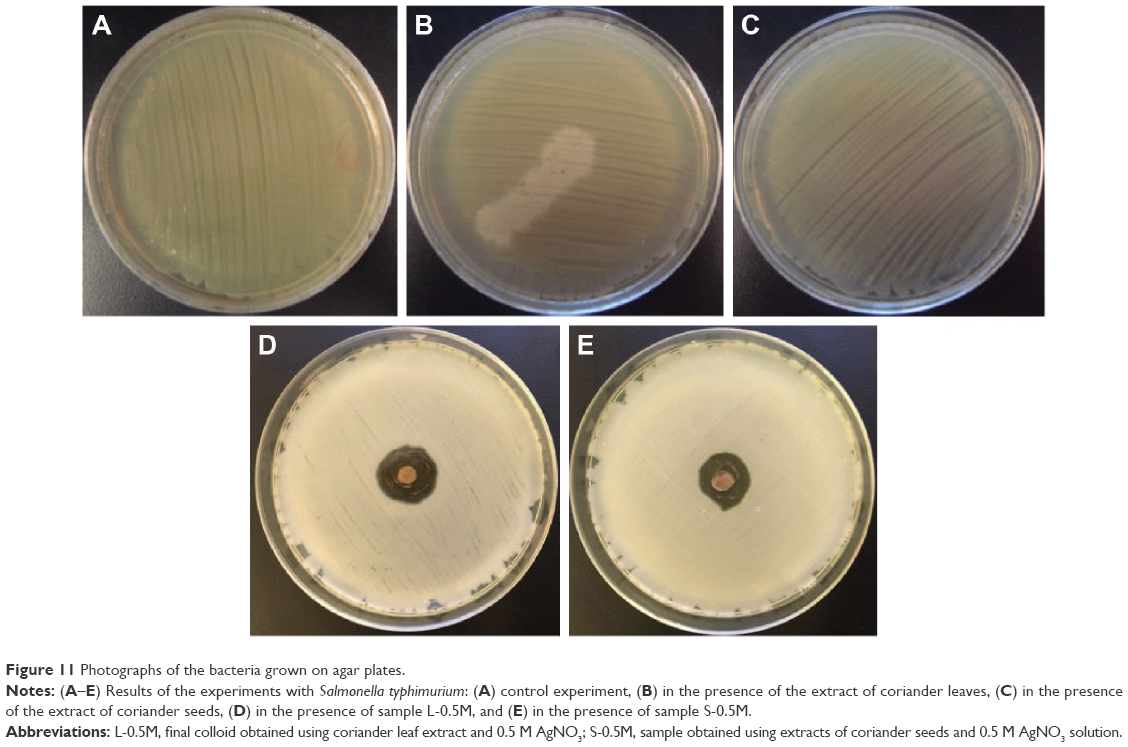 | Figure 11 Photographs of the bacteria grown on agar plates. |
The MIC experiments showed that the amount of silver required for producing a significant inhibition in the growth of the Gram-positive and Gram-negative bacteria was less than 2 μg·mL−1 (Figure 12), concentration lower than the MIC values typically reported in the literature using Ag nanoparticles.35,36 These extreme low values are due probably to the synergy of the bactericidal activities of the biosynthesized nanoparticles and their capping ligands which are residues of coriander biomolecules. In this regard, it is important to note that both coriander extracts did not display effects on the bacterial growth at concentrations below 100 μg·mL−1.
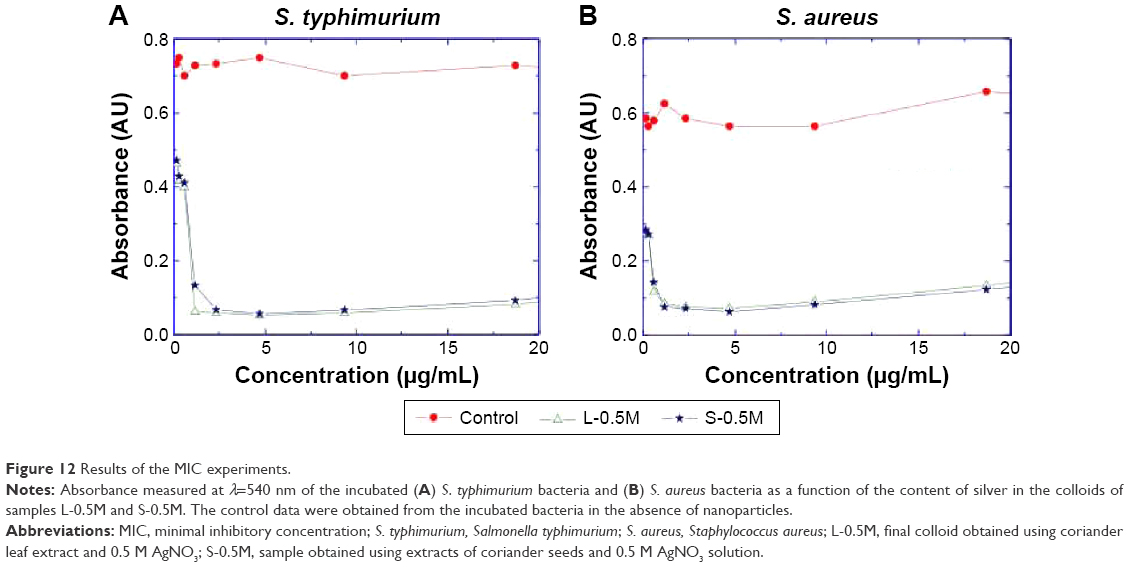 | Figure 12 Results of the MIC experiments. |
Conclusion
Crystalline ultrafine Ag nanoparticles and supramolecular Ag structures with urchin- and tree-like shapes have been synthesized at room temperature using aqueous solutions of AgNO3 and extracts of coriander leaves and seeds. FTIR and Raman spectroscopies indicated that residues of coriander proteins and polyphenols cap these nanomaterials providing them a hybrid core/shell structure. Such structures exhibit size-dependent plasmon extinction bands and enhanced bactericidal activities against both Gram-positive and Gram-negative bacteria with minimal inhibitory Ag concentrations lower than the MIC values reported in the literature for Ag nanoparticles, probably due to the synergy of the bactericidal activities of the Ag nanoparticle cores and their capping ligands.
Acknowledgments
The authors acknowledge financial support from the National Council of Science and Technology of Mexico/Consejo Nacional de Ciencia y Tecnología de México (CONACYT) and Secretariat of Public Education of Mexico/Secretaría de Educación Pública de México (SEP) under research projects CB12-179486 and Red temática de colaboración Sistemas de baja dimensionalidad con aplicaciones biotecnológicas [Thematic network of academic collaboration low dimensional systems with biotechnological applications].
Disclosure
The authors report no conflicts of interest in this work.
References
Burdock GA, Carabin IG. Safety assessment of coriander (Coriandrum sativum L.) essential oil as a food ingredient. Food Chem Toxicol. 2009;47(1):22–34. | ||
Swanston-Flatt SK, Day C, Bailey CJ, Flatt PR. Traditional plant treatments for diabetes. Studies in normal and streptozotocin diabetic mice. Diabetologia. 1990;33(8):462–464. | ||
Baratta MT, Dorman HD, Deans SG, Biondi DM, Ruberto G. Chemical composition, antimicrobial and antioxidative activity of laurel, sage, rosemary, oregano and coriander essential oils. J Essent Oil Res. 1998;10:618–627. | ||
Wichtl MW. Herbal Drugs and Phytopharmaceuticals. Stuttgart, Germany: Medpharm GmbH Scientific Publishers; 1994. | ||
Delaquis PJ, Stanich K, Girard B, Mazza G. Antimicrobial activity of individual and mixed fractions of dill, cilantro, coriander and eucalyptus essential oils. Inter J Food Microbiol. 2002;74(1–2):101–109. | ||
Platel K, Rao A, Saraswathi G, Srinivasan K. Digestive stimulant action of three Indian spice mixes in experimental rats. Nahrung. 2002;46(6):394–398. | ||
Leung AY, Foster S. Coriander Encyclopedia of Common Natural Ingredients. New York, NY: John Wiley and Sons Inc.; 1996:193–194. | ||
Lo Cantore P, Iacobellis NS, DeMarco A, Capasso F, Senatore F. Antibacterial activity of Coriandrum sativum L. and Foeniculum vulgare Miller var. vulgare (Miller) essential oils. J Agric Food Chem. 2004;52(26):7862–7866. | ||
Wangensteen H, Samuelsen AB, Malterud KE. Antioxidant activity in extract from coriander. Food Chem. 2004;88:293–297. | ||
Badri Narayanan K, Sakthivel N. Coriander leaf mediated biosysthesis of gold nanoparticles. Mater Lett. 2008;62:4588–4590. | ||
Sathyavathi R, Krishna MB, Rao SV, Saritha R, Rao DN. Biosynthesis of silver nanoparticles using Coriandrum sativum leaf extract and their application in nonlinear optics. Adv Sci Lett. 2010;3:138–143. | ||
Iravani S. Green synthesis of metal nanoparticles using plants. Green Chem. 2011;13:2638–2650. | ||
Mendoza-Reséndez R, Núnez NO, Barriga-Castro ED, Luna C. Synthesis of metallic silver nanoparticles and silver organometallic nanodisks mediated by extracts of Capsicum annuum var. aviculare (piquin) fruits. RSC Adv. 2013;3:20765–20771. | ||
Luna C, Chávez VHG, Barriga-Castro ED, Núñez NO, Mendoza-Reséndez R. Biosynthesis of silver fine particles and particles decorated with nanoparticles using the extract of Illicium verum (star anise) seeds. Spectrochim Acta A Mol Biomol Spectrosc. 2015;141:43–50. | ||
Philip D. Honey mediated green synthesis of silver nanoparticles. Spectrochim Acta Part A. 2010;75:1078–1081. | ||
Philip D. Honey mediated green synthesis of gold nanoparticles. Spectrochim Acta Part A. 2009;73:650–653. | ||
Mendoza-Reséndez R, Gómez-Treviño A, Barriga-Castro ED, Núñez NO, Luna C. Synthesis of antibacterial silver-based nanodisks and dendritic structures mediated by royal jelly. RSC Adv. 2014;4:1650–1658. | ||
Sharma VK, Yngard RA, Lin Y. Silver nanoparticles: green synthesis and their antimicrobial activities. Adv Colloid Interface Sci. 2009;145(1–2):83–96. | ||
Álvarez-Puebla RA, Liz-Marzán LM. SERS-based diagnosis and biodetection. Small. 2010;6(5):604–610. | ||
Cullity BD, Stock SR. Elements of X-ray Diffraction. Englewood Cliffs, NJ: Prentice-Hall; 2001. | ||
Zuo JM, Mabon JC. Web-based Electron Microscopy Application Software: Web-EMAPS. Microsc Microanal. 2004;10(Suppl 2). Available from: http://emaps.mrl.uiuc.edu/. Accessed March 1, 2016. | ||
Zhang JM, Ma F, Xu K-W. Calculation of the surface energy of FCC metals with modified embedded-atom method. Appl Surface Sci. 2004;229:34–42. | ||
Wen YN, Zhang JM. Surface energy calculation of the fcc metals by using the MAEAM. Solid State Commun. 2007;144(3):163–167. | ||
Philip D. Biosynthesis of Au, Ag and Au–Ag nanoparticles using edible mushroom extract. Spectrochim Acta A Mol Biomol Spectrosc. 2009;73:374–381. | ||
Luna C, Mendoza-Reséndez R. Fundamentals of the nanocrystal formation from supersaturated solutions. In: Lima AH, editor. Biomimetic and Supramolecular Systems Research. Hauppauge, NY: Nova Science Publishers; 2008:271–307. | ||
Morones JR, Elechiguerra JL, Camacho A, et al. The bactericidal effect of silver nanoparticles. Nanotechnology. 2005;16:2346–2353. | ||
Chimentao RJ, Kirm I, Medina F, et al. Different morphologies of silver nanoparticles as catalysts for the selective oxidation of styrene in the gas phase. Chem Commun. 2004;7:846–847. | ||
Zhang Q, Liu SJ, Yu SH. Recent advances in oriented attachment growth and synthesis of functional materials: concept, evidence, mechanism, and future. J Mater Chem. 2009;19:191–207. | ||
Luna C, Barriga-Castro ED, Mendoza-Reséndez R. The effects of aging time on the size, morphology, oriented attachment and magnetic behavior of hematite nanocrystals synthesized by forced hydrolysis of FeIII solutions. Acta Mater. 2014;66:405–413. | ||
Germain V, Li J, Ingert D, Wang ZL, Pileni MP. Stacking faults in formation of silver nanodisks. J Phys Chem B. 2003;107:8717–8720. | ||
Chowdhury J, Ghosh M. Concentration-dependent surface-enhanced Raman scattering of 2-benzoylpyridine adsorbed on colloidal silver particles. J Colloid Interface Sci. 2004;277:121–127. | ||
Kora AJ, Sashidhar RB, Arunachalam J. Aqueous extract of gum olibanum (Boswellia serrata): a reductant and stabilizer for the biosynthesis of antibacterial silver nanoparticles. Process Biochem. 2012;47:1516–1520. | ||
Biswas N, Kapoor S, Mahal HS, Mukherjee T. Adsorption of CGA on colloidal silver particles: DFT and SERS study. Chem Phys Lett. 2007;444(4):338–345. | ||
Mukherjee P, Roy M, Mandal BP, et al. Green synthesis of highly stabilized nanocrystalline silver particles by a non-pathogenic and agriculturally important fungus T. asperellum. Nanotechnology. 2008;19(7):075103. | ||
Li WR, Xie XB, Shi QS, Zeng HY, Ou-Yang YS, Chen YB. Antibacterial activity and mechanism of silver nanoparticles on Escherichia coli. Appl Microbiol Biotechnol. 2010;85:1115–1122. | ||
Panáček A, Kvitek L, Prucek R, et al. Silver colloid nanoparticles: synthesis, characterization, and their antibacterial activity. J Phys Chem B. 2006;110(33):16248–16253. |
 © 2016 The Author(s). This work is published and licensed by Dove Medical Press Limited. The
full terms of this license are available at https://www.dovepress.com/terms.php
and incorporate the Creative Commons Attribution
- Non Commercial (unported, v3.0) License.
By accessing the work you hereby accept the Terms. Non-commercial uses of the work are permitted
without any further permission from Dove Medical Press Limited, provided the work is properly
attributed. For permission for commercial use of this work, please see paragraphs 4.2 and 5 of our Terms.
© 2016 The Author(s). This work is published and licensed by Dove Medical Press Limited. The
full terms of this license are available at https://www.dovepress.com/terms.php
and incorporate the Creative Commons Attribution
- Non Commercial (unported, v3.0) License.
By accessing the work you hereby accept the Terms. Non-commercial uses of the work are permitted
without any further permission from Dove Medical Press Limited, provided the work is properly
attributed. For permission for commercial use of this work, please see paragraphs 4.2 and 5 of our Terms.