Back to Journals » OncoTargets and Therapy » Volume 9
MicroRNA profiling of patient plasma for clinical trials using bioinformatics and biostatistical approaches
Authors Markowitz J, Abrams Z, Jacob N, Zhang X, Hassani J, Latchana N, Wei L ![]() , Regan K, Brooks T, Uppati S, Levine K, Bekaii-Saab T, Kendra K, Lesinski G, Howard J, Olencki T, Payne P, Carson III W
, Regan K, Brooks T, Uppati S, Levine K, Bekaii-Saab T, Kendra K, Lesinski G, Howard J, Olencki T, Payne P, Carson III W
Received 13 February 2016
Accepted for publication 3 July 2016
Published 29 September 2016 Volume 2016:9 Pages 5931—5941
DOI https://doi.org/10.2147/OTT.S106288
Checked for plagiarism Yes
Review by Single anonymous peer review
Peer reviewer comments 3
Editor who approved publication: Dr William C. Cho
Joseph Markowitz,1–4 Zachary Abrams,2,5 Naduparambil K Jacob,2,6 Xiaoli Zhang,2,7 John N Hassani,1 Nicholas Latchana,8 Lai Wei,2,7 Kelly E Regan,2,5 Taylor R Brooks,2 Sarvani R Uppati,2 Kala M Levine,2 Tanios Bekaii-Saab,2,4 Kari L Kendra,2,4 Gregory B Lesinski,2,4 J Harrison Howard,2,8 Thomas Olencki,2,4 Philip R Payne,2,5 William E Carson III2,8
1Department of Cutaneous Oncology, Moffitt Cancer Center, Tampa, FL, 2Comprehensive Cancer Center, The Ohio State University, Columbus, OH, 3Department of Oncologic Sciences, USF Morsani School of Medicine, Tampa, FL, 4Division of Medical Oncology, The Ohio State University Wexner Medical Center, 5Department of Biomedical Informatics, 6Department of Radiation Oncology, 7Center for Biostatistics, 8Department of Surgery, The Ohio State University, Columbus, OH, USA
Background: MicroRNAs (miRNAs) are short noncoding RNAs that function to repress translation of mRNA transcripts and contribute to the development of cancer. We hypothesized that miRNA array-based technologies work best for miRNA profiling of patient-derived plasma samples when the techniques and patient populations are precisely defined.
Methods: Plasma samples were obtained from five sources: melanoma clinical trial of interferon and bortezomib (12), purchased normal donor plasma samples (four), gastrointestinal tumor bank (nine), melanoma tumor bank (ten), or aged-matched normal donors (eight) for the tumor bank samples. Plasma samples were purified for miRNAs and quantified using NanoString® arrays or by the company Exiqon. Standard biostatistical array approaches were utilized for data analysis and compared to a rank-based analytical approach.
Results: With the prospectively collected samples, fewer plasma samples demonstrated visible hemolysis due to increased attention to eliminating factors, such as increased pressure during phlebotomy, small gauge needles, and multiple punctures. Cancer patients enrolled in a melanoma clinical study exhibited the clearest pattern of miRNA expression as compared to normal donors in both the rank-based analytical method and standard biostatistical array approaches. For the patients from the tumor banks, fewer miRNAs (<5) were found to be differentially expressed and the false positive rate was relatively high.
Conclusion: In order to obtain consistent results for NanoString miRNA arrays, it is imperative that patient cohorts have similar clinical characteristics with a uniform sample preparation procedure. A clinical workflow has been optimized to collect patient samples to study plasma miRNAs.
Keywords: miRNA, profiling, melanoma, rank-based statistic
Background
The incidence of melanoma is steadily rising in the US. In 2016, it is estimated that there will be over 76,000 new cases of melanoma in the US and over 10,000 deaths from the disease.1 The long-term prognosis for patients with thin melanomas (≤1.0 mm thick) disease is excellent with surgical excision (>90% 5-year overall survival). However, with involvement of the lymph nodes or the presence of metastatic disease, 5-year survival rates are poor. Responses to combination cytotoxic chemotherapy for stage IV melanoma take place in a minority of patients and the responses are generally short-lived. Although targeted and immune-based therapies show promise, toxicities, development of resistance, and overall response rate are not yet optimal.2 Investigation of the biological processes involved in the development and progression of metastatic disease is crucial for the identification of new therapeutic agents.
MicroRNAs (miRNAs) are short RNA molecules that inhibit the translation of mRNA transcripts. Each miRNA is therefore responsible for regulating multiple genes and can serve as a marker for complex biological processes. In bodily fluids (such as blood), miRNAs are remarkably stable and may be used as biomarkers to predict both cancer progression and response to therapy.3
Specific miRNAs are overexpressed in malignant melanoma. Our group has shown that primary melanomas have an 8.6-fold overexpression of miR-21 and a 7.5-fold overexpression of miR-155 compared with benign nevi (P<0.0001).4 Segura et al found that miR-150, miR-342-3p, miR-455-3p, miR-145, miR-155, and miR-497 overexpression correlated with increased postrecurrence survival following surgical resection.5 An emerging role for miRNAs in melanoma tumorigenesis and invasion is becoming apparent. The let-7 family of miRNAs are downregulated in primary melanomas compared to benign nevi, which may affect cell cycle progression and colony formation through altered expression of cyclin D1, D3, and cyclin-dependent kinase.6 miR-211 is elevated in melanoma and inhibits NUAK, which is an AMP-activated protein kinase-related kinase directly phosphorylated by LKB1 downstream of AKT. Evidence for a role of miR-211 in melanoma comes from the fact that inhibition of miRNA-211 in melanoma cells results in increased levels of NUAK1 and decreased adhesion.7 miR-221 and miR-222 inhibit c-KIT and p27 translation, which result in increased cellular proliferation, migration, invasion, and anchorage-independent growth in Me1402/R melanoma cells.8 When melanoma cells were transfected with miR-222 and injected subcutaneously into athymic mice, the tumors generated demonstrated increased growth as compared to a melanoma cell transfected with a control oligonucleotide.8
Many miRNA studies are hampered by the lack of procedural standards that produce noncompatible laboratory results. The ability to compare analytic results is undermined by the variability in collection tube types or the type of fluid collected from peripheral blood (serum vs plasma), contamination with red blood cell (RBC) miRNAs due to hemolysis, and utilization of different biostatistical methods.9,10 For example, miRNA markers of the coagulation cascade are noted only in serum samples and not in plasma samples.10,11 Furthermore, both plasma and serum themselves can be collected in a variety of tube types (Ethylenediaminetetraacetic acid [EDTA], acid citrate dextran [ACD], heparin). For measuring free circulating DNA, plasma collected from EDTA tubes gives more reproducible results than plasma collected from heparin or citrate tubes.12 Similar issues have been identified in miRNA studies and are likely due to inhibition of RNA polymerases by heparin or citrate.13–15 However, many groups have large repositories of plasma stored in freezers that were collected by centrifugation of peripheral blood samples collected in heparin or citrate tubes.
In this study, miRNAs were isolated from plasma collected in heparin and ACD tubes and measured using array-based technologies. Data were analyzed via standard biostatistical approaches and also via a miRNA rank-based analytic in order to avoid biases introduced when normalizing data with standard miRNA spike-in added to each patient sample. This study proposes a clinical workflow in melanoma and pancreatic cancer to measure miRNAs in all stages of research, from collecting the blood to analyzing the miRNAs obtained from cancer patients.
Methods
Overview
Methods are currently lacking for ensuring the collection of nonhemolyzed samples for downstream miRNA analysis and comparing miRNA across parallel or in series miRNA array experiments. In this study, peripheral phlebotomy techniques were optimized such that they could be performed routinely without visible evidence of hemolysis. This permits the efficient separation of plasma followed by RNA extraction and miRNA measurement without contamination of miRNAs from lysed cells. Purified plasma was utilized to isolate miRNAs, which were then subjected to two forms of measurements. These included: NanoString® (Nanostring Technologies, Inc., Seattle, WA, USA) miRNA arrays (heparin phlebotomy tubes) and quantitative polymerase chain reaction performed by Exiqon (Woburn, MA, USA) utilizing plasma derived from peripheral blood collected in ACD phlebotomy tubes. The data were initially analyzed via standard statistical approaches. Subsequently, a rank-based technique was employed that allows for the comparison of miRNAs across different runs of NanoString miRNA arrays (chips). Principle component analysis was utilized as a hypothesis-generating tool to determine patterns within the miRNA expression profiles between normal donors and cancer patients (Figure 1).
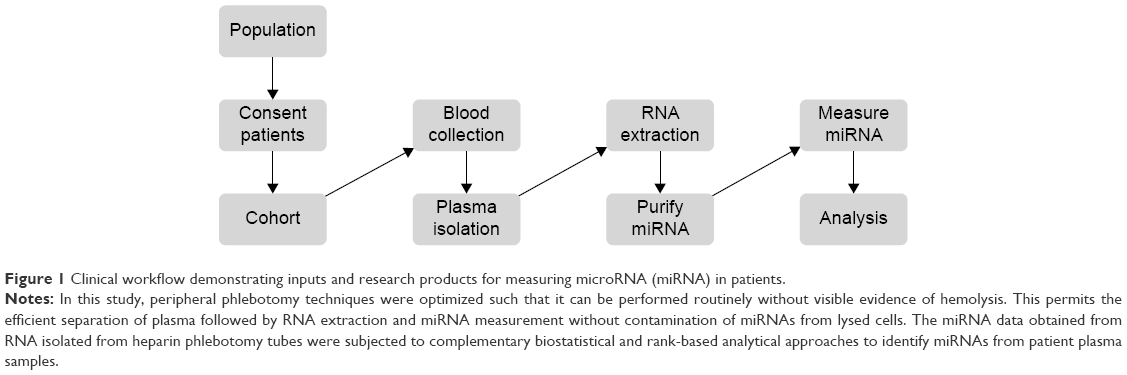 | Figure 1 Clinical workflow demonstrating inputs and research products for measuring microRNA (miRNA) in patients. |
Collection of peripheral blood samples
Written informed consent was obtained. Patients were consented for either The Ohio State University (OSU) Gastrointestinal tumor bank or the OSU Melanoma tumor bank and underwent phlebotomy using both heparin and ACD blood collection tubes utilizing 21 gauge or larger standard phlebotomy needles. Care was taken to avoid peripheral blood collection practices that result in hemolysis of blood samples, including the use of small gauge needles, not allowing the alcohol to dry, vigorous tube shaking, underfilled tubes, less experienced phlebotomists, increased tourniquet time, manipulation of the extremity, and high pressure collection systems out of intravenous catheters.16–19 Approval from the institutional review board of The Ohio State University was obtained for this study. Samples were processed within 2 hours via centrifugation of the samples @1,700 rpm for 11 minutes (Eppendorf 5810R centrifuge, Eppendorf, Hauppauge, NY, USA). The plasma was removed from phlebotomy tubes and stored at −70°C for future use. Samples obtained from a clinical trial consisting of metastatic melanoma patients undergoing treatment with interferon-alfa and bortezomib were collected in heparin tubes and stored at −70°C at the time of treatment (Figure 1; Table S1).
Isolation of miRNA
Heparinized samples were purified for miRNA via modifications of the miRNEASY kit by Qiagen (Valencia, CA, USA) as previously described. Briefly, miRNA from plasma samples was purified using a volumetric method developed internally using spike-ins of three known miRNAs, At-159a, Cel-248, and Osa-414.20 miRNA was purified from plasma obtained from ACD tubes by Exiqon.
Quantification of miRNA
miRNAs were measured in two ways. First, miRNA purified from heparinized tubes were quantified using NanoString miRNA arrays (nCounter system in the Nucleic Acid Shared Resource of The Ohio State University).20 The second manner in which the miRNAs were measured was via a quantitative polymerase chain reaction technique performed by Exiqon using the plasma obtained from ACD phlebotomy tubes. Two forms of normalization were utilized with the internally performed NanoString arrays. First, technical normalization of the data was performed against a set of internal controls available on miRNA chips obtained from NanoString. This normalization was used for both statistical and rank-based analyses. A second form of biological normalization was performed by normalizing the data against three miRNA spike-ins at known concentrations.20
Statistical analysis for NanoString miRNA arrays
The technically normalized data for each sample were first log 2 transformed. A filtering method was used based on the criteria that 11/12 or 10/12 values for that particular miRNA on a chip had values lower than the noise cutoff (mean negative values + 2 standard deviation). The miRNAs that fell below this threshold were filtered out and not used for further analysis. Then, a quantile normalization method was applied to the filtered data to further reduce bias. Analysis of variance was used for data analysis. A P-value of 1/(number of tested miRNAs) was utilized to determine significance given the number of miRNAs available for analysis.21
Rank-based miRNA method
The NanoString chip consisted of 12 lanes (one lane per patient sample). In each lane, 800 miRNAs were measured. First, the miRNAs were ordered from the highest to lowest expression (ranked), employing the technical normalization as the data starting point (Figure 2). This process controls for mechanical experimental error but does not require normalization based on additional miRNA spike-in controls in the experimental sample. Spike-in controls, although useful, can introduce another source of experimental uncertainty.22 Initially, a list of the top 5% (45) of the miRNAs present in the plasma of a melanoma patient in chip 1 was generated. Subsequently, a list of the top 5% (45) of the miRNAs that were present in the plasma of the first normal control donor in chip 1 was generated. The process was repeated for each of the eight patient samples and four normal donors, and thus 12 such lists were created. The miRNAs that were present in any of the top 5% of the normal donor control lists (four lists, union of the control list) were removed from the miRNAs that were present in the top 5% of highly expressing miRNAs in all the patient lists (eight lists, intercept of the patient lists) to generate a list consisting of upregulated miRNAs in patient samples (Figure 2). Our rank-based method starts the selection of upregulated miRNAs in a convenient feature list size of the top 5% of the miRNA list and repeats the process of finding upregulated miRNAs by expanding the feature list size (by 5%) through multiple iterations until the highest number of upregulated miRNAs are selected that have a nonrandom false positive rate (FPR) (estimated sensitivity and specificity >99.99%). The rank-based analytical approach therefore identified those miRNAs that are present in the interception of the top ranked miRNAs in the cancer patients and absent in the union of the top ranked miRNAs in the normal donors to determine upregulated miRNAs. This process was repeated for each NanoString miRNA array chip. The converse relationship was used to determine the downregulated miRNAs (Figure S1).
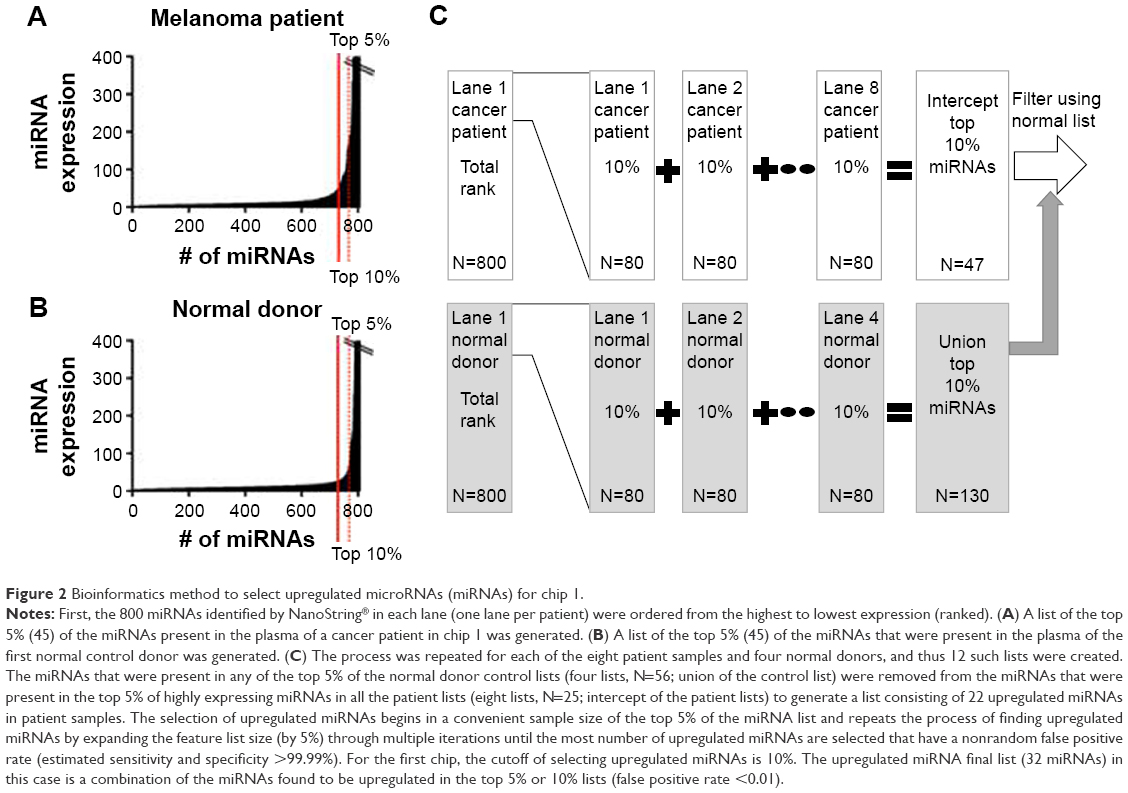 | Figure 2 Bioinformatics method to select upregulated microRNAs (miRNAs) for chip 1. |
The FPR for upregulated miRNAs is the total number of upregulated miRNAs that one would expect by chance. It is a multiplication of two independent probabilities obtained from the binomial distribution. A binomial distribution was chosen to express these data as this model was built with the assumption that all miRNA expression values that were measured on the chip and evaluated via the array-based platform were independent entities. Experimentally, this is the case as there is a specific probe for each miRNA. The first binomial distribution represents the probability that one will pick a miRNA that has significance in the patient samples (in the top X%). The second binomial distribution represents the probability that these same miRNAs are not ranked in the top (X%) of the normal donor samples. The total number of possible miRNAs expected by chance is a multiplication of these two independent probabilities by the total number of miRNAs measured (800). Therefore, the FPR for a miRNA to be upregulated is analogous to type 1 error used for clinical trials. There is also a FPR for a miRNA to be downregulated (similar to type II error used for clinical trials). In both cases, the sensitivity and specificity are >99% in theory for practical applications of this method to clinical trial samples. The standard P-value is not a useful measure in this analysis because the FPR of finding a significant miRNA in the ranked-based methodology is an absolute value determined at an intrachip level with a set experimental design (eg, eight patient plasma samples and four normal donor plasma controls) whereas the statistical P-value calculations place more value on the absolute value rather than the ranking of each miRNA measured on the array.
Principal component analysis
Principal component analysis is a mathematical technique that transforms the experimentally observed data into a set of new variables to determine similarities and differences between groups. Each lane of the NanoString chip corresponds to a single patient or normal donor control and can be considered to have 800 variables (miRNAs). Therefore, 800 dimensions can represent the data where each dimension represents the level of a particular miRNA. Principal component analysis attempts to reduce the dimensionality of the data. Principal component analysis assigns new variables (components) that describe the maximal variance of a sample. These components are independent from each other and represent a linear combination of a series of miRNAs in the original dataset.
Pathway map analysis
The software package QIAGEN’s Ingenuity Pathway Analysis® (IPA; Qiagen, Redwood City, CA, USA; www.qiagen.com/ingenuity) was utilized to generate the pathway map. The lists of miRNAs with their associated expression values from the NanoString chip found to be significant (biostatistical and bioinformatic approaches) were assembled into text files and imported into the IPA software. A specific link within the IPA software was utilized to search for relationships in pathways known in humans that matched the miRNA expression values. The resulting pathways were displayed in the software package. Minor alterations, such as applying color codes and editing of the text for display purposes, were undertaken for this publication.
Results
Collection of peripheral blood specimens
Thirty-nine plasma samples were collected from five different sources. Twelve samples collected from heparin tubes were available from metastatic melanoma cancer patients in the context of a clinical trial evaluating the combination of interferon-alfa and bortezomib.23 All the other collected samples were obtained in both heparin and ACD phlebotomy tubes. Nine samples were collected prospectively from metastatic melanoma patients. Ten samples were collected from patients with metastatic pancreatic cancer. Eight samples were collected from healthy normal controls. Also, four plasma samples from normal donors (ages 35–62) were purchased from Innovative Research, Inc. (Novi, MI, USA). Samples were centrifuged and the plasma layer was collected. If there were any signs of visible hemolysis in the plasma layer, the samples were not used in this study (Table S1).
Of the 12 plasma samples collected previously from a clinical trial and stored at −70°C, eight of 12 had no signs of visible hemolysis (67%). In the newly acquired melanoma and pancreas cohorts, eight of ten and eight of nine had no signs of visible hemolysis, respectively. The plasma from eight normal donors or the purchased samples exhibited no signs of visible hemolysis. Observational factors resulting in an increase rate of hemolysis were a difficult phlebotomy procedure and lack of sufficient blood flow. Seven hemolyzed samples were not used in the subsequent analysis.
Quantification of miRNAs
The 24 samples without evidence of visible hemolysis collected from metastatic melanoma patients, pancreatic adenocarcinoma patients, and normal donors were analyzed by Exiqon for evidence of hemolysis. There was inhibition of miRNA detection for seven of 24 samples collected in ACD tubes that rendered these samples ineligible for downstream analysis. However, in all 17 samples that were measured by Exiqon, the point at which the two miRNAs that indicate hemolysis (miR-23a and miR-451) became detectable was <4 dCp (Delta “d” of the crossing point “Cp” for the threshold of detecting the miRNAs). A value <7 dCp is considered to be relatively free from contamination by hemolysis. For subsequent analysis by miRNA arrays, eight samples were used from each of the cohorts: melanoma patients previously on trial, metastatic melanoma patients, metastatic pancreatic adenocarcinoma patients, and normal donors in addition to the four purchased normal donor plasma samples (36 total; 12 samples per chip).
miRNAs from plasma samples collected from the heparin tubes were measured via NanoString miRNA arrays. Three chips were employed. Chip 1 was used to measure miRNAs in eight previously collected plasma samples from patients who received bortezomib and interferon-alfa on the OSU-04105 clinical trial along with purchased plasma from four normal donors. Chip 2 was loaded with eight plasma samples obtained from the prospectively collected metastatic melanoma patients receiving various surgical, radiation, immunotherapy, and/or targeted therapies and plasma from four normal donors procured at OSU. Chip 3 consisted of eight plasma samples from metastatic pancreatic cancer patients receiving treatment (including gemcitabine-based chemotherapy, 5-fluorouracil-based chemotherapy, and participation in a clinical trial consisting of carboplatin/paclitaxel ± Reolysin™ [Oncolytics Biotech, Calgary, Canada] virus) as well as four additional normal donors procured at OSU. On a separate NanoString chip, three lanes were utilized to measure miRNAs from two RNA samples derived from patient plasma. Lane 1 consisted of a RNA sample derived from patient plasma that was a duplicate from a sample run on a previous chip. In lanes 2–3, the same RNA sample derived from patient plasma in the second melanoma cohort was run in duplicate on the same chip. When the interchip and intrachip values for the miRNAs are tabulated, the multivariate regression analysis shows that, as one would expect, identical samples either on the same chip or a different chip have a high correlation (r2=0.941 intrachip and r2=0.980 interchip). Therefore, the raw data obtained from samples run on separate chips appear to be consistent. The rank-based analysis is distinct from the biostatistical analysis in that it does not rely on additional normalization techniques and therefore can directly compare NanoString array results that were measured on separate chips. The analysis of the miRNA array data was performed via biostatistical and the rank-based bioinformatics approach.
Biostatistical analysis of the miRNA arrays
For the first melanoma chip (chip 1), technical normalized data were first log 2 transformed and then filtered based on the criteria that 11/12 values for that particular miRNA on a chip had values lower than the noise cutoff (mean negative values + 2 standard deviation). Those miRNAs meeting these criteria were filtered out and not used for further analysis. After filtering, 227 miRNAs were left for analysis. The filtered data were then quantile normalized, and linear regressions were used to compare the miRNA expression between tumor and normal. A P-value of 1/227=0.0043 was used as cutoff to claim for significance controlling for one false positive among the 227 tested miRNAs. In all, 51 miRNAs were claimed as differentially expressed in the plasma of melanoma patients compared to normal and were displayed in a heat map using the MeV program with hierarchical clustering (Figure 3; Table S2).24 For chips 2 and 3, the log 2 transformed data were filtered based on the criteria that 10/12 values for that particular miRNA on a chip have values lower than the noise cutoff (as all the samples on chips 2 and 3 had relatively higher values than the values on chip 1). When this was done, 736 and 573 miRNAs were utilized for the analysis on chips 2 and 3, respectively. For chip 2, only one miRNA (miR-494) was differently expressed between melanoma patients and normal donors using a significance value of 1/736 (0.00136). For chip 3, two miRNAs (miR1245b-3p, miR-1268a) were differentially expressed in pancreatic cancer patients versus normal donors using a significance value of 1/573 (0.00175). To provide a sense of the miRNAs differentially regulated that were close to statistical significance, heat maps were generated for chips 2 (melanoma second cohort) and 3 (pancreatic cancer cohort) with all miRNAs with P<0.05 (Figure 3). It is clear that the patient stratification is more distinct between melanoma patients and normal donors in the tightly defined group of melanoma patients (chip 1).
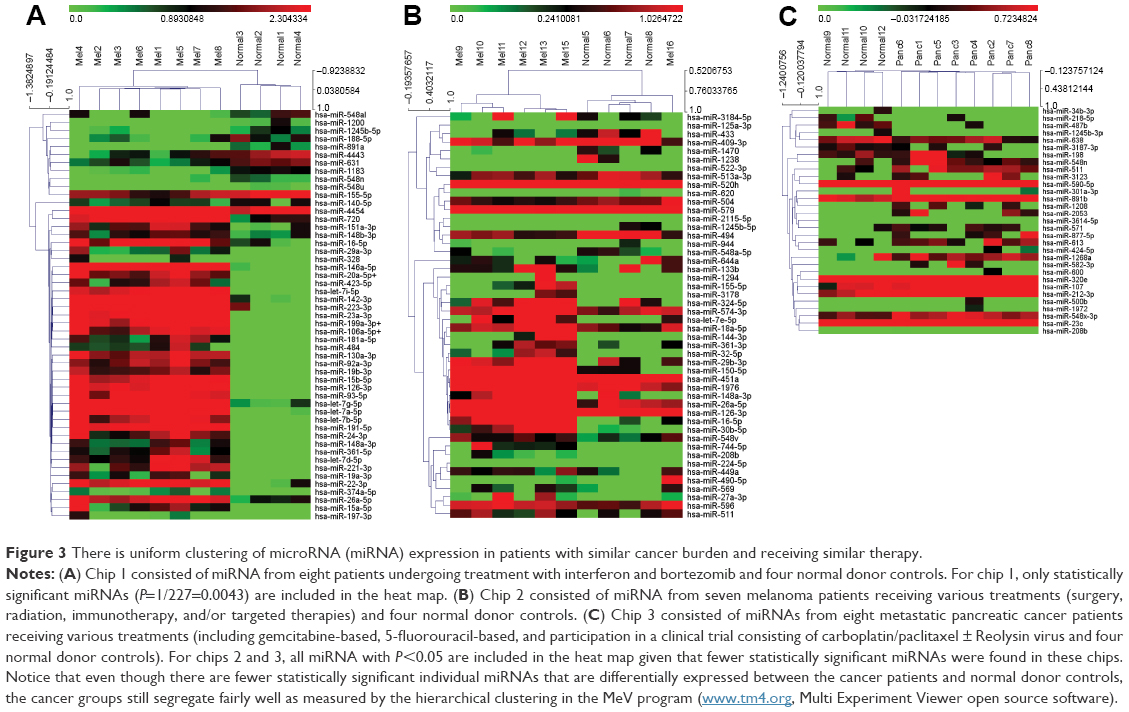 | Figure 3 There is uniform clustering of microRNA (miRNA) expression in patients with similar cancer burden and receiving similar therapy. |
Rank-based miRNA analytic method
Overall, 32 miRNAs were found to be upregulated and 15 miRNAs were found to be downregulated on the first chip with a FPR (upregulated) =5.2*10−6 at a cutoff of 10% and a FPR (downregulated) =3.3*10−3 at a cutoff of 5% (Table S3). The FPR for the upregulated miRNAs for the first chip is 0.000052 meaning that there is <1 miRNA out of 800 that we would expect by chance to be upregulated. The estimated sensitivity of this assay is therefore >99.99%. The FPR for both upregulated and downregulated miRNAs increases with decreasing number of patient plasma samples and with decreasing uniformity of the cancer patient population (Tables S4 and S5). In the second melanoma chip, only seven samples were evaluable on the chip and the patients were only selected for metastatic disease without regard for treatment regimens. In this case, the first upregulated miRNA was found with a cutoff of 30% (miR 16-5p, FPR =4.2*10−2), whereas a cutoff of 50% of the miRNA rank list needed to be employed to yield the maximum number of miRNAs (let-7e-5p and miR 27a-3p, FPR =0.49). A 5% cutoff for the rank-based list was utilized to ascertain downregulated miRNAs (miR 409-3p, FPR =3.5*10−3). For the third chip consisting of pancreatic cancer patients chosen only for having metastatic disease, eight patient samples were evaluable. The cutoff used for the upregulated miRNAs was 80% (miR 3127-5p, FPR =0.21). To determine the downregulated miRNAs, a cutoff of 45% was employed (miR-1245b-3p, FPR =0.27).
This rank-based analytic system allows for direct comparisons between different runs of the system against one another by comparing the FPR of each experiment. The rank-based analysis suggests that chip 1 had the most uniform patient population for two reasons. First, more stringent criteria were utilized for selecting miRNAs from the rank-based list. Second, the FPR had the smallest value for the first chip. The rank-based informatics analysis has high sensitivity and specificity with tightly defined cohorts of patients, but the criteria for selecting upregulated and downregulated miRNAs need to be relaxed for hypothesis generation in more loosely defined cohorts.
Principal component analysis
As mentioned in the “Methods” section, principal component analysis is a mathematical technique that transforms the experimentally observed data into fewer new variables to determine similarities and differences between groups. In all of the datasets, the first four principal components (variables that describe the overall nature of the sample) can describe ≥98.5% of the variation in the data. The higher order principal components (five to ten) represent <1.2% of the variation in the data. This makes it possible to simplify the datasets using four principal components for each chip (Table S6). The principal component analysis was utilized to generate hypotheses whether patterns of miRNA expression were different in the cancer patients versus the normal donors. The analyses of three miRNA chips revealed that a more homogenous patient population had more closely related principal components (chip 1) that describe the general trends in the upregulated miRNAs. When the samples are collected from a less homogenous group of patients, the distinguishing features of the disease group begin to disappear and the first principle component increased in value as seen in chips 2 and 3 (metastatic melanoma and pancreatic cancer patients receiving various therapies; Table S6).
Pathway map analysis
The miRNAs found from both the bioinformatics (47) and biostatistical (51) analyses from chip 1 were added to separate searches in IPA to assess the potential relationships between miRNAs and proteins. Pathway maps were generated from the miRNAs obtained from the bioinformatics and biostatistical approaches, respectively. These two pathways were then merged (Figure 4). Both of these maps have p53 as a major hub, which is consistent with the biology of melanoma having a dependence on wild-type p53.25 This analysis reveals 12 nodes are present only in the bioinformatics analysis, 43 only in the biostatistical analysis, and 30 in combination analysis. Of note, it was observed that the nodes that are in the combination list appear to be located in the cytosol, whereas the nodes restricted to the biostatistical analysis appear to be located in the nucleus.
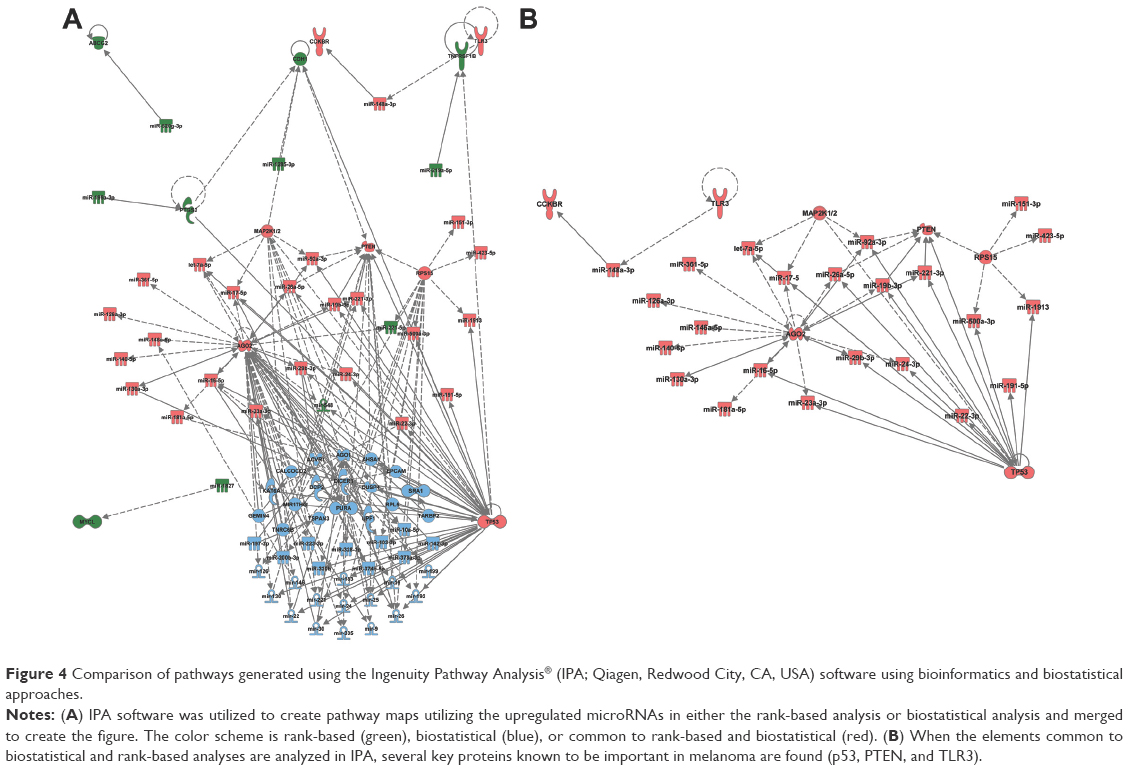 | Figure 4 Comparison of pathways generated using the Ingenuity Pathway Analysis® (IPA; Qiagen, Redwood City, CA, USA) software using bioinformatics and biostatistical approaches. |
Discussion
A clinical workflow for obtaining and analyzing miRNAs from plasma for clinical trials includes blood collection with minimal hemolysis from tightly defined cohorts of patients, miRNA purification using an established technique and measured by NanoString miRNA arrays, and, finally, rank-based and standard biostatistical approaches for analyzing the data in combination with pathway analysis to identify relationships between miRNA and target proteins. In this discussion, we focus on those topics relevant for the utilization of these techniques in clinical trials.
Challenges exist in measuring miRNA from peripheral blood, including collection of blood, processing, and appropriate analysis of data from numerous platforms (array-based, quantitative polymerase chain reaction-based, etc).10 Lysis of RBCs will cause spurious miRNAs to appear in profiles obtained in the miRNA array platforms.26 miRNA-16, miRNA-21, and miRNA-451 (among other miRNAs) are known to also originate from lysis of RBCs.26,27 Caution must be used when analyzing samples when the lysis of the samples has not been analyzed. The normal donors were collected last by the educated staff, and none of those samples had visible hemolysis after centrifugation to collect the plasma.
It would be useful to have the same phlebotomy tube type where plasma can be processed for both miRNA and peripheral blood mononuclear cells (PBMCs). PBMCs collected in heparin-coated phlebotomy tubes are more stable than PBMCs collected in ACD tubes, which are in turn more stable than PBMCs collected in EDTA tubes.28 However, miRNA detection may be inhibited by heparin.13,15 The same is true for plasma collected from ACD tubes as ACD also inhibits the measurement of miRNAs.10 Moving forward, it would be more useful to collect miRNA from EDTA tubes, but plasma samples may be utilized from previously collected biobank samples from heparin or ACD tubes.
Several miRNA purification techniques from plasma and serum have recently been reported. For example, purification of miRNAs encapsulated in microvesicles found in human plasma has been optimized.29 miR-16 levels were higher in whole serum versus exosome preparations but the miRNA levels were not different between melanoma patients and normal healthy donors. However, a previous study utilized diethylpyrocarbonate (DEPC)-treated water, which interferes with array-based assays.30 Other groups utilize Qiagen kits without further purification for both quantitative polymerase chain reaction detection and array-based detection from plasma or serum samples.31,32 In this study, the Qiagen kit was used with further purification using a molecular weight cutoff centrifuge filter and array-based detection.20 Different miRNAs will be isolated depending on the collection tubes utilized, biological fluid collected (plasma vs serum), method of isolation (array-based vs quantitative polymerase chain reaction), and the underlying biology. In human studies, it is proposed that plasma is the bodily fluid of choice as it eliminates coagulation cascade factors and the isolation technique can be performed uniformly in clinical practice.
It is not surprising that various investigators concluded that different miRNAs are important for measuring the presence of melanoma and the extent of disease. For example, miR-21 plasma concentration is associated with tumor burden.33 In contrast, miR-221 is elevated with advanced disease, but some patients do have low levels as in the case for miR-205.31,34 A panel of miRNAs (9, 145, 150, 155, 203, and 205) was found in one study to detect metastatic melanoma.35 One group is developing serum miRNAs as markers of melanoma recurrence by combining specific miRNAs with pathological characteristics, such as the thickness of the tumor.36,37 This study, as well as recently published efforts, suggests that miRNA panels should be combined with the clinical characteristics of melanoma patients using consistent RNA purification methods.
The rank-based analytical tool utilized in this paper complements classical statistical approaches. The rank-based analysis is less reliant on comparing exact miRNA expression values, but instead focuses on the general order of the ranking thereby giving less importance to the absolute value of the plasma miRNA concentration. The rank-based method is an internal control for differential miRNA loading onto the chip. Spike-in controls, although useful, can introduce another source of experimental uncertainty.22 The miRNA rank list essentially establishes a network context that allows for hypothesis generation and testing similar to that described previously.38 The limitation of the rank-based method to small sample sizes would be useful in early phase oncology studies. The rank-based method creates a workflow that allows for the collection of miRNA data and knowledge-anchored hypothesis generation for future studies.39 The detailed topology of the networks is an avenue for future research. The rank-based method did find upregulated miRNAs as recently described in a review of miRNA in melanoma development. Tumor promoting inflammatory miRNAs, such as miR-29, in addition to angiogenesis-inducing miRNAs, such as miR-199a-3p, were elevated in the patient plasma samples.40
In this study, one example of a miRNA that was found to upregulated in the plasma of melanoma patients undergoing interferon therapy was miR-221. It has been described that this miRNA is increased in the serum of melanoma patients and elevation of this miRNA is a predictor of poor 5-year survival.31,41 Mechanistically, miR-221 appears to inhibit p27. Melanoma cells treated with interferon β led to the downregulation of miR-221 and subsequent upregulation of p27.42,43 Another example of an upregulated miRNA is miR-146. In this case, this miRNA appears to promote tumor growth through notch signaling, but may limit the metastatic potential of melanoma especially in the brain.44–48 The complete list of miRNAs with more than four references currently cited in PubMed is listed in Table S7.
To compare biostatistical and rank-based approaches, we focused on chip 1 (a tightly defined cohort of melanoma patients). In all, 37 of 47 miRNAs found in the rank-based analysis were also found to be significant in the biostatistical analysis. Of the ten miRNAs dysregulated in the rank-based analysis and not found in the biostatistical approach, all had a trend toward statistical significance (P<0.05). Of the miRNAs found in the biostatistical approach, 3/10 most highly significant miRNAs (miR-1183, 1200, and 1245-5p) were not found in the rank-based approach as the miRNAs also had high values in normal donor controls. The biostatistical approach can identify miRNAs that are upregulated in cancer patients that are also part of normal biological processes in normal donors but it can also detect biological noise or determine that miRNAs may be important in only one type of cancer. For example, miR-494 was downregulated in the second NanoString chip and elevated levels are associated with the recruitment of myeloid-derived suppressor cells in cancers.49 It is likely that this miRNA is important for other immunological processes, such as subclinical autoimmune diseases that demonstrate increases in the concentration of this miRNA.50 Of note, for the second melanoma chip, if the cutoff used for the rank-based analysis is relaxed by 5%, miR-494 appears in both lists. This exploratory analysis demonstrates two caveats. First, miRNAs found to be up- or downregulated should be analyzed in the context of the patient cohort in which they are found. miRNAs found in patients with the same cancer should not be compared if they were treated differently. Even though a miRNA is statistically significant does not mean that it is relevant. Second, miRNAs with borderline significance can be added to the lists based on the rank-based method, but this should be done only in a hypothesis-generating experiment to be tested on well-defined patient populations.
Conclusion
The clinical implication of this paper is that to analyze miRNA profiles effectively in cancer patients, the patient population needs to be well defined (stage and treatment). A clinical workflow was developed to measure miRNAs in patient samples from clinical trials. Phlebotomy techniques were optimized to minimize lysis that can introduce noise “miRNAs” into the analysis. miRNA purification techniques developed by members of our group were utilized that assist in limiting the noise from potential contamination of the samples. The rank-based and biostatistical methods provide complementary modes of analyses for use in clinical trial samples. Both techniques demonstrate that the analysis of miRNA works best with a specific cohort of uniformly treated patients.
Acknowledgments
We would like to acknowledge National Institute of Health grant T32CA090223 (WE Carson, III) and the Pelotonia Postdoctoral Fellowship (J Markowitz). Taylor Brooks was supported by the Pelotonia undergraduate fellowship program. Any opinions, findings, and conclusions expressed in this material are those of the author(s) and do not necessarily reflect those of the Pelotonia Fellowship Program. We would also like to acknowledge the National Cancer Institute grant P01CA095426 (WE Carson, III) and P30 CA016058 (M Caligiuri). J Markowitz receives support from the Donald A Adam Comprehensive Melanoma Research Center at Moffitt Cancer Center and is an Assistant Professor in the USF Morsani School of Medicine Department of Oncologic Sciences. We would also like to acknowledge Doctor Kevin Coombes for his contribution to the bioinformatics workflow and Mr Andrew Fitzgerald who helped to solidify the code for the rank-based approach. We would like to thank Isaac P Foote at the Moffitt Cancer Center for his editorial assistance in preparing this manuscript.
Author contributions
JM, ZA, XZ, LW, KER, PP, JNH, and WEC, III drafted the manuscript. NKJ and JM performed the miRNA purification. JM, TRB, and KML processed the blood samples to collect the plasma in the prospectively collected samples. ZA led the development of the rank-based analysis with assistance from PP and JM as it would be applied to clinical samples. XZ and LW performed the biostatistical analysis. KR provided useful insights into the results of the rank-based analysis. SRU analyzed differences in the pathways generated by the ranked-based and biostatistical analysis. JM, WEC, III, TO, KLK, GBL, TBS, and WEC, III participated in the drafting of the institutional review board protocols and provided clinical support in obtaining clinical samples that would be suitable for this study. In addition, JHH and NL provided clinical support from surgical oncology in obtaining clinical samples that would be suitable for this study. All authors contributed toward data analysis, drafting and critically revising the paper, gave final approval of the version to be published, and agree to be accountable for all aspects of the work.
Disclosure
The authors report no conflicts of interest in this work.
References
Siegel RL, Miller KD, Jemal A. Cancer statistics, 2016. CA Cancer J Clin. 2016;66(1):7–30. | ||
Coit DG, Thompson JA, Algazi A, et al. Melanoma, version 2. 2016, NCCN clinical practice guidelines in oncology. J Natl Compr Canc Netw. 2016;14(4):450–473. | ||
Cortez MA, Bueso-Ramos C, Ferdin J, Lopez-Berestein G, Sood AK, Calin GA. MicroRNAs in body fluids – the mix of hormones and biomarkers. Nat Rev Clin Oncol. 2011;8(8):467–477. | ||
Grignol V, Fairchild ET, Zimmerer JM, et al. miR-21 and miR-155 are associated with mitotic activity and lesion depth of borderline melanocytic lesions. Br J Cancer. 2011;105(7):1023–1029. | ||
Segura MF, Belitskaya-Levy I, Rose AE, et al. Melanoma microRNA signature predicts post-recurrence survival. Clin Cancer Res. 2010;16(5):1577–1586. | ||
Schultz J, Lorenz P, Gross G, Ibrahim S, Kunz M. MicroRNA let-7b targets important cell cycle molecules in malignant melanoma cells and interferes with anchorage-independent growth. Cell Res. 2008;18(5):549–557. | ||
Bell RE, Khaled M, Netanely D, et al. Transcription factor/microRNA axis blocks melanoma invasion program by miR-211 targeting NUAK1. J Invest Dermatol. 2014;134(2):441–451. | ||
Felicetti F, Errico MC, Bottero L, et al. The promyelocytic leukemia zinc finger-microRNA-221/-222 pathway controls melanoma progression through multiple oncogenic mechanisms. Cancer Res. 2008;68(8):2745–2754. | ||
van Rooij E. The art of microRNA research. Circ Res. 2011;108(2):219–234. | ||
Moldovan L, Batte KE, Trgovcich J, Wisler J, Marsh CB, Piper M. Methodological challenges in utilizing miRNAs as circulating biomarkers. J Cell Mol Med. 2014;18(3):371–390. | ||
Wang K, Yuan Y, Cho JH, McClarty S, Baxter D, Galas DJ. Comparing the microRNA spectrum between serum and plasma. PLoS One. 2012;7(7):e41561. | ||
Lam NY, Rainer TH, Chiu RW, Lo YM. EDTA is a better anticoagulant than heparin or citrate for delayed blood processing for plasma DNA analysis. Clin Chem. 2004;50(1):256–257. | ||
Willems M, Moshage H, Nevens F, Fevery J, Yap SH. Plasma collected from heparinized blood is not suitable for HCV-RNA detection by conventional RT-PCR assay. J Virol Methods. 1993;42(1):127–130. | ||
Garcia ME, Blanco JL, Caballero J, Gargallo-Viola D. Anticoagulants interfere with PCR used to diagnose invasive aspergillosis. J Clin Microbiol. 2002;40(4):1567–1568. | ||
Al-Soud WA, Radstrom P. Purification and characterization of PCR-inhibitory components in blood cells. J Clin Microbiol. 2001;39(2):485–493. | ||
Dugan L, Leech L, Speroni KG, Corriher J. Factors affecting hemolysis rates in blood samples drawn from newly placed IV sites in the emergency department. J Emerg Nurs. 2005;31(4):338–345. | ||
Lippi G, Avanzini P, Aloe R, Cervellin G. Reduction of gross hemolysis in catheter-drawn blood using Greiner Holdex tube holder. Biochem Med (Zagreb). 2013;23(3):303–307. | ||
Lippi G, Avanzini P, Cervellin G. Prevention of hemolysis in blood samples collected from intravenous catheters. Clin Biochem. 2013;46(7–8):561–564. | ||
Lippi G, Cervellin G, Mattiuzzi C. Critical review and meta-analysis of spurious hemolysis in blood samples collected from intravenous catheters. Biochem Med (Zagreb). 2013;23(2):193–200. | ||
Jacob NK, Cooley JV, Yee TN, et al. Identification of sensitive serum microRNA biomarkers for radiation biodosimetry. PLoS One. 2013;8(2):e57603. | ||
Gordon A, Glazko G, Qiu X, Andrei Y. Control of the mean number of false discoveries, Bonferroni and stability of multiple testing. Ann Appl Stat. 2007;1(1):179–190. | ||
Robinson MD, Oshlack A. A scaling normalization method for differential expression analysis of RNA-seq data. Genome Biol. 2010;11(3):R25. | ||
Markowitz J, Luedke EA, Grignol VP, et al. A phase I trial of bortezomib and interferon-alpha-2b in metastatic melanoma. J Immunother. 2014;37(1):55–62. | ||
Eisen MB, Spellman PT, Brown PO, Botstein D. Cluster analysis and display of genome-wide expression patterns. Proc Natl Acad Sci U S A. 1998;95(25):14863–14868. | ||
Lin J, Yang Q, Yan Z, et al. Inhibiting S100B restores p53 levels in primary malignant melanoma cancer cells. J Biol Chem. 2004;279(32):34071–34077. | ||
Kirschner MB, Edelman JJ, Kao SC, Vallely MP, van Zandwijk N, Reid G. The impact of hemolysis on cell-free microRNA biomarkers. Front Genet. 2013;4:94. | ||
Kirschner MB, Kao SC, Edelman JJ, et al. Haemolysis during sample preparation alters microRNA content of plasma. PLoS One. 2011;6(9):e24145. | ||
Carter PH, Resto-Ruiz S, Washington GC, et al. Flow cytometric analysis of whole blood lysis, three anticoagulants, and five cell preparations. Cytometry. 1992;13(1):68–74. | ||
Quackenbush JF, Cassidy PB, Pfeffer LM, et al. Isolation of circulating microRNAs from microvesicles found in human plasma. Methods Mol Biol. 2014;1102:641–653. | ||
Alegre E, Sanmamed MF, Rodriguez C, Carranza O, Martin-Algarra S, Gonzalez A. Study of circulating microRNA-125b levels in serum exosomes in advanced melanoma. Arch Pathol Lab Med. 2014;138(6):828–832. | ||
Kanemaru H, Fukushima S, Yamashita J, et al. The circulating microRNA-221 level in patients with malignant melanoma as a new tumor marker. J Dermatol Sci. 2011;61(3):187–193. | ||
Achberger S, Aldrich W, Tubbs R, Crabb JW, Singh AD, Triozzi PL. Circulating immune cell and microRNA in patients with uveal melanoma developing metastatic disease. Mol Immunol. 2014;58(2):182–186. | ||
Saldanha G, Potter L, Shendge P, et al. Plasma microRNA-21 is associated with tumor burden in cutaneous melanoma. J Invest Dermatol. 2013;133(5):1381–1384. | ||
Noguchi S, Iwasaki J, Kumazaki M, et al. Chemically modified synthetic microRNA-205 inhibits the growth of melanoma cells in vitro and in vivo. Mol Ther. 2013;21(6):1204–1211. | ||
Shiiyama R, Fukushima S, Jinnin M, et al. Sensitive detection of melanoma metastasis using circulating microRNA expression profiles. Melanoma Res. 2013;23(5):366–372. | ||
Fleming NH, Zhong J, da Silva IP, et al. Serum-based miRNAs in the prediction and detection of recurrence in melanoma patients. Cancer. 2015;121(1):51–59. | ||
Friedman EB, Shang S, de Miera EV, et al. Serum microRNAs as biomarkers for recurrence in melanoma. J Transl Med. 2012;10:155. | ||
Barabasi AL, Gulbahce N, Loscalzo J. Network medicine: a network-based approach to human disease. Nat Rev Genet. 2011;12(1):56–68. | ||
Payne PR, Embi PJ. Driving clinical and translational research using biomedical informatics. In: Payne PR, Embi PJ, editors. Translational Informatics: Realizing the Promise of Knowledge-Driven Healthcare. London: Springer-Verlag; 2015:99–117. | ||
Bennett PE, Bemis L, Norris DA, Shellman YG. miR in melanoma development: miRNAs and acquired hallmarks of cancer in melanoma. Physiol Genomics. 2013;45(22):1049–1059. | ||
Li P, He QY, Luo CQ, Qian LY. Circulating miR-221 expression level and prognosis of cutaneous malignant melanoma. Med Sci Monit. 2014;20:2472–2477. | ||
Igoucheva O, Alexeev V. MicroRNA-dependent regulation of cKit in cutaneous melanoma. Biochem Biophys Res Commun. 2009;379(3):790–794. | ||
Das SK, Sokhi UK, Bhutia SK, et al. Human polynucleotide phosphorylase selectively and preferentially degrades microRNA-221 in human melanoma cells. Proc Natl Acad Sci U S A. 2010;107(26):11948–11953. | ||
Yamashita J, Iwakiri T, Fukushima S, et al. The rs2910164 G>C polymorphism in microRNA-146a is associated with the incidence of malignant melanoma. Melanoma Res. 2013;23(1):13–20. | ||
Raimo M, Orso F, Grassi E, et al. miR-146a exerts differential effects on melanoma growth and metastatization. Mol Cancer Res. 2016;14(6):548–562. | ||
Forloni M, Dogra SK, Dong Y, et al. miR-146a promotes the initiation and progression of melanoma by activating Notch signaling. Elife. 2014;3:e01460. | ||
Barbai T, Fejos Z, Puskas LG, Timar J, Raso E. The importance of microenvironment: the role of CCL8 in metastasis formation of melanoma. Oncotarget. 2015;6(30):29111–29128. | ||
Hwang SJ, Seol HJ, Park YM, et al. MicroRNA-146a suppresses metastatic activity in brain metastasis. Mol Cells. 2012;34(3):329–334. | ||
Liu Y, Lai L, Chen Q, et al. MicroRNA-494 is required for the accumulation and functions of tumor-expanded myeloid-derived suppressor cells via targeting of PTEN. J Immunol. 2012;188(11):5500–5510. | ||
Kishore A, Borucka J, Petrkova J, Petrek M. Novel insights into miRNA in lung and heart inflammatory diseases. Mediators Inflamm. 2014;2014:259131. |
 © 2016 The Author(s). This work is published and licensed by Dove Medical Press Limited. The
full terms of this license are available at https://www.dovepress.com/terms
and incorporate the Creative Commons Attribution
- Non Commercial (unported, 3.0) License.
By accessing the work you hereby accept the Terms. Non-commercial uses of the work are permitted
without any further permission from Dove Medical Press Limited, provided the work is properly
attributed. For permission for commercial use of this work, please see paragraphs 4.2 and 5 of our Terms.
© 2016 The Author(s). This work is published and licensed by Dove Medical Press Limited. The
full terms of this license are available at https://www.dovepress.com/terms
and incorporate the Creative Commons Attribution
- Non Commercial (unported, 3.0) License.
By accessing the work you hereby accept the Terms. Non-commercial uses of the work are permitted
without any further permission from Dove Medical Press Limited, provided the work is properly
attributed. For permission for commercial use of this work, please see paragraphs 4.2 and 5 of our Terms.