Back to Journals » Neuropsychiatric Disease and Treatment » Volume 13
MicroRNA expression profiles in chronic epilepsy rats and neuroprotection from seizures by targeting miR-344a
Authors Liu XX, Liao YH, Wang XX, Zou DH ![]() , Luo C, Jian CD, Wu Y
, Luo C, Jian CD, Wu Y
Received 4 May 2017
Accepted for publication 20 June 2017
Published 31 July 2017 Volume 2017:13 Pages 2037—2044
DOI https://doi.org/10.2147/NDT.S141062
Checked for plagiarism Yes
Review by Single anonymous peer review
Peer reviewer comments 2
Editor who approved publication: Professor Wai Kwong Tang
Xixia Liu,1,2 Yuhan Liao,1 Xiuxiu Wang,1 Donghua Zou,1 Chun Luo,1 Chongdong Jian,1 Yuan Wu1
1Department of Neurology, First Affiliated Hospital of Guangxi Medical University, 2Department of Rehabilitation, People’s Hospital of Guangxi Zhuang Autonomous Region, Nanning, China
Abstract: MicroRNA (miRNA) is believed to play a crucial role in the cause and treatment of epilepsy by controlling gene expression. However, it is still unclear how miRNA profiles change after multiple prolonged seizures and aggravation of brain injury in chronic epilepsy (CE). To investigate the role of miRNA in epilepsy, we utilized the CE rat models with pentylenetetrazol (PTZ) and miRNA profiles in the hippocampus. miRNA profiles were characterized using miRNA microarray analysis and were compared with the rats in the sham group, which received 0.9% physiological saline treatment at the same dose. Four up-regulated miRNAs (miR-139–3p, -770–5p, -127–5p, -331–3p) and 5 down-regulated miRNAs (miR-802–5p, -380–5p, -183–5p, -547–5p, -344a/-344a–5p) were found in the CE rats (fold change >1.5, P<0.05). Three of the dysregulated miRNAs were validated by quantitative real-time polymerase chain reaction, which revealed an outcome consistent with the initial results of the miRNA microarray analyses. Then, miR-344a agomir was intracerebroventricularly injected and followed by PTZ induction of CE models to investigate the effect of miR-344a in chronic neocortical epileptogenesis. After miRNA-344a agomir and scramble treatment, results showed a restoration of seizure behavior and a reduction in neuron damage in the cortex in miRNA-334a agomir treated rats. These data suggest that miRNA-344a might have a small modulatory effect on seizure-induced apoptosis signaling pathways in the cortex.
Keywords: microRNA, chronic epilepsy, miR-344a, epigenetics, apoptosis
Introduction
Epilepsy is a common, serious neurological condition causing recurrent unprovoked seizures that affects ~65 million people globally.1 Seizures in chronic epilepsy (CE) are intractable with medication in about 30% of cases,2 especially in patients with temporal lobe epilepsy (TLE). Multiple physiopathological changes caused by recurrent seizures have been observed, such as neuronal loss, mossy fiber sprouting, neurogenesis and dendritic injury.3,4 The brain damage induced by seizures in CE with poor seizure control can lead to certain disorders, including depression, anxiety, cognitive dysfunction or disability by different mechanisms or systems.5 However, the etiology and molecular changes contributing to the development of intractable epilepsy remain unknown.
Studies have shown that microRNAs (miRNAs) appear to regulate the development and function of the nervous system6 and aberrant miRNA expression has been implicated in the molecular mechanism of numerous brain diseases, such as schizophrenia,7 bipolar disorder, anxiety disorders8 and epilepsy.9–11 miRNA function is critical in the epileptogenesis of CE by controlling dendritic morphology as well as ion channel levels, neuronal migration and glial function.12 Altered miRNA expressions associated with key biological processes have been identified in several large-scale genomic studies13–15 in both human and experimental status epilepsy (SE). Furthermore, specific up- or down-regulated miRNAs in both experimental and human epilepsy have been shown in several studies. MiR-34a expression was found to be unregulated after SE by the p53-dependent pro-apoptotic pathway in TLE according to another study, suggesting miR-34a might be a potential target for TLE therapy.16 While miRNA has been shown to change a lot in preclinical moderate TLE, there is a paucity of preclinical data regarding miRNA in the regulation of CE. Agomir and antagomir of miRNA have been widely used in vivo to explore the role of miRNAs. MiRNA agomir is a chemically-modified antisense strand that can mimic mature endogenous miRNAs after transfer into cells in vivo. Here we profiled miRNA expression in the hippocampus of the PTZ-kindled CE rats and characterized the mechanism, biogenesis and function of miRNA in the CE rat models in order to implicate miRNA in the development of intractable seizures and pathogenesis of seizure-damage. We then demonstrated the neuroprotective effects of miR-344a on seizures by an agomir intracerebroventricular (ICV) injection treatment targeting miR-344a in vivo in the hopes of finding novel functional genomic data in CE.
Methods
miRNA microarray analysis for CE rats induced by PTZ
Experimental animals
The animals we used in this study were healthy male Sprague-Dawley (SD) rats, 6–7 weeks old and weighing 220–250 g, from the Animal Experiment Center of Guangxi Medical University, China. The animals were raised in groups and given free access to food and water under certain conditions (24°C±2°C, 50%–60% humidity and 12 h light/dark cycle). Animal care and handling was carried out in strict accordance with the guidelines of the National Institutes of Health and approved by the Laboratory Animals Committee of Guangxi Medical University. All experimental animals were housed in the same room during the study.
Thirty animals were chosen to do the miRNA microarray analysis study. All rats were divided into sham group (n=6) and CE group (n=24) using a random number table.
Kindling induction of CE
The rats in the CE group (n=24) were intraperitoneally injected with PTZ (Sigma-Aldrich, St Louis, MO, USA) at a dose of 60 mg/kg on the first day, and then received 14 repeated injections of PTZ (35 mg/kg) on alternating days (8–10 am) as part of the CE model. Rats in the sham group (n=6) were given a total of 15 intraperitoneal (IP) injections of 0.9% physiological saline (10 mL/kg) every other day. PTZ was freshly dissolved in physiological saline before administering injections. The rats were weighed before each injection to adjust the dosage and monitored for 30 min after each PTZ treatment.
Seizures were rated according to the Racine standard grading as follows:17 grade 0, no reaction in behavior; grade 1, chewing and face twitching; grade 2, neck spasms and head nodding; grade 3, unilateral forelimb clonus and twitching; grade 4, rearing with bilateral forelimb clonus; grade 5, systemic seizure, widespread muscle spasming and falling back. Successful models of kindling were defined as ≥4 consecutive stage 2 seizures, or ≥2 seizures that were stage 4 or higher.
Tissue collection and miRNA microarray analysis
Rats from both groups (n=6/group) were anesthetized with 10% chloral hydrate (3.5 mL/kg, IP) and sacrificed 24 hours after the last kindling. Hippocampal tissues were rapidly dissected out and removed to cryogenic vials with RNAlater (RNA stabilization solution, Sigma-Aldrich) and fast frozen. Additionally, 2–3 mL of blood was collected through cardiocentesis into EDTA cryogenic vials for further testing. Total RNA was extracted using TRIzol reagent (Thermo Fisher Scientific, Waltham, MA, USA) and an miRNeasy kit (Qiagen, Germantown, MD, USA), following the instructions. The quality and quantity of RNA was measured by NanoDrop spectrophotometer (ND-100; NanoDrop Technologies Inc., Wilmington, DE, USA), and integrity of the RNA was determined by gel electrophoresis. Afterwards, samples were labeled using the miRCURY™ Hy3™/Hy5™ Power labeling kit and RNA was hybridized on an miRCURY LNA Array (v.18.0; Exiqon, Vedbaek, Denmark). Then, the slides were scanned using an Axon GenePix 4000B microarray scanner (Axon Instruments, Foster City, CA, USA) after washing steps with a wash buffer kit (Exiqon).
miRNA target gene prediction and functional analysis
Grid alignment and data extraction from scanned images were analyzed by GenePix Pro 6.0 software (Axon Instruments). Expressed data were normalized by miRNAs at intensities ≥30 in all samples using the median normalization. Up- or down-regulated miRNAs were characterized as significant by a fold change ≥1.5 and a P-value <0.05. Finally, we used a hierarchical clustering to identify the distinguishable miRNA expression profiling among the samples by MEV software (v4.6; TIGR). Potential target genes of the differentially expressed miRNAs were predicted and integrated from miRBase, miRanda and miRDB databases. Kyoto Encyclopedia Genes and Genomes (KEGG) pathways over-represented among these target genes were provided to obtain useful information regarding the functions of the targets.
qRT-PCR validation
Three miRNAs (miR-331–3p, −547–5p, −344a) were analyzed using quantitative real-time polymerase chain reaction (qRT-PCR) to validate the initial results of miRNA microarray analysis from the hippocampus and to determine whether miR-344a from peripheral blood samples could be a potential biomarker. Total RNAs were isolated using TRIzol reagent (Thermo Fisher Scientific) and amplified by qRT-PCR (16°C for 30 min, 42°C for 40 min, and 85°C for 5 min) using a Gene Amp PCR System 9700 (Applied Biosystems Inc., Foster City, CA, USA). The RT-PCR reactions were performed using a ViiA 7 RT-PCR system (Applied Biosystems) for 40 PCR cycles (95°C for 10 s, then 60°C for 60s) at 95°C for 10 min. The RT-PCR reactions were performed for target miRNAs and for the internal reference (U6), with each sample analyzed in triplicate. The miRNA expression was analyzed using the comparative cycle threshold (2−ΔΔCT) method. The use of the primers is shown in Table 1.
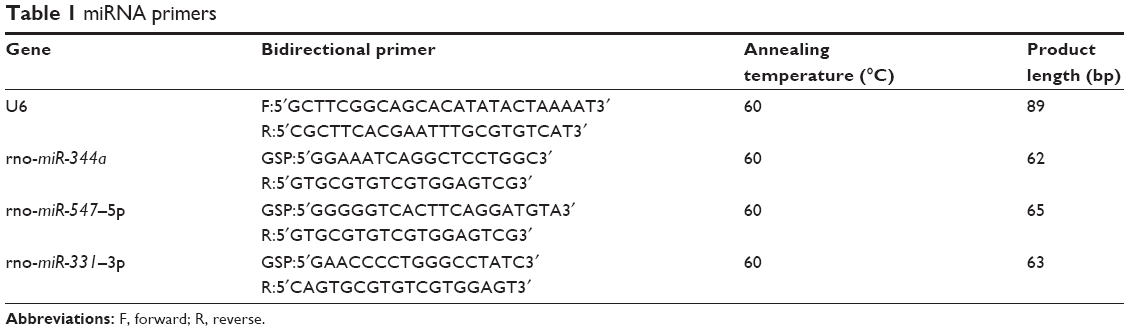 | Table 1 miRNA primers |
Exploration of the effect of miR-344a agomir on seizures kindled by PTZ
Animal procedures
Another 38 male SD rats (weighed 220–250 g) were obtained from the Animal Experiment Center and divided into a normal group (n=8), an miR-344a agomir group (n=15) and an miRNA-control group (n=15) at random. The rats from the miR-344a agomir group (n=15) and scramble control group (n=15) were then given an miR-344a agomir and scramble-control ICV injection individually.
Stereotaxic injections of miRNA-344a agomir
For ICV administration of miR-344a agomir, rats were anesthetized with 10% chloral hydrate (3.5 mL/kg, IP) and affixed with a stereotaxic apparatus. The right ventricle (coordinates from anterior fontanel: AP=−0.9 mm, R=−1.3 mm, V=−3.5 mm) was positioned after skin cut according to Paxinos rat brain stereotaxic atlas. A 10 μL syringe filled with miR-344a agomir was fixed on a pump pointing into the hole previously drilled, with the syringe needle positioned on the right ventricle of the skull. The rats received a 4 μL infusion of miR-344a agomir (Guangzhou Ruibo Biological Technology Co. Ltd., Guangzhou, China) or scrambled agomir (0.2 nmol/rat) in 0.9% physiological saline. The injection speed was set at 3 min/μL and the syringe needle remained for 10 min before it was pulled out. Animals were moved to a warm recovery chamber. There was no ICV administration for rats from the normal group.
Kindling and behavior observation
Three days after the ICV injection treatment, rats in the miR-344a agomir group (n=14) and the scramble control group (n=13) received 15 repeated injections of PTZ (35 mg/kg) on alternating days (8–10 am) in accordance with the CE model. The rats were monitored for the occurrence of seizures for 1 hour after IP injection to record the seizure grades and the duration they spent conducting various behaviors such as: head nodding, twitching, rearing and spasming. Seizures were rated as grade 0–5 according to the Racine standard grading described previously. Rats in the normal group were given a total of 15 IP injections of 0.9% physiological saline (10 mL/kg) every other day.
qRT-PCR for miR-344a expression
Rats were sacrificed 30 min after the last injection and the brains harvested. Fresh cortical and hippocampal tissues were carefully separated for qRT-PCR assays to study the levels of miR-344a. Total RNA isolation, conditions of amplification and RT-PCR reactions were performed as described previously.
TdT-mediated dUTP–biotin nick end labeling (TUNEL)
DNA fragmentation and damage resulted from seizure-induced neuronal death and apoptosis in the hippocampus and cortex. Damage was identified using a fluorescence-based TUNEL technique. TUNEL was carried out according to the In Situ Cell Death POD kit (Roche Diagnostics, Mannheim, Germany) manufacturer’s guidelines. Images were captured under a 20× and 10× lens magnification using a fluorescence microscope (Zeiss, Jena, Germany) and researchers were blinded to prevent bias. Three sections were examined from each rat and an average count was obtained for statistical analysis.
Data analysis
All the data are presented as mean ± standard deviation. Two group comparisons were made using an independent sample t-test, while multi-group comparisons were made using a 1-way analysis of variance. All statistical analyses and pictures were performed using Graphpad Prism 5 (GraphPad Software Inc., San Diego, CA, USA). Significant differences were accepted at a 2-tailed P-value of 0.05.
Results
miRNA microarray analysis showed 9 dysregulated miRNAs in CE rats
Sixteen rats were injected successfully as per the CE model. Six of these rats were chosen at random for the miRNA microarray analysis and compared with rats from the sham group (n=6). miRNA arrays and differential analysis demonstrated a different expression profile between CE and sham rats, showing 9 dysregulated miRNAs (Table 2) in the CE rats that were not present in the sham rats. Among the dysregulated miRNAs, 4 miRNAs (miR-139–3p, −770–5p, −127–5p, −331–3p) were significantly up-regulated (fold change >1.5, P<0.05), and 5 miRNAs (miR-802–5p, −380–5p, −183–5p, −547–5p, −344a/−344a–5p) were significantly down-regulated (fold change >1.5, P<0.05). The hierarchical clustering/heatmap of these 9 dysregulated rat miRNAs are shown in Figure 1.
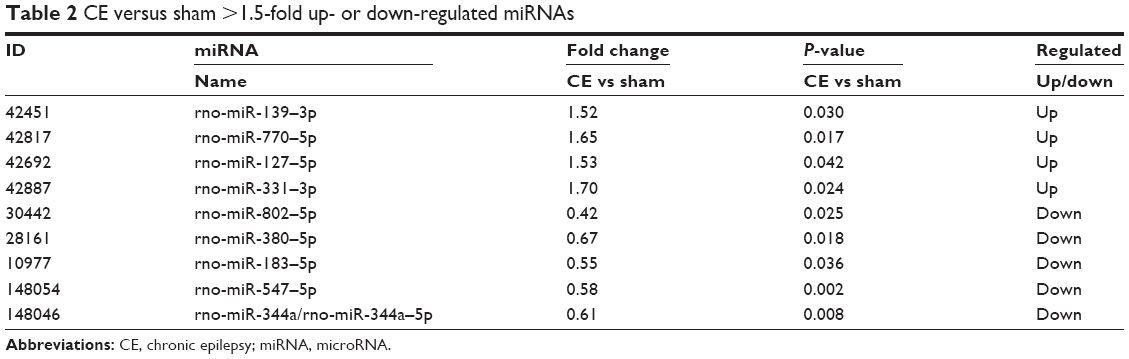 | Table 2 CE versus sham >1.5-fold up- or down-regulated miRNAs |
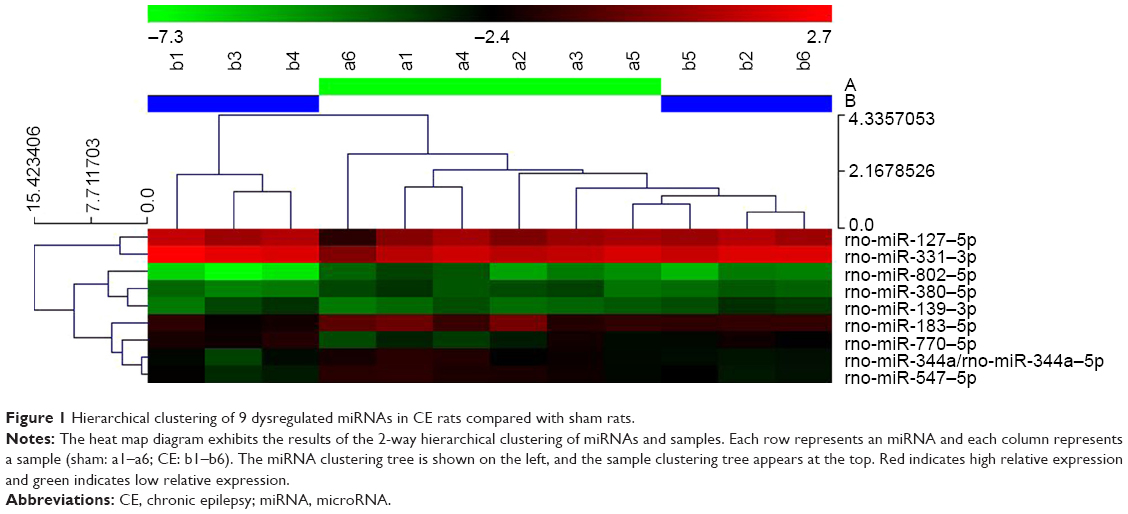 | Figure 1 Hierarchical clustering of 9 dysregulated miRNAs in CE rats compared with sham rats. |
miRNA target gene prediction and functional analysis
miRNA targets were integrated based on the data from miRanda, MicroCosm, and miRDB databases. Exactly 2,853, 4,618 and 560 predicted target genes were identified in these 3 databases, respectively, with 30 target genes integrated from all 3 databases (Figure 2A). KEGG pathways and pathway analysis were used to determine functional analysis mapping genes. The top 10 pathways associated with the 9 dysregulated miRNA targets are shown in Figure 2B.
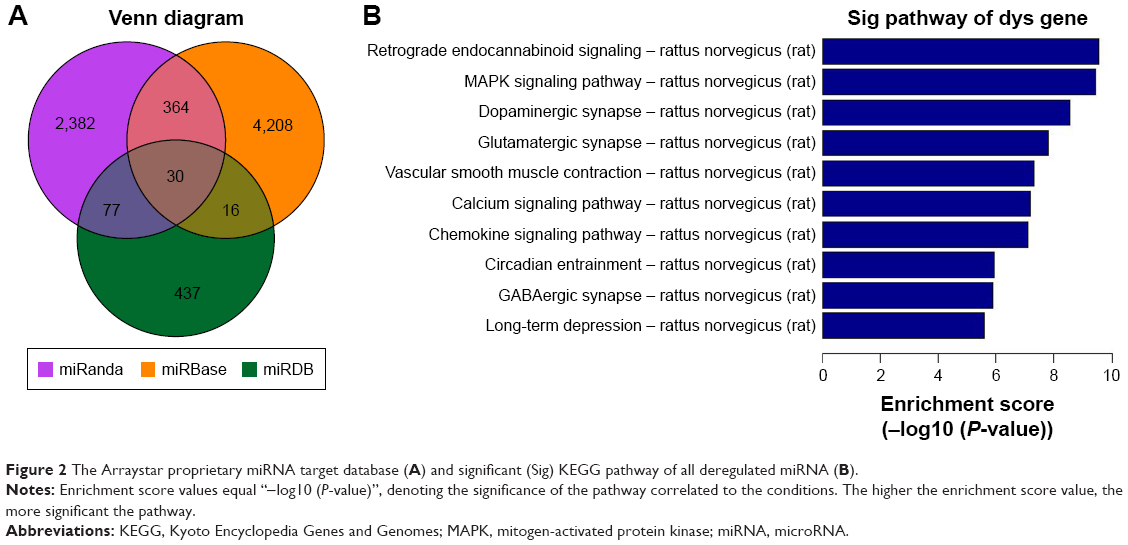 | Figure 2 The Arraystar proprietary miRNA target database (A) and significant (Sig) KEGG pathway of all deregulated miRNA (B). |
qRT-PCR confirmed the microarray results
According to the PCR results (Figure 3A–C), 3 dysregulated miRNAs (miR-331–3p, −547–5p, −344a) expressions were consistent with the microarray analysis. Furthermore, the expression level of miR-344a decreased (Figure 3D) in peripheral blood of CE rats compared with the sham group, in addition to the decrease seen in the hippocampus (P=0.0002).
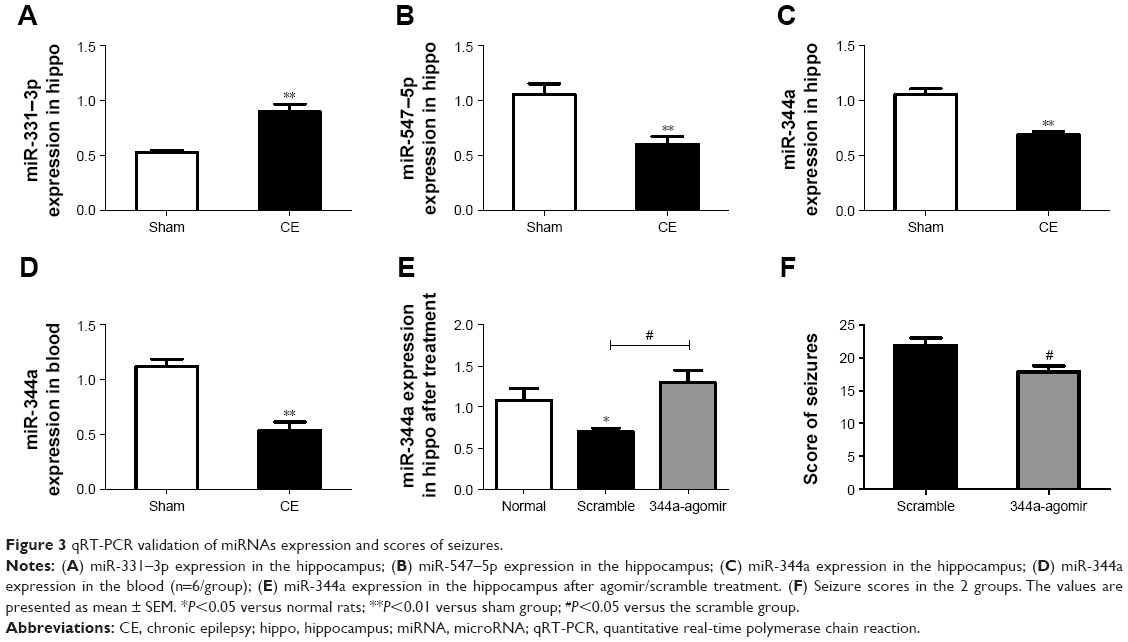 | Figure 3 qRT-PCR validation of miRNAs expression and scores of seizures. |
miR-344a expression after 344a-agomir treatment
Individual qRT-PCR analysis showed significantly altered hippocampal miR-344a levels by agomir (Figure 3E). Of note, basal expression of miR-344a in scramble TLE animals was significantly lower (P=0.013) when compared with the normal rats, while expression of miR-344a was significantly increased after 344a-agomir injection.
Effect of miR-344a agomir on seizures kindled by PTZ
Standard Racine-type scales were used to score the behavior of rats in the 344a group and the scramble group. During 1-hour observations after each kindling, miRNA-344a agomir treatment resulted in an onset of altered behavior in 17.8±0.8 seizure cases compared with 21.8±1.2 cases in the scramble group (n=9/group, P=0.041). Rats treated with 344a-agomir showed less twitching, nodding, spasming or continuous seizures (Figure 3F). No epileptiform activity was observed in the normal group.
Agomir of miR-344a decreased neuronal death in CE
Damage of neurons was tested by TUNEL to investigate whether miR-344a agomir before seizure kindling can also alter neuronal death and apoptosis in epileptic tolerance. Results show (Figure 4) neuronal death was significantly increased in scrambled and 344a-agomir CE rats compared with the rats in the sham group (P<0.0001). While cell damage in 344a-agomir rats was down-regulated in the cortex (P<0.05), there was no difference seen in the hippocampus when compared to scrambled rats (Figure 4B and C).
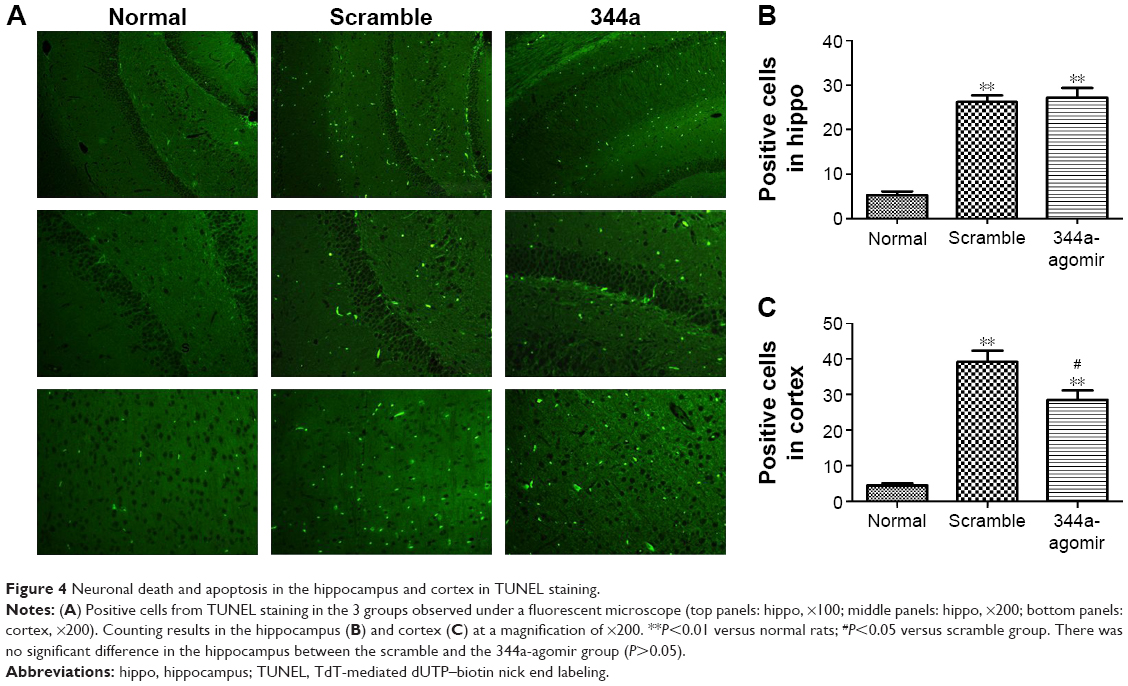 | Figure 4 Neuronal death and apoptosis in the hippocampus and cortex in TUNEL staining. |
Discussion
In the present study, we characterized the miRNA profiles in the hippocampus of PTZ-induced CE rats and compared them with a control group using miRNA microarray analysis. PTZ is a gamma-amino-butyric acid (GABA) antagonist that is generally used as a convulsant agent to develop TLE animal models for research of cognitive function and potential antiepileptic drugs.18 TLE, with the highest prevalence and severity, is the most frequent refractory type of epilepsy in adult patients.19 In this study, we created the CE rat models with PTZ (60 mg/kg) injection as the first induction, followed by 14 repeated injections with PTZ (35 mg/kg) as rekindling on alternating days to mimic the prominent feature of seizure recurrence in patients with CE. Recently, miRNAs have been found to be deregulated in epilepsy in lots of studies using animal models and tissue from surgical resection of pharmacoresistant epileptic patients. Profiling studies of miRNA expression in these studies have identified dysregulation of >100 different miRNAs.20 In our study, 4 up-regulated miRNAs (miR-139–3p, −770–5p, −127–5p, −331–3p) and 5 down-regulated miRNAs (miR-802–5p, −380–5p, −183–5p, −547–5p, −344a/−344a–5p) were found in the CE rats (fold change >1.5, P<0.05). In comparison with other studies, we got totally different dysregulated miRNAs. The source of such variability is multiple, including the diversity in study design, time points, structures and cell heterogeneity of the analyzed samples, as well as technique used to profile miRNA expression (microarrays vs Taq-Man-type assays).
Some of the dysregulated miRNAs we found in the study have already been implicated in other neurologic diseases. For example, it is suggested that miR-380–5p represses p53 to control cellular survival and is associated with poor outcomes in MYCN-amplified neuroblastoma.21 miR-183 has also been shown to play an important oncosuppressive role through its regulatory impact in gene expression irrespective of the presence of schizophrenia.22 When compared with previous studies, miRNA profiles in CE are different from those in SE induced by kainic acid or pilocarpine.9–11 Thus, we posited that recurrent seizures following the first convulsion caused much more deregulation of miRNA expression and played a critical role in the brain damage and pathogenesis of epilepsy. Studies have already suggested that the provoked neurons in an epileptic condition led to increased pathological events, including inflammation and cell damage,23,15 as well as oxidative stress, which is considered to be a contributing factor in the pathogenesis of epilepsy.24
Thousands of target genes were identified, including 30 target genes identified by all 3 databases. KEGG pathway analysis was used to provide a functional analysis of the dysregulated miRNAs. The retrograde endocannabinoid signaling, the mitogen-activated protein kinase signaling pathway, the dopaminergic synapse and glutamatergic synapse pathways are shown to be associated with the 9 dysregulated miRNA targets in CE. The wide-ranging biological processes regulated by miRNAs suggest that certain aspects of the epileptogenic process may not be regulated by specific miRNA in a significant way. Additionally, our results raise the possibility of targeting miRNAs in CE. We confirmed the initial results of miRNA microarray analysis from the hippocampus by qRT-PCR, and also determined that the expression of miR-344a in peripheral blood can serve as a potential bio-marker for clinical diagnosis and prognosis in patients with epilepsy.
The reproducibility of miRNA studies could contribute to researchers engaging in efforts to develop an miRNA-based treatment that may later fail to have sufficient clinical impact. The function of miRNAs can be evaluated by silencing or activating specific targets in vivo to establish whether they are promising therapeutic targets for epilepsy. In our study, an miR-344a agomir was ICV injected into rats and the expression of miR-344a was found to be increased twofold when compared with scrambled rats (Figure 3E). Furthermore, a reduction of neuron damage in the cortex following miRNA-334a agomir treatment revealed an effective protection from brain damage induced by seizures in multi-episode models. We chose to further study miR-344a for 2 basic reasons: first, miR-344a was confirmed by qRT-PCR; second, miR-344a was the specific miRNA that we believe has the greatest potential, based on current literature and the miRNA database, for use in epilepsy and other neurodegenerative disorders in the central nervous system.14,25 Patients with refractory epilepsy often show extensive cell loss in temporal brain areas, particularly when associated with hippocampal sclerosis.26,27 Many miRNAs have been found to be critical for normal brain development and function28 and seem to regulate synaptic function and survival response.29 A recent study proved that miR-344a could inhibit microtubule dynamics and GSK3b, which is a regulator of cell metabolism and protein synthesis, by phosphorylating initiation factors.14 Our study suggests that miRNA-344a might have a small modulatory effect on seizure-induced apoptosis signaling pathways in the cortex, but not hippocampus (Figure 4). The mechanisms underlying the molecular responses of miR-344a involved in CE are complicated. The regulation of miRNA in chronic epileptogenesis cannot be targeted using a single mRNA, and more studies are needed to further investigate other potential therapeutic targets.
Acknowledgments
This work was supported by the National Natural Science Foundation of China (grant numbers 81360201 and 81160167) and the Innovation Project of Guangxi Graduate Education. We thank Sasha Alcon from Boston Children’s Hospital for providing English language help.
Disclosure
The authors report no conflicts of interest in this work.
References
Thurman DJ, Beghi E, Begley CE, et al; ILAE Commission on Epidemiology. Standards for epidemiologic studies and surveillance of epilepsy. Epilepsia. 2011;52(Suppl 7):2–26. | ||
Eadie MJ. Shortcomings in the current treatment of epilepsy. Expert Rev Neurother. 2012;12(12):1419–1427. | ||
Holmes GL, Sarkisian M, Ben-Ari Y, Chevassus-Au-Louis N. Mossy fiber sprouting after recurrent seizures during early development in rats. J Comp Neurol. 1999;404(4):537–553. | ||
Blümcke I, Beck H, Lie AA, Wiestler OD. Molecular neuropathology of human mesial temporal lobe epilepsy. Epilepsy Res. 1999;36(2–3):205–223. | ||
Hermann S, Theodore W. Epilepsy Part I: Basic Principles and Diagnosis E-Book: Handbook of Clinical Neurology (Volume 107 of Handbook of Clinical Neurology). 1st ed. Newnes; 2012:471. | ||
Maes OC, Chertkow HM, Wang E, Schipper HM. MicroRNA: implications for Alzheimer disease and other human CNS disorders. Curr Genomics. 2009;10(3):154–168. | ||
Feng J, Sun G, Yan J, et al. Evidence for X-chromosomal schizophrenia associated with microRNA alterations. PLoS One. 2009;4(7):e6121. | ||
Hommers LG, Domschke K, Deckert J. Heterogeneity and individuality: microRNAs in mental disorders. J Neural Transm (Vienna). 2015;122(1):79–97. | ||
Hu K, Zhang C, Long L, et al. Expression profile of microRNAs in rat hippocampus following lithium-pilocarpine-induced status epilepticus. Neurosci Lett. 2011;488(3):252–257. | ||
Pichardo-Casas I, Goff LA, Swerdel MR, et al. Expression profiling of synaptic microRNAs from the adult rat brain identifies regional differences and seizure-induced dynamic modulation. Brain Res. 2012;1436:20–33. | ||
McKiernan RC, Jimenez-Mateos EM, Sano T, et al. Expression profiling the microRNA response to epileptic preconditioning identifies miR-184 as a modulator of seizure-induced neuronal death. Exp Neurol. 2012;237(2):346–354. | ||
Cattani AA, Allene C, Seifert V, Rosenow F, Henshall DC, Freiman TM. Involvement of microRNAs in epileptogenesis. Epilepsia. 2016;57(7):1015–1026. | ||
Nudelman AS, DiRocco DP, Lambert TJ, et al. Neuronal activity rapidly induces transcription of the CREB-regulated microRNA-132, in vivo. Hippocampus. 2010;20(4):492–498. | ||
Chen H, Wang S, Chen L, et al. MicroRNA-344 inhibits 3T3-L1 cell differentiation via targeting GSK3β of Wnt/β-catenin signaling pathway. FEBS Lett. 2014;588(3):429–435. | ||
Macdonald RL, Kapur J. Acute cellular alterations in the hippocampus after status epilepticus. Epilepsia. 1999;40(Suppl 1):S9–S20. | ||
Sano T, Reynolds JP, Jimenez-Mateos EM, Matsushima S, Taki W, Henshall DC. MicroRNA-34a upregulation during seizure-induced neuronal death. Cell Death Dis. 2012;3:e287. | ||
Racine R, Okujava V, Chipashvili S. Modification of seizure activity by electrical stimulation. 3. Mechanisms. Electroencephalogr Clin Neurophysiol. 1972;32(3):295–299. | ||
Morimoto K, Fahnestock M, Racine RJ. Kindling and status epilepticus models of epilepsy: rewiring the brain. Prog Neurobiol. 2004;73(1):1–60. | ||
Engel J Jr, Wilson C, Bragin A. Advances in understanding the process of epileptogenesis based on patient material: what can the patient tell us? Epilepsia. 2003;44(Suppl 12):60–71. | ||
Henshall DC. MicroRNA and epilepsy: profiling, functions and potential clinical applications. Curr Opin Neurol. 2014;27(2):199–205. | ||
Swarbrick A, Woods SL, Shaw A, et al. miR-380–5p represses p53 to control cellular survival and is associated with poor outcome in MYCN-amplified neuroblastoma. Nat Med. 2010;16:1134–1140. | ||
Rizos E, Siafakas N, Katsantoni E, et al. Let-7, mir-98 and mir-183 as biomarkers for cancer and schizophrenia [corrected]. PLoS One. 2015;10(4):e0123522. | ||
Fujikawa DG. Prolonged seizures and cellular injury: understanding the connection. Epilepsy Behav. 2005;7(Suppl 3):S3–S11. | ||
Sudha K, Rao AV, Rao A. Oxidative stress and antioxidants in epilepsy. Clin Chim Acta. 2001;303(1–2):19–24. | ||
Liu Q, He H, Zeng T, Huang Z, Fan T, Wu Q. Neural-specific expression of miR-344–3p during mouse embryonic development. J Mol Histol. 2014;45(4):363–372. | ||
Hermann BP, Seidenberg M, Bell B. The neurodevelopmental impact of childhood onset temporal lobe epilepsy on brain structure and function and the risk of progressive cognitive effects. Prog Brain Res. 2002;135:429–438. | ||
Oyegbile TO, Bhattacharya A, Seidenberg M, Hermann BP. Quantitative MRI biomarkers of cognitive morbidity in temporal lobe epilepsy. Epilepsia. 2006;47(1):143–152. | ||
Saugstad JA. MicroRNAs as effectors of brain function with roles in ischemia and injury, neuroprotection, and neurodegeneration. J Cereb Blood Flow Metab. 2010;30(9):1564–1576. | ||
Davis TH, Cuellar TL, Koch SM, et al. Conditional loss of Dicer disrupts cellular and tissue morphogenesis in the cortex and hippocampus. J Neurosci. 2008;28(17):4322–4330. |
 © 2017 The Author(s). This work is published and licensed by Dove Medical Press Limited. The
full terms of this license are available at https://www.dovepress.com/terms
and incorporate the Creative Commons Attribution
- Non Commercial (unported, 3.0) License.
By accessing the work you hereby accept the Terms. Non-commercial uses of the work are permitted
without any further permission from Dove Medical Press Limited, provided the work is properly
attributed. For permission for commercial use of this work, please see paragraphs 4.2 and 5 of our Terms.
© 2017 The Author(s). This work is published and licensed by Dove Medical Press Limited. The
full terms of this license are available at https://www.dovepress.com/terms
and incorporate the Creative Commons Attribution
- Non Commercial (unported, 3.0) License.
By accessing the work you hereby accept the Terms. Non-commercial uses of the work are permitted
without any further permission from Dove Medical Press Limited, provided the work is properly
attributed. For permission for commercial use of this work, please see paragraphs 4.2 and 5 of our Terms.