Back to Journals » Pharmacogenomics and Personalized Medicine » Volume 15
MicroRNA Dysregulation in Prostate Cancer
Authors Schitcu VH ![]() , Raduly L
, Raduly L ![]() , Nutu A, Zanoaga O, Ciocan C, Munteanu VC, Cojocneanu R, Petrut B, Coman I, Braicu C
, Nutu A, Zanoaga O, Ciocan C, Munteanu VC, Cojocneanu R, Petrut B, Coman I, Braicu C ![]() , Berindan-Neagoe I
, Berindan-Neagoe I
Received 10 November 2021
Accepted for publication 17 February 2022
Published 10 March 2022 Volume 2022:15 Pages 177—193
DOI https://doi.org/10.2147/PGPM.S348565
Checked for plagiarism Yes
Review by Single anonymous peer review
Peer reviewer comments 2
Editor who approved publication: Dr Martin H Bluth
Vlad Horia Schitcu,1– 3,* Lajos Raduly,1,* Andreea Nutu,1,* Oana Zanoaga,1 Cristina Ciocan,1 Vlad Cristian Munteanu,2,3 Roxana Cojocneanu,1 Bogdan Petrut,2,3 Ioan Coman,2 Cornelia Braicu,1 Ioana Berindan-Neagoe1
1Research Center for Functional Genomics, Biomedicine, and Translational Medicine, “Iuliu Hațieganu” University of Medicine and Pharmacy, Cluj-Napoca, 400337, Romania; 2Department of Urology, “Iuliu Hatieganu” University of Medicine and Pharmacy, Cluj-Napoca, 400012, Romania; 3Department of Urology, “Prof. Dr. Ion Chiricuta” Oncology Institute, Cluj-Napoca, Romania
*These authors contributed equally to this work
Correspondence: Cornelia Braicu, Research Center for Functional Genomics, Biomedicine, and Translational Medicine, “Iuliu Hațieganu” University of Medicine and Pharmacy, 23 Gh. Marinescu Street, Cluj-Napoca, 400337, Romania, Tel +40-264-597-256, Fax +40-264-597-257, Email [email protected]; [email protected]
Abstract: Prostate cancer biology is complex, and needs to be deciphered. The latest evidence reveals the significant role of non-coding RNAs, particularly microRNAs (miRNAs), as key regulatory factors in cancer. Therefore, the identification of altered miRNA patterns involved in prostate cancer will allow them to be used for development of novel diagnostic and prognostic biomarkers. Patients and Methods: We performed a miRNAs transcriptomic analysis, using microarray (10 matched pairs tumor tissue versus normal adjacent tissue, selected based on inclusion criteria), followed by overlapping with TCGA data. A total of 292 miRNAs were differentially expressed, with 125 upregulated and 167 downregulated in TCGA patients’ cohort with PRAD (prostate adenocarcinoma), respectively for the microarray experiments; 16 upregulated and 44 downregulated miRNAs were found in our cohort. To confirm our results obtained for tumor tissue, we performed validation with qRT-PCR at the tissue and plasma level of two selected transcripts, and finally, we focused on the identification of altered miRNAs involved in key biological processes. Results: A common signature identified a panel of 12 upregulated and 1 downregulated miRNA, targeting and interconnected in a network with the TP53, AGO2, BIRC5 gene and EGFR as a core element. Among this signature, the overexpressed transcripts (miR-20b-5p, miR-96-5p, miR-183-5p) and the downregulated miR-542-5p were validated by qRT-PCR in an additional patients’ cohort of 34 matched tumor and normal adjacent paired samples. Further, we performed the validation of the expression level for miR-20b-5p, miR-96-5p, miR-183-5p plasma, on the same patients’ cohort versus a healthy control group, confirming the overexpression of these transcripts in the PRAD group, demonstrating the liquid biopsy as a potential investigational tool in prostate cancer. Conclusion: In this pilot study, we provide evidence on miRNA dysregulation and its association with key functional components of the PRAD landscape, where an important role is acted by miR-20b-5p, miR-542-5p, or the oncogenic cluster miR-183-96-182.
Keywords: prostate adenocarcinoma, microRNA, tissue, plasma, molecular signature, biological network
Introduction
According to Globocan 2020, prostate cancer is the second most frequent malignancy (after lung cancer) worldwide, with 1,414,259 (14.1%) new cases, and causing 375,304 deaths (3.8% of all deaths caused by cancer in men).1,2 Around 20% of the new cases will develop invasive disease during their lifetime, most of the cases being diagnosed in advanced stages.3
Current prostate cancer management is based on a series of tests for non-invasive biomarkers.4 Till now, the serum markers are not sufficient for both early diagnostic and prognostic of prostate cancer. Patient stratification and identification of high-risk groups of prostate cancer have an important role in therapeutic decision.5
A better understanding of the prostate cancer molecular landscape will have an important role in the development of novel biomarkers or identification of therapeutic target.6 In this context, in the last decades, the evaluation of non-coding genes opened new avenues in cancer investigation.7–10
MicroRNAs (miRNAs) are small non-coding RNAs with 19–25 nucleotides in length that regulate the mRNA level of expression by canonical and non-canonical mechanisms9,11 and shown an important impact in cellular processes;12–14 also miRNAs have and important role in intercellular signaling.15 Dysregulation of miRNAs has been observed in several human malignancies,7,16,17 including prostate cancer. Increasing evidence indicates that the miRNAs can act as either oncogenes or tumor suppressor genes.
miRNAs are mentioned in literature as a potential application of biomarkers for numerous diseases,7,9,18 including prostate adenocarcinoma (PRAD).19 Despite this, there is a current lack of validated studies that evaluated the miRNA expression level and direct connection with clinical variables, particularly from the liquid biopsy.20,21 Recent literature data emphasizes the important role of liquid biopsy in patient stratification.20,22
In the present pilot study, using microarray technology, we evaluated the miRNA particularities in PRAD on ten matched paired tumor tissues and normal adjacent tissues samples, followed by overlapping with TCGA data and identification of key pathways involved. The profiling study was followed by validation by qRT-PCR in an additional patient cohort comprising 34 matched PRAD samples, followed by an additional validation step from plasma samples from the same patients’ cohort.
Consequently, to these analyses, we performed the exploration of the expression level for the most relevant target genes using UALCAN online tools. miRNA-gene interconnection was analyzed using Ingenuity Pathway Analysis (IPA) software. Our findings contribute to the molecular understanding of the tumorigenesis and for prognostic value in PRAD, and provide a set of miRNAs and their target genes that may be useful for the development of novel diagnostic biomarkers and/or more effective therapeutic strategies, particularly for the identification of high-risk groups of PRAD.
Materials and Methods
Human Subjects, Ethical Approval, and Clinical Data
We designed and performed a microarray experiment for microRNA evaluation on the matched paired samples of PRAD and their normal adjacent tissues (Table 1), age average of 63±4.9, followed by a validation step by qRT-PCR (Table 2, age average of 66±4.9). Sample collection was done after the approval of the Ethical Committee of The Oncology Institute “Prof. Dr. Ion Chiricuta” no. 5991 from 26.06.2019, following protocols by national and European regulations concerning the use of biological samples and personal data: personal data were anonymized for all cases; all patients and healthy donors were informed about the study, and each provided signed informed consent.
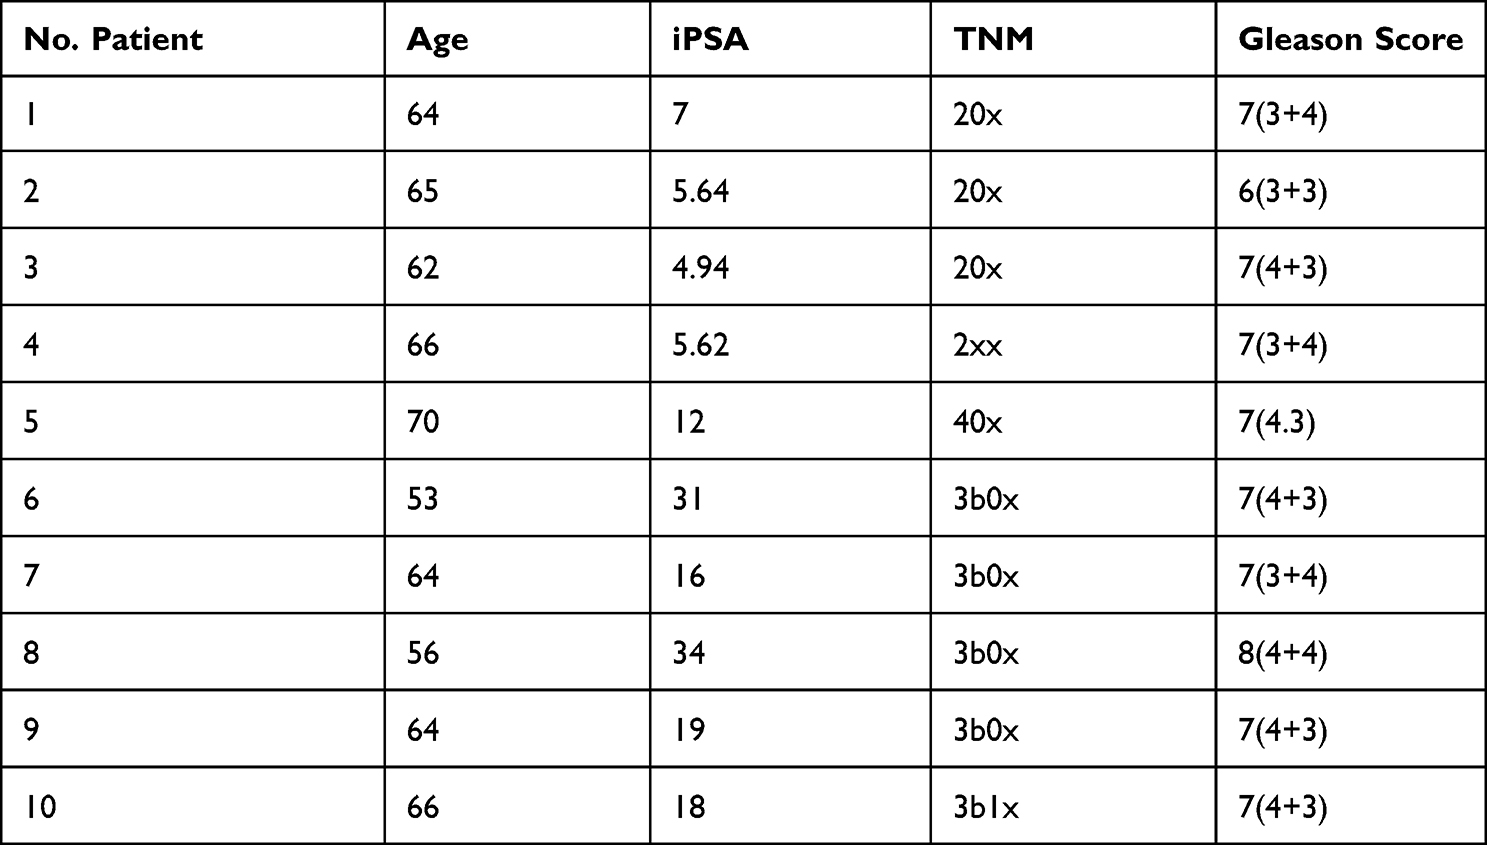 |
Table 1 Clinical Data for the Patients Used for the Microarray Study Matched Paired Samples from 10 Patients with PRAD |
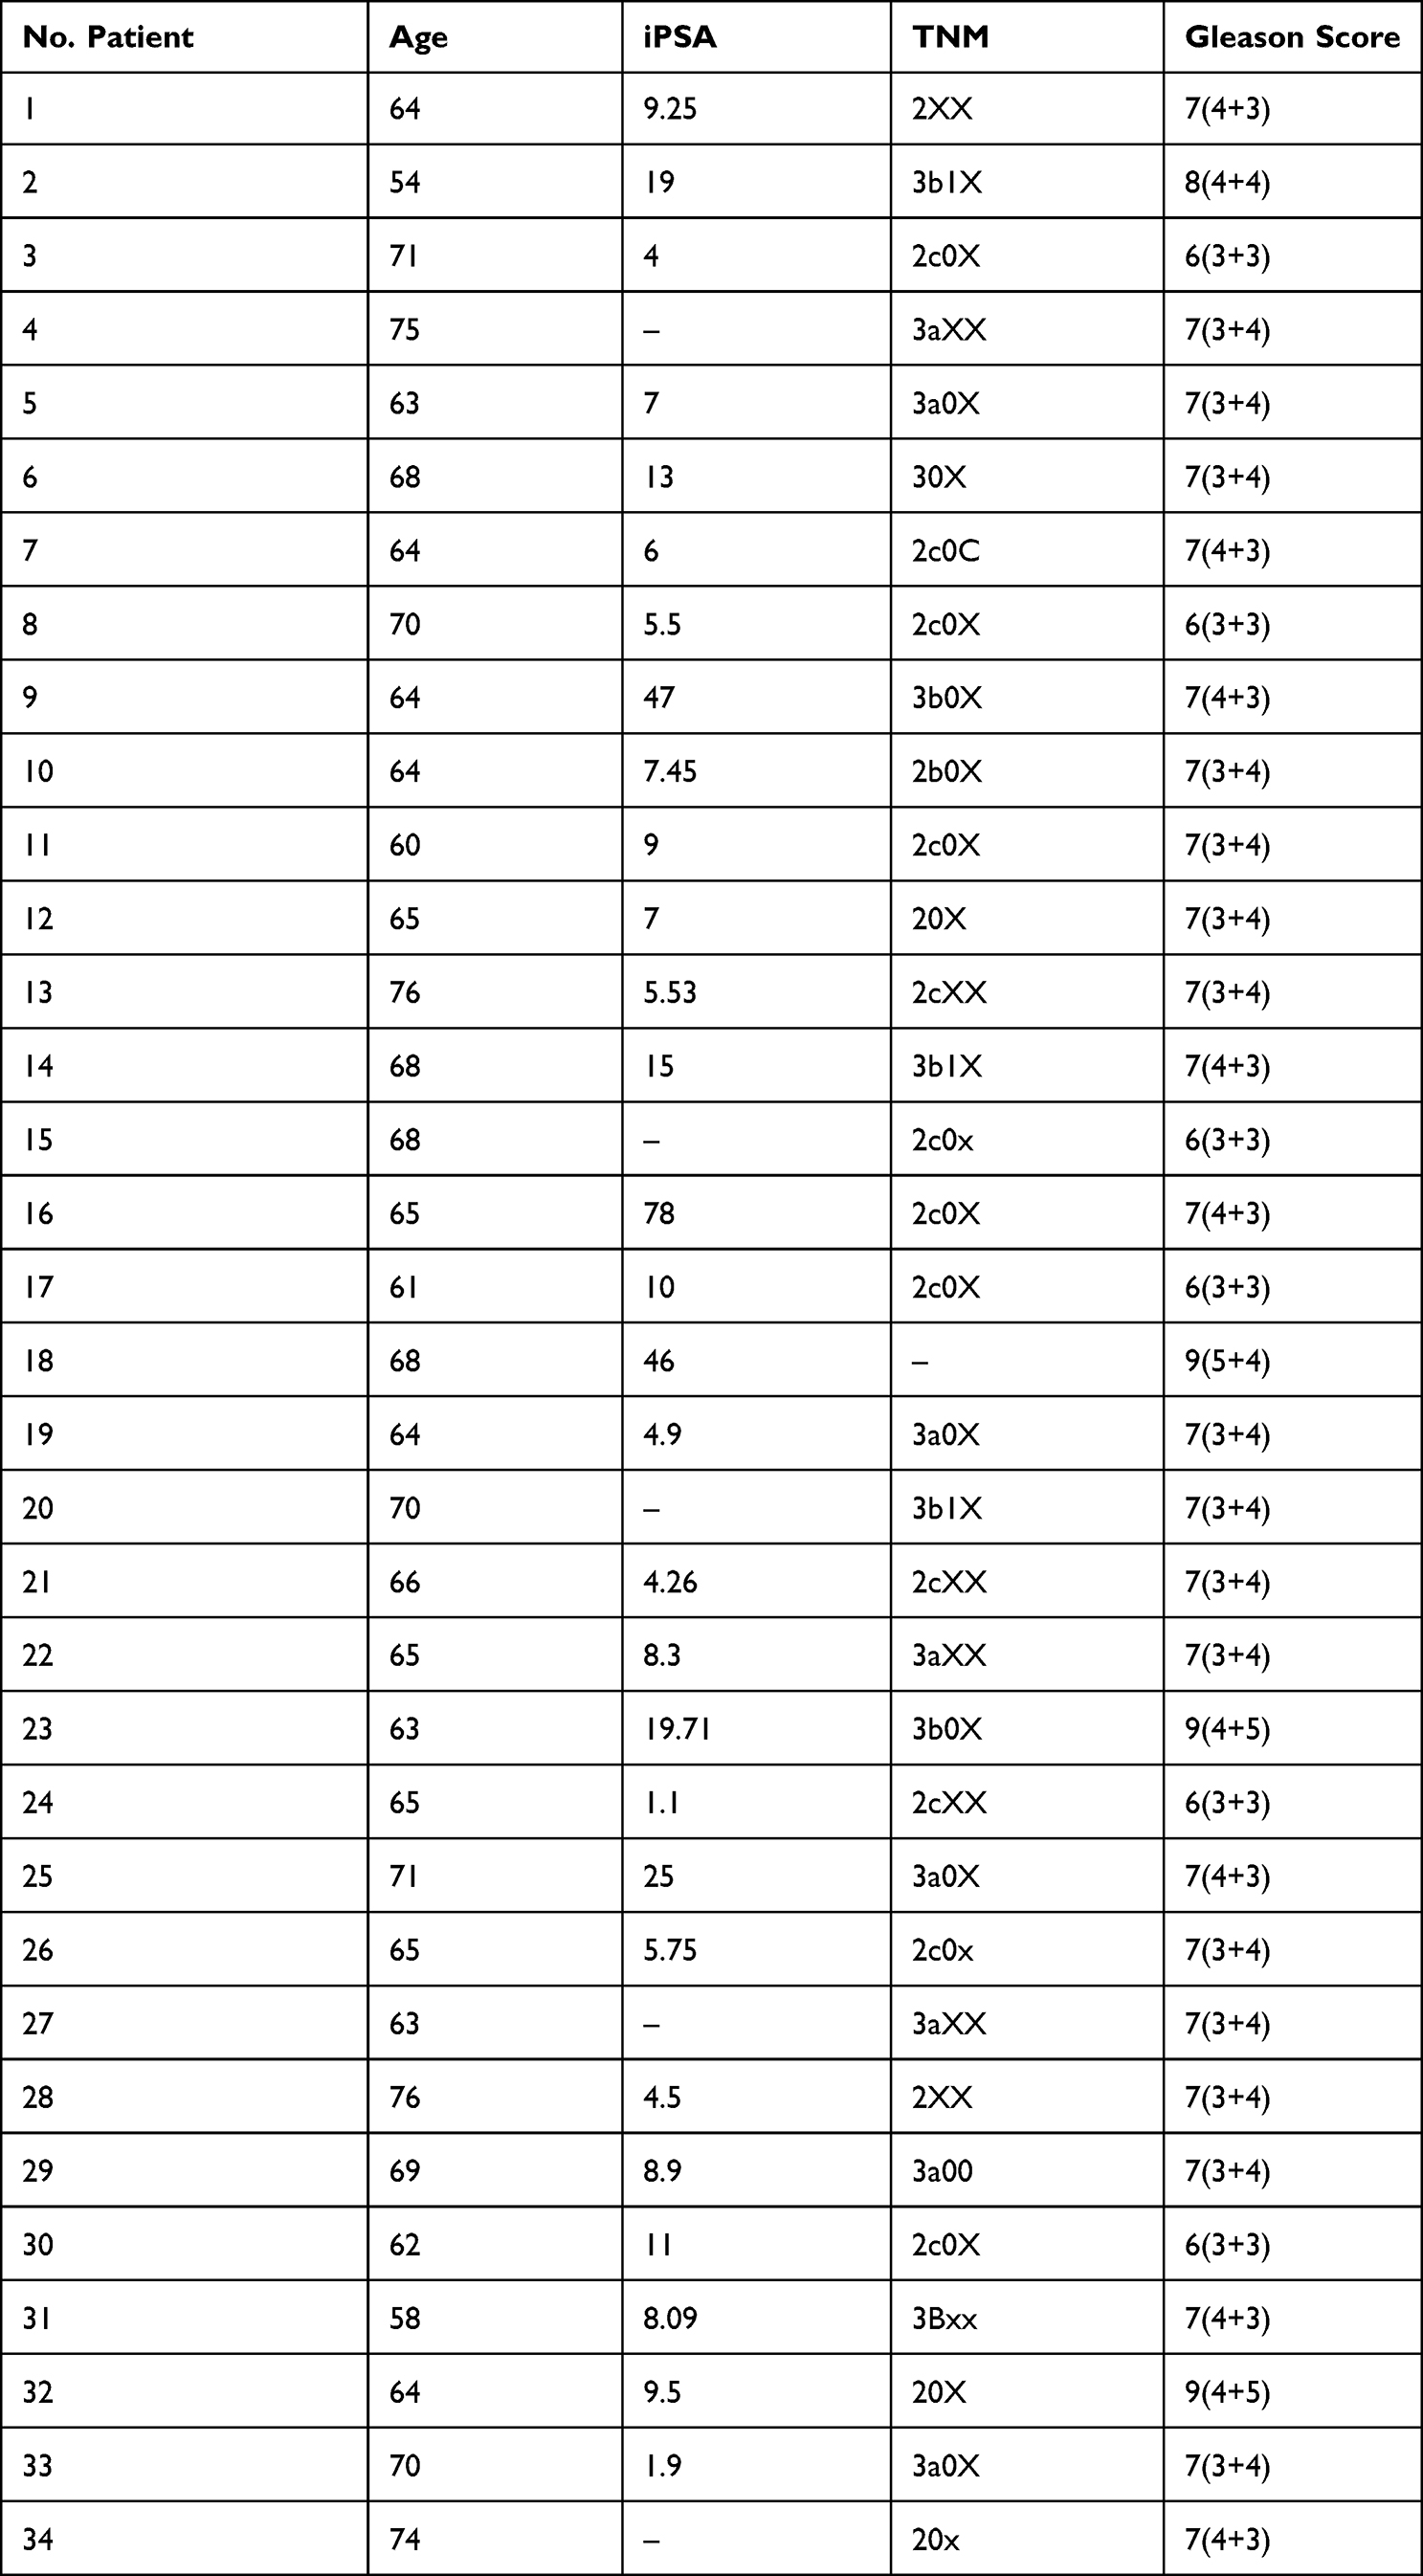 |
Table 2 Clinical Characteristics of PRAD Patients Used for the qRT-PCR Validation Study in Tumor Tissue/Normal Adjacent Tissue and Plasma Samples |
The clinical characteristics for each patient enrolled in the microarray analysis (defined as UMPh patient cohort) are given in Table 1, meanwhile, the clinical data for the validation cohort of PRAD patients used for qRT-PCR from tissue (tumor/normal adjacent) and plasma are given in Table 2. For the qRT-PCR of plasma samples, we used male plasma samples from healthy controls (Table 3), considering the estimated age-specific incidence rates for prostate cancer.23
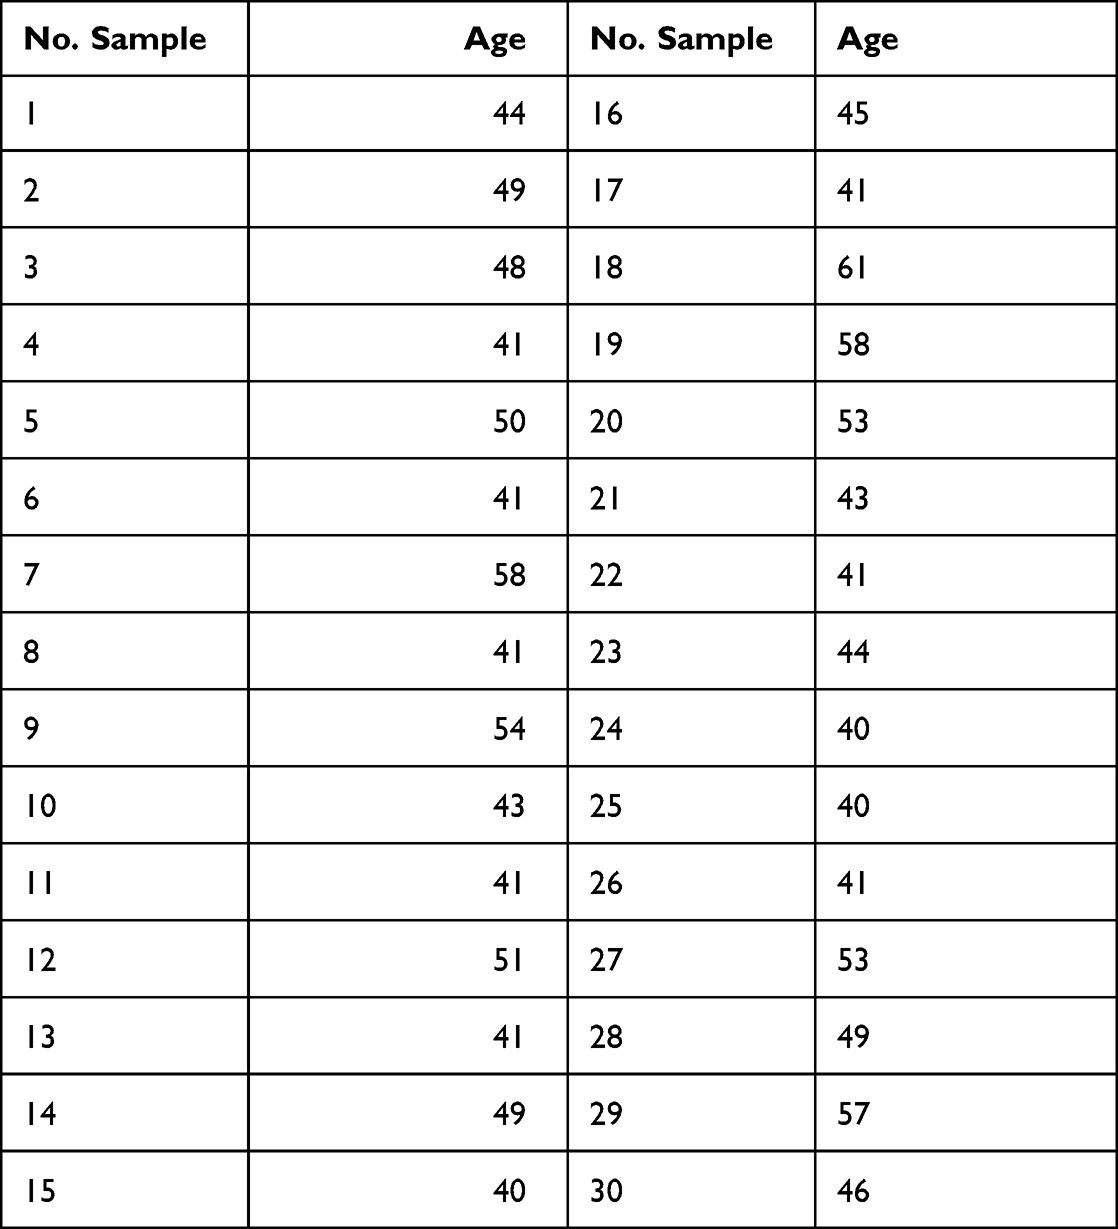 |
Table 3 Plasma Samples from Healthy Men Selected as the Control Group for the Plasma of PRAD Patients Used for the Plasma qRT-PCR Validation Study |
Clinical Data of Patients from TCGA Data
The Cancer Genome Atlas (TCGA) is a public database developed to generate complex bioinformatics analysis with important implications in understanding the molecular portraits.24 Therefore, we downloaded the data from the Firebrowse portal (http://firebrowse.org/), comprising data from 494 samples of PRAD and 52 adjacent normal tissue (Table 4).
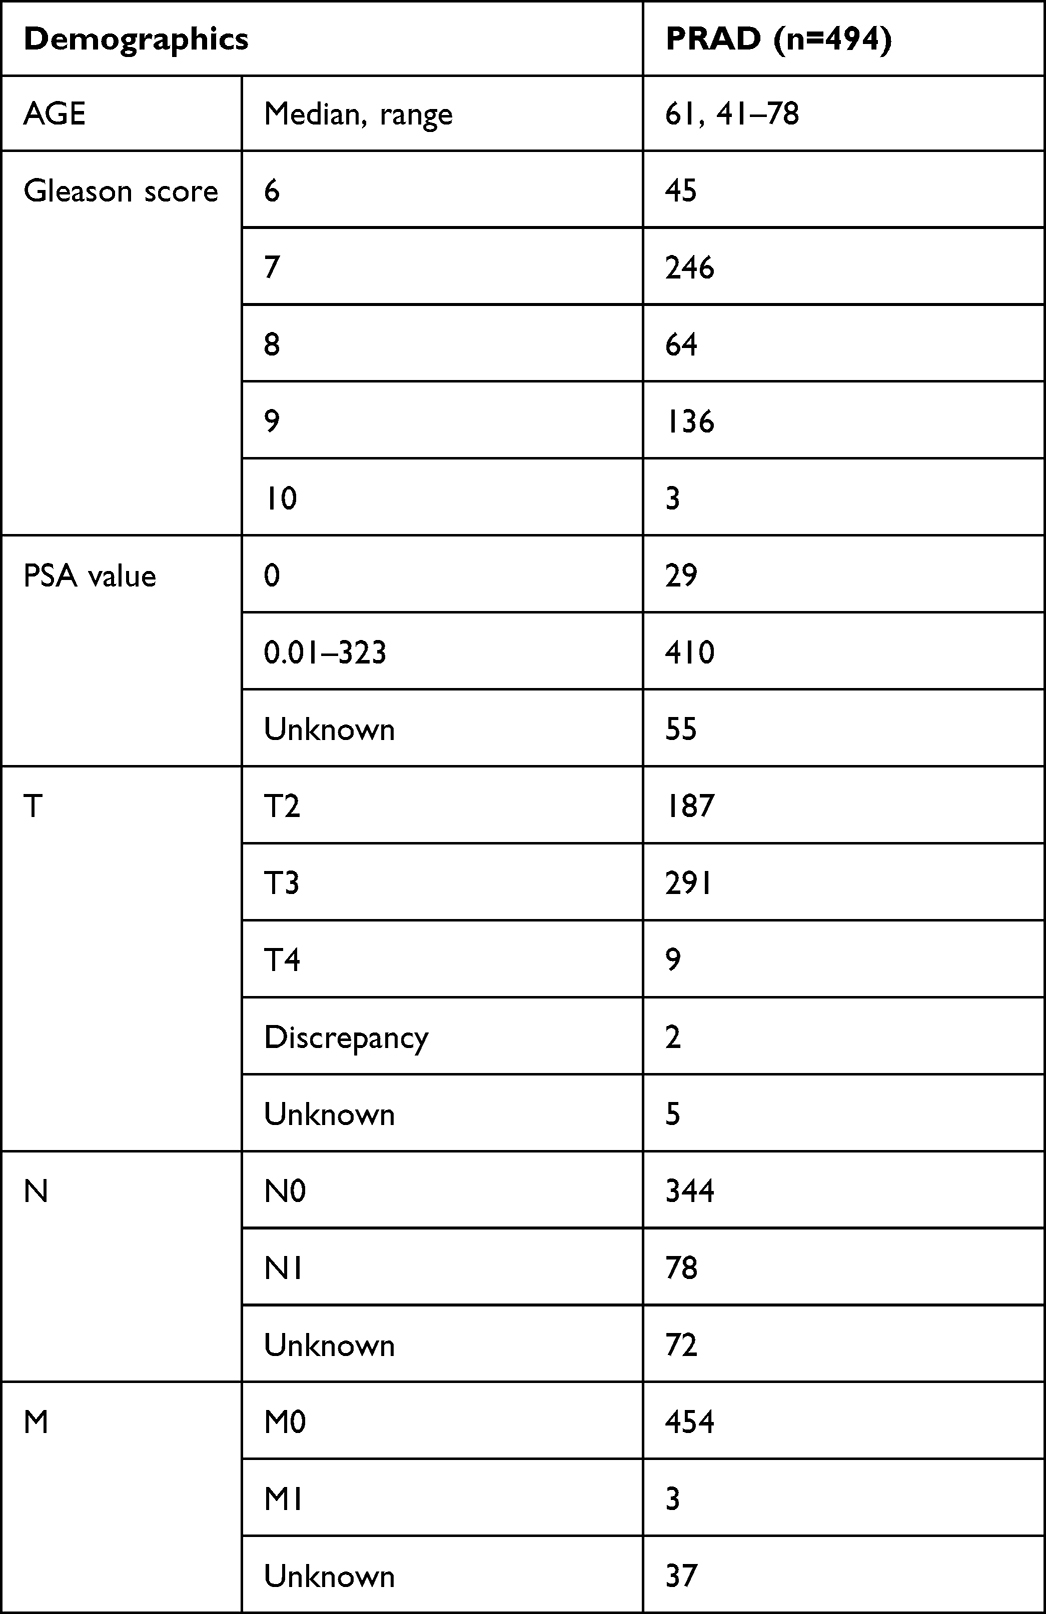 |
Table 4 Clinical Data for TGCA Prostate Adenocarcinoma (PRAD) Patients |
MiRNA Analysis Conditions from TCGA
We analyzed the miRNAs using Gene Spring considering FC±1.5 as cut-off value and p-value ≤0.05.
RNA Extraction and Quality Control
The tissue samples (tumor and normal adjacent tissue) was extracted using Trireagent, and for the plasma was used Plasma/Serum Circulating and Exosomal RNA Purification Kit (Slurry Format) (Cat. 42800), followed by the evaluation of RNA concentration by the use of NanodropND2000 for microarray, respectively qRT-PCR validation step.
miRNA Microarray and Array Data Analysis Evaluation
For miRNA patterns, we used 10 tumor tissue and normal adjacent tissue matched paired PRAD samples. Starting from 100 ng of total RNA, the hybridization was done using Agilent microRNA Spike-In kit and the labeling miRNA Complete Labeling and Hyb Kit, followed by a purification step using Micro Bio-Spin 6 (Biorad, Mississauga, ON, Canada) spin columns according to producer recommended protocol. Also, for the hybridization, Agilent SurePrint Human miRNA v21.0 microarray slides (G4872A) have been used. After the 20 hours hybridization period in the oven at 55°C, the slides have been washed and scanned using an Agilent Microarray Scanner.
The bioinformatics analysis was done for matched paired PRAD samples using the same parameters as those used for TCGA data sets. The data were extracted using Agilent Feature Extraction software (Agilent Technologies); Agilent GeneSpring GX program (Agilent Technologies) was used to obtain differentially expression selected “Filter on Volcano Plot” analysis and moderated t-test, with a fold change of 1.5. Benjamini–Hochberg (false discovery rate-FDR) algorithm was applied to reduce the false-positive rates.
Ingenuity Pathway Analyses of Commonly Deregulated miRNAs in PRAD
The identified differentially expressed miRNAs in both patient cohorts (UMPh and TCGA) were uploaded to the IPA software (https://digitalinsights.qiagen.com/products-overview/discovery-insights-portfolio/analysis-and-visualization/qiagen-ipa, QIAGEN). The “core analysis” function of the software was used to analyze the differentially expressed miRNA data, which incorporated the recognition of biological processes, canonical pathways, upstream transcriptional regulators, and interconnected networks.
Online Evaluation of TCGA Gene and miRNA Expression Level in PRAD
Using the UALCAN database (http://ualcan.path.uab.edu/index.html), the expression levels of common miRNA signature in patients with PRAD have been separated on TP53 mutation status and Gleason score. UALCAN is a user-friendly, interactive web resource for TCGA transcriptome data analysis.25 The analytical results were displayed on the webpage (UALCAN); p<0.05 was considered to denote a statistically significant result. The evaluation of the target genes was done using the DIANA-miRPath v3.0 interface.26
miRNA qRT-PCR Evaluation on Tissue and Plasma Samples
Three upregulated transcripts (miR-20b-5p, assay ID:001006; miR-96-5p, assay ID: 000186 and miR-183-5p, assay ID: 002269) and one downregulated transcript (miR-543-5p, assay ID: 002269) were selected from common signature from our microarray data and TCGA in both data analyses (UMPh and TGCA patient cohort). RNA was extracted using the TriReagent based method for qRT-PCR. The validation was performed on 34 matched paired PRAD samples, respectively 34 plasma samples from PRAD and 30 healthy controls using TaqMan MicroRNA Reverse Transcription Kit (Applied Biosystems) protocol as described previously, based on ΔΔCt method,16 on VIIA7 system (Life Technologies). U6 (assay ID: 001973) and RNU48 (assay ID: 001006) were used as normalizers. All qRT-PCR reagents were provided by Life Technologies.
Statistically Analysis
Data analysis was done using GraphPad Prism v9 software (GraphPad Software, San Diego, CA, USA). Student’s t-test was used for the differences among the expression levels of gene and miRNAs, as two-group comparisons (in tumor tissue and normal adjacent PRAD tissue, respective for the expression level in the case of plasma for PRAD patients versus healthy control group); p-value≤0.05 was considered as statistically.
Results
Differential miRNA Expression on PRAD-UMPh Patient Cohort
In the case of our patients’ cohort with confirmed histopathological PRAD (10 tumor tissue/ normal adjacent tissue matched paired samples) there has been observed an important number of altered transcripts, only 60 differentially expressed miRNAs (16 upregulated and 44 downregulated), the complete list of the altered miRNAs being displayed in Table S1 and Figure 1. Figure 1A presents the UMPh heatmap, in Figure 1C is displayed scatter plot and in the Figure 1E is represented the Volcano plot for the same patient cohort.
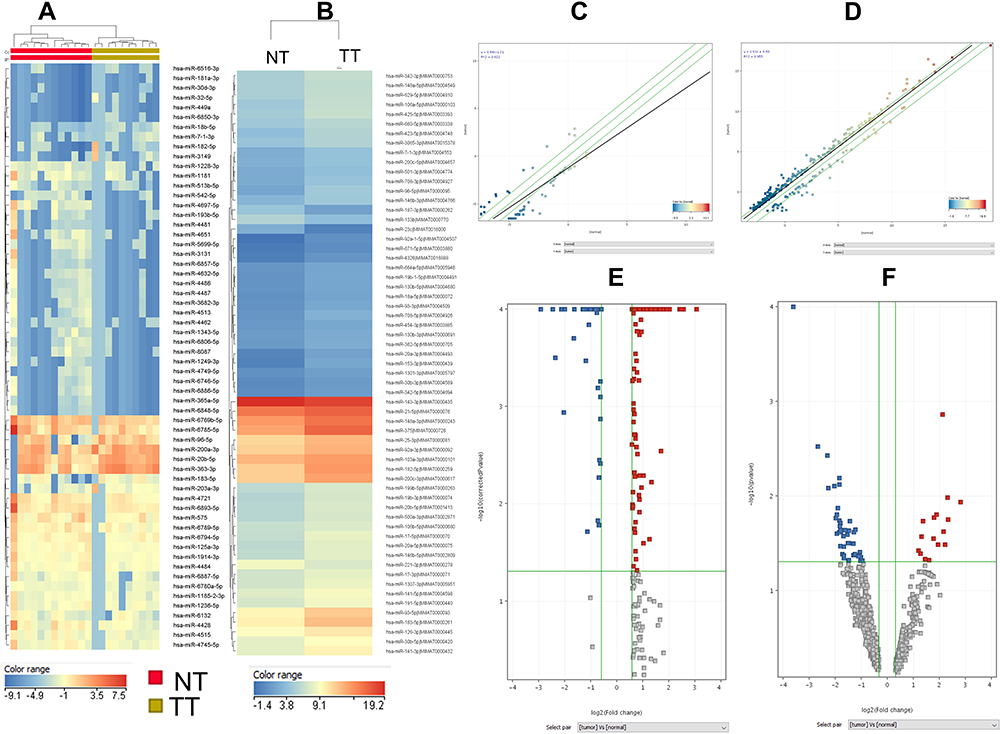 |
Figure 1 MiRNA pattern in PRAD in UMPh and TCGA patient cohort. Heatmap of miRNA microarray expression data for (A) UMPh patient cohort, (B)TCGA data; (C) scatter plot used to visualize variations in miRNA expression between tumor values on the X-axes) and normal adjacent tissue (values on the Y axes), using the default fold-change value 1.5, displayed as green lines) of differentially expressed miRNAs for UMPh group (D) scatter plot of differentially expressed miRNAs for TCGA cohort; (E) volcano plot for UMPh group (F) volcano plot for TCGA group, graphical representation generated using Gene Spring (PRAD tumor tissue versus normal adjacent tissues); abscissa represents the log2 transformation value of the differential expression fold change between the tumor and the normal samples. Abbreviations: NT, normal tissue; TT, tumoral tissue. |
Differential miRNA Expression on PRAD-TCGA Patient Cohort
The analysis performed on TCGA samples for PRAD tumor tissue (n=494) versus normal tissue (n=52) reveals a total of 261 miRNAs differentially expressed (208 upregulated and 53 downregulated), displayed as a heatmap in Figure 1B. The complete list of the altered miRNAs is presented in Table S2. Additional scatter plot and Volcano plot graphical representation is displayed in Figure 1D, respectively 1F for TCGA dataset.
For common miRNA signature using UMPh and TCGA patient cohort an additional Venn diagram was created for the overexpressed (Figure 2A) and downregulated transcripts (Figure 2B).
 |
Figure 2 Summary of common miRNAs which are differentially expressed in PRAD between UMPh and TCGA. The common miRNAs are presented by overlapping the altered miRNAs as Venny diagram in the two analyzed groups using Gene Spring: (A) overexpressed miRNAs in the two analyzed cohorts and (B) downregulated miRNAs in the two cohorts. |
Validation of Microarray Data by RT-PCR at Tissue
We performed qRT-PCR for the validation of microarray analysis for 4 differentially expressed miRNAs (miR-20b-5p, miR-96-5p, miR-183-5p, and miR-543-5p) in the expanded collective of 34 PRAD tumor tissues and their adjacent normal tissue. U6 and RNU48 were used as endogenous controls for the normalization of the qRT-PCR data. miR-20b-5p, miR-96-5p, and miR-183-5p-5p levels were overexpressed, while those for miR-543-5p were downregulated in tumor tissues versus normal tissues, data being in accordance with those from the microarray data (Figure 3A). We performed the AUC (area under the curve) analysis showing that the highest AUC value was observed for miR-542-5p (0.8015) and miR-96-5p (0.7355), less sensible as biomarkers being miR-183-5p (AUC=0.6677), respectively miR-20b-5p (AUC=0.6437) (Figure 3B).
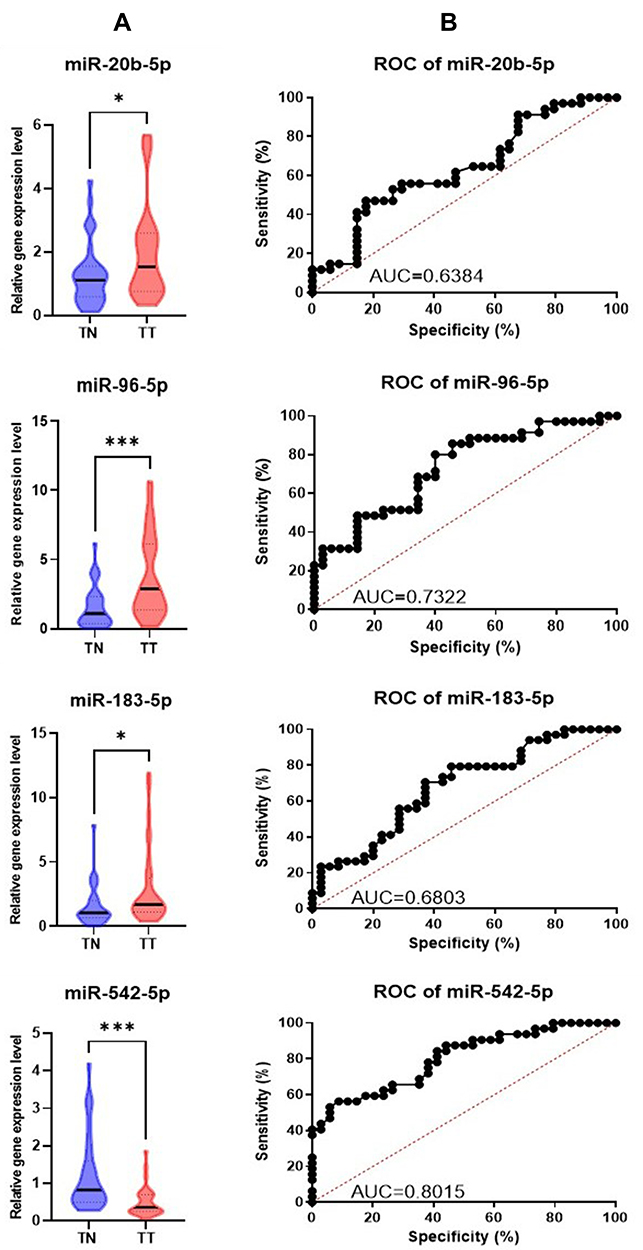 |
Figure 3 Tissue qRT-PCR data validation (A) Graphical representation of the expression levels for miR-20b-5p, miR-96-5p, miR-183-5p and miR-543-5p in tumor versus normal adjacent tissue. The data were normalized using U6 and RNU48 (*p ≤ 0.05, ***p≤ 0.001) (B) ROC curves for the selected miRNAs, displaying the specificity and sensitivity for the discrimination among the tumoral tissue (TT) versus normal tissue (TN). Abbreviations: ROC, receiver-operating characteristic; AUC, area under ROC curve. |
Validation of Microarray Data by RT-PCR at Plasma Level
Additional validation at plasma level using samples from 34 PRAD patients and 30 healthy controls was performed for the selected overexpressed transcripts, confirming the overexpression level retrieved (Figure 4A). AUC values are similar, or even higher than those retrieved in tissue (Figure 4B).
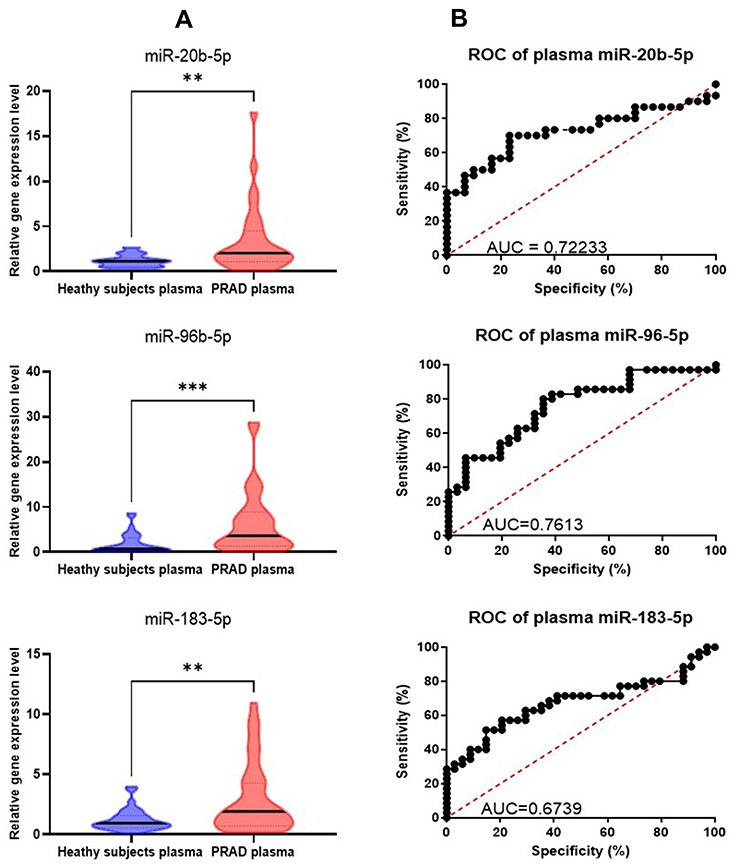 |
Figure 4 Plasma qRT-PCR data validation. (A) Graphical representation of the expression levels for miR-20b-5p, miR-96-5p, miR-183-5p in plasma PRAD patients versus healthy controls plasma. The data were normalized using U6 and RNU48 (**p ≤ 0.01, ***p≤ 0.001) (B) ROC curves for the selected miRNAs, displaying the specificity and sensitivity for the discrimination among expression levels in plasma for PRAD patients versus healthy controls. Abbreviations: ROC, receiver-operating characteristic; AUC, area under ROC curve. |
miRNAs as Key Signaling Molecules in PRAD Evaluated Using IPA
The molecular cellular functions identified as significantly enriched (p≤0.05) within the dataset are summarized in Table 5 based on IPA analysis. The most significant altered network identified was “Cellular Development” in both patients’ cohorts. We used the common PRAD signature to generate the miRNA-mRNA interaction network using IPA, displayed in Figure 5, revealing the TP53, AGO2, BIRC5, and EGFR as the core element for this network.
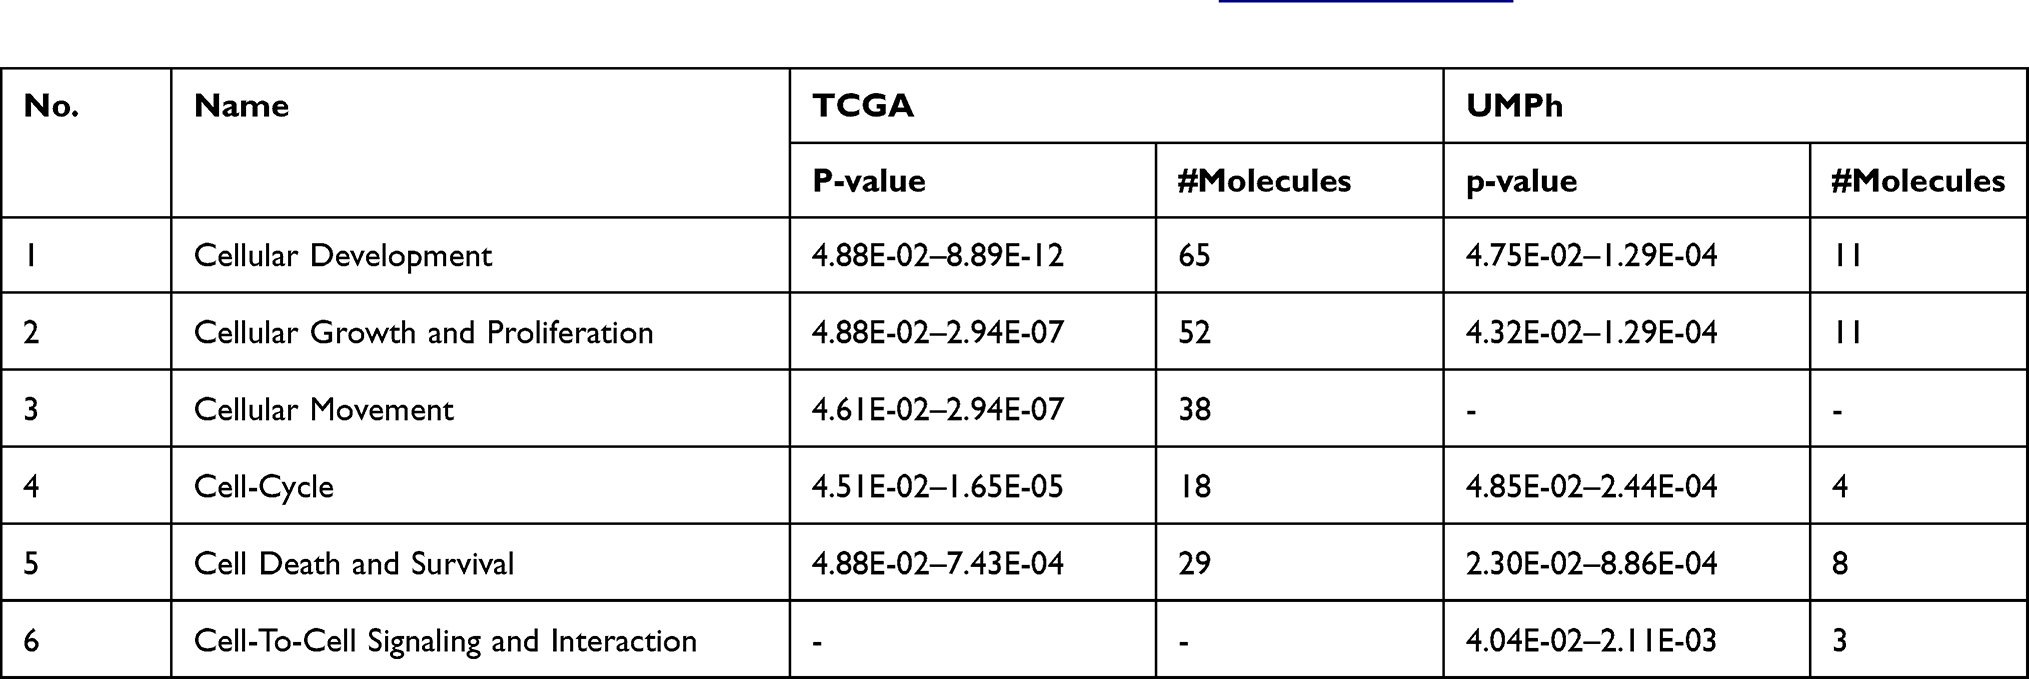 |
Table 5 Molecular and Cellular Functions Altered in PRAD Recognized by IPA (www.ingenuity.com) Considering the Altered miRNA Expression Signature for the Two Patient Cohorts |
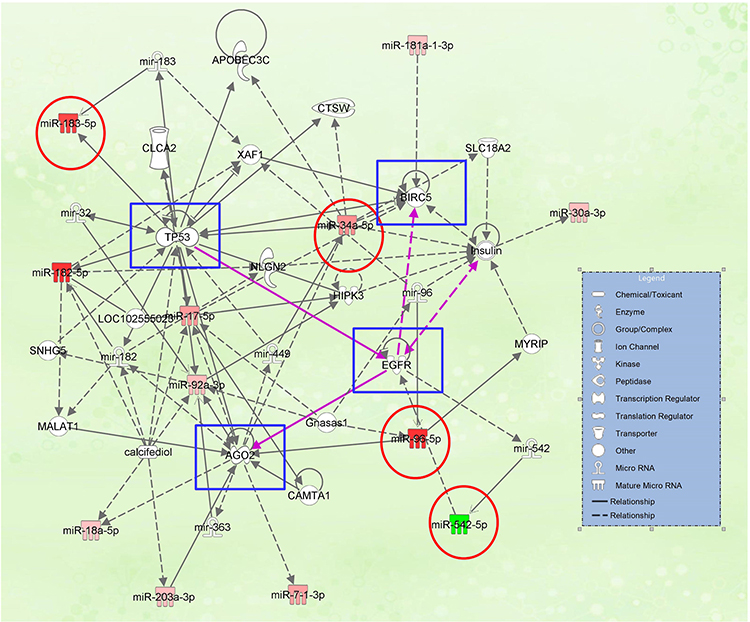 |
Figure 5 miRNA-mRNA interaction network generated using IPA, based on the common miRNA signature among the two-patient cohort; the downregulated miRNAs are presented in green; the overexpressed miRNAs are presented in red; the red circle is highlighted the miRNAs validated by qRT-PCR, blue squares are highlighted the core genes of the network. |
Four key representative transcripts (miR-20b-5p, miR-96-5p, miR-183-5p, and miR-543-5p) among the generated IPA network was selected for validation, interconnected with TP53, BIRC5, and EGFR, revealing to have an altered expression level for prostate cancer; meanwhile no statistically significant altered expression level was observed for AGO2 (Figure 6).
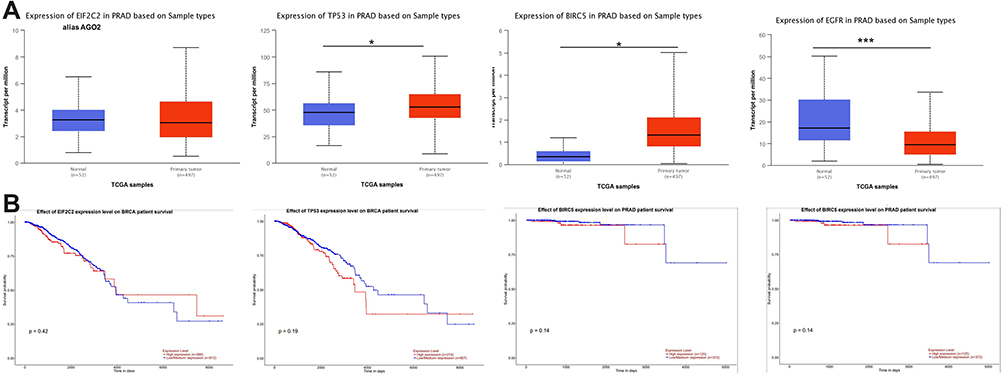 |
Figure 6 Expression level and overall survival of the main genes presented in the miRNA-mRNA network (AGO2, TP53, BIRC, and EGFR), according to TCGA data downloaded from the UALCAN online tool. (A) Expression levels and overall survival graphical representation of AGO2 (or EIF2C2), TP53, BIRC5, and EGFR generated using UALCAN online tool (B) Graphical representation of the overall survival for AGO2, TP53, BIRC5, and EGFR, generated using UALCAN online tool. (B) Overall survival for AGO2, TP53, BIRC5, and EGFR, generated using UALCAN online tool (*p ≤ 0.05, ***p ≤ 0.001). |
miR-20b-5p, miR-96-5p, miR-183-5p and miR-543-5p Involvement in Biological Processes, and Their Target Genes
Identification of the main biological processes and target genes for miR-20b-5p, miR-96-5p, miR-183-5p, and miR-543-5p was done by the use of the DIANA-miRPath v3.0 interface. A heatmap created directly from the DIANA-miRPath v3.0 interface, reveals the main biological pathways targeted by the selected transcripts (Figure 7A). Thus, it has been observed the overlapping of 984 target genes for miR-20b-5p, 827 target genes for miR-96-5p, 772 target genes for miR-183-5p, and 76 target genes for miR-543-5p (Figure 7B). The list of the target genes for the selected transcripts (miR-20b-5p, miR-96-5p, miR-183-5p and miR-543-5p) is presented in Table S3.
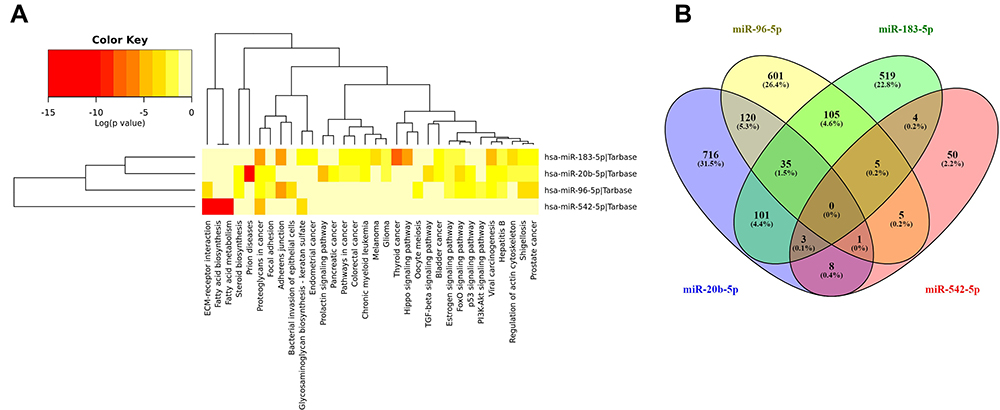 |
Figure 7 (A) Hierarchical cluster and miRNA/KEGG pathways heat map among the selected miRNAs deregulated in PRAD. The map was generated using the Diana tools miRPath v.3 software (B) overlapping of the target genes for miR-20b-5p, miR-96-5p, miR-183-5p, and miR-543-5p. |
miRNA Expression Pattern Considering TP53 Mutation Status in PRAD Based on TCGA Data
Additional investigation of miRNA signature based on TP53 status was done using UALCAN. TP53 is a frequently mutated gene in many cancers, the mutation frequency in PRAD being over 20% (Figure 8A). The expression level for miR-20b and miR-183-5p was not affected by the TP53 mutation status (Figure 8B). In the case of miR-96, the expression level was statistically significant much higher in the case of samples with TP53 mutant versus samples with TP53 wild-type. In the case of miR-542, it was statistically downregulated in the TP53 mutant, while the expression level for the TP53 wild-type group was not modified.
 |
Figure 8 The altered transcriptomic pattern was generated using the online tool UALCAN and considering the TP53 mutation status as a clinical variable in PRAD (based on the TCGA dataset). (A) Overall TP53 gene mutations across various PRAD projects data of cBioPortal. (B) miRNA expression level depending on TP53 mutation status, normal adjacent PRAD tissue (n=50), TP53 mutant PRAD cases (n=52), TP53 wild-type PRAD cases (n=438) (*p ≤ 0.05, ***p≤ 0.001; ****p ≤ 0.0001). |
miRNA Expression Pattern Considering Gleason Score in PRAD Based on TCGA Data
Evaluation of the expression levels of microRNAs associated with the Gleason grading system in PRAD based on TCGA data was done using UALCAN (Figure 9). It was observed an increase of the expression level with the Gleason score (particular for Gleason score 10, n=3), these effects being more pronounced for miR-20b-5p and miR-183-5p, but need to be further validated in higher number of cases considering the only 3 cases in Gleason score 10.
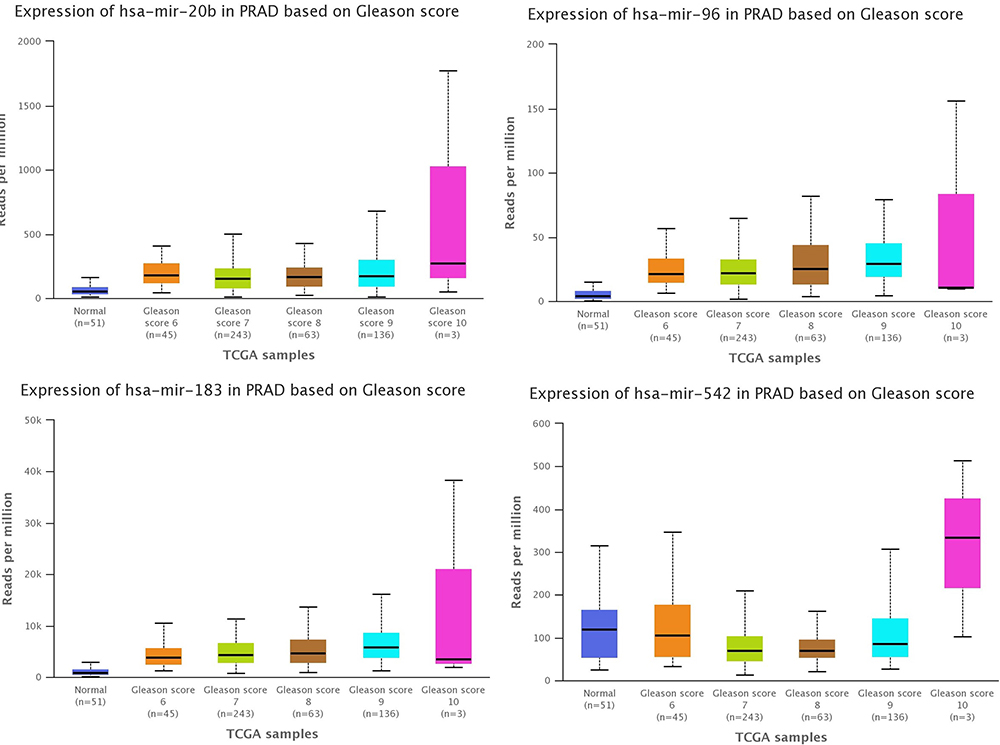 |
Figure 9 The altered transcriptomic pattern was generated using the online tool UALCAN and considering the Gleason score as a clinical variable in PRAD (based on TCGA dataset). |
Discussion
In this study, we evaluated the differentially expressed miRNAs between PRAD tumors and their adjacent normal tissue, using microarray, then we overlapped the date with those from the TCGA. The most relevant transcripts among the common signature were validated by qRT-PCR in both tumor tissue and patients’ plasma. The value of liquid biopsy as an alternative to the extremely invasive tissue biopsy is highly important due to the information relieved in plasma from the tumor. This is particularly important when this can be combined with already implemented non-invasive markers, for higher accuracy diagnostic by combining with circulating miRNA,20,27 particularly for high risk group identification.28 Circulating miRNAs are considered the next-generation clinical biomarker,28 that promote not only the existence of cancer, but also the dynamics, malignant capacity and drug resistance of tumors.29
Our analysis provides an initial framework to address the long-standing issue of co-operative or Functionally inter-related nature of miRNA targets in a practical setting. Particularly, when correlated with databases related to the expression levels survival data of miRNAs and their target gene, it can generate functionally relevant biomarkers or therapeutically viable candidates.
Altered miRNA pattern can be considered a valuable molecular characteristic and can impact clinical trajectories and predictions for enhanced responses to specific therapeutics.30 We found that the altered miRNAs are involved in key biological processes (Table 5), with important clinical significance, as was emphasis by IPA analysis.
We identified several miRNAs that were differentially expressed in our patient cohort and TCGA. Among this signature (12 upregulated and 1 downregulated), it was validated by qRT-PCR three transcripts upregulated (miR-20b-5p, miR-96-5p, and miR-183-5p) and one downregulated (miR-542-5p), interconnected with the TP53 and BIRC5, respectively with EGFR downregulated in PRAD, as shows TCGA data downloaded from UALCAN online tool (Figure 4).
Our approach selects only tissue-specific mRNA targets in prostate cancer, particularly for specific miRNA signatures. As the reduction in target mRNA expression may not constantly be obvious (as we have assumed), our Research may have minimized the overall effect of miRNAs in prostate carcinogenesis or should be related to downstream/upstream genes, particularly those predicting overall survival rate, highlighted with blue square in Figure 6 (TP53, BIRC5, AGO2 and EGFR), that should be further identified as biomarkers for the identification of high-risks prostate cancer groups.
The established miRNA-gene signatures and the identification of miRNA target gene-related to survival have an important role in the elucidation of molecular mechanisms, underpinning dissimilar molecular profiles, sharing interchangeable prognostic capabilities, and additionally, can serve for prospective applications in drug development. The regulation of miRNAs was interlinked with key regulators of Argonaut 2 (AGO2),1 sustained also by present study (Figure 5). miRNA association with AGO2 is regulated by TP53, suggesting a new mechanism of miRNA regulation in carcinogenesis through TP53-mediated regulation of AGO2-miRNA interaction.31,32 A recent study reveals that AGO2 and miR-96 are incorporated into the cytoplasm.33 Also, miR-542-5p targeted AGO2, being considered a possible therapeutic target.34 The additional investigation presents important data related to miR-542-5p that targeted AGO2 and EGFR.35–37
Three of the identified transcripts, miR-182-5p, miR-183-5p, and miR-96-5p, are members of the miR-183-96-182 oncogenic cluster.38,39 MiR-183-5p is proposed as a specific diagnostic biomarker in prostate cancer.40 The well-known prostate tumor suppressor PTEN was demonstrated to be regulated by miR-183-5p and miR-96-5p.38
MiR-96 in prostate cancers is much higher expressed in mutant cases than wild-type p53, as shown UALCAN database. This correlation with TP53 mutation status was observed in the head and neck squamous cell carcinoma.41 MiR-96 is a key regulator of cell-cell adhesion, having the capacity to overexpress E-Cadherin and EpCAM.42 Other studies reveal that this transcript governs androgen signaling and prostate cancer progression,43 and regulation of cell proliferation by targeting FOXO1 and FOXO3a.44 miR-20b was identified as overexpressed in prostate cancer tissues, promoting the regulation of key mechanisms like cellular proliferation, EMT, and migration.45,46 miR-542 is involved in the regulation of EMT and metastasis,47 in our case was downregulated, particularly in TP53 mutated samples. TP53 is positively regulated by these transcripts.48 Also, inhibition of the expression level for miR-542 was related to hypoxic condition49 or regulated DNA repair/Notch pathway.50
Mutations in TP53 are among the most common abnormalities in many cancers,30,51–53 observed in Figure 3 as a core element. miRNAs are altered in tumors, underlining the fact that a possible connection between miRNAs and TP53 could be critical in tumorigenesis, considering that TP53 is a frequently overexpressed and mutated gene in the prostate cancer.54–56 Additional investigation of miRNA interplay should be investigated, particularly for therapeutic application of miRNAs targeting TP53 pathway,57,58 especially for PRAD.
The limitation of the present study is related to the reduced number of cases, this being minimized by the overlapping of TCGA miRNA signature and validation of part of the common signature in an additional patient cohort by qRT-PCR at tissue and plasma level. At the same time, this pilot profiling study provides valuable data related to the complex pathophysiological mechanism that will serve as a basis for further detailed investigations.
Conclusions
Overlapping of two miRNA independent patient cohorts can identify a common signature, that can be further explored for biomarker discovery. Additionally, this common miRNA signature targets key genes related (TP53, BIRC5, EGFR, and AGO2 correlated with overall survival in PRAD) to the key mechanism involved in prostate cancer, where an important element is associated with TP53 signaling and its related miRNAs. Additional investigations in larger sample size is also required to validate the outcomes of this pilot study, and to be able to identify the high risks groups of prostate cancer based on altered miRNA patterns.
Acknowledgments
Vlad Horia Schitcu received an internal grant from the host institution no 7690/101/15.04.2016. Raduly Lajos won a scholarship from the European Social Fund, Human Capital Operational Programme 2014-2021, project no. POCU/380/6/13/125171-ACAMED. Additional this research was partially funded by CNFIS-FDI-2021-0594: “Increasing the research capacity, competitiveness and visibility of UMPh ”Iuliu Hațieganu” by forming and supporting multidisciplinary teams in research excellence”, CNFIS-FDI-2021-0595 “Development and support of the medical entrepreneurial culture among UMF Cluj-Napoca students through dissemination, training and mentoring” and PNCDI III 2015-2020 “Increasing the Performance of Scientific Research, Supporting Excellence in Medical Research and Innovation”, PROGRES, project ID 565/C1.2.PFE-CDI.202”.
Disclosure
The authors declare no conflicts of interest in this work.
References
1. Verma S, Pandey M, Shukla GC, Singh V, Gupta S. Integrated analysis of miRNA landscape and cellular networking pathways in stage-specific prostate cancer. PLoS One. 2019;14(11):e0224071. doi:10.1371/journal.pone.0224071
2. Sung H, Ferlay J, Siegel RL, et al. Global cancer statistics 2020: GLOBOCAN estimates of incidence and mortality worldwide for 36 cancers in 185 countries. CA Cancer J Clin. 2021;71:209–249. doi:10.3322/caac.21660
3. Lin Y, Chen F, Shen L, et al. Biomarker microRNAs for prostate cancer metastasis: screened with a network vulnerability analysis model. J Transl Med. 2018;16(1):134. doi:10.1186/s12967-018-1506-7
4. Salciccia S, Capriotti AL, Laganà A, et al. Biomarkers in prostate cancer diagnosis: from current knowledge to the role of metabolomics and exosomes. Int J Mol Sci. 2021;22(9):4367. doi:10.3390/ijms22094367
5. Chys B, Devos G, Everaerts W, et al. Preoperative risk-stratification of high-risk prostate cancer: a multicenter analysis. original research. Front Oncol. 2020;10(246). doi:10.3389/fonc.2020.00246
6. Pop-Bica C, Gulei D, Cojocneanu-Petric R, Braicu C, Petrut B, Berindan-Neagoe I. Understanding the role of non-coding rnas in bladder cancer: from dark matter to valuable therapeutic targets. Int J Mol Sci. 2017;18(7):1514. doi:10.3390/ijms18071514
7. Braicu C, Raduly L, Morar-Bolba G, et al. Aberrant miRNAs expressed in HER-2 negative breast cancers patient. J Exp Clin Cancer Res. 2018;37(1):257. doi:10.1186/s13046-018-0920-2
8. Braicu C, Gulei D, Raduly L, Harangus A, Rusu A, Berindan-Neagoe I. Altered expression of miR-181 affects cell fate and targets drug resistance-related mechanisms. Mol Aspects Med. 2019;70:90–105. doi:10.1016/j.mam.2019.10.007
9. Braicu C, Cojocneanu-Petric R, Chira S, et al. Clinical and pathological implications of miRNA in bladder cancer. Int J NanoMedicine. 2015;10:791–800. doi:10.2147/IJN.S72904
10. Tomuleasa C, Braicu C, Irimie A, Craciun L, Berindan-Neagoe I. Nanopharmacology in translational hematology and oncology. Int J Nanomedicine. 2014;9:3465–3479. doi:10.2147/ijn.S60488
11. Sonea L, Buse M, Gulei D, et al. Decoding the emerging patterns exhibited in non-coding RNAs characteristic of lung cancer with regard to their clinical significance. Curr Genomics. 2018;19(4):258–278. doi:10.2174/1389202918666171005100124
12. Braicu C, Zimta AA, Harangus A, et al. The function of non-coding RNAs in lung cancer tumorigenesis. Cancers (Basel). 2019;11(5):605. doi:10.3390/cancers11050605
13. Irimie AI, Braicu C, Sonea L, et al. A looking-glass of non-coding RNAs in oral cancer. Int J Mol Sci. 2017;18(12):2620. doi:10.3390/ijms18122620
14. Braicu C, Catana C, Calin GA, Berindan-Neagoe I. NCRNA combined therapy as future treatment option for cancer. Curr Pharm Des. 2014;20(42):6565–6574. doi:10.2174/1381612820666140826153529
15. Condrat CE, Thompson DC, Barbu MG, et al. miRNAs as biomarkers in disease: latest findings regarding their role in diagnosis and prognosis. Cells. 2020;9(2):276. doi:10.3390/cells9020276
16. Braicu C, Buiga R, Cojocneanu R, et al. Connecting the dots between different networks: miRNAs associated with bladder cancer risk and progression. J Exp Clin Cancer Res. 2019;38(1):433. doi:10.1186/s13046-019-1406-6
17. Cojocneanu R, Braicu C, Raduly L, et al. Plasma and tissue specific miRNA expression pattern and functional analysis associated to colorectal cancer patients. Cancers (Basel). 2020;12(4):843. doi:10.3390/cancers12040843
18. Haranguș A, Berindan-Neagoe I, Todea DA, Șimon I, Șimon M. Noncoding RNAs and liquid biopsy in lung cancer: a literature review. Diagnostics (Basel). 2019;9(4). doi:10.3390/diagnostics9040216
19. Lin -B-B, Lei H-Q, Xiong H-Y, et al. MicroRNA-regulated transcriptome analysis identifies four major subtypes with prognostic and therapeutic implications in prostate cancer. Comput Struct Biotechnol J. 2021;19:4941–4953. doi:10.1016/j.csbj.2021.08.046
20. Urabe F, Matsuzaki J, Yamamoto Y, et al. Large-scale circulating microRNA profiling for the liquid biopsy of prostate cancer. Clin Cancer Res. 2019;25(10):3016–3025. doi:10.1158/1078-0432.Ccr-18-2849
21. Koppers-Lalic D, Hackenberg M, de Menezes R, et al. Non‑invasive prostate cancer detection by measuring miRNA variants (isomiRs) in urine extracellular vesicles. Oncotarget. 2016;7(16):22566–22578. doi:10.18632/oncotarget.8124
22. Ruiz-Plazas X, Altuna-Coy A, Alves-Santiago M, et al. Liquid biopsy-based exo-oncomiRNAs can predict prostate cancer aggressiveness. Cancers (Basel). 2021;13(2):250. doi:10.3390/cancers13020250
23. Roberts MJ, Chambers SK. Prostate cancer detection. In: Feingold KR, Anawalt B, Boyce A, et al., editors. Endotext. South Dartmouth (MA):MDText.com, Inc.; 2000. Figure 7, [Estimated age-specific incidence (solid line)…].
24. Koboldt DC, Fulton R, McLellan M, et al.Comprehensive molecular portraits of human breast tumours. Nature. 2012;490(7418):61–70. doi:10.1038/nature11412
25. Chandrashekar DS, Bashel B, Balasubramanya SAH, et al. UALCAN: a portal for facilitating tumor subgroup gene expression and survival analyses. Neoplasia. 2017;19(8):649–658. doi:10.1016/j.neo.2017.05.002
26. Vlachos IS, Zagganas K, Paraskevopoulou MD, et al. DIANA-miRPath v3.0: deciphering microRNA function with experimental support. Nucleic Acids Res. 2015;43(W1):W460–W466. doi:10.1093/nar/gkv403
27. Mello-Grand M, Gregnanin I, Sacchetto L, et al. Circulating microRNAs combined with PSA for accurate and non-invasive prostate cancer detection. Carcinogenesis. 2019;40(2):246–253. doi:10.1093/carcin/bgy167
28. Hoey C, Liu SK. Circulating blood miRNAs for prostate cancer risk stratification: miRroring the underlying tumor biology with liquid biopsies. Res Rep Urol. 2019;11:29–42. doi:10.2147/RRU.S165625
29. Liu H, Li PW, Yang WQ, et al. Identification of non-invasive biomarkers for chronic atrophic gastritis from serum exosomal microRNAs. BMC Cancer. 2019;19(1):129. doi:10.1186/s12885-019-5328-7
30. Nyquist MD, Corella A, Coleman I, et al. Combined TP53 and RB1 loss promotes prostate cancer resistance to a spectrum of therapeutics and confers vulnerability to replication stress. Cell Rep. 2020;31(8):107669. doi:10.1016/j.celrep.2020.107669
31. Krell J, Stebbing J, Carissimi C, et al. TP53 regulates miRNA association with AGO2 to remodel the miRNA-mRNA interaction network. Genome Res. 2016;26(3):331–341. doi:10.1101/gr.191759.115
32. Krell J, Stebbing J, Frampton AE, et al. The role of TP53 in miRNA loading onto AGO2 and in remodelling the miRNA-mRNA interaction network. Lancet. 2015;385(Suppl 1):S15. doi:10.1016/s0140-6736(15)60330-0
33. Voss G, Haflidadóttir BS, Järemo H, et al. Regulation of cell–cell adhesion in prostate cancer cells by microRNA-96 through upregulation of E-Cadherin and EpCAM. Carcinogenesis. 2019;41(7):865–874. doi:10.1093/carcin/bgz191
34. Li Z, Hu C, Zhen Y, Pang B, Yi H, Chen X. Pristimerin inhibits glioma progression by targeting AGO2 and PTPN1 expression via miR-542-5p. Biosci Rep. 2019;39(5):BSR20182389. doi:10.1042/BSR20182389
35. Shu C, Yu X, Cheng S, Jing J, Hu C, Pang B. Pristimerin suppresses trophoblast cell epithelial-mesenchymal transition via miR-542-5p/EGFR axis. Drug Des Devel Ther. 2020;14:4659–4670. doi:10.2147/dddt.S274595
36. Melegh Z, Oltean S. Targeting angiogenesis in prostate cancer. Int J Mol Sci. 2019;20(11):2676. doi:10.3390/ijms20112676
37. Minder P, Zajac E, Quigley JP, Deryugina EI. EGFR regulates the development and microarchitecture of intratumoral angiogenic vasculature capable of sustaining cancer cell intravasation. Neoplasia. 2015;17(8):634–649. doi:10.1016/j.neo.2015.08.002
38. Pudova EA, Krasnov GS, Nyushko KM, et al. miRNAs expression signature potentially associated with lymphatic dissemination in locally advanced prostate cancer. BMC Med Genomics. 2020;13(Suppl 8):129. doi:10.1186/s12920-020-00788-9
39. Mihelich BL, Khramtsova EA, Arva N, et al. miR-183-96-182 cluster is overexpressed in prostate tissue and regulates zinc homeostasis in prostate cells. J Biol Chem. 2011;286(52):44503–44511. doi:10.1074/jbc.M111.262915
40. Waseem M, Ahmad MK, Serajuddin M, Bhaskar V, Sankhwar SN, Mahdi AA. MicroRNA-183-5p: a new potential marker for prostate cancer. Indian J Clin Biochem. 2019;34(2):207–212. doi:10.1007/s12291-017-0731-9
41. Vahabi M, Pulito C, Sacconi A, et al. miR-96-5p targets PTEN expression affecting radio-chemosensitivity of HNSCC cells. J Exp Clin Cancer Res. 2019;38(1):141. doi:10.1186/s13046-019-1119-x
42. Voss G, Haflidadóttir BS, Järemo H, et al. Regulation of cell-cell adhesion in prostate cancer cells by microRNA-96 through upregulation of E-Cadherin and EpCAM. Carcinogenesis. 2020;41(7):865–874. doi:10.1093/carcin/bgz191
43. Long MD, Singh PK, Russell JR, et al. The miR-96 and RARγ signaling axis governs androgen signaling and prostate cancer progression. Oncogene. 2019;38(3):421–444. doi:10.1038/s41388-018-0450-6
44. Bao YH, Wang Y, Liu Y, Wang S, Wu B. MiR-96 expression in prostate cancer and its effect on the target gene regulation. Eur Rev Med Pharmacol Sci. 2017;21(20):4548–4556.
45. Guo J, Xiao Z, Yu X, Cao R. miR-20b promotes cellular proliferation and migration by directly regulating phosphatase and tensin homolog in prostate cancer. Oncol Lett. 2017;14(6):6895–6900. doi:10.3892/ol.2017.7041
46. Qi JC, Yang Z, Zhang YP, et al. miR-20b-5p, TGFBR2, and E2F1 form a regulatory loop to participate in epithelial to mesenchymal transition in prostate cancer. Front Oncol. 2019;9:1535. doi:10.3389/fonc.2019.01535
47. Sun F, Wu K, Yao Z, et al. Long noncoding RNA LINC00963 induces NOP2 expression by sponging tumor suppressor miR-542-3p to promote metastasis in prostate cancer. Aging (Albany NY). 2020;12(12):11500–11516. doi:10.18632/aging.103236
48. Wang Y, Huang JW, Castella M, Huntsman DG, Taniguchi T. p53 is positively regulated by miR-542-3p. Cancer Res. 2014;74(12):3218–3227. doi:10.1158/0008-5472.Can-13-1706
49. Panigrahi GK, Ramteke A, Birks D, et al. Exosomal microRNA profiling to identify hypoxia-related biomarkers in prostate cancer. Oncotarget. 2018;9(17):13894–13910. doi:10.18632/oncotarget.24532
50. Rane JK, Ylipää A, Adamson R, et al. Construction of therapeutically relevant human prostate epithelial fate map by utilising miRNA and mRNA microarray expression data. Br J Cancer. 2015;113(4):611–615. doi:10.1038/bjc.2015.262
51. Kluth M, Harasimowicz S, Burkhardt L, et al. Clinical significance of different types of p53 gene alteration in surgically treated prostate cancer. Int J Cancer. 2014;135(6):1369–1380. doi:10.1002/ijc.28784
52. Sirohi D, Devine P, Grenert JP, van Ziffle J, Simko JP, Stohr BA. TP53 structural variants in metastatic prostatic carcinoma. PLoS One. 2019;14(6):e0218618. doi:10.1371/journal.pone.0218618
53. Braicu C, Pileczki V, Irimie A, Berindan-Neagoe I. p53siRNA therapy reduces cell proliferation, migration and induces apoptosis in triple negative breast cancer cells. Mol Cell Biochem. 2013;381(1–2):61–68. doi:10.1007/s11010-013-1688-5
54. Al Zoubi MS, Otoum R, Alorjani MS, et al. TP53, SPOP and PIK3CA genes status in prostate cancer. Asian Pac J Cancer Prev. 2020;21(11):3365–3371. doi:10.31557/apjcp.2020.21.11.3365
55. Zhao Y, Ding L, Wang D, et al. EZH2 cooperates with gain-of-function p53 mutants to promote cancer growth and metastasis. EMBO J. 2019;38(5). doi:10.15252/embj.201899599
56. Blee AM, He Y, Yang Y, et al. TMPRSS2-ERG controls luminal epithelial lineage and antiandrogen sensitivity in PTEN and TP53-mutated prostate cancer. Clin Cancer Res. 2018;24(18):4551–4565. doi:10.1158/1078-0432.Ccr-18-0653
57. Abdi J, Rastgoo N, Li L, Chen W, Chang H. Role of tumor suppressor p53 and micro-RNA interplay in multiple myeloma pathogenesis. J Hematol Oncol. 2017;10(1):169. doi:10.1186/s13045-017-0538-4
58. Jones M, Lal A. MicroRNAs, wild-type and mutant p53: more questions than answers. RNA Biol. 2012;9(6):781–791. doi:10.4161/rna.20146
 © 2022 The Author(s). This work is published and licensed by Dove Medical Press Limited. The
full terms of this license are available at https://www.dovepress.com/terms
and incorporate the Creative Commons Attribution
- Non Commercial (unported, 3.0) License.
By accessing the work you hereby accept the Terms. Non-commercial uses of the work are permitted
without any further permission from Dove Medical Press Limited, provided the work is properly
attributed. For permission for commercial use of this work, please see paragraphs 4.2 and 5 of our Terms.
© 2022 The Author(s). This work is published and licensed by Dove Medical Press Limited. The
full terms of this license are available at https://www.dovepress.com/terms
and incorporate the Creative Commons Attribution
- Non Commercial (unported, 3.0) License.
By accessing the work you hereby accept the Terms. Non-commercial uses of the work are permitted
without any further permission from Dove Medical Press Limited, provided the work is properly
attributed. For permission for commercial use of this work, please see paragraphs 4.2 and 5 of our Terms.