Back to Journals » OncoTargets and Therapy » Volume 12
MicroRNA-559 plays an inhibitory role in the malignant progression of glioblastoma cells by directly targeting metadherin
Authors Yang F, Zhang C, Xu C, Fu F, Han D, Li H
Received 21 January 2019
Accepted for publication 18 March 2019
Published 5 June 2019 Volume 2019:12 Pages 4415—4426
DOI https://doi.org/10.2147/OTT.S202309
Checked for plagiarism Yes
Review by Single anonymous peer review
Peer reviewer comments 2
Editor who approved publication: Dr Sanjay Singh
This paper has been retracted.
Fan Yang, 1 Chuangang Zhang, 2 Congbin Xu, 3 Fangyou Fu, 1 Dong Han, 1 Hongliang Li 4
1Department of Neurosurgery; 2Department of Oncology; 3Department of Radiology, The Third People’s Hospital of Linyi, Linyi, Shandong 276023, People’s Republic of China; 4Department of Emergency, The People’s Hospital of Linyi East Medical District, Linyi, Shandong 276000, People’s Republic of China
Purpose: Several microRNAs (miRNAs) that are aberrantly expressed in glioblastoma multiforme (GBM) play a significant role in GBM formation and progression. The expression profile and functions of miR-559 in GBM remain unclear. Here, we quantified the expression and investigated the involvement of miR-559 in the oncogenicity of GBM cells in vitro and in vivo.
Material and methods: Reverse-transcription quantitative polymerase chain reaction (RT-qPCR) was carried out to determine miR-559 expression in GBM tissues and cell lines. A series of functional assays was performed to evaluate the effects of miR-559 overexpression on GBM cell proliferation, apoptosis, migration, and invasion in vitro and on GBM tumor growth in vivo. The regulatory mechanisms of miR-559 action in GBM cells were then explored.
Results: The expression of miR‑559 was lower in GBM tissues and cell lines and significantly correlated with the Karnofsky performance score and tumor size among patients with GBM. Exogenous miR‑559 expression inhibited GBM cell proliferation, migration, and invasion and promoted apoptosis. MiR-559 overexpression decreased tumor growth in vivo. Mechanistic experiments confirmed metadherin (MTDH) as a direct target gene of miR-559 in GBM. Silencing of MTDH induced effects similar to those of miR-559 upregulation in GBM cells, whereas MTDH expression restoration attenuated the antitumor effects of miR‑559 in GBM cells. Protein kinase B (AKT) in the phosphatase and tensin homolog (PTEN)–AKT signaling pathway was found to be deactivated in GBM cells after upregulation of miR-559 both in vitro and in vivo.
Conclusion: MiR-559 acts as a tumor suppressor in GBM cells in vitro and in vivo, at least in part through the downregulation of MTDH and inhibition of AKT in the PTEN–AKT pathway. Therefore, targeting the miR-559–MTDH axis may be a promising therapeutic strategy for patients with GBM.
Keywords: microRNA-559, glioblastoma, oncogenicity, metadherin, target therapy
Introduction
Glioma is the most common type of malignant primary brain tumor in adults1 and can be categorized into four histopathological grades, namely, World Health Organization grades I‒IV,2 based on its malignant nature. Glioblastoma multiforme (GBM), a World Health Organization grade IV glioma, is the most common and aggressive histological subtype of glioma.3 The characteristics of GBM include rapid invasive growth, diffused infiltration, strong angiogenesis, and extensive genomic instability.4 At present, the primary therapeutic methods for patients with GBM include surgical resection, radiotherapy, and chemotherapy.5 Despite tremendous progress in the techniques for GBM diagnosis and therapy, the clinical outcomes of patients with GBM remain dissatisfactory, and the median survival time is less than 20 months after diagnosis.6 Therefore, elucidation of the molecular mechanisms underlying the initiation and progression of GBM may provide the theoretical basis for identification of effective therapeutic methods.
MicroRNAs (miRNAs) are a group of highly conserved single-stranded noncoding RNA molecules that are 17–24 nucleotides long.7 MiRNAs are implicated in gene regulation through the recognition and preferential binding to the 3′ untranslated region (3′-UTRs) of their target mRNA(s), resulting in target mRNA cleavage or translation inhibition.8 MiRNA are frequently located in the genomic regions involved in cancer, indicating the critical role of miRNAs in carcinogenesis including cancer progression.9 MiRNAs are dysregulated in most of human cancers, including GBM,10 gastric cancer,11 osteosarcoma,12 tongue squamous cell carcinoma,13 and breast cancer.14 Some miRNAs are aberrantly expressed in GBM, including miR-143,15 miR-204,16 miR-574,17 and miR-744.18 Several lines of evidence have revealed that the aberrant expression of miRNAs contributes to GBM initiation and progression through the regulation of aggressive cellular behavior.19–21 Thus, miRNAs are potential diagnostic and prognostic biomarkers and may serve as therapeutic targets in GBM.
The expression profile and functional characteristics of miR-559 in GBM remain unclear. Here, we quantified the expression of miR-559 and investigated its role in the oncogenicity of GBM cells in vitro and in vivo. The molecular mechanisms underlying the antitumor actions of miR-559 in GBM cells were explored in detail. We demonstrate the inhibitory effects of miR-559 on the aggressive behavior of GBM in vitro and in vivo; this miRNA directly targets metadherin (MTDH) mRNA and inactivates protein kinase B (AKT) in the phosphatase and tensin homolog (PTEN)–AKT pathway.
Materials and methods
Patient samples
Forty-nine pairs of GBM samples and adjacent normal brain tissue samples were collected from the patients with GBM admitted to The Third People’s Hospital of Linyi between June 2015 and November 2017. None of the enrolled patients received chemotherapy or radiotherapy prior to surgical resection. After the operation, all tissue samples were immediately frozen in liquid nitrogen and stored at −80 °C for RNA or protein isolation. The study protocol was approved by the ethics committee of The Third People’s Hospital of Linyi and was conducted in accordance with the Declaration of Helsinki. Signed informed consent was provided by all the study participants.
Cell lines
Four GBM cell lines, U138, U251, LN229, and T98, were purchased from the Shanghai Institutes for Biological Sciences, Chinese Academy of Sciences (Shanghai, China). The cells were cultured in Dulbecco’s modified Eagle’s medium (DMEM) supplemented with 10% of heat-inactivated fetal bovine serum (FBS), 100 U/mL penicillin, and 100 μg/mL streptomycin (all from Gibco; Thermo Fisher Scientific, Waltham, MA, USA). Normal human astrocytes (NHAs) were acquired from ScienCell Research Laboratories (Carlsbad, CA, USA) and maintained in the astrocyte medium (ScienCell Research Laboratories) containing 10% of FBS. All the cell lines were cultured at 37 °C in a humidified atmosphere containing 5% of CO2.
Oligonucleotides, plasmids, and transfection
MiR-559 mimics and miRNA negative control mimics (miR-NC) were purchased from Guangzhou RiboBio Co., Ltd., (Guangzhou, China). Small-interfering RNA (siRNA) against MTDH (si-MTDH) and noncoding control siRNA (si-ctrl) were chemically synthesized by GenePharma (Shanghai, China). Upregulation of MTDH was achieved using the MTDH overexpression plasmid pcDNA3.1-MTDH (pc-MTDH; Chinese Academy of Sciences; Changchun, China). The empty pcDNA3.1 plasmid served as a control. For transfection, cells were seeded in six-well plates and cultured until 60–80% confluence. The cells were transfected with oligonucleotides or plasmids by means of Lipofectamine 2000 (Invitrogen; Thermo Fisher Scientific). Transfected cells were harvested 24, 48, or 72 h post-transfection for further experiments.
Reverse-transcription quantitative polymerase chain reaction (RT-qPCR) analysis
Total RNA was extracted with the TRIzol Reagent (Thermo Fisher Scientific). The One Step SYBR® PrimeScript™ miRNA RT-PCR kit (Takara Biotechnology Co., Ltd., Dalian, China) was utilized for the quantification of miR-559 expression. For the detection of MTDH mRNA expression, the complementary DNA (cDNA) was prepared from total RNA using the Prime-Script RT Reagent Kit (Takara Biotechnology Co., Ltd.). qPCR was carried out via the SYBR Premix Ex Taq™ Kit (Takara Biotechnology Co., Ltd.). U6 small nuclear RNA and glyceraldehyde-3-phosphate dehydrogenase (GAPDH) mRNA served as endogenous controls for miR-559 and MTDH, respectively. All the reactions were conducted on an ABI 7500 system (Applied Biosystems; Thermo Fisher Scientific), and the data were analyzed by the 2−ΔΔCq method.22
Cell counting kit-8 (CCK-8) assay
Cellular proliferation was evaluated by the CCK-8 assay. In particular, transfected cells were seeded in 96-well plates at a density of 2.0×10³ cells/well. The cells were cultured at 37 °C and 5% CO2. The CCK-8 assay was performed at four time points (0, 24, 48, and 72 h) after seeding. At the indicated time points, 10 µL of the CCK8 solution (Dojindo, Kumamoto, Japan) was added into each well, followed by which cells were incubated at 37 °C for an additional 2 h. Absorbance was read at the 450 nm wavelength on a microtiter plate reader (Bio-Tek Instruments, Winooski, VT, USA).
Flow-cytometric analysis
Apoptosis was quantitated using the Annexin-V/fluorescein isothiocyanate (FITC) Apoptosis Detection Kit (BioLegend, San Diego, CA, USA). Transfected cells were harvested by means of 0.5% trypsin and washed with ice-cold phosphate-buffered saline (PBS; Gibco; Thermo Fisher Scientific). The cells were resuspended in 100 µL of binding buffer, followed by double staining with 5 µL of the annexin V–FITC conjugate and 5 µL of the propidium iodide solution. After 15 min incubation in the dark, the apoptosis rate was measured on a flow cytometer (FACScan™; BD Biosciences, Franklin Lakes, NJ, USA). All assays were performed in triplicate and repeated at least thrice.
In vitro migration and invasion assays
A total of 200 μL of a cell suspension containing 5×10⁴ cells in FBS-free DMEM was seeded in the upper chamber of Transwell membrane inserts with 8 µm pore size (BD Biosciences). Approximately 500 μL of DMEM supplemented with 10% of FBS was placed into the lower chambers. The filter membranes precoated with Matrigel (BD Biosciences) were employed for the in vitro invasion assay, whereas the in vitro migration assay was carried out with filter membranes not coated with Matrigel. After 24 h incubation, a cotton swab was used to gently remove the cells remaining on the upper side of the membrane surface. The cells that passed through membranes were fixed with 4% formaldehyde and stained with a 0.5% crystal violet solution. The numbers of migrated and invaded cells were determined in five randomly chosen visual fields under an Olympus inverted light microscope (×200 magnification; Olympus Corporation, Tokyo, Japan).
An in vivo xenograft model
Four-week-old BALB/c nude mice were purchased from Shanghai Laboratory Animal Experimental Animal Center of the Chinese Academy of Sciences (Shanghai, China). MiR-559 mimic–transfected or miR-NC–transfected cells were subcutaneously injected into the flanks of the nude mice. A total of eight nude mice were used in this experiment and subdivided into two groups (n=4 for each group). One group was injected with miR-559 mimic–transfected cells, whereas miR-NC–transfected cells were injected in the other group. Once tumor xenografts became visible, their width (W) and length (L) were measured with a Vernier caliper every 7 days. The volume of tumor xenografts was calculated according to the formula volume =0.5× (L × W2). All nude mice were euthanized via fracture dislocation of the cervical spine, and the tumor xenografts were resected for total-RNA and total-protein isolation. The animal experimental procedures were approved by the Ethics Committee of The Third People’s Hospital of Linyi. The animal experiments were conducted in accordance with the Declaration of Helsinki and the guidelines of The Third People’s Hospital of Linyi.
Bioinformatic analysis and a luciferase reporter assay
Three well-established miRNA target prediction and functional study databases, TargetScan (
The 3′-UTR fragment of human MTDH containing the predicted wild-type (wt) miR-559–binding site or its mutated (mut) version was amplified by Guangzhou RiboBio Co., Ltd., and cloned into the psiCHECK-2 vector (Promega Corporation, Madison, WI, USA). Cells were seeded in 24-well plates at a density 105 cells/well. The generated luciferase plasmids were cotransfected with miR-559 mimics or miR-NC into the cells using Lipofectamine 2000. After 48 h, the transfected cells were harvested and subjected to detection of luciferase activities via a Dual-Luciferase Reporter assay system (Promega Corporation). Renilla luciferase activity was normalized to that of firefly luciferase activity.
Protein isolation and western blotting
Total protein was isolated from tissue samples, cells, or tumor xenografts using radioimmunoprecipitation assay (RIPA) Lysis and Extraction Buffer (Beijing Solarbio Science & Technology Co., Ltd., Beijing, China). Proteins were denatured, separated by sodium dodecyl sulfate polyacrylamide gel electrophoresis in a 10% gel, and transferred onto polyvinylidene fluoride membranes. After blockage with 5% fat-free dried milk diluted in Tris-buffered saline (TBS) containing 0.1% of Tween 20 for 2 h, the membranes were incubated overnight at 4 °C with the following primary antibodies: anti-MTDH (cat. # ab126785; dilution 1:500; Abcam, Cambridge, MA, USA), anti-PTEN (ab32072; 1:500; Abcam), anti-phospho- (p-)AKT (ab181616; 1:500; Abcam), anti-AKT (ab15580; 1:500; Abcam), and anti-GAPDH (ab8227; 1:500; Abcam). A horseradish peroxidase–conjugated secondary antibody (dilution 1:3,000; cat. # 7075S, Cell Signaling Technology, Inc., Danvers, MA, USA) was incubated with the membranes at room temperature for 2 h. The Enhanced Chemiluminescence (ECL) Western Blotting Kit (Pierce Biotechnology Inc., Rockford, IL, USA) was employed for visualization of the protein signals.
Statistical analysis
Each assay was repeated at least thrice, and the results were presented as the mean ± standard deviation. The χ2 test was carried out to assess the association between miR-559 expression and clinical parameters in patients with GBM. Student’s t-test was conducted to assess a difference between two groups. Statistical significance of differences among at least three groups was evaluated by one-way analysis of variance followed by Tukey’s post hoc test. Correlation between miR-559 and MTDH expression in GBM tissue samples was assessed by Spearman’s correlation analysis. All statistical calculations were performed in the SPSS software (version 18.0; SPSS, Inc., Chicago, IL, USA). A P-value <0.05 indicated a significant difference.
Results
MiR-559 expression is low in GBM tissues and cell lines
To determine the expression profile of miR-559 in GBM, we detected its expression in four GBM cell lines: U138, U251, LN229, and T98. NHAs served as a control. The data obtained from RT-qPCR analysis showed that the expression of miR-559 (varied levels) was lower in all four GBM cell lines than in NHAs (Figure 1A, P<0.05). Consistent with this result, miR-559 expression was found to be downregulated in GBM tissues as compared with the adjacent normal brain tissues (Figure 1B, P<0.05).
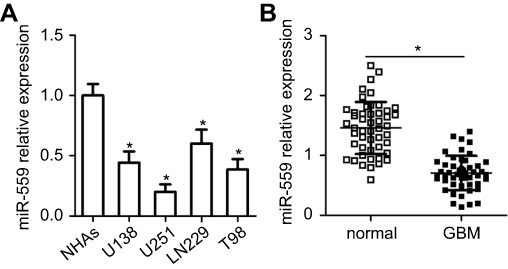 | Figure 1 MiR-559 expression is low in GBM tissues and cell lines. (A) The expression of miR-559 in four GBM cell lines (U138, U251, LN229, and T98) and in NHAs was measured by RT-qPCR. *P<0.05 as compared with NHAs. (B) The expression of miR-559 in 49 pairs of GBM samples and adjacent normal brain tissues was assessed by RT-qPCR. *P<0.05 as compared with normal brain tissue samples.Abbreviation: miR-559, microRNA-559; GBM, glioblastoma; RT-qPCR, reverse-transcription quantitative polymerase chain reaction |
To test whether the miR-559 downregulation is related to GBM progression, 49 patients with GBM were subdivided into two groups, namely, the miR-559 low-expression group and miR-559 high-expression group, based on the median value of miR-559 expression among the GBM tissue samples. Spearman’s analysis revealed a correlation of low miR-559 expression with the Karnofsky performance score (P=0.032) and with tumor size (P=0.004) among the patients with GBM (Table 1). These results suggested that miR-559 expression is low in GBM, resulting in GBM progression.
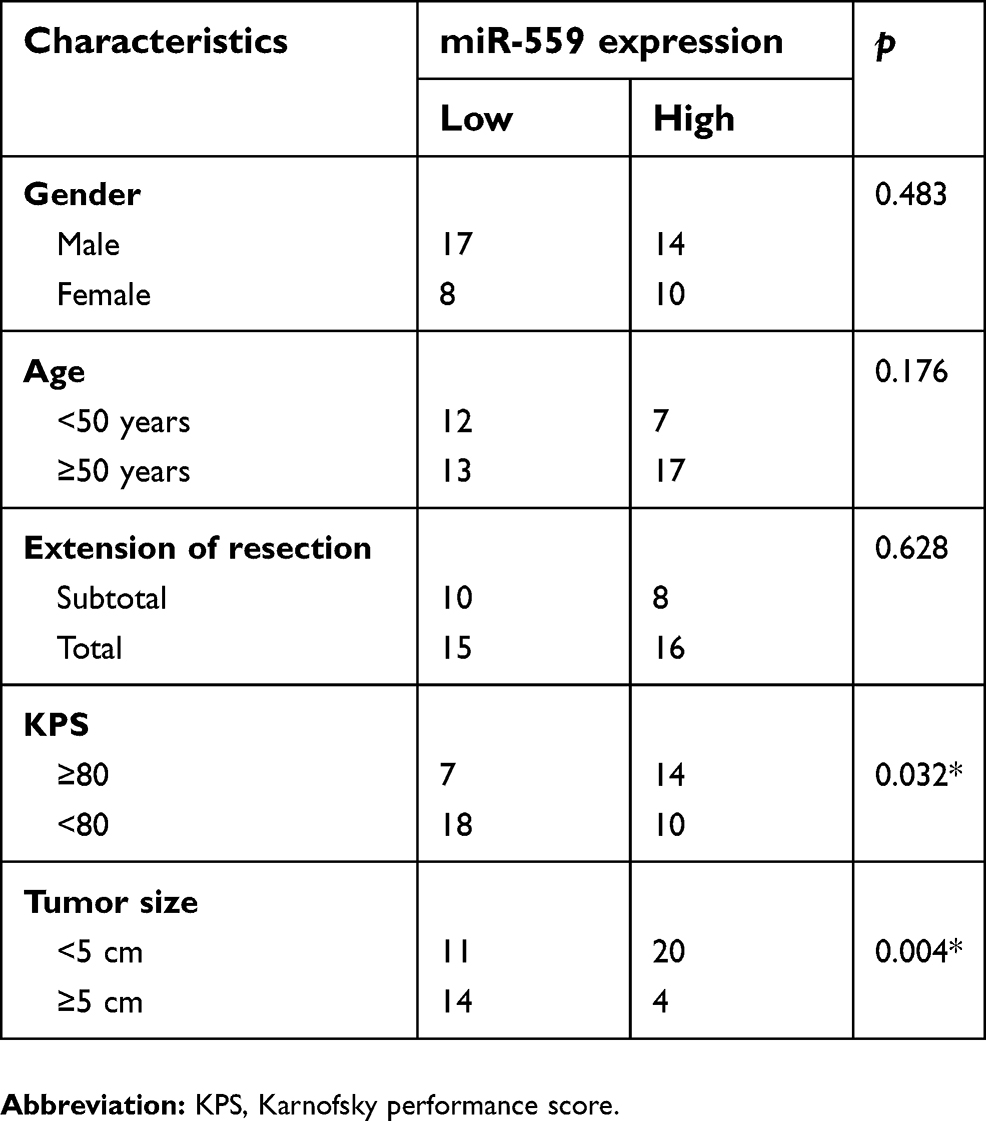 | Table 1 Correlation of miR-559 expression with GBM clinicopathological characteristics |
MiR-559 upregulation inhibits GBM cell proliferation, migration, and invasion and promotes apoptosis in vitro
Cell lines U251 and T98 showed the lowest expression of miR-559 among the four tested GBM cell lines; therefore, these two GBM cell lines were selected for the subsequent experiments. To examine the role of miR-559 in GBM cells, miR-559 mimics were transfected into U251 and T98 cells; miR-NC served as a control. RT-qPCR analysis confirmed that miR-559 was overexpressed in U251 and T98 cells transfected with miR-559 mimics (Figure 2A, P<0.05). The CCK-8 assay was performed to determine the effect of miR-559 expression in GBM cells. Upregulation of miR-559 significantly decreased the proliferative ability of U251 and T98 cells as compared with the cells expressing miR-NC (Figure 2B, P< 0.05). Because the suppression of cell proliferation is often linked with apoptosis, we determined whether miR-559 overexpression affects the apoptosis of GBM cells. The results of flow-cytometric analysis revealed that the transfection of miR-559 mimics into U251 and T98 cells increased apoptosis as compared with miR-NC transfection (Figure 2C, P< 0.05). Furthermore, in vitro migration and invasion assays were conducted to determine the participation of miR-559 in the metastasis of GBM cells. The ectopic miR-559 expression noticeably decreased the migration (Figure 2D, P<0.05) and invasion (Figure 2E, P<0.05) abilities of U251 and T98 cells. Therefore, miR-559 can inhibit the growth and metastasis of GBM cells in vitro.
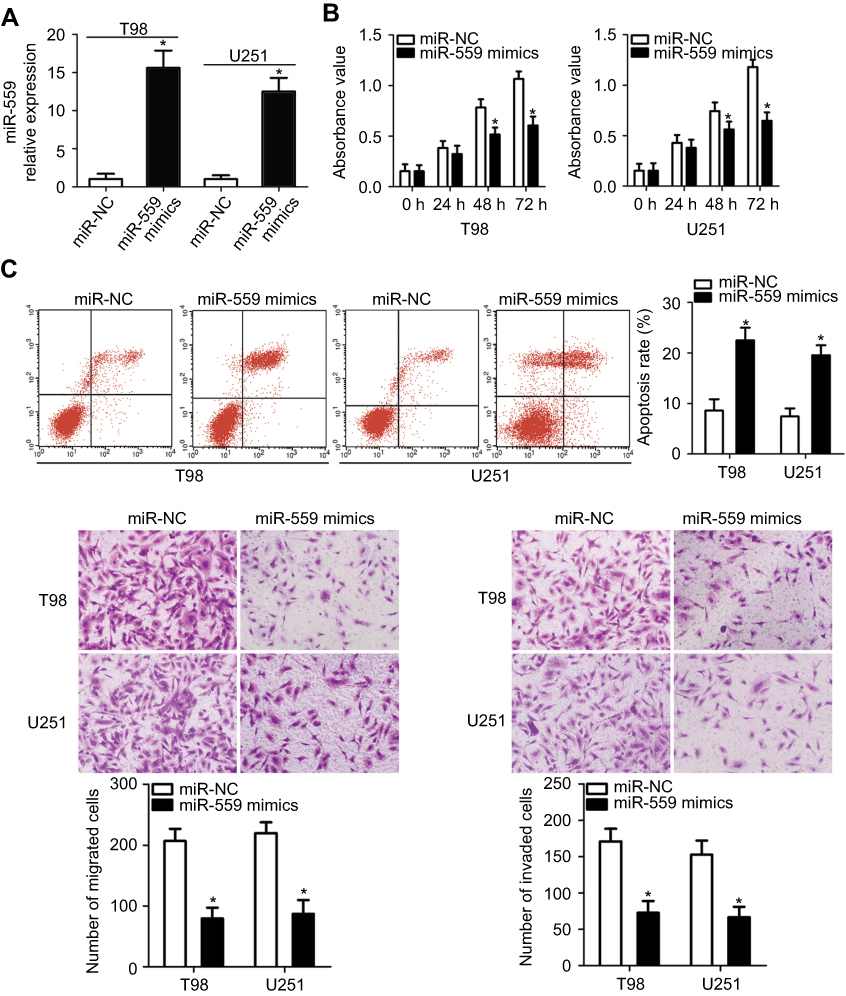 | Figure 2 Exogenous miR-559 expression inhibits proliferation, migration, and invasiveness and promotes apoptosis of U251 and T98 cells. (A) RT-qPCR was carried out to measure miR-559 expression in U251 and T98 cells after transfection of miR-559 mimics or miR-NC. *P<0.05 as compared with group miR-NC. (B) U251 and T98 cells were transfected with miR-559 mimics or miR-NC. The transfected cells were subjected to the CCK-8 assay to evaluate cellular proliferation at every time point. *P<0.05 as compared with group miR-NC. (C) Flow-cytometric analysis was conducted to quantitate the apoptosis of U251 and T98 cells that were transfected with miR-559 mimics or miR-NC. The Annexin-V/fluorescein isothiocyanate (FITC) Apoptosis Detection Kit (BioLegend) was used in the flow-cytometric analysis. *P<0.05 as compared with group miR-NC. (D, E) The effects of miR-559 upregulation on U251 and T98 cell migration and invasion were evaluated by in vitro migration and invasion assays (×200 magnification). *P<0.05 as compared with group miR-NC.Abbreviation: miR-559, microRNA-559; RT-qPCR, reverse-transcription quantitative polymerase chain reaction; miR-NC, miRNA negative control mimics; CCK-8, Cell counting kit-8 (CCK-8) assay. |
MTDH mRNA is a direct target of miR-559, and MTDH expression inversely correlates with mir-559 levels in clinical GBM samples
To reveal the mechanisms underlying miR-559–mediated inhibition of the malignant progression of GBM, we performed bioinformatic analysis and identified putative miR-559 targets. MTDH, a well-known oncogene, contains a 3′-UTR sequence complementary to the seed sequences of miR-559 (Figure 3A). To verify this prediction, the luciferase reporter assay was conducted to evaluate the possibility of the direct binding of miR-559 to the 3′-UTR of MTDH mRNA. As expected, miR-559 overexpression substantially decreased the luciferase activity of the plasmid containing wild-type MTDH 3′-UTR in both U251 and T98 cells (P<0.05); however, the luciferase activity of the plasmid harboring the mutated MTDH 3′-UTR was barely affected (Figure 3B).
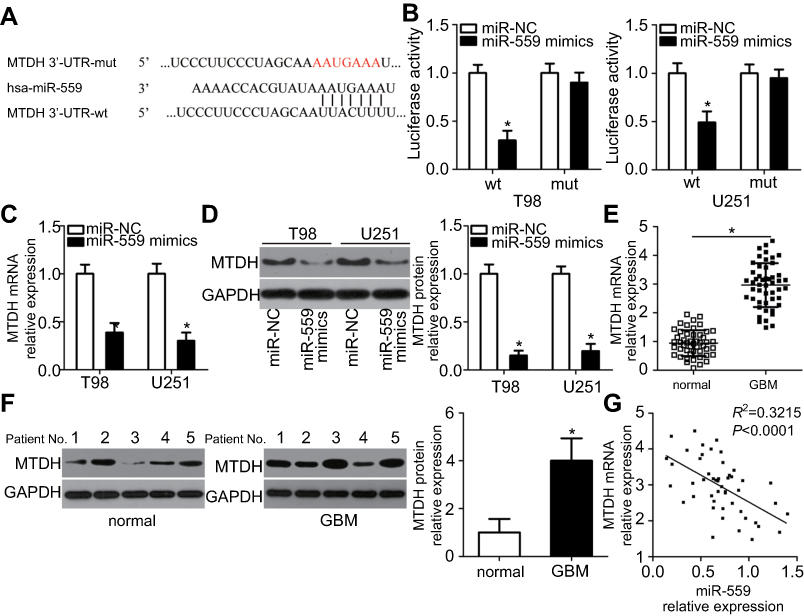 | Figure 3 MTDH is a direct target gene of miR-559 in GBM cells. (A) Illustration of the wild-type and mutated binding sites of miR-559 in the 3′-UTR of MTDH mRNA. (B) A luciferase reporter assay was conducted to detect the luciferase activity in U251 and T98 cells that were cotransfected with miR-559 mimics or miR-NC and either the wild-type or mutated luciferase reporter plasmid. *P<0.05 as compared with group miR-NC. (C, D) Expression levels of MTDH mRNA and protein in miR-559–overexpressing U251 and T98 cells were detected by RT-qPCR and western blotting, respectively. *P<0.05 as compared with group miR-NC. (E, F) The expression levels of MTDH mRNA and protein were analyzed in GBM samples and adjacent normal brain tissues through RT-qPCR and western blotting, respectively. *P<0.05 as compared with normal brain tissue samples. (G) Spearman’s correlation analysis of miR-559 and MTDH mRNA levels in human GBM specimens. R2=0.3215, P<0.0001.Abbreviation: miR-559, microRNA-559; RT-qPCR, reverse-transcription quantitative polymerase chain reaction; miR-NC, miRNA negative control mimics. |
To test whether miR-559 modulates MTDH expression, we quantified MTDH mRNA and protein expression in U251 and T98 cells after transfection with miR-559 mimics or miR-NC. As evidenced by RT-qPCR and western blot analyses, MTDH expression in U251 and T98 cells dramatically decreased at both mRNA (Figure 3C, P<0.05) and protein levels (Figure 3D, P<0.05) in response to the upregulation of miR-559. To further clarify the relation between miR-559 and MTDH expression, we measured MTDH expression in GBM samples and adjacent normal brain tissue samples by RT-qPCR. The levels of MTDH mRNA (Figure 3E, P<0.05) and protein (Figure 3F, P<0.05) were higher in GBM samples than in the adjacent normal brain tissue samples. Spearman’s analysis confirmed the negative correlation between miR-559 and MTDH mRNA levels in GBM tissue samples (Figure 3G; R2=0.3215, P<0.0001.). Therefore, these results indicate that MTDH mRNA serves as a direct target of miR-559 in GBM.
Silencing of MTDH expression elicits effects similar to those of miR-559 mimics in GBM cells
After identifying MTDH mRNA as a direct target of miR-559 in GBM cells, we determined whether MTDH acts as a downstream effecter of miR-559. MTDH was knocked down in U251 and T98 cells through the transfection of si-MTDH (Figure 4A, P<0.05). The effects of MTDH downregulation on cellular proliferation and apoptosis were investigated in U251 and T98 cells by the CCK-8 assay and flow-cytometric analysis. Inhibition of MTDH expression suppressed the proliferation (Figure 4B, P<0.05) and increased the apoptosis (Figure 4C, P<0.05) of U251 and T98 cells. In vitro migration and invasion assays indicated a decrease in the migratory (Figure 4D, P<0.05) and invasive abilities of U251 and T98 cells (Figure 4E, P<0.05) after the MTDH knockdown as compared with the control cells.
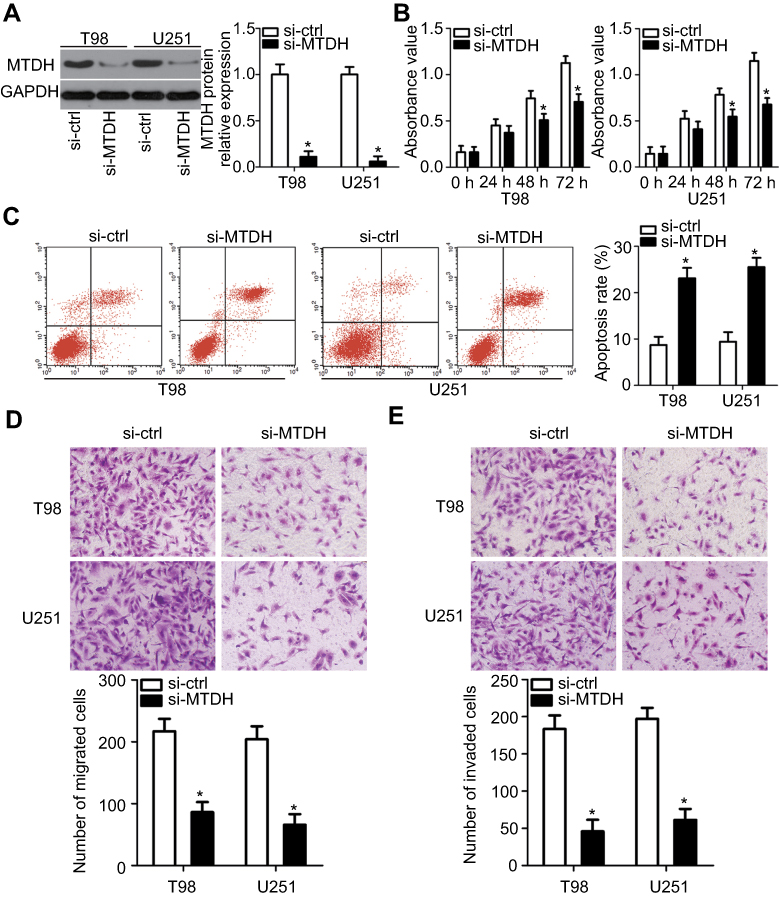 | Figure 4 The MTDH knockdown in U251 and T98 cells has effects similar to those observed with miR-559 overexpression. U251 and T98 cells were transfected with si-MTDH or si-ctrl and were studied in the following experiments: (A) After 72 h of transfection, western blot analysis was carried out to assess MTDH protein expression. *P<0.05 as compared with group si-ctrl. (B, C) The proliferation and apoptosis of U251 and T98 cells after the MTDH knockdown were determined with the CCK-8 assay and flow-cytometric analysis. *P<0.05 as compared with group si-ctrl. (D, E) In vitro migration and invasion assays were performed to evaluate the migratory and invasive abilities of U251 and T98 cells after transfection with si-MTDH or si-ctrl (×200 magnification). *P<0.05 as compared with group si-ctrl. |
MTDH expression restoration reverses the miR-559–induced tumor-suppressive effects on GBM cell behavior
Rescue experiments were conducted to test whether the effects of miR-559 overexpression on GBM cell behavior were mediated by the downregulation of MTDH. Because MTDH was found to be downregulated in U251 and T98 cells transfected with miR-559 mimics, we restored MTDH expression in miR-559–overexpressing cells through the transfection of pcDNA3.1-MTDH (Figure 5A, P<0.05), and a series of functional experiments was carried out. The CCK-8 assay indicated that the restoration of MTDH expression attenuated the suppressive effects of miR-559 on U251 and T98 cell proliferation (Figure 5B, P<0.05). In agreement with these results, MTDH expression restoration reduced the effects of miR-559 overexpression on apoptosis (Figure 5C, P<0.05), migration (Figure 5D, P<0.05), and invasiveness (Figure 5E, P<0.05) of U251 and T98 cells. Taken together, these observations suggested that MTDH acts as a downstream mediator of miR-559 in the regulation of GBM cell behavior.
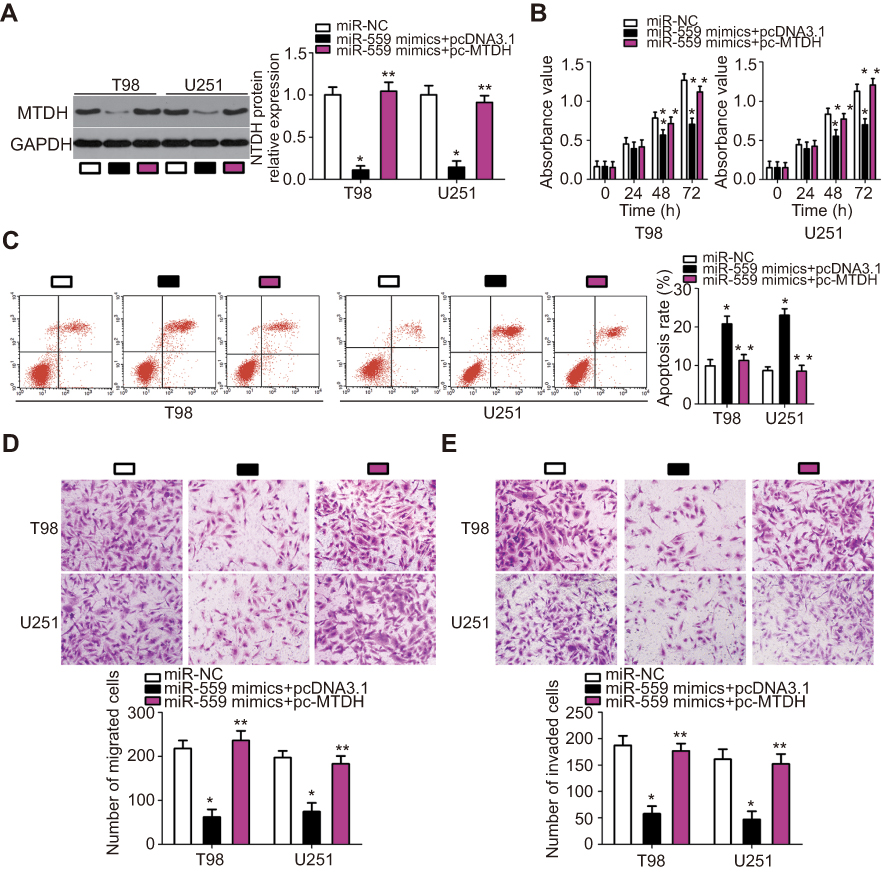 | Figure 5 MTDH reintroduction reverses the antitumor effects of miR-559 in GBM cells. Rescue experiments were carried out by introducing pcDNA3.1-MTDH or pcDNA3.1 along with miR-559 mimics into U251 and T98 cells. (A) The protein level of MTDH in these cells was measured by western blotting. *P<0.05 as compared with group miR-NC. **P<0.05 in comparison with group miR-559 mimics+pcDNA3.1. (B–E) The proliferation, apoptosis, migration, and invasiveness of the aforementioned cells were investigated via the CCK-8 assay, flow cytometry, and in vitro migration and invasion assays (×200 magnification), respectively. *P<0.05 as compared with group miR-NC. **P<0.05 relative to group miR-559 mimics+pcDNA3.1.Abbreviation: miR-559, microRNA-559; miR-NC, miRNA negative control mimics; CCK-8, Cell counting kit-8 (CCK-8) assay |
MiR-559 inhibits AKT in the PTEN–AKT pathway in GBM cells
Some studies have uncovered the involvement of MTDH in the regulation of the PTEN–AKT signaling pathway.23,24 We determined whether miR-559 inhibits the output of the PTEN–AKT pathway in GBM cells. MiR-559 mimics and pcDNA3.1 or pcDNA3.1-MTDH were introduced into U251 and T98 cells, and western blot analysis was performed to measure MTDH, p-AKT, and AKT protein amounts. In comparison with the cells transfected with miR-NC, those transfected with miR-559 mimics contained larger PTEN and lower p-AKT protein amounts (Figure 6). The restored MTDH expression attenuated the change in PTEN and p-AKT amounts induced by miR-559 overexpression (Figure 6). These results suggested that miR-559 deactivates AKT in the PTEN–AKT signaling pathway in GBM cells via the negative regulation of MTDH expression.
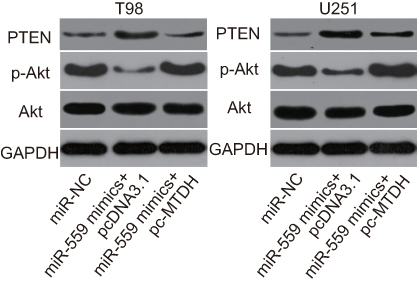 | Figure 6 MiR-559 targets (and downregulates) MTDH to inactivate the MTDH–PTEN–AKT pathway in U251 and T98 cells. MiR-559 mimics along with pcDNA3.1-MTDH or pcDNA3.1 were introduced into U251 and T98 cells. After 72 h, western blotting was conducted to assess PTEN, p-AKT, and AKT protein levels.Abbreviation: miR-559, microRNA-559; |
Overexpression of mir-559 hinders tumor growth in vivo via inhibition of the MTDH–PTEN–AKT pathway
We set up an in vivo xenograft model to determine the effect of miR-559 expression on tumor growth in vivo. Representative images of the tumor xenografts derived from miR-559–transfected or miR-NC–transfected U251 cells are shown in Figure 7A. The tumor volume in the mice from the miR-559 mimic group was much smaller than that in the miR-NC group (Figure 7B, P<0.05). Besides, the weight of tumor xenografts was smaller in the miR-559 mimic group than in the miR-NC group (Figure 7C, P<0.05). Western blot analysis uncovered downregulation of MTDH and p-AKT and elevation of PTEN expression in the tumor xenografts from the miR-559 mimic group (Figure 7D). The tumor xenografts were analyzed for miR-559 expression by RT-qPCR. The data confirmed the higher expression of miR-559 in the tumor xenografts derived from the miR-559 mimic group in comparison with the control group (Figure 7E, P<0.05). Thus, miR-559 decreased the growth of the GBM tumor in vivo via repression of the MTDH–PTEN–AKT pathway.
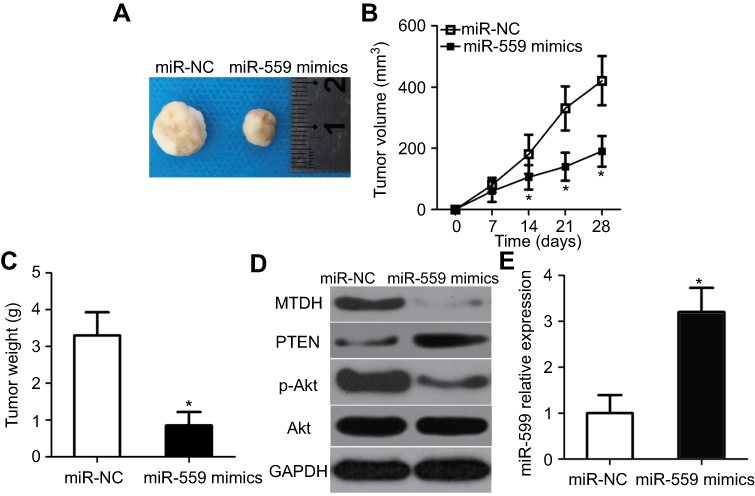 | Figure 7 MiR-559 overexpression suppresses GBM tumor growth in vivo. (A) Representative images of the tumor xenografts 4 weeks after inoculation with U251 cells expressing miR-559 mimics or miR-NC. (B) Tumor growth curves after the subcutaneous injection of nude mice with U251 cells transfected with miR-559 mimics or miR-NC. The volume of tumor xenografts was measured every 7 days. *P<0.05 as compared with group miR-NC. (C) Changes in the weight of tumor xenografts derived from miR-559 mimic–transfected or miR-NC–transfected U251 cells. *P<0.05 relative to group miR-NC. (D) Western blotting was conducted to measure MTDH, PTEN, p-AKT, and AKT protein amounts in the tumor xenografts. (E) The upregulation of miR-559 in tumor xenografts from the miR-559 mimic group was confirmed by RT-qPCR. *P<0.05 in comparison with group miR-NC.Abbreviation: miR-559, microRNA-559; GBM, glioblastoma; RT-qPCR, reverse-transcription quantitative polymerase chain reaction; miR-NC, miRNA negative control mimics. |
Discussion
Abnormal expression of miRNAs is a common feature of human malignant tumors, including GBM.25 Expression of several miRNAs has been reported to be dysregulated in GBM and to play a significant part in GBM formation and progression.26–28 MiRNAs may perform tumor-suppressive or tumor-promoting functions in GBM through regulation of the expression of their target genes.29 Hence, elucidation of the functions of cancer-associated miRNAs in GBM may facilitate the identification of promising therapeutic targets in GBM. Herein, we studied the miR-559 expression in GBM and investigated its clinical significance. In addition, we determined the specific roles of miR-559 in the oncogenicity of GBM in vitro and in vivo. The mechanisms responsible for the activity of miR-559 in GBM cells were explored in detail.
Although thousands of miRNAs have been identified, studies on the expression profile and functional characterization of miR-559 in GBM are limited. Herein, we performed RT-qPCR to measure miR-559 expression in GBM tissues and cell lines. The expression of miR-559 was obviously lower in GBM tissue samples and cell lines than in adjacent normal brain tissues and NHAs, respectively. The decreased miR-559 expression notably correlated with the Karnofsky performance score and tumor size among patients with GBM. Exogenous miR-559 expression suppressed cell proliferation, migration, and invasiveness and increased apoptosis of GBM cells. In addition, the upregulation of miR-559 reduced GBM tumor growth in vivo. These results suggest that miR-559 has an inhibitory effect on the oncogenic properties and malignant progression of GBM cells; thus, miR-559 may serve as a potential therapeutic agent and as a biomarker for the diagnosis of GBM.
An important characteristic of miRNAs is their direct binding to the 3′-UTRs of their target mRNAs, thereby resulting in target mRNA degradation or translation inhibition. Accordingly, we carried out miRNA target prediction and a functional study in databases TargetScan, miRDB, and microRNA.org. The bioinformatic prediction showed that the 3′-UTR of MTDH mRNA contains a highly conserved binding site for miR-559. In addition, the luciferase reporter assay revealed that miR-559 directly binds to the 3′-UTR of MTDH mRNA in GBM cells. Furthermore, MTDH mRNA and protein expression in GBM cells decreased after miR-559 overexpression. MTDH turned out to be notably upregulated in GBM tissues and negatively correlated with miR-559 levels. In addition, the knockdown of MTDH simulated the effects of miR-559 upregulation in GBM cells, whereas the recovery of MTDH expression attenuated the miR-559–mediated anticancer effects in GBM cells. Thus, MTDH acts as an immediate downstream mediator of miR-559 in GBM cells. Validation of the direct target of miR-559 in GBM is necessary not only to elucidate its functions in GBM but also for the identification of effective therapeutic methods for patients with this deadly disease.
MTDH, located in chromosomal region 8q22, is overexpressed in multiple types of human cancers, including non–small cell lung cancer,30 thyroid carcinoma,31 hepatocellular carcinoma,32 and laryngeal squamous cell carcinoma.33 MTDH has been implicated in the tumorigenesis including tumor progression because MTDH regulates several biological phenomena, including cellular proliferation, cell cycle, apoptosis, metastasis, epithelial-to-mesenchymal transition, and chemoradiotherapy sensitivity.34–36 MTDH expression is excessive in GBM and correlates with histological grade.37 Patients with GBM overexpressing MTDH have a shorter survival period than do patients with low MTDH expression in the tumor. Overexpression of MTDH serves as an independent prognostic biomarker of GBM.38 MTDH is known to promote the malignant progression of GBM cells.39–42 In the present study, we demonstrated that miR-559 represses the aggressive behavior of GBM cells in vitro and in vivo by directly targeting (and downregulating) MTDH and by reducing the output of the PTEN–AKT pathway. Hence, the suppression of MTDH expression by a miR-559–based targeted therapy may serve as an effective strategy for patients with GBM.
Conclusions
Our study indicates that miR-559 is a pleiotropic tumor-suppressive miRNA that directly targets MTDH mRNA and then suppresses the output of the PTEN–AKT pathway to exert antitumor action in GBM cells through the inhibition of cell growth and metastasis in vitro and a reduction of tumor growth in vivo. These results suggest that miR‑559 may be an effective therapeutic candidate for reducing or stopping the progression of GBM and may prevent its metastasis.
Abbreviation list
3′-UTR, 3′ untranslated region; AKT, protein kinase B; GBM, glioblastoma multiforme; miRNA, microRNA; MTDH, metadherin; PTEN, phosphatase and tensin homolog; RT-qPCR, reverse-transcription quantitative polymerase chain reaction; siRNA, small interfering RNA.
Disclosure
The authors report no conflicts of interest in this work.
References
1. Jemal A, Bray F, Center MM, Ferlay J, Ward E, Forman D. Global cancer statistics. CA Cancer J Clin. 2011;61:69–90.
2. Komori T, Sasaki H, Yoshida K. [Revised WHO classification of tumours of the central nervous system:summary of the revision and perspective].No shinkei geka. Neurosurg. 2016;44:625–635.
3. Ohgaki H, Kleihues P. Genetic pathways to primary and secondary glioblastoma. Am J Pathol. 2007;170:1445–1453. doi:10.2353/ajpath.2007.060031
4. Ramakrishna R, Pisapia D. Recent molecular advances in our understanding of glioma. Cureus. 2015;7:e287. doi:10.7759/cureus.268
5. Stupp R, Hegi ME, Mason WP, et al. R. European organisation for, T. Treatment of cancer brain, G. radiation oncology, G. national cancer institute of Canada clinical trials. Effects of radiotherapy with concomitant and adjuvant temozolomide versus radiotherapy alone on survival in glioblastoma in a randomised phase III study: 5-year analysis of the EORTC-NCIC trial. Lancet Oncol. 2009;10::459–466.
6. Linz U. Commentary on effects of radiotherapy with concomitant and adjuvant temozolomide versus radiotherapy alone on survival in glioblastoma in a randomised phase III study: 5-year analysis of the EORTC-NCIC trial (Lancet Oncol. 2009;10:459-466). Cancer. 2010;116:1844–1846. doi:10.1002/cncr.v116:8
7. Iorio MV, Croce CM. MicroRNA dysregulation in cancer: diagnostics, monitoring and therapeutics. A comprehensive review. EMBO mol med. 2017;9:852. doi:10.15252/emmm.201707779
8. Bartel DP. MicroRNAs: genomics, biogenesis, mechanism, and function. Cell. 2004;116:281–297. doi:10.1016/S0092-8674(04)00045-5
9. Calin GA, Sevignani C, Dumitru CD, et al. Human microRNA genes are frequently located at fragile sites and genomic regions involved in cancers. Proc Natl Acad Sci U S A. 2004;101:2999–3004. doi:10.1073/pnas.0307323101
10. Banelli B, Forlani A, Allemanni G, Morabito A, Pistillo MP, Romani M. MicroRNA in glioblastoma: an overview. Int J Genom. 2017;2017:7639084. doi:10.1155/2017/7639084
11. Link A, Kupcinskas J. MicroRNAs as non-invasive diagnostic biomarkers for gastric cancer: current insights and future perspectives. World J Gastroenterol. 2018;24:3313–3329. doi:10.3748/wjg.v24.i30.3313
12. Kim YH, Goh TS, Lee CS, et al. Prognostic value of microRNAs in osteosarcoma: A meta-analysis. Oncotarget. 2017;8:8726–8737.
13. Karatas OF, Oner M, Abay A, Diyapoglu A. MicroRNAs in human tongue squamous cell carcinoma: from pathogenesis to therapeutic implications. Oral Oncol. 2017;67:124–130. doi:10.1016/j.oraloncology.2017.02.015
14. Plantamura I, Cosentino G, Cataldo A. MicroRNAs and DNA-damaging drugs in breast cancer: strength in numbers. Front Oncol. 2018;8:352. doi:10.3389/fonc.2018.00352
15. Lozada-Delgado EL, Grafals-Ruiz N, Miranda-Roman MA, et al. Targeting microRNA-143 leads to inhibition of glioblastoma tumor progression. Cancers. 2018;10:382.
16. Xin J, Zheng LM, Sun DK, Li XF, Xu P, Tian LQ. miR-204 functions as a tumor suppressor gene, at least partly by suppressing CYP27A1 in glioblastoma. Oncol lett. 2018;16:1439–1448.
17. Mao Y, Wei F, Wei C, Wei C. microRNA574 inhibits cell proliferation and invasion in glioblastoma multiforme by directly targeting zinc finger Eboxbinding homeobox 1. Mol Med Rep. 2018;18:1826–1834. doi:10.3892/mmr.2018.9106
18. Deng Y, Li Y, Fang Q, Luo H, Zhu G. microRNA-744 is downregulated in glioblastoma and inhibits the aggressive behaviors by directly targeting NOB1. Am J Cancer Res. 2018;8:2238–2253.
19. Ahir BK, Ozer H, Engelhard HH, Lakka SS. MicroRNAs in glioblastoma pathogenesis and therapy: A comprehensive review. Crit Rev Oncol Hematol. 2017;120:22–33. doi:10.1016/j.critrevonc.2017.10.003
20. Mercatelli N, Galardi S, Ciafre SA. MicroRNAs as multifaceted players in glioblastoma multiforme. Int Rev Cell Mol Biol. 2017;333:269–323.
21. Saadatpour L, Fadaee E, Fadaei S, et al. Glioblastoma: exosome and microRNA as novel diagnosis biomarkers. Cancer Gene Ther. 2016;23:415–418. doi:10.1038/cgt.2016.48
22. Livak KJ, Schmittgen TD. Analysis of relative gene expression data using real-time quantitative PCR and the 2(-Delta Delta C(T)) method. Methods. 2001;25:402–408. doi:10.1006/meth.2001.1262
23. Wang Q, Tan L, Liu J, Zhao J, Zhou X, Yu T. MicroRNA98/PTEN/AKT pathway inhibits cell proliferation and malignant progression of hypopharyngeal carcinoma by MTDH. Oncol rep. 2019;41:863–874.
24. Wang Q, Lv L, Li Y, Ji H. MicroRNA655 suppresses cell proliferation and invasion in oral squamous cell carcinoma by directly targeting metadherin and regulating the PTEN/AKT pathway. Mol Med Rep. 2018;18:3106–3114.
25. Henriksen M, Johnsen KB, Andersen HH, Pilgaard L, Duroux M. MicroRNA expression signatures determine prognosis and survival in glioblastoma multiforme–a systematic overview. Mol Neurobiol. 2014;50:896–913. doi:10.1007/s12035-014-8668-y
26. Li D, Chi G, Chen Z, Jin. X. MicroRNA-1225-5p behaves as a tumor suppressor in human glioblastoma via targeting of IRS1. Onco Targets Ther. 2018;11:6339–6350. doi:10.2147/OTT.S178001
27. Jin L, Li H, Wang J, et al. MicroRNA-193a-5p exerts a tumor suppressor role in glioblastoma via modulating NOVA1. J Cell Biochem. 2019;120(4):6188–6197.
28. Liu J, Jiang J, Hui X, Wang W, Fang D, Ding L. Mir-758-5p suppresses glioblastoma proliferation, migration and invasion by targeting ZBTB20. Cell Physiol Biochem. 2018;48:2074–2083. doi:10.1159/000492545
29. Brower JV, Clark PA, Lyon W, Kuo JS. MicroRNAs in cancer: glioblastoma and glioblastoma cancer stem cells. Neurochem Int. 2014;77:68–77. doi:10.1016/j.neuint.2014.06.002
30. Ma Z, Chen Y, Dong S, et al. AEG-1 mRNA expression in non-small cell lung cancer is associated with increased tumor angiogenesis. Pathol Res Pract. 2017;213:1257–1263. doi:10.1016/j.prp.2017.09.003
31. Huang LL, Wang Z, Cao CJ, et al. AEG-1 associates with metastasis in papillary thyroid cancer through upregulation of MMP2/9. Int J Onco. 2017;51:812–822. doi:10.3892/ijo.2017.4077
32. He R, Gao L, Ma J, et al. The essential role of MTDH in the progression of HCC: a study with immunohistochemistry, TCGA, meta-analysis and in vitro investigation. Am J Transl Res. 2017;9:1561–1579.
33. Chen Y, Wang W, Li Z, et al. [Expression and significance of MTDH and MMP-9 in laryngeal squamous cell carcinoma]. [Lin chuang er bi yan hou tou jing wai ke za zhi] J Clin Otolaryngol Head Neck Surg. 2016;30:60–63.
34. Song Z, Wang Y, Li C, Zhang D, Wang X. Molecular modification of metadherin/MTDH impacts the sensitivity of breast cancer to doxorubicin. PLoS One. 2015;10:e0127599. doi:10.1371/journal.pone.0127599
35. Chen J, Jia Y, Jia ZH, Zhu Y, Jin YM. Silencing the expression of MTDH increases the radiation sensitivity of SKOV3 ovarian cancer cells and reduces their proliferation and metastasis. Int J Onco. 2018;53:2180–2190.
36. Shi X, Wang X. The role of MTDH/AEG-1 in the progression of cancer. Int J Clin Exp Med. 2015;8:4795–4807.
37. He Z, He M, Wang C, et al. Prognostic significance of astrocyte elevated gene-1 in human astrocytomas. Int J Clin Exp Pathol. 2014;7:5038–5044.
38. Xia Z, Zhang N, Jin H, Yu Z, Xu G, Huang Z. Clinical significance of astrocyte elevated gene-1 expression in human oligodendrogliomas. Clin Neurol Neurosurg. 2010;112:413–419. doi:10.1016/j.clineuro.2010.02.007
39. Yang J, Fan B, Zhao Y, Fang. J. MicroRNA-202 inhibits cell proliferation, migration and invasion of glioma by directly targeting metadherin. Oncol rep. 2017;38::1670–1678. doi:10.3892/or.2017.5815
40. Tong L, Chu M, Yan B, et al. MTDH promotes glioma invasion through regulating miR-130b-ceRNAs. Oncotarget. 2017;8:17738–17749. doi:10.18632/oncotarget.v8i11
41. Park SY, Choi M, Park D, et al. AEG-1 promotes mesenchymal transition through the activation of Rho GTPases in human glioblastoma cells. Oncol rep. 2016;36:2641–2646. doi:10.3892/or.2016.5106
42. Emdad L, Sarkar D, Lee SG, et al. Astrocyte elevated gene-1: a novel target for human glioma therapy. Mol Cancer Ther. 2010;9:79–88. doi:10.1158/1535-7163.MCT-10-0338
 © 2019 The Author(s). This work is published and licensed by Dove Medical Press Limited. The
full terms of this license are available at https://www.dovepress.com/terms
and incorporate the Creative Commons Attribution
- Non Commercial (unported, 3.0) License.
By accessing the work you hereby accept the Terms. Non-commercial uses of the work are permitted
without any further permission from Dove Medical Press Limited, provided the work is properly
attributed. For permission for commercial use of this work, please see paragraphs 4.2 and 5 of our Terms.
© 2019 The Author(s). This work is published and licensed by Dove Medical Press Limited. The
full terms of this license are available at https://www.dovepress.com/terms
and incorporate the Creative Commons Attribution
- Non Commercial (unported, 3.0) License.
By accessing the work you hereby accept the Terms. Non-commercial uses of the work are permitted
without any further permission from Dove Medical Press Limited, provided the work is properly
attributed. For permission for commercial use of this work, please see paragraphs 4.2 and 5 of our Terms.