Back to Journals » OncoTargets and Therapy » Volume 13
MicroRNA-3666 Suppresses Cell Growth in Head and Neck Squamous Cell Carcinoma Through Inhibition of PFKFB3-Mediated Warburg Effect
Authors Chen L, Cao Y, Wu B, Cao Y
Received 1 March 2020
Accepted for publication 9 July 2020
Published 10 September 2020 Volume 2020:13 Pages 9029—9041
DOI https://doi.org/10.2147/OTT.S251992
Checked for plagiarism Yes
Review by Single anonymous peer review
Peer reviewer comments 3
Editor who approved publication: Dr Federico Perche
Lan Chen,1,2 Yaxuan Cao,2 Bei Wu,3 Yu Cao1
1Department of Dermatology, Affiliated Hospital of Guiyang Medical University, Guiyang, People’s Republic of China; 2University of Health, Guizhou Medical University, Guiyang, People’s Republic of China; 3Department of Obstetrics and Gynecology, 925 Hospital of the Joint Logistics Support Force of the Chinese People’s Liberation Army, Guiyang, People’s Republic of China
Correspondence: Yu Cao
Department of Dermatology, Affiliated Hospital of Guiyang Medical Univesity, 28 Guiyi Street, Yunyan District, Guiyang, Guizhou 550004, People’s Republic of China
Tel +86- 851-86741109
Fax +86- 851-86741135
Email [email protected]
Bei Wu
Department of Obstetrics and Gynecology, 925 Hospital of the Joint Logistics Support Force of the Chinese People’s Liberation Army, 67 Huanghe Road, Huaxi District, Guiyang, Guizhou 550009, People’s Republic of China
Tel +86-851-85723129
Fax +86-851-85723132
Email [email protected]
Purpose: MicroRNA-3666 (miR-3666) is aberrantly expressed and plays critical roles in numerous human tumors. However, the expression pattern, biological role, and mechanisms of action of miR-3666 in head and neck squamous cell carcinoma (HNSCC) remain unknown. Therefore, we attempted to determine the expression status and function of miR-3666 in HNSCC and to explore the underlying mechanisms in detail.
Methods: In this study, quantitative real-time polymerase chain reaction was carried out to measure the expression of miR-3666 HNSCC tissues. A series of experiments, including a Cell Counting Kit-8 assay, colony formation assay, BrdU incorporation and apoptosis analysis, were applied to test whether miR-3666 affects the growth of HNSCC cells. Glucose uptake and lactate production measurements and extracellular acidification and oxygen consumption rate assays were conducted to determine the effect of miR-3666 on glycolysis.
Results: We found that miR-3666 showed a decreased expression in HNSCC tissues. Further functional studies demonstrated that miR-3666 inhibited the growth of HNSCC cells by suppressing cell proliferation and promoting apoptosis. Bioinformatics analysis and luciferase reporter assays identified phosphofructokinase-2/fructose-2,6-bisphosphatase 3 (PFKFB3), a key enzyme regulating glycolysis, as a direct target of miR-3666. Through inhibition of PFKFB3, miR-3666 decreased glycolysis in HNSCC cells by reducing the production of F2,6BP. Importantly, glycolysis suppression caused by miR-3666 was found to be required for its inhibitory effect on HNSCC cell growth.
Conclusion: Our data suggest that miR-3666 functions as a tumor suppressor by decreasing the rate of glycolysis through inhibition of PFKFB3 activity, and this miRNA may present a potential candidate for HNSCC therapy.
Keywords: microRNA-3666, head and neck squamous cell carcinoma, PFKFB3, Warburg effect
Introduction
Head and neck squamous cell carcinoma (HNSCC), the sixth most common cancer worldwide, accounts for nearly 350,000 deaths annually.1 Despite the improvement of diagnostic and therapeutic strategies, the 5-year overall survival rate has not improved significantly in the past few decades.2 Therefore, it is critical to investigate the molecular basis underlying the occurrence and progression of HNSCC and then identify novel therapeutic targets to treat HNSCC.
The high rate of glycolysis in the presence of oxygen (the Warburg effect) is implicated in cancer development with elevated glucose uptake and lactate production.3 As one of the three irreversible and regulated steps in glycolysis, the reaction catalyzed by 6-phosphofructo-1-kinase (PFK-1) to produce fructose-1,6-bisphosphate (F1,6P2) from fructose-6-phosphate (F6P) plays a crucial role in controlling metabolite flux through the glycolytic pathway.4 The activity of PFK-1 is under the control of F2,6P2, which is generated by the phosphorylation of F6P to fructose-2,6-bisphosphate (F2,6BP).5 This reaction is catalyzed by enzymes in the 6-phosphofructo-2-kinase/fructose-2,6-bisphosphatase family. One member, PFKFB3, has been shown to be upregulated in various cancers and associated with poor survival in patients with cancer, including breast cancer, gastric cancer, colorectal cancer, and glioblastoma.6–9 In HNSCC, PFKFB3 showed high expression levels in tumor tissues, and inhibiting its activity suppressed the proliferation of HNSCC cells by abrogating the Warburg effect,10,11 suggesting that PFKFB3 exhibits an oncogenic role in HNSCC; however, the regulatory mechanism underlying the high expression of PFKFB3 in HNSCC remains unclear.
MicroRNAs (miRNAs) are a type of non-coding RNAs that are 18–25 nucleotides in length and capable of regulating gene expression at the post-transcriptional level.12 miRNAs repress gene expression through inducing mRNA degradation or translational repression by binding directly to the 3ʹ-untranslated region (UTR) of the target mRNAs. Under physiological conditions, miRNAs modulate many cellular processes, including cell proliferation, differentiation, migration, senescence, and apoptosis.13 There is increasing evidence that dysregulation of miRNAs is responsible for the development of numerous cancers, including gastric cancer, melanoma, lung cancer, and colorectal cancer.14 In human HNSCC, miRNAs can exert either oncogenic or tumor-suppressive roles in carcinogenesis. For example, some miRNAs, such as miR-196a and miR-4295, have been found to be highly expressed in HNSCC and function as oncogenes.15,16 Conversely, other miRNAs, including miR-96-5p and miR-135a-5p, are down-regulated in HNSCC and exhibit tumor-suppressive activities.17,18 Thus, identification of a novel miRNA involved in HNSCC progression should facilitate the development of efficient diagnosis and therapeutic strategies.
Although miR-3666 is known to be downregulated in numerous human tumors, including breast, lung, colorectal, and cervical cancers, and acts as a tumor suppressor,19–23 its expression status and function in HNSCC remain unknown. In this study, we found that miR-3666 showed a decreased expression in HNSCC tissues and exhibited a tumor-suppressive role. Further studies demonstrated that miR-3666 inhibits HNSCC growth by decreasing the rate of glycolysis through directly targeting PFKFB3. These findings demonstrate the importance of the miR-3666/PFKFB3 axis in the regulation of glycolysis in HNSCC and provide novel insights into the molecular mechanism underlying HNSCC progression.
Materials and Methods
Antibodies and Reagents
Antibodies against Cyclin D1, BCL2 and PFKFB3 were purchased from Cell Signaling Technology (Beverly, MA, USA). Tubulin Antibody was obtained from Santa Cruz Biotechnology (Santa Cruz, CA, USA). miR-3666 mimics and antagomiR-3666 were purchased from RiboBio (Guangzhou, China).
Cells and Cell Culture
Th HNSCC cell lines (FaDu and Cal2) were purchased from Fenghbio Science and Technology Ltd. (Changsha, China). The cells were cultured in Dulbecco’s modified Eagle medium (DMEM; Invitrogen, Carlsbad, California) containing 10% fetal bovine serum (Gibco/Invitrogen Inc., Carlsbad, CA, USA), 100 U/mL penicillin and 100 μg/mL streptomycin in a humidified atmosphere with 5% CO2 at 37°C.
Clinical Samples
The present study was approved by the Ethics Committee of the Affiliated Hospital of Guiyang Medical University. 36 paired HNSCC tissues and adjacent normal tissues were obtained from patients undergoing surgery at the Affiliated Hospital of Guiyang Medical University with written informed consent from each patient. All tissue samples were immediately stored in liquid nitrogen for future experiments.
Transient Transfection of miR-3666 Mimics or Inhibitors
MiR-3666 mimics or antagomiR-3666 (Ribo Company, Guangzhou, China) were transfected into FaDu or Cal27 cells using Lipofectamine RNAiMAX Transfection Reagent (Invitrogen, Carlsbad, CA, USA) according to the manufacturer’s recommendations. After 24 hours of transfection, the cells were used for further experiments. MiR-NC or AntagomiR-NC was obtained from Ribo Company (Guangzhou, China) and used as control.
Quantitative Real-Time PCR
Total RNAs from tissues or cells were extracted using TRIzol (Invitrogen, Grand Island, NY, USA). For miR-3666 quantification, cDNA was reverse transcribed using TaqManTM Advanced miRNA cDNA Synthesis Kit (Waltham, MA, USA). To measure PFKFB3 expression, cDNA was synthesized using M-MLV Reverse Transcriptase (Promega, Madison, WI, USA). The RT-qPCR was performed in an ABI 7500 system (Applied Biosystems; Thermo Fisher Scientific, Inc.) with the PrimeScript miRNA RT-PCR kit (Takara, Dalian, China) or a Takara SYBR RT-PCR kit (Takara) following the manufacturer’s instructions, respectively. The relative gene expression was calculated using the comparative Ct methods as normalized to endogenous control U6 or β-actin.24 The primer sequences used were as follows: miR-3666 (Forward, 5ʹ-ACACTCCAGCTGGGCAGTCAAGTGTAGA-3ʹ; Reverse: 5ʹ-TGGTGTCGTGGAGTCG-3ʹ); U6 (forward: 5ʹ-CGCTTCGGCAGCACATATACTAA-3ʹ; Reverse, 5ʹ-TATGGAACGCTTCACGAATTTGC-3ʹ); PFKFB3 (Forward: 5ʹ-AGAACTTCCACTCTCCCACCCAAA-3ʹ; reverse:5ʹ-AGGGTAGTGCCCATTGTTGAAGGA-3ʹ); β-actin (forward: 5ʹ-GCACAGAGCCTCGCCTT-3ʹ; reverse: 5ʹ-GTTGTCGACGACGAGCG-3’).
CCK-8 Assay
The growth of HNSCC cells was assessed using Cell Counting Kit-8 (CCK-8) (Dojindo Laboratories, Tokyo, Japan). The cells (1500 cells/well) were seeded in 96-well plates. After 72 hours of culture, CCK-8 reagent was added into the well and incubated for another 4 h. The optical density at 450 nm was detected in a microplate reader (Molecular Devices, Sunnyvale, CA, USA). The experiments were conducted in three independent experiments, and the results are showed as means ± standard deviation (SD).
Colony Formation Assay
To determine the colony formation ability of cancer cells, the cells (2000 cells/well) were seeded in a six-well plate and cultured in DMEM medium containing 10% FBS. Two weeks later, the cells were fixed with 4% paraformaldehyde and stained with 0.5% crystal violet solution for 30 min. The number of colonies (> 50 cells) were counted using ImageJ (Maryland, MD, USA). The experiments were conducted in three independent experiments, and the results are showed as means ± standard deviation (SD).
BrdU Incorporation Assay
10 µM BrdU was added to the cells, followed by incubation for 30 minutes in a humidified incubator with 5% CO2 at 37°C. After a thorough rinse with PBS, the cells were incubated with 6 M hydrochloric acid in PBS for another 30 minutes at room temperature. Following two washes with 0.1 M borate buffer and one wash with 0.1% BSA in PBS, 10 µg mL−1 anti-BrdU fluorescein in PBS with 0.1% BSA was added to the cells. After incubation for 1 hour in the dark, the cells were collected for flow cytometry analysis using a FACSCantoTM apparatus (BD Biosciences). FlowJo software (Tree Star, Ashland, OR) was used to analyze the data.
Apoptosis Analysis
Cell apoptosis was measured with an Annexin V-FITC Apoptosis Detection Kit (Tianjin Sungene Biotech Co., Ltd.). The cells were digested and harvested by trypsin. After being washed twice with PBS, the cells were re-suspended with a 1X binding buffer containing Annexin V-FITC (200 ng/mL). After incubation for 15 min in the dark at room temperature, the cells were washed in PBS and resuspended in binding buffer. PI was added into the cells before flow cytometric analysis. Stained cells were analyzed in FACSCantoTM (BD Biosciences). Data analysis was performed with FlowJo software (Tree Star, Ashland, OR).
Western Blotting
Western blotting was performed as previously described.25 The intensity of the bands on the membrane was analyzed by Image-Pro Plus 6.0 software (Media Cybernetics, Inc., Rockville, MD, USA). Relative protein expression was calculated by normalization against Tubulin. The fold-change of protein expression was obtained by normalization with the control group.
Luciferase Reporter Assay
FaDu or Cal27 cells were seeded into 24-well plates at a density of 5×10⁴ cell/per well. After 24 hours of culture, the cells were cotransfected with pRL-TK vector (an internal control) and pGL3 luciferase reporter plasmid containing either wild-type or mutant 3ʹ-UTR of PFKFB3 in combination with miR-3666 mimics or antagomiR-3666 using Lipofectamine 2000 (Invitrogen, New York, NY, USA). 48 hours later, the cells were collected and analyzed for the luciferase activity using Dual-Luciferase Reporter Assay system (Promega, Madison, WI, USA) according to the manufacturer’s suggestions.
F2,6P2 Measurements
The intracellular F2,6P2 concentration was measured as previously described.26 Briefly, cell extracts were incubated in a mixture supplemented with 50 mmol/L Tris/HCl, 0.15 mmol/L NADH, 5 mmol/L MgC12, 5 kilounit/liter triose-phosphate isomerase, 0.45 kilounit/liter aldolase, 1 mmol/L F6P (fructose 6-phosphate), 10 units/liter PPi (pyrophosphate)-dependent PFK1 and 1.7 kilounit/liter glycerol-3-phosphate dehydrogenase (Sigma). The reaction was started by the addition of 0.5 mmol/L pyrophosphate, and the change in absorbance followed at 339 nm. The F2,6P2 content was calculated and normalized relative to total cellular protein, as determined by the bicinchoninic acid (BCA) assay.
Glucose Uptake and Lactate Production Assay
Glucose Uptake Colorimetric Assay kit (Sigma-Aldrich Co, St. Louis, MO, USA) and a lactate assay kit (Biovision, CA, USA) were used to measure glucose uptake and lactate production respectively, following the manufacturer’s instructions. For glucose uptake assay, cells were starved in serum-free medium for 12 h and then incubated with 2-deoxy-D-glucose (2-DG) for 30 min. The absorbance at 412 nm was measured using a microplate reader (Molecular Devices, Sunnyvale, CA, USA). For lactate assay, 0.5 µL of culture medium was added to the Lactate Assay Buffer, followed by incubation for 30 min in the dark at room temperature. The absorbance at 570 nm was determined using a microplate reader (Molecular Devices, Sunnyvale, CA, USA).
Extracellular Acidification and Oxygen Consumption Rate Assays
The extracellular acidification rate (ECAR) and cellular oxygen consumption rate (OCR) were measured using the Seahorse XF96 Flux Analyzer (Seahorse Bioscience, Billerica, Massachusetts, USA). ECAR and OCR experiments were carried out using the Seahorse XF Glycolysis Stress Test Kit and Seahorse XF Cell Mito Stress Test Kit, respectively, following the manufacturer’s instructions. Briefly, the cells (2×10⁴ cells/well) were seeded into a Seahorse XF 96 cell culture microplate. For the measurement of ECAR, 10 mM glucose, 1 μM oligomycin, and 80 mM glycolysis inhibitor were sequentially injected at indicated time points. For the assessment of OCR, 1 μM oligomycin, 1 μM fluoro-carbonyl cyanide phenylhydrazone (FCCP), and 2 mM antimycin A and rotenone were sequentially added at the indicated time points. The final output data of ECAR and OCR were normalized relative to the total protein level as measured by the BCA assay.
In vivo Tumorigenesis Assay
Five-week-old male BALB/c nude mice were obtained from the Animal Center for Vitalriver (Beijing, China). To measure the role of miR-3666 overexpression on the tumor growth, approximately 1 × 10⁷ viable Cal27 cells stably overexpressing miR-NC or miR-3666 in 100 μL PBS solution were subcutaneously injected into the right flank of nude mice, respectively. Tumor growth were monitored by caliper measurements (Length × Width2)/2 at indicated times.
Statistical Analysis
Each experiment was repeated three times and presented as the mean ± standard deviation (SD). The differences between groups were analyzed with Student’s t-test. Spearman’s rank correlation test was used to perform correlation analysis. The statistical analyses were conducted using the SPSS 17.0 software (SPSS, Chicago, IL, USA). P values of less than 0.05 were considered statistically significant.
Results
miR-3666 is Downregulated in HNSCC Tissues
To explore the potential relevance of miR-3666 in HNSCC, we first followed the expression of miR-3666 in clinical HNSCC samples using RT-qPCR. The abundance of miR-3666 was determined in 72 clinical samples, including HNSCC tissues (n=36) and adjacent normal tissues (Table 1). Compared with adjacent normal tissues, the expression of miR-3666 in HNSCC tissues was significantly decreased (Figure 1). Together, these results indicate that miR-3666 is markedly downregulated in HNSCC clinical specimens, indicating a potential tumor suppressor role for miR-3666 in HNSCC.
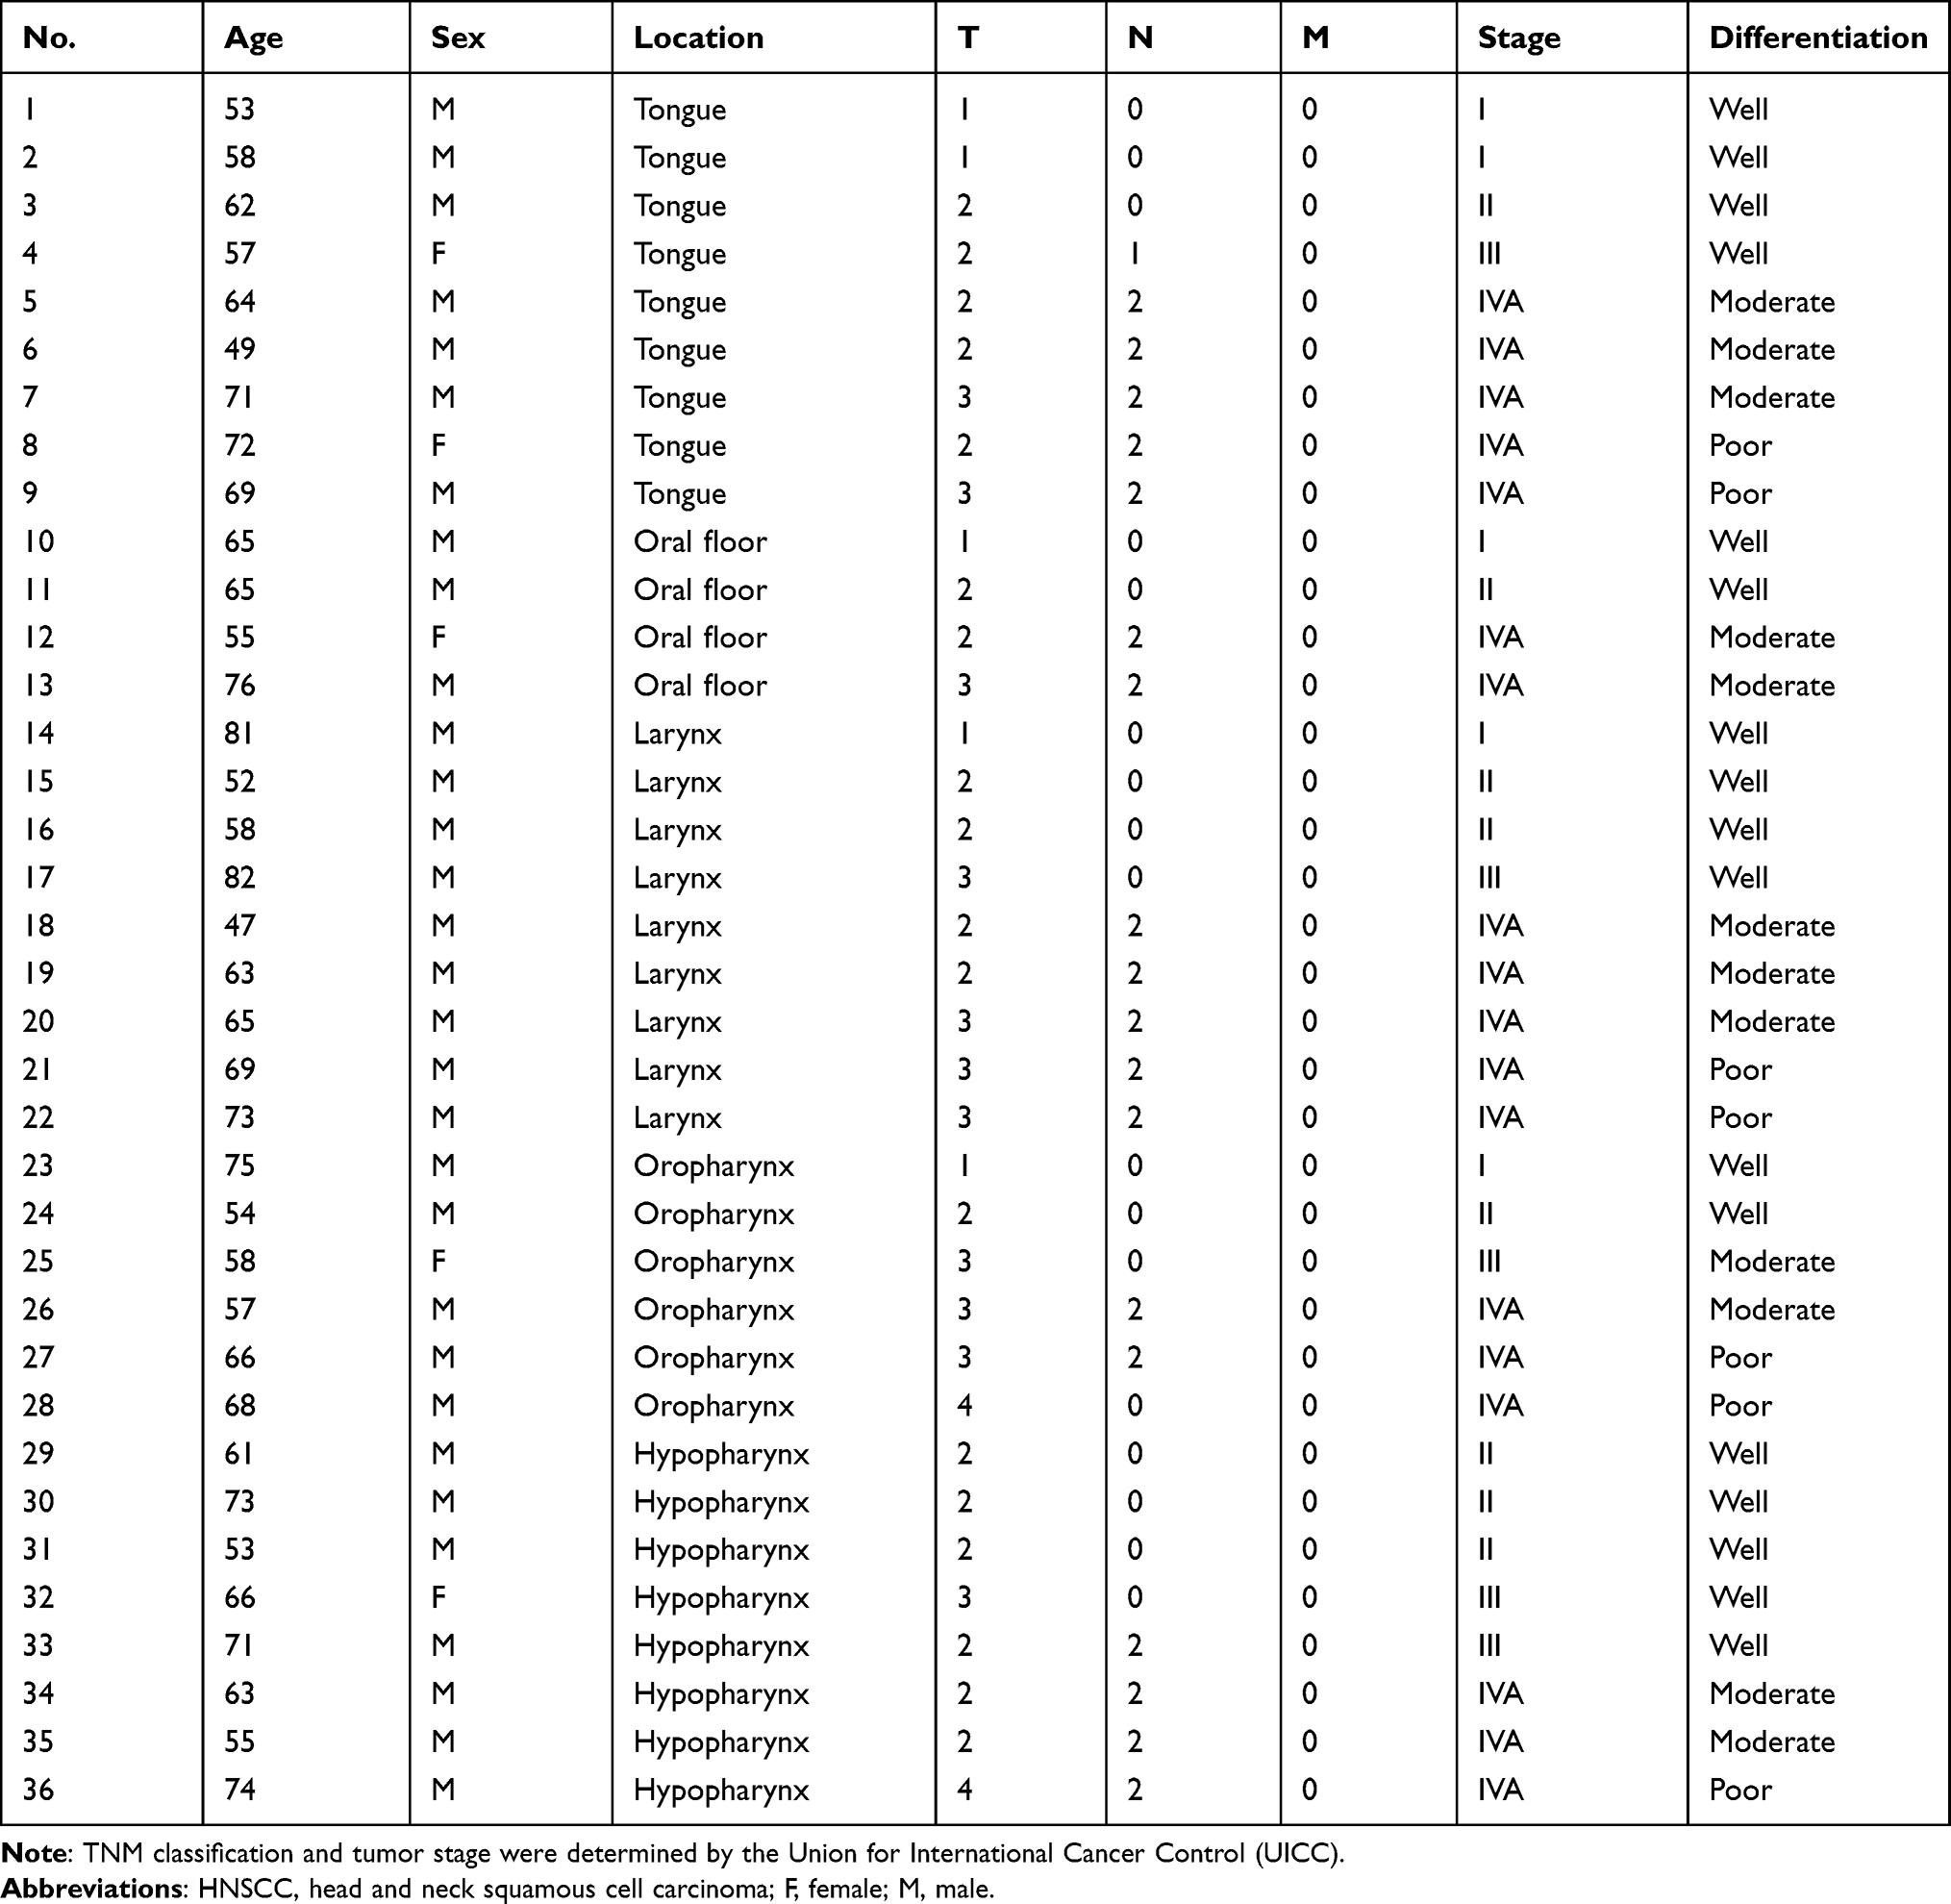 |
Table 1 Clinical Features of 36 Patients with HNSCC |
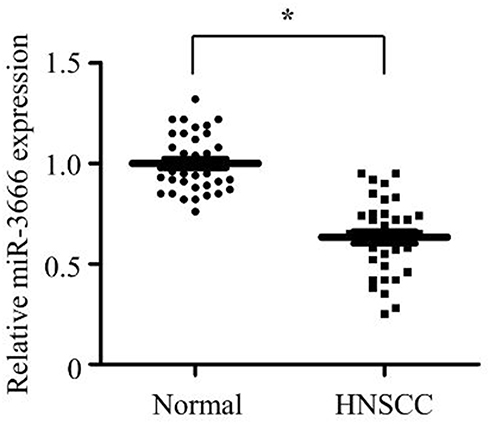 |
Figure 1 miR-3666 is downregulated in HNSCC tissues. Comparison of miR-3666 expression in HNSCC tissues (n=36) and adjacent normal tissues, as measured by determined by RT-qPCR. The expression of miR-3666 was normalized to U6 snRNA (*P<0.05). |
Upregulation of miR-3666 Inhibits the Growth of HNSCC Cells
To explore the potential biological effect of miR-3666 in HNSCC, we transfected miR-3666 mimics into FaDu and Cal27 cells. As shown in Figure 2A, miR-3666 was successfully overexpressed by miR-3666 transfection, as assessed by RT-qPCR. CCK8 assays showed that miR-3666 overexpression profoundly suppressed the growth of both FaDu and Cal27 cells (Figure 2B). Also, the clonogenic potential of FaDu and Cal27 cells was significantly abrogated upon miR-3666 overexpression (Figure 2C). BrdU assay demonstrated that miR-3666 overexpression led to a marked inhibition of the proliferation of both FaDu and Cal27 cells (Figure 2D). Furthermore, FaDu and Cal27 cells transfected with miR-3666 mimics both exhibited substantially increased apoptosis (Figure 2E). Western blot analysis revealed that miR-3666 overexpression in HNSCC cells significantly suppressed the expression of cell cycle promoting protein cyclin D1 and anti-apoptosis protein BCL2 (Figure 2F and G), consistent with the decreased proliferation and increased cell apoptosis caused by the enforced expression of miR-3666. We next detected the effect of miR-3666 overexpression on the growth of HNSCC cells in vivo. Cal27 cells stably overexpressing miR-3666 were established and injected into the flanks of nude mice. As shown in Figure 2H, miR-3666 overexpression profoundly suppressed the growth of subcutaneous xenograft tumors. In summary, these data indicate that miR-3666 plays a tumor suppressor role in HNSCC.
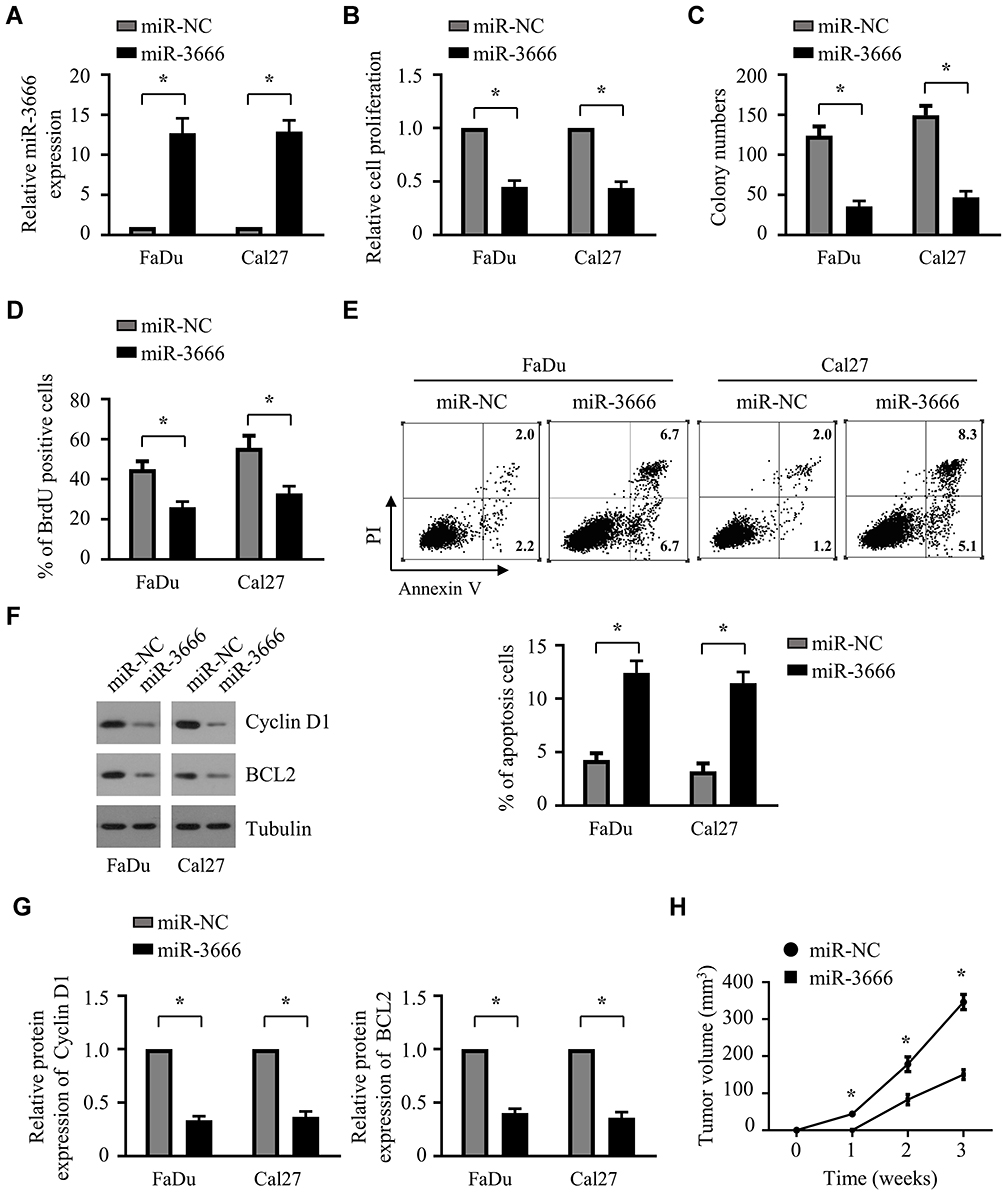 |
Figure 2 Upregulation of miR-3666 inhibits the growth of HNSCC cells. (A) miR-NC or miR-3666 was transfected into FaDu and Cal27 cells. 72 h later, miR-3666 expression was measured by RT-qPCR. The data are shown as means ± SD of three independent measurements. *P<0.05. (B and C) FaDu and Cal27 cells were transfected with miR-NC or miR-3666. After 24 h of transfection, cells were subjected to CCK-8 assay (B) and colony formation assay (C). The data are shown as means ± SD of three independent measurements. *P<0.05. (D and E) FaDu and Cal27 cells were transfected with miR-NC or miR-3666. After 72 h of transfection, cells were subjected to BrdU assay (D) and cell apoptosis analysis (E). The data are shown as means ± SD of three independent measurements. *P<0.05. (F) Western blot analysis of Cyclin D1 and BCL2 in FaDu and Cal27 cells transfected with miR-NC or miR-3666. (G) Relative expression of Cyclin D1 and BCL2 in FaDu and Cal27 cells transfected with miR-NC or miR-3666 was quantified from 3 independent experiments as shown in (F). *P < 0.05. (H) Comparison of growth curves of xenografts of Cal27 cells stably expressing either miR-NC or miR-3666. The data shown are mean ± SEM, n=5. *P < 0.05. |
Suppression of miR-3666 Promotes the Growth of HNSCC Cells
The results from miR-3666 overexpression indicated an inhibitory role for miR-3666 in the growth of HNSCC cells. To confirm this, we examined the impact of miR-3666 suppression on the growth of HNSCC cells. Antagomir-3666 was transfected into FaDu and Cal27 cells to silence the expression of endogenous miR-3666, which markedly reduced the expression level of endogenous miR-3666 in both FaDu and Cal27 cells (Figure 3A). CCK8 assays indicated that suppression of miR-3666 profoundly promoted the growth of both FaDu and Cal27 cells (Figure 3B). We also observed that miR-3666 depletion significantly enhanced the clonogenic potential of FaDu and Cal27 cells (Figure 3C). BrdU assay showed a significant increase in the proliferation ability of FaDu and Cal27 cells after transfection with antagomiR-3666 (Figure 3D). Moreover, inhibition of miR-3666 led to a substantial decrease of apoptosis in both FaDu and Cal27 cells (Figure 3E). Consistent with that result, suppression of miR-3666 s increased the expression of cell cycle promoting protein cyclin D1 and anti-apoptosis protein BCL2, as assessed by Western blot analysis (Figure 3F and G). Conclusively, all these results indicated that miR-3666 suppression promotes the growth of HNSCC cells.
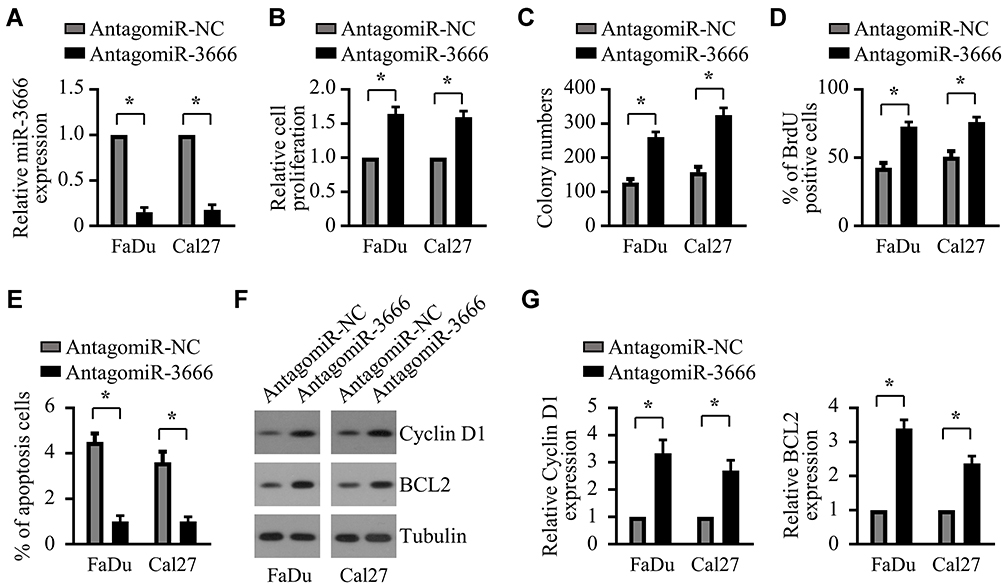 |
Figure 3 Suppression of miR-3666 promotes the growth of HNSCC cells. (A) Relative miR-3666 levels in FaDu and Cal27 cells following 72 h transfection with antagomir-NC or antagomir-3666. The data are shown as means ± SD of three independent measurements. *P<0.05. (B and C) FaDu and Cal27 cells were transfected with antagomir-NC or antagomir-3666, followed by CCK-8 assay and colony formation assay twenty-four hours after transfection. The data are shown as means ± SD of three independent measurements. *P<0.05. (D and E) FaDu and Cal27 cells were transfected with antagomir-NC or antagomir-366 for 72 h, followed by BrdU assay (D) and cell apoptosis analysis (E). The data are shown as means ± SD of three independent measurements. *P<0.05. (F) Western blot analysis of Cyclin D1 and BCL2 inFaDu and Cal27 cells transfected with antagomir-NC or antagomir-366. (G) Relative expression of Cyclin D1 and BCL2 in FaDu and Cal27 cells transfected with antagomir-NC or antagomir-366 was quantified from 3 independent experiments as shown in (F). *P < 0.05. |
PFKFB3 is a Direct Target of miR-3666
To elucidate the molecular mechanism by which miR-3666 regulates the growth of HNSCC cells, we conducted bioinformatic analyses using two bioinformatics tools, miRanda and TargetScan, to search for potential target genes. Among the predicted target genes, PFKFB3, which was recently reported to exhibit an oncogenic role in HNSCC, attracted our attention. The possible binding site for miR-3666 in the 3ʹ-untranslated region (3ʹ-UTR) of PFKFB3 is presented in Figure 4A. To verify that miR-3666 directly targets PFKFB3, a Dual-Luciferase reporter system containing either wild-type or mutant 3ʹ-UTR of PFKFB3 was used. As shown in Figure 4B, transfection of miR-3666 mimics profoundly suppressed the luciferase activity of the reporter containing the wild-type 3ʹ-UTR of PFKFB3 (Figure 4B), but not of that containing the mutant 3ʹ-UTR. In keeping with these results, miR-3666 suppression led to a marked increase in the luciferase activity of the reporter with wild-type 3ʹ-UTR of PFKFB3 but showed no significant effect on that with the mutant 3ʹ-UTR (Figure 4C). Subsequent RT-qPCR and Western blot analysis revealed that the mRNA and protein expression levels of PFKFB3 were significantly suppressed by miR-3666 overexpression (Figure 4D and E). Thus, miR-3666 suppression led to a significant upregulation of PFKFB3 in both mRNA and protein expression levels (Figure 4F and G). We subsequently investigated the correlation between miR-3666 and PFKFB3 expression levels in clinical specimens using the 36 pairs of HNSCC tissues (n=36) and adjacent normal tissues mentioned above (Figure 1) (Table 1), when a remarkably strong negative correlation was observed (P<0.0001; r= −0.6294) (Figure 4H). Collectively, these results reveal that PFKFB3 is a direct target of miR-3666.
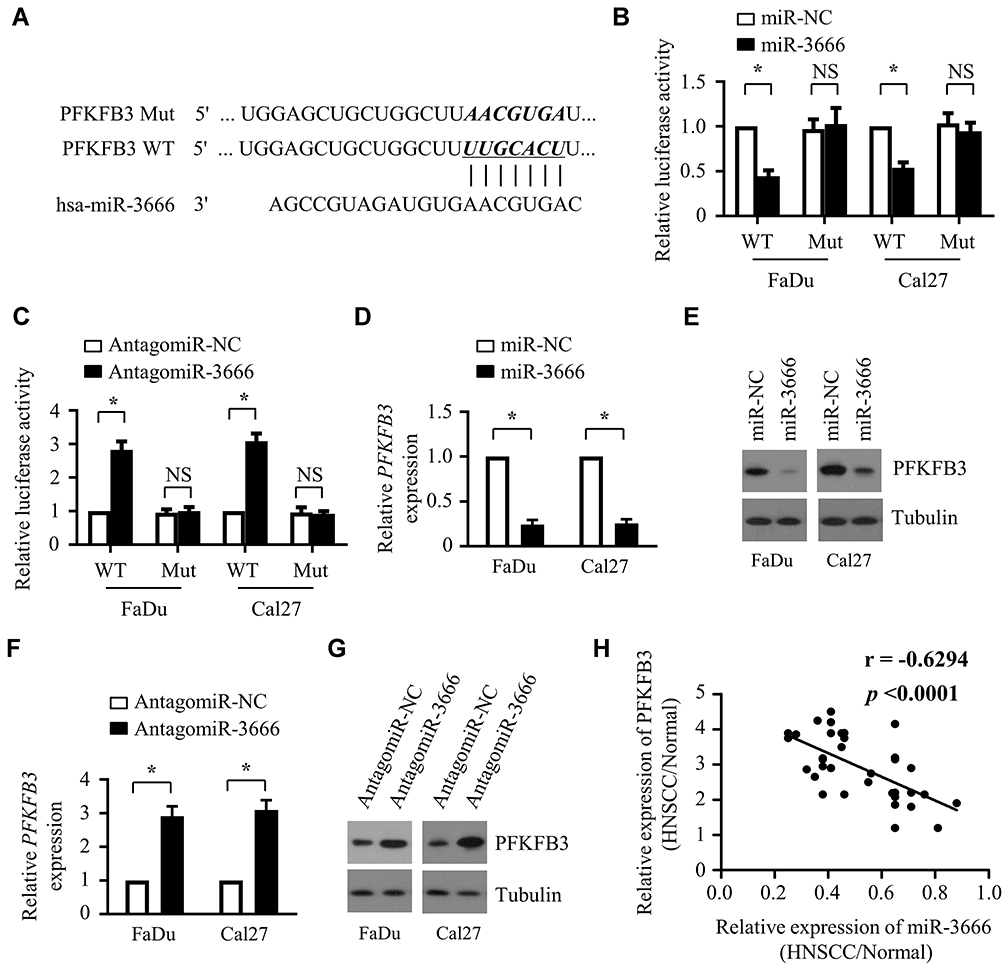 |
Figure 4 PFKFB3 is a direct target of miR-3666. (A) Scheme of the target sites of miR-3666 in 3ʹ-UTR of PFKFB3 mRNA (B) Wild-type or mutated PFKFB3 reporter plus miR-NC or miR-3666 were transfected into FaDu and Cal27 cells. Luciferase activities were measured after 48 h. (C) Wild-type or mutated PFKFB3 reporter in combination with antagomir-NC or antagomir-3666 were transfected into FaDu and Cal27 cells. Forty-eight hours later, luciferase activities were determined. (D and F) qRT-PCR analysis of PFKFB3 mRNA levels in FaDu and Cal27 cells transfected with miR-NC or miR-3666 (D) or with antagomir-NC or antagomir-3666 (F). The relative gene expression of PFKFB3 was normalized to endogenous β-actin. (E and G) Western blot analysis of PFKFB3 protein levels in FaDu and Cal27 cells transfected with miR-NC or miR-3666 (E) or with antagomir-NC or antagomir-3666 (G). Tubulin was used as a loading control. (H) A statistically significant inverse correlation between miR-3666 and PFKFB3 mRNA in clinical specimens was observed by Pearson’s method. All data are shown as mean±SD of three separate experiments. *P<0.05; NS, not significant. |
miR-3666 Inhibits the Growth of HNSCC Cells Through Suppression of Glycolysis
Glycolysis involves a series of reactions that metabolize glucose to pyruvate to produce a net yield of 2 adenosine triphosphate (ATP) molecules from each molecule of glucose and plays a key role in the initiation and progression of HNSCC.27 PFKFB3 participates in controlling the overall activity of the glycolytic process by producing F2,6BP, which leads to the activation of PFK-1, the key regulated enzyme in the pathway of glycolysis. Since miR-3666 can modulate the expression of PFKFB3, we speculated that it might influence glycolysis in HNSCC cells. Consistent with the inhibitory effect of miR-3666 on PFKFB3, miR-3666 overexpression significantly suppressed F2,6BP production (Figure 5A). Furthermore, glucose uptake and lactate production were markedly reduced in FaDu and Cal27 cells transfected with miR-3666 mimics (Figure 5B and C). In addition, miR-3666 overexpression also significantly lowered the extracellular acidification rate (ECAR), an indicator of overall glycolytic flux, and promoted the oxygen consumption rate (OCR), which reflects mitochondrial oxidative respiration (Figure 5D and E). All these results revealed the suppression of glycolysis by miR-3666 overexpression. We next explored whether suppression of glycolysis by miR-3666 inhibits the proliferation of HNSCC cells. The results showed that 2-deoxy-d-glucose (2-DG), an inhibitor of glycolysis, abrogated the ability of miR-3666 mimics to suppress the growth of HNSCC cells (Figure 5F), suggesting that suppression of glycolysis is critical for the inhibition of HNSCC cell growth by miR-3666.
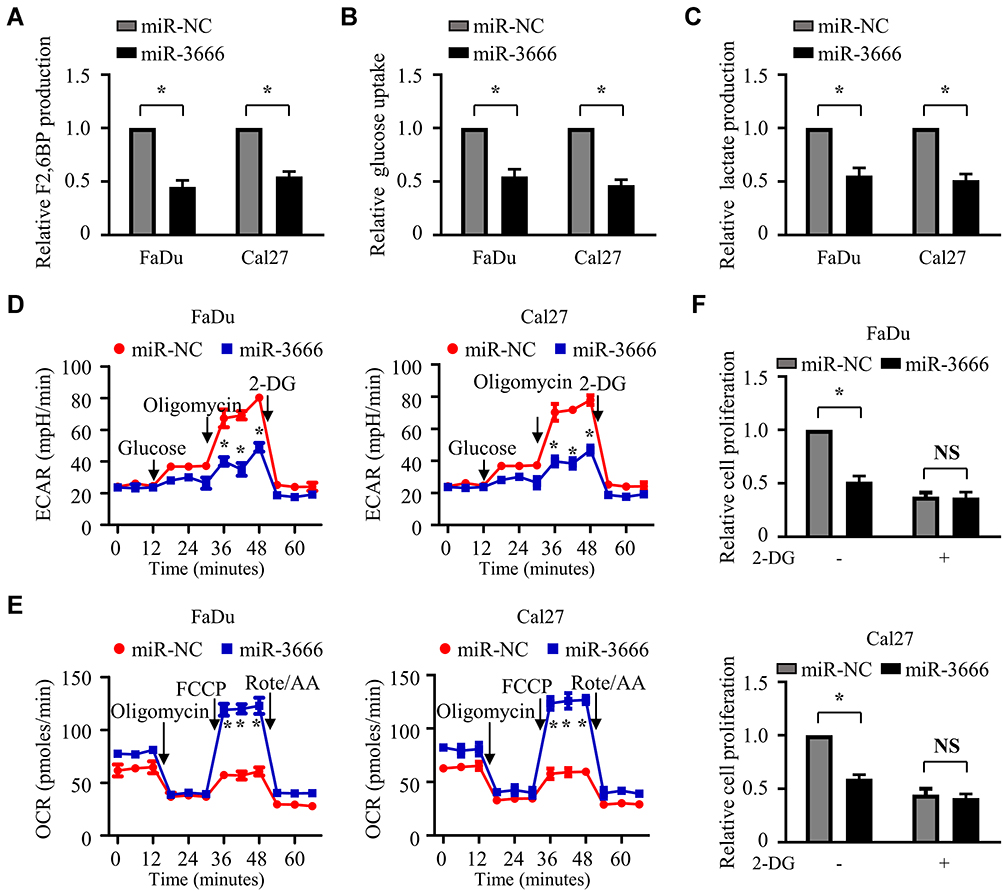 |
Figure 5 miR-3666 inhibits the growth of HNSCC cells via glycolysis suppression. (A) The measurement of intracellular F2,6P2 concentration in FaDu and Cal27 cells transfected with miR-NC or miR-3666. (B–E) FaDu and Cal27 cells were transfected with miR-NC or miR-3666. Forty-eight hours later, Glucose uptake (B), the production (C) of lactate, extracellular acidification rate (ECAR) (D) and oxygen consumption rate (OCR) (E) were analyzed. (F) FaDu and Cal27 cells transfected with miR-NC or miR-3666 were treated with or without 2.5 mM 2-DG and then used for CCK8 analysis. All data are shown as mean±SD of three separate experiments. *P<0.05; NS, not significant. “FCCP” and “Rote/AA” are the abbreviations of fluoro-carbonyl cyanide phenylhydrazone and Rotenone–acetic acid, respectively. |
miR-3666 Lowers the Rate of Glycolysis and Suppresses the Growth of HNSCC Cells Through Inhibition of PFKFB3 Expression
To investigate whether PFKFB3 suppression is involved in the miR-3666 induced inhibition of glycolysis and anti-tumor effect, a rescue assay was performed by introducing the 3ʹUTR-deleted PFKFB3 plasmid into FaDu cells transfected with miR-NC or miR-3666. The results showed that the suppression of glucose uptake and lactate production caused by miR-3666 was significantly reversed by PFKFB3 overexpression (Figure 6A–C). Additionally, transfection with miR-3666 mimics reduced ECAR and increased OCR, whereas the introduction of PFKFB3 completely rescued the phenotypic alteration induced by miR-3666 overexpression (Figure 6D and E). Furthermore, the inhibitory effect of HNSCC cell growth produced by miR-3666 overexpression was markedly abrogated by PFKFB3 transfection, as assessed by the CCK8 assay (Figure 6F). Thus, these results indicate that miR-3666 reduces glycolysis and suppresses the growth of HNSCC cells by inhibition of PFKFB3 expression.
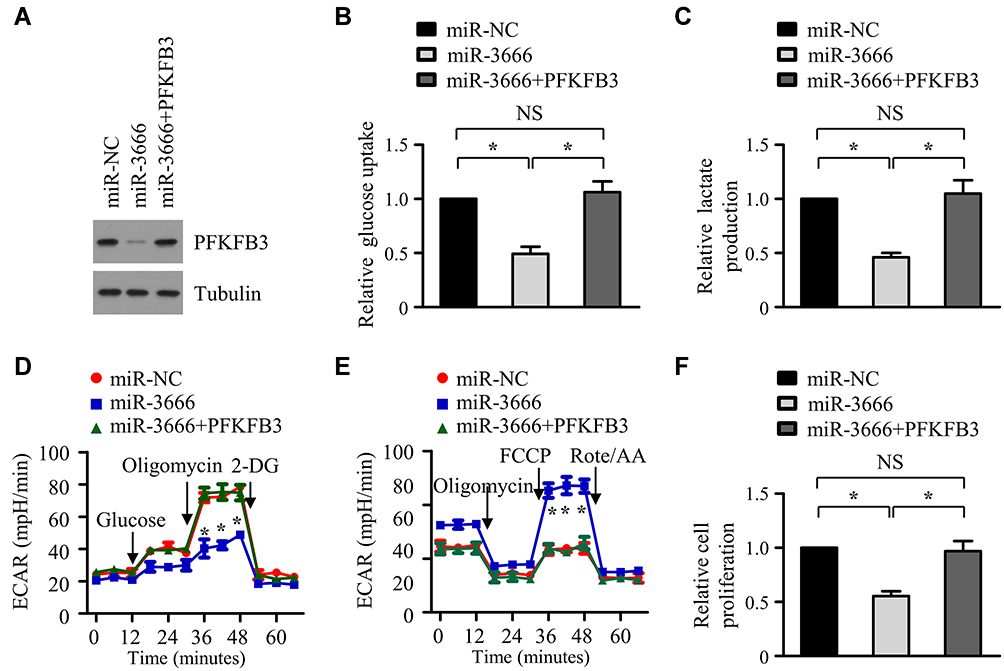 |
Figure 6 miR-3666 dampens glycolysis and suppresses the growth of HNSCC cells via inhibition of PFKFB3 expression. (A) Western blot analysis of PFKFB3 expression in FaDu cells co-transfected with miR-NC + pcDNA3.1 vector, miR-3666 + pcDNA3.1 vector or miR-3666 + pcDNA3.1-PFKFB3. Tubulin was used as a loading control. (B–E) FaDu cells were co-transfected with miR-NC + pcDNA3.1 vector, miR-3666 + pcDNA3.1 vector or miR-3666 + pcDNA3.1-PFKFB3. Forty-eight hours later, Glucose uptake (B), the production (C) of lactate, extracellular acidification rate (ECAR) (D) and oxygen consumption rate (OCR) (E) were analyzed. (F) FaDu cells were transfected as in (B). Forty-eight hours later, cell growth was detected with CCK8 assay. All data are shown as mean±SD of three separate experiments. *P<0.05; NS, not significant. “FCCP” and “Rote/AA” are the abbreviations of fluoro-carbonyl cyanide phenylhydrazone and Rotenone–acetic acid, respectively. |
Discussion
Numerous studies have demonstrated that dysregulation of miRNAs is implicated in the initiation and progression of various cancers, including HNSCC.28 Therefore, the discovery of miRNAs involved in HNSCC progression should facilitate the identification of novel biomarkers for clinical diagnosis and the development of an effective therapeutic strategy. Levels of miR-3666 are reduced in a variety of cancers, and miR-3666 exhibits a tumor suppressor role. Wang et al reported that miR-3666 showed a decreased expression in thyroid carcinoma tissues, and its overexpression significantly inhibited thyroid carcinoma cell growth.29 Besides, miR-3666 was shown to be downregulated in glioblastoma tissues and to suppress the growth of glioblastoma cells through the inhibition of Lysine-specific demethylase 2A (KDM2A).30 One recent study showed that miR-3666 suppressed the proliferation of non-small-cell lung cancer cells through the direct targeting of SIRT7.20 However, the expression status of the miR-3666 in HNSCC tissues and its function in HNSCC progression remains to be elucidated. In this study, we found that miR-3666 is downregulated in HNSCC cells and tissues. Functional experiments demonstrated that miR-3666 overexpression suppressed the growth of HNSCC cells, whereas its inhibition led to increased HNSCC cell growth. Our results indicate that miR-3666 functions as a tumor suppressor in HNSCC, which is consistent with its tumor suppressor role in other cancers.
Through in silico algorithmic analyses and experimental verification, we provided evidence that PFKFB3 is a direct target of miR-3666. As one key modulator of the Warburg effect, PFKFB3 promotes glycolysis by raising the intracellular steady-state concentration of F2,6P2, a compound that facilitates the activation of PFK-1, the main regulated enzyme of glycolysis.10 PFKFB3 has been found to be highly expressed in a variety of human cancers and to contribute to oncogenesis.4 As knowledge of the role of PFKFB3 in glycolysis and cancer progression has accumulated, chemical inhibitors targeting PFKFB3 have been developed. One of these, 3-(3-pyridinyl)-1-(4-pyridinyl)-2-propen-1-one (3PO), exhibits anti-tumor activity in multiple types of cancer, including hepatocellular carcinoma, bladder carcinoma, and breast cancer.31–33 Another such inhibitor, PFK15, a potent derivative of 3PO, suppresses tumor growth in HNSCC by blocking glycolysis,10 indicating that PFKFB3 contributes to HNSCC progression by promoting the Warburg effect. Consistent with the key role of PFKFB3 in glycolysis, we found that miR-3666 overexpression suppressed glucose uptake and lactate production, and led to a switch from glycolysis to mitochondrial respiration. Furthermore, we observed that inhibition of HNSCC cell growth caused by miR-3666 could be abrogated by the addition of 2-DG, the glycolytic inhibitor, revealing that miR-3666 inhibits cancer cell growth in HNSCC by depressing glycolysis. Although miR-3666 has been shown to promote carcinogenesis via multiple mechanisms,20,30 whether it is involved in cancer progression by regulating the Warburg effect remains unknown. This study provides the first evidence that miR-3666 represses HNSCC growth by modulating glycolysis.
Recent studies demonstrated that miRNAs could modulate the expression and oncogenic role of PFKFB3. miR-206 was shown to be down-regulated in breast cancers and suppressed cancer cell proliferation by inhibiting glycolysis through targeting of PFKFB3.34 miR-26b plays a tumor-suppressive role via the downregulation of PFKFB3 driven glycolysis in osteosarcoma cells.35 Our studies showed that miR-3666 abundance is negatively correlated with PFKFB3 expression in HNSCC tissues. Also, the inhibitory role of miR-3666 on glycolysis and HNSCC growth could be reversed by PFKFB3 overexpression, revealing that PFKFB3 mediates the function of miR-3666 in HNSCC. These studies indicate that PFKFB3 undergoes epigenetic regulation by miRNAs, which is vital for tumorigenesis. In addition, PFKFB3 was reported to promote tumor metastasis in HNSCC; whether miR-3666 exerts an inhibitory effect on HNSCC metastasis deserves further investigation.
Conclusion
This study shows that miR-3666 is downregulated in HNSCC tissues and functions as a tumor suppressor. Mechanistically, miR-3666 suppresses the levels of PFKFB3 mRNA by binding to its 3ʹ UTR. By directly targeting PFKFB3, miR-3666 exerts an inhibitory effect on glycolysis, resulting in the suppression of HNSCC growth. These findings provide novel insights into the molecular basis underlying HNSCC progression and form a theoretical basis for the application of miR-3666 to the treatment of HNSCC.
Abbreviations
miRNAs, microRNAs; HNSCC, head and neck squamous cell carcinoma; PFK-1, 6-phosphofructo-1-kinase; PFKFB3, phosphofructokinase-2/fructose-2, 6-bisphosphatase 3; 3ʹ-UTR, the 3ʹ-untranslated region.
Data Sharing Statement
The datasets generated and analyzed in the present study are available from the corresponding author Yu Cao on reasonable request.
Ethics Approval and Consent to Participate
The present study was approved by the Ethics Committee of the Affiliated Hospital of Guiyang Medical University and conducted according to the principles expressed in the Declaration of Helsinki. Each patient was provided with the written informed consent.
Author Contributions
All authors contributed to data analysis, drafting or revising the article, gave final approval of the version to be published, and agree to be accountable for all aspects of the work.
Disclosure
The authors declare that they have no competing interests.
References
1. Siegel RL, Miller KD, Jemal A. Cancer statistics, 2016. CA Cancer J Clin. 2016;66:7–30. doi:10.3322/caac.21332
2. Marur S, Forastiere AA. Head and neck squamous cell carcinoma: update on epidemiology, diagnosis, and treatment. Mayo Clin Proc. 2016;91:386–396. doi:10.1016/j.mayocp.2015.12.017
3. Li L, Liang Y, Kang L, et al. Transcriptional regulation of the warburg effect in cancer by SIX1. Cancer Cell. 2018;33:368–385.e367. doi:10.1016/j.ccell.2018.01.010
4. Shi L, Pan H, Liu Z, Xie J, Han W. Roles of PFKFB3 in cancer. Signal Transduct Target Ther. 2017;2:17044. doi:10.1038/sigtrans.2017.44
5. Bartrons R, Rodriguez-Garcia A, Simon-Molas H, Castano E, Manzano A, Navarro-Sabate A. The potential utility of PFKFB3 as a therapeutic target. Expert Opin Ther Targets. 2018;22:659–674. doi:10.1080/14728222.2018.1498082
6. O’Neal J, Clem A, Reynolds L, et al. Inhibition of 6-phosphofructo-2-kinase (PFKFB3) suppresses glucose metabolism and the growth of HER2+ breast cancer. Breast Cancer Res Treat. 2016;160:29–40. doi:10.1007/s10549-016-3968-8
7. Han J, Meng Q, Xi Q, Wang H, Wu G. PFKFB3 was overexpressed in gastric cancer patients and promoted the proliferation and migration of gastric cancer cells. Cancer Biomark. 2017;18:249–256. doi:10.3233/CBM-160143
8. Han J, Meng Q, Xi Q, et al. Interleukin-6 stimulates aerobic glycolysis by regulating PFKFB3 at early stage of colorectal cancer. Int J Oncol. 2016;48:215–224. doi:10.3892/ijo.2015.3225
9. Rodriguez-Garcia A, Samso P, Fontova P, et al. TGF-beta1 targets Smad, p38 MAPK, and PI3K/Akt signaling pathways to induce PFKFB3 gene expression and glycolysis in glioblastoma cells. FEBS J. 2017;284:3437–3454. doi:10.1111/febs.14201
10. Li HM, Yang JG, Liu ZJ, et al. Blockage of glycolysis by targeting PFKFB3 suppresses tumor growth and metastasis in head and neck squamous cell carcinoma. J Exp Clin Cancer Res. 2017;36:7. doi:10.1186/s13046-016-0481-1
11. Yang JG, Wang WM, Xia HF, et al. Lymphotoxin-alpha promotes tumor angiogenesis in HNSCC by modulating glycolysis in a PFKFB3-dependent manner. Int J Cancer. 2019;145:1358–1370. doi:10.1002/ijc.32221
12. Huang W. MicroRNAs: biomarkers, diagnostics, and therapeutics. Methods Mol Biol. 2017;1617:57–67.
13. Goeman F, Strano S, Blandino G. MicroRNAs as key effectors in the p53 network. Int Rev Cell Mol Biol. 2017;333:51–90.
14. Rupaimoole R, Slack FJ. MicroRNA therapeutics: towards a new era for the management of cancer and other diseases. Nat Rev Drug Discov. 2017;16:203–222. doi:10.1038/nrd.2016.246
15. Darda L, Hakami F, Morgan R, Murdoch C, Lambert DW. Hunter KD: the role of HOXB9 and miR-196a in head and neck squamous cell carcinoma. PLoS One. 2015;10:e0122285. doi:10.1371/journal.pone.0122285
16. Lu S, Zhou C, Zou B, Zhang H, Feng M. MiR-4295 facilitates cell proliferation and metastasis in head and neck squamous cell carcinoma by targeting NPTX1. Genes Immun. 2019.
17. Vahabi M, Pulito C, Sacconi A, et al. miR-96-5p targets PTEN expression affecting radio-chemosensitivity of HNSCC cells. J Exp Clin Cancer Res. 2019;38:141. doi:10.1186/s13046-019-1119-x
18. Guo LM, Ding GF, Xu W, et al. MiR-135a-5p represses proliferation of HNSCC by targeting HOXA10. Cancer Biol Ther. 2018;19:973–983. doi:10.1080/15384047.2018.1450112
19. Li D, Li L. MicroRNA3666 inhibits breast cancer cell proliferation by targeting sirtuin 7. Mol Med Rep. 2017;16:8493–8500. doi:10.3892/mmr.2017.7603
20. Shi H, Ji Y, Zhang D, Liu Y, Fang P. MicroRNA-3666-induced suppression of SIRT7 inhibits the growth of non-small cell lung cancer cells. Oncol Rep. 2016;36:3051–3057. doi:10.3892/or.2016.5063
21. Pan L, Tang Z, Pan L, Tang R. MicroRNA-3666 inhibits lung cancer cell proliferation, migration, and invasiveness by targeting BPTF. Biochem Cell Biol. 2019;97(4):415–422. doi:10.1139/bcb-2018-0301
22. Yan F, Tu Z, Duan L, Wang D, Lin F. MicroRNA-383 suppresses cell proliferation and invasion in colorectal cancer by directly targeting paired box 6. Mol Med Rep. 2018;17:6893–6901. doi:10.3892/mmr.2018.8682
23. Li L, Han LY, Yu M, Zhou Q, Xu JC, Li P. Pituitary tumor-transforming gene 1 enhances metastases of cervical cancer cells through miR-3666-regulated ZEB1. Tumour Biol. 2015.
24. Livak KJ, Schmittgen TD. Analysis of relative gene expression data using real-time quantitative PCR and the 2(-Delta Delta C(T)) method. Methods. 2001;25:402–408. doi:10.1006/meth.2001.1262
25. Chen L, Cao Y, Rong D, Wang Y, Cao Y. MicroRNA-605 functions as a tumor suppressor by targeting INPP4B in melanoma. Oncol Rep. 2017;38(2):1276–1286. doi:10.3892/or.2017.5740
26. Van Schaftingen E, Lederer B, Bartrons R, Hers HG. A kinetic study of pyrophosphate: fructose-6-phosphate phosphotransferase from potato tubers. Application to a microassay of fructose 2,6-bisphosphate. Eur J Biochem. 1982;129:191–195. doi:10.1111/j.1432-1033.1982.tb07039.x
27. Wilkie MD, Lau AS, Vlatkovic N, Jones TM, Boyd MT. Metabolic signature of squamous cell carcinoma of the head and neck: consequences of TP53 mutation and therapeutic perspectives. Oral Oncol. 2018;83:1–10. doi:10.1016/j.oraloncology.2018.05.018
28. Koshizuka K, Hanazawa T, Fukumoto I, Kikkawa N, Okamoto Y, Seki N. The microRNA signatures: aberrantly expressed microRNAs in head and neck squamous cell carcinoma. J Hum Genet. 2017;62:3–13. doi:10.1038/jhg.2016.105
29. Wang G, Cai C, Chen L. MicroRNA-3666 regulates thyroid carcinoma cell proliferation via MET. Cell Physiol Biochem. 2016;38:1030–1039. doi:10.1159/000443054
30. Shou T, Yang H, Lv J, Liu D, Sun X. MicroRNA3666 suppresses the growth and migration of glioblastoma cells by targeting KDM2A. Mol Med Rep. 2019;19:1049–1055. doi:10.3892/mmr.2018.9698
31. Clem B, Telang S, Clem A, et al. Small-molecule inhibition of 6-phosphofructo-2-kinase activity suppresses glycolytic flux and tumor growth. Mol Cancer Ther. 2008;7:110–120. doi:10.1158/1535-7163.MCT-07-0482
32. Lea MA, Altayyar M, desBordes C. Inhibition of growth of bladder cancer cells by 3-(3-Pyridinyl)-1-(4-pyridinyl)-2-propen-1-one in combination with other compounds affecting glucose metabolism. Anticancer Res. 2015;35:5889–5899.
33. Pisarsky L, Bill R, Fagiani E, et al. Targeting metabolic symbiosis to overcome resistance to anti-angiogenic therapy. Cell Rep. 2016;15:1161–1174. doi:10.1016/j.celrep.2016.04.028
34. Ge X, Lyu P, Cao Z, et al. Overexpression of miR-206 suppresses glycolysis, proliferation and migration in breast cancer cells via PFKFB3 targeting. Biochem Biophys Res Commun. 2015;463:1115–1121. doi:10.1016/j.bbrc.2015.06.068
35. Zheng WD, Zhou FL, Lin N. MicroRNA-26b inhibits osteosarcoma cell migration and invasion by down-regulating PFKFB3 expression. Genet Mol Res. 2015;14:16872–16879. doi:10.4238/2015.December.14.14
 © 2020 The Author(s). This work is published and licensed by Dove Medical Press Limited. The
full terms of this license are available at https://www.dovepress.com/terms
and incorporate the Creative Commons Attribution
- Non Commercial (unported, 3.0) License.
By accessing the work you hereby accept the Terms. Non-commercial uses of the work are permitted
without any further permission from Dove Medical Press Limited, provided the work is properly
attributed. For permission for commercial use of this work, please see paragraphs 4.2 and 5 of our Terms.
© 2020 The Author(s). This work is published and licensed by Dove Medical Press Limited. The
full terms of this license are available at https://www.dovepress.com/terms
and incorporate the Creative Commons Attribution
- Non Commercial (unported, 3.0) License.
By accessing the work you hereby accept the Terms. Non-commercial uses of the work are permitted
without any further permission from Dove Medical Press Limited, provided the work is properly
attributed. For permission for commercial use of this work, please see paragraphs 4.2 and 5 of our Terms.