Back to Journals » OncoTargets and Therapy » Volume 13
Metformin Promotes Beclin1-Dependent Autophagy to Inhibit the Progression of Gastric Cancer
Authors Liu S, Yue C, Chen H, Chen Y, Li G
Received 13 December 2019
Accepted for publication 26 March 2020
Published 19 May 2020 Volume 2020:13 Pages 4445—4455
DOI https://doi.org/10.2147/OTT.S242298
Checked for plagiarism Yes
Review by Single anonymous peer review
Peer reviewer comments 2
Editor who approved publication: Dr Federico Perche
Su Liu, 1 Chao Yue, 1 Huanqiu Chen, 1 Yun Chen, 2 Gang Li 1
1Department of General Surgery, Jiangsu Cancer Hospital & Jiangsu Institute of Cancer Research & The Affiliated Cancer Hospital of Nanjing Medical University, Nanjing, Jiangsu 210009, People’s Republic of China; 2Department of Immunology, Key Laboratory of Immune Microenvironment and Disease, Nanjing Medical University, Nanjing, Jiangsu 211166, People’s Republic of China
Correspondence: Gang Li
Department of General Surgery, Jiangsu Cancer Hospital & Jiangsu Institute of Cancer Research & The Affiliated Cancer Hospital of Nanjing Medical University, Nanjing, Jiangsu 210009, People’s Republic of China
Tel +862583284745
Email [email protected]
Yun Chen
Department of Immunology, Key Laboratory of Immune Microenvironment and Disease, Nanjing Medical University, Nanjing, Jiangsu 211166, People’s Republic of China
Email [email protected]
Background: Metformin is the first-line blood sugar control drug for type 2 diabetes, but recent epidemiological studies have shown that it inhibits the growth of a variety of tumours. However, few studies have examined metformin effects on gastric cancer (GC), and the anticancer mechanism has not been fully elucidated.
Materials and Methods: We examined the inhibitory effect of metformin on GC cells by cell proliferation, migration and invasion assay. Transmission electron microscopy, confocal microscopy and Western blotting confirmed that metformin enhanced beclin1-dependent autophagy in gastric cancer cells. TCGA database and tissue chip analysis confirmed the differential expression of beclin1 in GC and adjacent tissues. Relevant functional tests verified the role of beclin1 as a tumour suppressor gene in GC. Western blotting, cell proliferation, cell migration and invasion were used to verify that metformin enhances autophagy in GC cells through the AMPK-mTOR signalling pathway. Xenograft tumour models were constructed to explore the inhibitory effect of metformin and the role of beclin1 as a suppressor on GC in vivo.
Results: In this study, we observed that metformin inhibits proliferation, migration and invasion of GC cells. Metformin could also promote beclin1-dependent autophagy in GC cells. We further discovered that beclin1 expression was downregulated in GC and that its low expression was associated with poor prognosis. Beclin1 acts as a tumour suppressor that inhibits the malignant phenotypes of GC cells in vitro and in vivo. Furthermore, we verified that metformin can upregulate beclin1-mediated autophagy to inhibit GC cells through the AMPK-mTOR signalling pathway.
Conclusion: In summary, the results revealed the role of autophagy in metformin inhibition of gastric cancer and suggest that beclin1 may be a potential target for gastric cancer therapy.
Keywords: metformin, gastric cancer, GC, autophagy, beclin1, AMPK-mTOR signalling pathway
Corrigendum for this paper has been published
Introduction
Gastric cancer (GC) ranks fifth in global cancer incidence and third in cancer-related mortality according to GLOBOCAN 2018 data.1 Despite recent progress in surgical techniques and diagnostic methods, the overall prognosis of GC remains poor, and the disease continues to be a serious threat to people’s lives. Seeking new therapeutic methods and targets is therefore very important to improve the prognosis of GC. Previous studies have shown that the duration use of metformin, a first-line blood sugar control drug for type 2 diabetes with excellent safety, efficacy and tolerability, is significantly associated with a reduced risk of GC in patients with type 2 diabetes treated with metformin alone.2,3 Numerous studies have shown that metformin inhibits a variety of malignancies, including bladder cancer,4 pancreatic cancer,5 head and neck squamous cell carcinoma,6 and ovarian cancer.7 However, few studies have examined metformin effects on GC, and the potential anticancer mechanism of metformin has not been fully elucidated.
One possibility is that metformin may affect autophagy, a highly conserved process of catabolism and energy production that promotes the degradation of damaged organelles and intracellular components to provide cells with the ability to synthesise new components.8 Dysregulation of autophagy is usually associated with cell death and pathological conditions, and the involvement of autophagy in many diseases suggests a role in the development of cancer.9,10 Recent research focused on autophagy indicates that it plays a dual role in the development of malignant tumours.11,12 Some researchers believe that autophagy can inhibit tumours, while others believe that autophagy can promote malignant tumours. In the present study, we speculated that metformin could inhibit GC through autophagy, and we further explored its potential regulatory mechanism by focusing on beclin1, a homologous gene of the yeast autophagy gene atg6 that plays an important part in autophagy. This gene can mediate the localisation of other autophagy proteins in autophagic vesicles, thereby regulating the formation of autophagosomes.13,14 We therefore explored the role of beclin1 in GC, recognized that it could provide a new target for exploring the treatment of GC.
In this study, we analysed the inhibitory effect of metformin on GC cells in vivo and in vitro, and found that beclin1-dependent autophagy was enhanced by metformin. Besides, through the TCGA database and tissue chip analysis, we found that beclin1 expression was decreased in GC tissues. We also found that beclin1 could inhibit the proliferation, invasion and migration of GC cells. In terms of a disease mechanism, we revealed that metformin initiated autophagy of GC cells through the AMPK-mTOR signalling axis, thereby playing an inhibitory role in GC. In conclusion, our results reveal that metformin inhibits GC through beclin1-dependent autophagy and that beclin1 may be a new therapeutic target for the treatment of GC.
Materials and Methods
Cell Culture and Small Interfering RNA Transfection
Human gastric cancer (GC) cell lines (MKN45, HGC27, SGC7901, BGC823, N87, SNU216 and MGC803) were purchased from the Cell Centre of the Chinese Academy of Sciences (Shanghai, China). Cells were cultured in RPMI-1640 (Invitrogen, Carlsbad, CA, USA) containing 10% heat-inactivated foetal bovine serum (FBS) (Invitrogen), 100 U/mL penicillin and 100 ng/L streptomycin and incubated in a 5% carbon dioxide humidified atmosphere at 37°C. Experiments were performed using cells in the logarithmic phase of growth. Small interfering RNA (siRNA) targeting beclin1 was purchased from Genepharma (Shanghai, China). The primer sequences of the beclin1 siRNAs were 5′‐CTCACAGCTCCATTACTTA‐3′ (beclin1‐KD1) and 5′‐TCAGGAGAGGAGCCATTTA‐3′ (beclin1‐KD2); negative control siRNAs were provided by the same manufacturer. The SNU216 cells were cultured in six-well plates to 60–70% confluence and then transfected with Lipofectamine 3000 (Invitrogen), according to the manufacturer’s protocol. The complete medium containing 1 μg/mL of puromycin (Gibco, Grand Island, NY, USA) was used to select the beclin1 knockdown cell lines.
Lentiviral Vector-Mediated Belcin1 Overexpression
The MGC803 cells were transfected with commercially synthesised beclin1 overexpression lentiviral vectors (Genepharma) or negative control lentiviral vectors (Genepharma), at a multiplicity of infection (MOI) of 100, by incubation at 37°C in a cell incubator for 2 d. Puromycin (Gibco) was also used to select beclin1 overexpression cell lines. The expression of beclin1 protein in cells was detected by Western blotting.
Cell Viability Assay and Colony Formation
In total, 2 × 10³ cells were seeded per well (100 μL) in a 96-well plate under the desired treatment conditions. The viability of GCs was tested with the cell counting kit-8 (CCK-8; Bimake, Shanghai, China) or the CellTiter-Glo Luminescent Cell Viability Assay (Promega, Madison, WI, USA), according to the manufacturers’ instructions. Colony formation was assayed by seeding approximately 200 cells in each well of 6-wells plates under the desired conditions for 8–10 days. The cells were washed, fixed and stained and the numbers of colonies were counted (a colony was designated as having more than 50 cells). We used crystal violet (KeyGen, Nanjing, China) to make stained colonies easier to detect. Each experiment was repeated three times.
Cell Migration and Invasion Assay
Cell invasion assays were conducted in 24-well transwell units (BD Biosciences, Franklin Lakes, NJ, USA) with 8 μm pores. The transwell membranes were coated Matrigel for cell invasion assays, while chambers without Matrigel‐coated membranes were used for cell migration assays. The GC cells (1–2 × 10⁵) in approximately 300 μL of RPMI 1640 medium without foetal bovine serum were added to the upper chamber. The lower chambers were filled with 700 μL RPMI-1640 medium containing 10% foetal bovine serum as a chemoattractant. After incubation for 24–48 h, the cells on the bottom of chambers were stained with 0.5% crystal violet (KeyGen). A sterile cotton swab was used to remove any remaining cells in the top chamber. The invading or migrating cells on the bottom of chambers were counted and imaged by light microscopy (Olympus, Tokyo, Japan). The average number of cells in the five regions of each chamber were calculated.
Western Blotting
Protein expression was investigated using the Total Protein Extraction Kit (Thermo Fisher Scientific, Waltham, MA, USA) to dissociate cultured cells. After quantification of the proteins in cell lysates, 30 μg of protein was separated by 12% sodium dodecyl sulphate-polyacrylamide gel electrophoresis (SDS-PAGE) and electrophoretically transferred onto PVDF membranes (Millipore, Billerica, MA, USA). The membranes were blocked with 5% non-fat dry milk for 2 h at room temperature, followed by washing and incubation at 4°C overnight with the primary antibodies. The membranes were washed again and incubated with appropriate secondary antibodies (1:5000 dilution; Jackson ImmunoResearch, PA, USA) for 2 h. The protein bands were analysed with a GE Amersham Imager 600 (GE, USA).
Immunohistochemistry (IHC) Analysis
Gastric cancer tissue microarrays were purchased from Alenabio (Xi’an, China). These arrays included tissues from 50 patients with GC, with 2 cancer tissues and 1 para-cancer tissue from each patient. The GC tissue microarray slides were subjected to conventional deparaffinising and rehydration and then the citrate method was used to restore the antigen in the nucleus by microwaving at high heat for 5 minutes. The slides were then blocked in normal goat serum with 5% BSA in Tris-buffered saline (TBS) and incubated with anti-belin1 (1:100 dilutions) at 4 °C overnight, followed by three washes with phosphate buffered saline (PBS) and incubation with secondary antibodies at room temperature for 1 h. A DAB kit (Vector Laboratories, CA, USA) was used to investigate the immunohistochemical reactions. The slides were photographed using a phase contrast light microscope (Olympus IX73, Japan). The tissue microarray immunohistochemical staining was evaluated by two experienced pathologists.
The immunohistochemical staining results were comprehensively evaluated to determine the proportion of stained cells and the intensity of staining. Beclin1-positive expressions were defined as cells showing brown staining in the cytoplasm. The staining index (values from 0–12) was used to evaluate the immunohistochemical results and was determined by multiplying the score for staining intensity with the score for the positive area. The scores for staining intensity were as follows: negative = 0; weak = 1; moderate = 2; strong = 3. The scoring criteria for the proportion of positive cells was as follows: less than 5% = 0; 5–25% = 1; 26– 50% = 2; 51–75% = 3; more than 75% = 4. Low expression was defined as a score less than or equal to 7, whereas a score greater than 7 was considered to indicate high expression.
Electron Microscopy
The cells collected after various treatments were fixed in 2.5% glutaraldehyde at 4 °C overnight and then washed with 0.1 M sodium cacodylate buffer. The cells were then post-fixed with 1% osmium tetroxide, followed by dehydration in an alcohol series and resin embedding. Ultrathin sections (80–100nm) were stained with uranyl acetate and lead citrate and were observed with a Tecnai G220TwN transmission electron microscope at 200kv.
Xenograft Tumour Model
The inhibitory effect of metformin on GC in vivo was determined using a mouse xenograft tumour model. All experiments involving animals were conducted in accordance with the operation procedures approved by the Institutional Committee of Nanjing Medical University for Animal Research. Male nude mice (5–6 weeks old) were randomly divided into 2 groups, with 5 mice per group. The first group received subcutaneous injections into the dorsal flank with 100 µL PBS containing 8.0 × 10⁶ MGC803 cells and daily injections of normal saline (100 μL). The second group received MGC803 cell injections and daily metformin (300 mg/kg) treatment. The metformin treatment started on the third day after inoculation of the GC cells and lasted for 4 weeks. Digital callipers were used to measure the growth of the tumour every three days, and the formula (volume = 0.5 × width2 × length) was used to calculate the tumour volume.
Reagents
Metformin, which was purchased from MCE (Greenville, SC, USA), was dissolved in PBS to make a 1 M stock solution. Compound-c, an inhibitor of AMPK, was purchased from Selleck Chemicals (USA). The primary antibodies for use in Western blotting for phospho-AMPK (Thr172) (2535T), AMPK (5831T), phospho-mTOR (Ser2481) (2974), mTOR (2983), β-actin (4970) and beclin1 (3495), as well as LC3 (12741), were purchased from Cell Signaling Technology (Danvers, MA, USA). Beclin1 antibody for immunohistochemistry was obtained from Proteintech Group Inc. (Wuhan, China).
Statistical Analysis
SPSS ver. 19.0 (SPSS, Chicago, IL, USA) and GraphPad prism software (San Diego, CA, USA) were used for data analysis and processing. All experimental data were presented as mean ± standard error of the mean (SEM), and the statistical analysis between groups was implemented with Tukey’s test or Student’s t-test. Values of P < 0.05 were considered statistically significant.
Results
Metformin Inhibits Proliferation, Migration and Invasion of Gastric Cancer Cells
We confirmed the effect of metformin on GC in vitro in MGC803 and SNU216 GC cells. Cell proliferation was significantly inhibited 72 h after treatment with 2, 5 or 10 mM metformin when compared to untreated control cells. Metformin significantly decreased cell viability, as determined by CellTiter-Glo assays (Figure 1A). Similar results were obtained for cell colony formation by MGC803 and SNU216 cells, as the numbers of visible colonies were significantly decreased with increasing concentrations of metformin (Figure 1B). Treatment of the GC cells with 0, 5 or 10 mM metformin for 48 h resulted in significant inhibition of the migration and invasion of both cell types (Figure 1C and D), suggesting that metformin inhibited the proliferation, migration and invasion of GC cells.
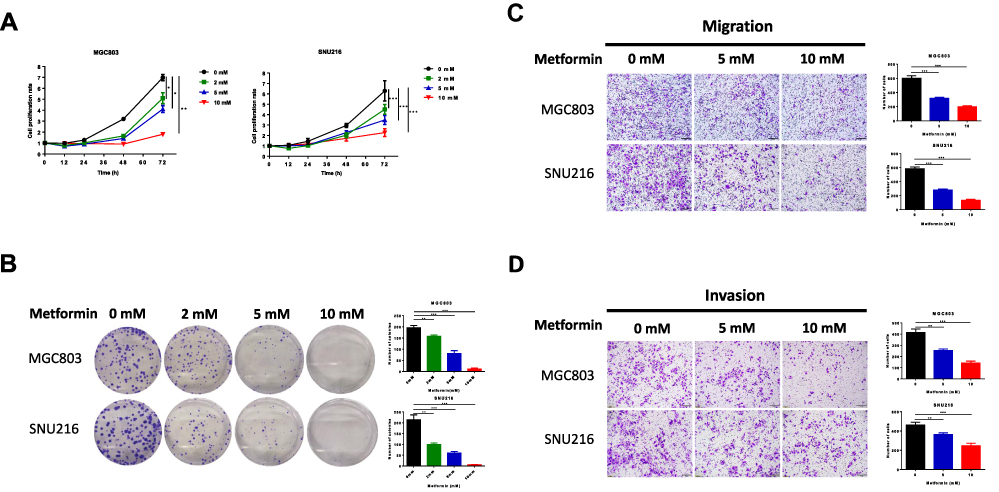 |
Figure 1 Metformin inhibits cell proliferation, migration and invasion of human gastric cancer cells. (A) The CellTiter-Glo assay was used to determine cell viability of MGC803 and SNU216 at 12, 24, 48 and 72 h after treatment with 0, 2, 5 and 10 mM metformin. (B) The proliferation of MGC803 and SNU216 cells was tested by cell colony formation after treatment with 0, 2, 5 and 10mM metformin for 10 days. (C and D) Transwell assays of migration and invasion of GC cells after treatment with 0, 5 and 10 mM metformin. (*P < 0.05, **P < 0.01 and ***P < 0.001). |
Metformin Inhibits Gastric Cancer Cell Growth by Induction of Autophagy
Dysregulated autophagy is usually associated with cell death and pathological states. Autophagy is involved in many diseases and especially in the development of cancer.9,10 Therefore, we investigated the potential contribution of metformin-induced autophagy to the regression of GC growth. We examined the formation of beclin1 and LC3-II, two key biomarkers of autophagy, in the two GC cell lines by Western blotting. As expected, metformin treatment increased LC3-II accumulation and protein expression of beclin1 in MGC803 and SNU216 cells (Figure 2A and B). We constructed a lentivirus with a pH-sensitive LC-3 construct consisting of a tandem fusion of the acid-insensitive RFP and the acid-sensitive GFP in order to detect autophagic influx. When GFP fuses with lysosomes, it appears as yellow dots, which indicate autophagic influx. Consistently, we observed a notably increased yellow signal in MGC803 and SNU216 cells treated with metformin (Figure 2C and D). Transmission electron microscopy of autophagic flux in cells also confirmed that metformin treatment increased the numbers of autolysosomes with double-membrane vacuolar structures (Figure 2E and F). These results indicated that metformin could promote beclin1-dependent autophagy in GC cells.
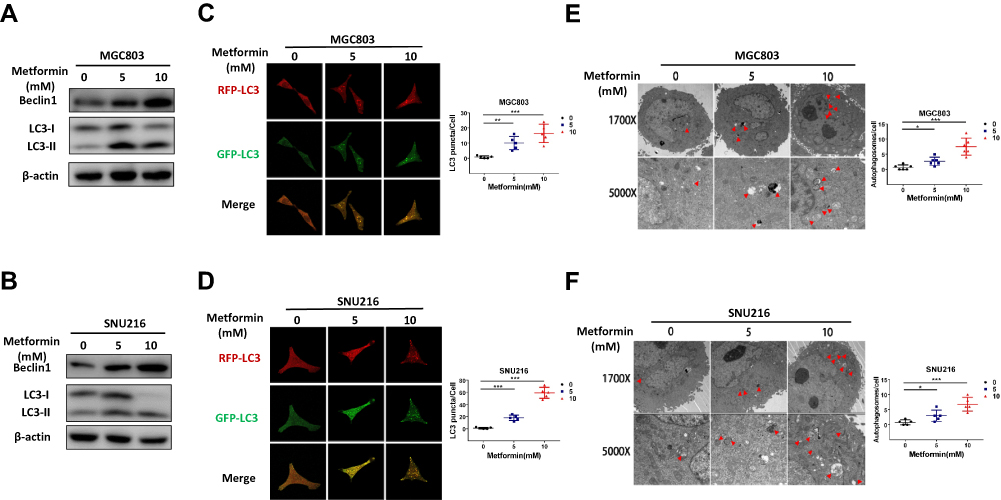 |
Figure 2 Metformin promotes autophagy activation in gastric cancer cells. (A and B) After MGC803 and SNU216 were treated with 0, 5 and 10 mM metformin for 24 h, the expression of the autophagy-related proteins beclin1 and LC3 were detected by Western blotting to demonstrate the effect of metformin. (C and D) The presentation of RFP-GFP-LC3 fusion protein in MGC803 and SNU216 after treatment with 0, 5 and 10 mM metformin for 24 h, as determined by confocal microscopy. (E and F) Transmission electron microscopy was used to evaluate autophagic vacuoles (AVs).MGC803 and SNU216 cells were treated with 0, 5 and 10 mM metformin for 24 h then analyzed by transmission electron microscopy. The area indicated by the red arrows is the autophagic vacuole (AV). Representative images and quantitative data are shown. The experiments were conducted in triplicate. The data are showed as the mean ± S.E.M and analysed with Student’s t-test. (*P < 0.05, **P < 0.01 and ***P < 0.001). |
Decreased Beclin1 Expression Is Correlated with the Occurrence of GC in Human Patients
Beclin1, one of the key molecules of autophagosome nucleation, is also a vitally important target for regulating autophagy.14 By analyzing the TCGA_STAD _exp_HiSeqV2-2015-05-07 dataset, we focused on 32 paired tissues (the tumour and paired normal gastric tissue from the same patient), the mean expression value of beclin1 was significantly downregulated in GC tissues compared to adjacent normal tissues (3.387±0.054 vs 3.42±0.029; p < 0.001) (Figure 3A). Immunohistochemical staining for detection of protein expression of beclin1 in GC tissue and adjacent para-tumour tissues using tissue chip arrays revealed lower expression of beclin1 in GC tissues than in adjacent para-tumour tissues (Figure 3B and C). We also examined the potential association between beclin1 expression and GC outcomes by conducting prognostic analyses with the Kaplan-Meier plotter (http://kmplot.com/analysis/), an integrated database of gene expression and related clinical information. Beclin1 expression was significantly correlated with the relapse-free survival (RFS) of the patients with GC (HR = 0.59 (0.49–0.7)) (Figure 3D). The RFS was significantly better in patients with high beclin1 expression than with low beclin1 expression. These results suggest that beclin1 expression was downregulated in GC and that its low expression was associated with poor prognosis. These findings also suggested that beclin1 may be a new target for the treatment and prognosis of patients with GC.
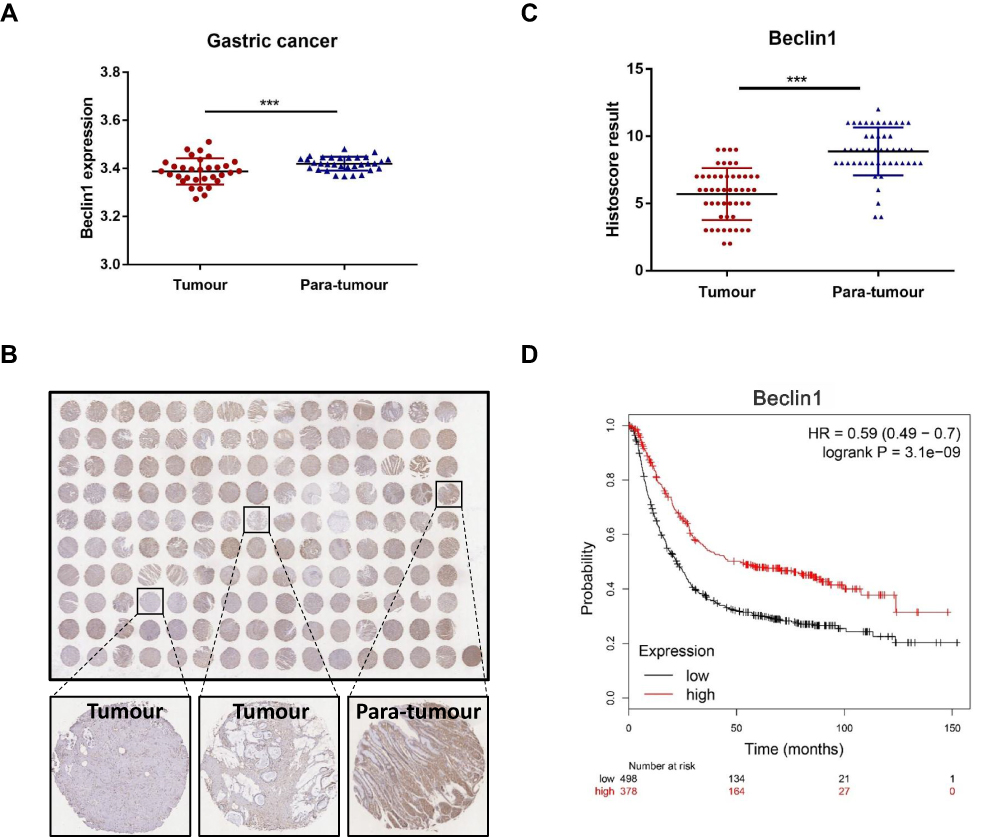 |
Figure 3 Decreased beclin1 expression is correlated with gastric cancer in human patients. (A) Analysis of the differential expression of beclin1 mRNA expression of 32 paired GC tissues (cancer and the adjacent normal tissue are from the same patient) using data from the TCGA database. (***p < 0.001) (B) GC tissue microarrays were used to detect protein levels of beclin1 in GC and adjacent tissues (n=50) by immunohistochemical staining. (C) The immunohistochemical scores in 50 pairs of GC tissues and adjacent normal tissues. The expression of beclin1 protein was lower in GC tissues than in adjacent normal tissues (***p < 0.001). (D) Prognostic study for the relapse-free survival curves of beclin1 in GC parents. |
Beclin1 Inhibits the Malignant Phenotypes of Gastric Cancer Cells in vitro
We first detected the expression of beclin1 in seven gastric cancer cell lines in our laboratory. Among the seven GC cell lines (MKN45, HGC27, SGC7901, BGC823, N87, SNU216 and MGC803), MGC803 showed significantly lower expression of beclin1 compared to other gastric cancer cell lines and was therefore selected for studies. In order to verify the function of Beclin1 in GC on the other hand, so we also chose SNU216 with high beclin1 expression for the following experiments. We successfully knocked down beclin1 expression in SNU216 with siRNAs. We also used lentiviral vectors to provide stable overexpression of beclin1 in MGC803 cells (Figure 4A). The overexpression of beclin1 in the MGC803 cells significantly reduced cell viability, as determined by CCK8 detection (Figure 4B), as well as the number of colonies formed (Figure 4C). Migration and invasion ability were similarly reduced, as determined by transwell experiments (Figure 4D and E). By contrast, the cell proliferation, migration and invasion ability were enhanced in SNU216 cells following knockdown of beclin1 (Figure 4B–E). Taken together, these findings suggest that beclin1 expression plays a crucial role in inhibiting the malignant phenotype of GC cells.
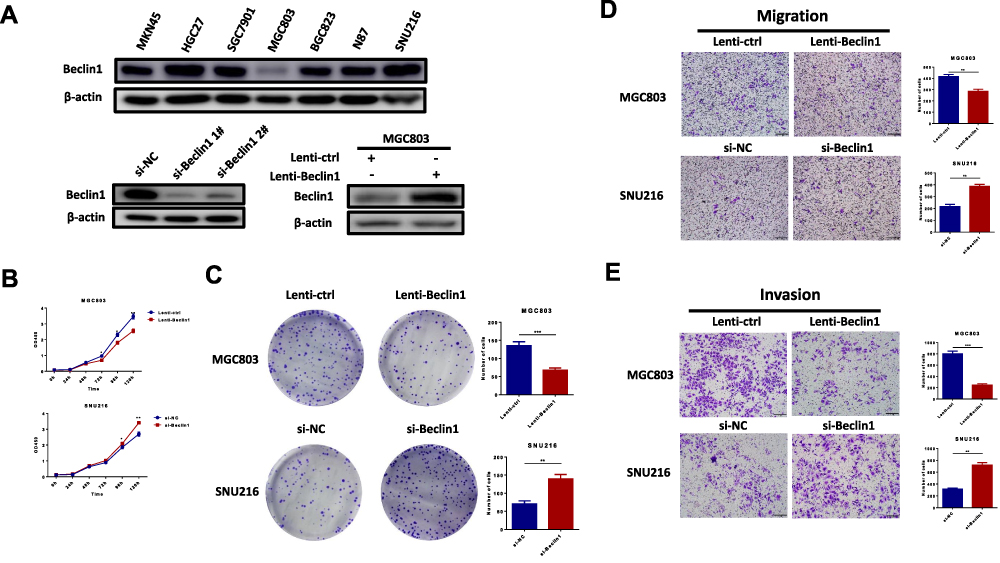 |
Figure 4 Beclin1 expression inhibits malignant phenotypes of gastric cancer cells in vitro. (A) The expression of beclin1 in 7 GC cell lines, SNU216 transfected with si-NC,si-beclin1 1# or si-beclin1 2# and MGC803 transfected with lenti-control or lenti-beclin1. (B and C) After transfection of MGC803 with lenti-control or lenti-beclin1 and transfection of SNU216 with si-NC or si-Beclin1, the cck8 assays and colony formation experiments were used to detect cell proliferation. (D and E) Transwell assays were used to assess migration and invasion capacity. Data are presented as the mean ± S.E.M. and analysed using independent samples Student’s t-test (*P < 0.05, **P < 0.01 and ***P < 0.001). |
Metformin Acts on Autophagy of Gastric Cancer Cells via the AMPK-mTOR Signalling Axis
Previous studies have shown that the AMPK-mTOR signal pathway plays an important part in the metformin regulation of glycometabolism.15–17 The AMPK-mTOR signal axis is also the main signalling axis of upstream autophagy regulation;18,19 therefore, we hypothesised that metformin could inhibit GC by upregulating the autophagy of GC cells via the AMPK-mTOR signalling axis. MGC803 were treated with 0, 5 and 10 mM metformin for 12 h. Western blot experiments revealed increased expression of phosphorylated AMPK and reduced expression of phosphorylated mTOR in response to metformin, whereas AMPK and mTOR showed no significant changes (Figure 5A).
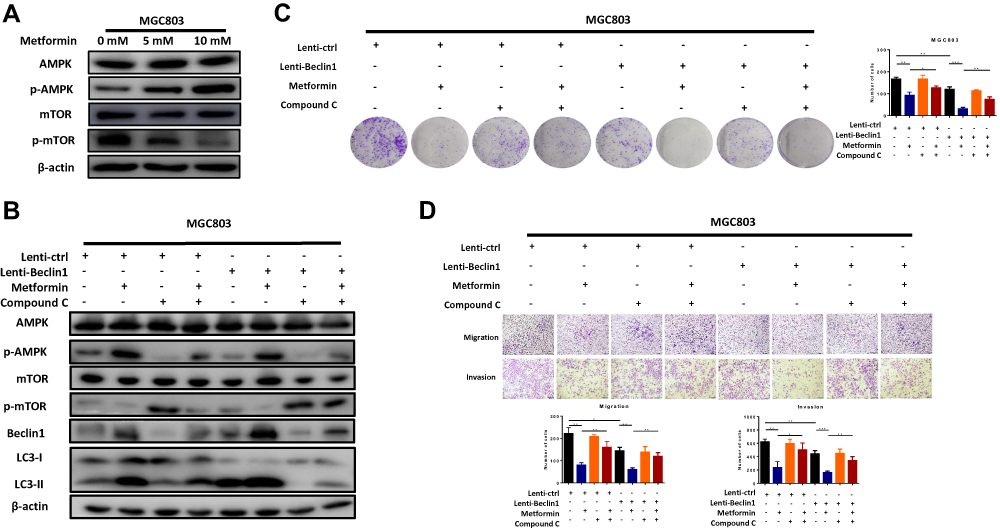 |
Figure 5 Metformin enhances Beclin1-dependent autophagy to inhibit gastric cancer through the AMPK/mTOR signalling axis. (A) The MGC803 cells were treated with metformin 0, 5 and 10 mM metformin for 48 h. Western blot analysis showed protein changes in the AMPK-mTOR signalling pathway. (B) Treatment with compound–c (an AMPK inhibitor) verified the AMPK-mTOR signal axis as a key pathway for the initiation of autophagy by metformin to inhibit GC. Western blots of MGC803 cells treated with compound-c (1µM) 2 h before treatment with 5mM metformin. (C and D) Colony formation, migration and invasion assays in MGC803 cells (*P < 0.05, **P < 0.01 and ***P < 0.001). |
The role of beclin1 in metformin-induced autophagy in GC cells was evaluated by transfecting MGC803 cells with a beclin1 lentiviral expression vector and then examining whether the AMPK-mTOR pathway is a key molecular pathway for metformin inhibition of GC cell autophagy. Compound–c (an AMPK inhibitor) was used to analyse the changes in the downstream signalling pathway and the autophagy of GC cells by Western blot experiments. As shown in figure, metformin activated autophagy through the AMPK-mTOR axis, as predicted. Compound-c treatment of the metformin treatment group significantly inhibited the AMPK-mTOR signalling pathway and decreased beclin1 expression and autophagy when compared with the group treated with metformin alone. (Figure 5B) Comparison with the untreated control group revealed that beclin1 overexpression could enhance autophagy, again supporting our prediction.
Colony formation (Figure 5C) and transwell assays (Figure 5D) also confirmed a mode of action of metformin involving the AMPK-mTOR signalling pathway. As expected, compound-c partially reversed the inhibitory effect of metformin on GC. And the role of beclin1 as a GC suppressor was further confirmed. In the absence of any treatment, beclin1 overexpression significantly inhibited the proliferation, migration and invasion of GC cells when compared with the control group. These results further confirmed that metformin can upregulate beclin1-mediated autophagy through the AMPK-mTOR signalling pathway.
Metformin Inhibits the Tumorigenesis of GC in vivo
The inhibitory effect of metformin on tumorigenesis of GC cells was further investigated in vivo by randomly dividing male nude mice (5–6 weeks old) into 2 groups of 5 mice. The first group (control) was injected subcutaneously with MGC803 cells but did not undergo metformin treatment. The second group was injected with MGC803 cells and received metformin. As shown in figure, metformin treatment significantly inhibited tumour growth when compared with the control group, in agreement with the in vitro results. (Figure 6A and B) The sizes and weights of the isolated tumours were obviously smaller in the metformin group than in the negative control group (Figure 6C and D). Immunohistochemistry of the GC tissues of each group revealed a significant increase in the protein expression of beclin1 expression after metformin treatment (Figure 6E), further confirming that metformin suppresses tumour progression by promoting beclin1-dependent autophagy in vivo. In summary, these results suggest that metformin promotes beclin1 expression and inhibits the growth of GC in vivo. Finally, we use a model to illustrate metformin activates autophagy to inhibit gastric cancer by activating AMPK and inhibiting the mTOR signalling pathway (Figure 6F).
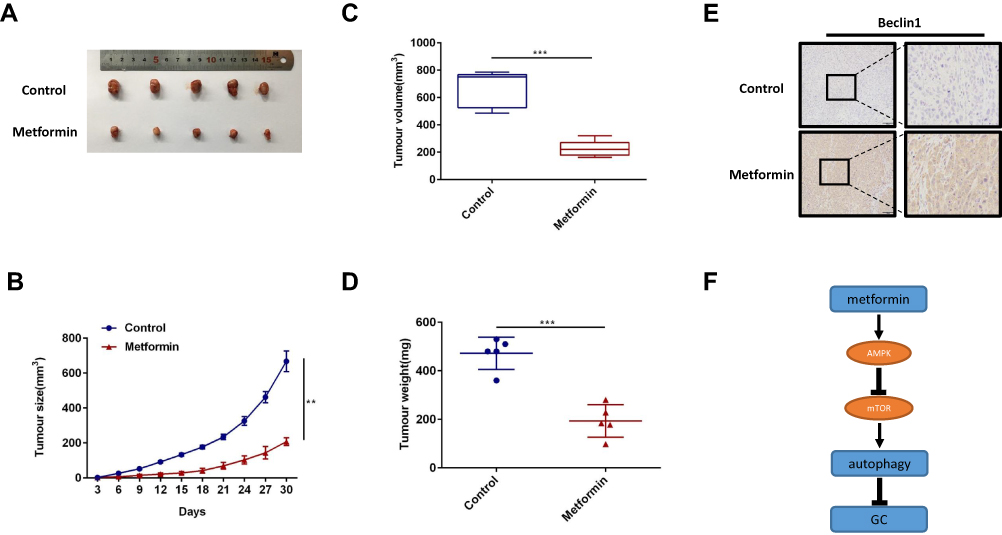 |
Figure 6 Metformin increases beclin1 expression in vivo. (A) The MGC803 cells were injected subcutaneously into the flanks of male nude mice (8 × 10⁶ cells per mouse) to establish a xenograft tumour model. The metformin treatment group was given 300 mg per day of metformin via intraperitoneal injection for 4 weeks, while the control group was given normal saline (100 μL). At 30 days, the mice were humanely euthanised, and the tumour tissue was removed and photographed. (B) Once the tumour were palpable, tumour sizes were measured every 3 days. (C) The volume of the isolated tumours were measured by calipers as shown. (D) The weight of the isolated tumours were measured as shown. (E) Representative images of immunohistochemical staining for beclin1 in each group. (F) Model for metformin activates autophagy to inhibit gastric cancer by activating AMPK and inhibiting the mTOR signalling pathway (**p < 0.01, ***p < 0.001 vs control). |
Discussion
Metformin, now a first-line drug for type 2 diabetes, has been used in the treatment of diabetes for more than half a century, and its safety and effectiveness have been fully verified.20 Previous population-based researches shown that patients with type 2 diabetes mellitus who use metformin as the sole drug have a significantly reduced risk of developing GC.2,3 Metformin also has the potential ability to inhibit a variety of other tumours;6,7,21 however, relatively few studies have focused on GC. Consequently, the mechanism by which metformin inhibits tumour activity in GC remains unclear. Autophagy is an indispensable cellular process and plays a part in normal cells, as well as in the progression of malignant tumours.8,11 We hypothesise that metformin inhibits GC through an activation of autophagy—a novel and as yet unexplored role for this drug.
In the present study, we verified that metformin could inhibit the proliferation, invasion and migration of GC cells. These results were further confirmed the inhibitory effect of metformin on GC. We also confirmed that metformin could induce autophagy in GC cells, as indicated by the increase in autophagosome production by transmission electron microscopy, the redistribution of GFP-RFP-LC3 by laser scanning confocal microscopy and the expression of LC3-II/I upregulation by Western blotting. During the development of autophagy, the LC3-II/I ratio is increased because LC3 binds to autophagosomes, followed by a gradual transformation of LC3-I into LC3-II.22 LC3 is the most commonly used marker to detect autophagy flux.8,23 When metformin was used to inhibit GC cell activities, we found that beclin1 expression was also increased.
Upon initiation of autophagy, beclin1 serves as a key protein that assembles cofactors to form a complex of BECN1-PIK3C3-PIK3R4 to promote the formation of autophagosomes.24,25 Beclin1 plays an important part in autophagy, as demonstrated in previous studies.25,26 The results of our TCGA database, tissue chip and prognosis analysis showed that beclin1 was usually downregulated in GC tissues and its downregulation was often accompanied with poor prognosis in human patients. Our results also revealed that beclin1 could inhibit the proliferation, invasiveness, migration and growth of GC in vivo and in vitro. These results are of great significance, as they suggest that beclin1 can determine prognosis and can serve as a potential therapeutic target for GC, thereby providing guidance for future research.
Our data indicate that metformin inhibits GC by inducing beclin1-dependent autophagy. The AMPK-mTOR pathway is an important pathway in metformin action on glucose metabolism as well as on anti-tumour processes.27–29 The AMPK-mTOR signalling axis is also important for regulating autophagy,30–32 so we speculated that this signalling pathway would be activated by metformin in a dose-dependent manner to induce autophagy. The results are in line with our predictions. The action of compound-c prevented the activity of this signalling pathway and inhibited downstream autophagy, as well as weakening the inhibitory effect of metformin on GC. Taken together, the findings reported here suggested that metformin inhibits GC through the AMPK-mTOR axis to promote beclin1-dependent autophagy. AICAR, another metformin like drug, which has been shown that it can be a good combination with mTOR inhibitor rapamycin in human cancer to inhibit the cancer cell proliferation.33 It has also been shown that AICAR (AMPK activator) induces autophagy by phosphorylating autophagy marker ULK1 whereas it also inhibits mTOR signalling by suppressing PLD-stimulated PA production.34 So we speculated that metformin may activate the autophagic kinase ULK1 to enhance autophagic flux, and this may contribute to suppression of PLD activity and inhibition of mTOR. The specific regulatory mechanism is worthy of further study. However, the mechanism of metformin inhibits GC needs to be further explored.
Conclusions
In summary, we found that metformin can inhibit the proliferation, invasion and metastasis of GC. Metformin inhibits GC by inducing beclin1-dependent autophagy through the AMPK-mTOR signalling pathway. Beclin1 therefore appears to play an anti-cancer role in GC. These findings suggest new therapeutic strategies for treating GC, and they may also provide a new avenue for accurate prediction and treatment of GC.
Funding
This work was supported by Jiangsu Provincial Medical Youth Talent (QNRC2016651), Jiangsu Provincial Key Research Development Program of China (BE2018750) and The Talents Program of Jiangsu Cancer Hospital.
Disclosure
The authors report no conflicts of interest in this work.
References
1. Bray F, Ferlay J, Soerjomataram I, Siegel RL, Torre LA, Jemal A. Global cancer statistics 2018: GLOBOCAN estimates of incidence and mortality worldwide for 36 cancers in 185 countries. CA Cancer J Clin. 2018;68(6):394–424. doi:10.3322/caac.21492
2. Dulskas A, Patasius A, Kaceniene A, Linkeviciute-Ulinskiene D, Zabuliene L, Smailyte G. A cohort study of antihyperglycemic medication exposure and gastric cancer risk. J Clin Med. 2020;9(2):435. doi:10.3390/jcm9020435
3. Tseng CH. Metformin reduces gastric cancer risk in patients with type 2 diabetes mellitus. Aging. 2016;8(8):1636–1649. doi:10.18632/aging.101019
4. Wu Y, Zheng Q, Li Y, et al. Metformin targets a YAP1-TEAD4 complex via AMPKalpha to regulate CCNE1/2 in bladder cancer cells. J Exp Clin Cancer Res. 2019;38(1):376.
5. Chen K, Qian W, Jiang Z, et al. Metformin suppresses cancer initiation and progression in genetic mouse models of pancreatic cancer. Mol Cancer. 2017;16(1):131. doi:10.1186/s12943-017-0701-0
6. Wu X, Yeerna H, Goto Y, et al. Metformin inhibits progression of head and neck squamous cell carcinoma by acting directly on carcinoma-initiating cells. Cancer Res 2019;79(17):4360–4370.
7. Hart PC, Chiyoda T. SPHK1 is a novel target of metformin in ovarian cancer. Cancer Res. 2019;17(4):870–881.
8. Klionsky DJ, Abdelmohsen K, Abe A, et al. Guidelines for the use and interpretation of assays for monitoring autophagy (3rd edition). Autophagy. 2016;12(1):1–222.
9. Yang ZJ, Chee CE, Huang S, Sinicrope FA. The role of autophagy in cancer: therapeutic implications. Mol Cancer Ther. 2011;10(9):1533–1541. doi:10.1158/1535-7163.MCT-11-0047
10. Amaravadi RK, Lippincott-Schwartz J, Yin XM, et al. Principles and current strategies for targeting autophagy for cancer treatment. Clin Cancer Res. 2011;17(4):654–666. doi:10.1158/1078-0432.CCR-10-2634
11. Yun CW, Lee SH. The roles of autophagy in cancer. Int J Mol Sci 2018;19:11.
12. Udristioiu A, Nica-Badea D. Autophagy dysfunctions associated with cancer cells and their therapeutic implications. Biomed Pharmacother. 2019;115:108892. doi:10.1016/j.biopha.2019.108892
13. Sinha S, Levine B. The autophagy effector Beclin 1: a novel BH3-only protein. Oncogene. 2008;27 Suppl 1:S137–S148. doi:10.1038/onc.2009.51
14. Kang R, Zeh HJ, Lotze MT, Tang D. The Beclin 1 network regulates autophagy and apoptosis. Cell Death Differ. 2011;18(4):571–580. doi:10.1038/cdd.2010.191
15. Howell JJ, Hellberg K, Turner M, et al. Metformin inhibits hepatic mTORC1 signaling via dose-dependent mechanisms involving AMPK and the TSC complex. Cell Metab. 2017;25(2):463–471. doi:10.1016/j.cmet.2016.12.009
16. Zhang CS, Li M, Ma T, et al. Metformin activates AMPK through the lysosomal pathway. Cell Metab. 2016;24(4):521–522. doi:10.1016/j.cmet.2016.09.003
17. Shen CT, Wei WJ, Qiu ZL, et al. Metformin reduces glycometabolism of papillary thyroid carcinoma in vitro and in vivo. J Mol Endocrinol. 2017;58(1):15–23. doi:10.1530/JME-16-0134
18. Kong D, Hua X, Qin T, Zhang J, He K. Inhibition of glycogen synthase kinase 3beta protects liver against ischemia/reperfusion injury by activating 5ʹ adenosine monophosphate-activated protein kinase-mediated autophagy. Mol Cell. 2019;49(4):462–472.
19. Gao L, Lv G, Li R, et al. Glycochenodeoxycholate promotes hepatocellular carcinoma invasion and migration by AMPK/mTOR dependent autophagy activation. Cancer Lett. 2019;454:215–223. doi:10.1016/j.canlet.2019.04.009
20. Inzucchi SE, Bergenstal RM, Buse JB, et al. Management of hyperglycemia in type 2 diabetes, 2015: a patient-centered approach: update to a position statement of the American Diabetes Association and the European Association for the Study of Diabetes. Diabetes Care. 2015;38(1):140–149. doi:10.2337/dc14-2441
21. Vacante F, Senesi P. Metformin counteracts HCC progression and metastasis enhancing KLF6/p21 expression and downregulating the IGF axis. Int J Endocrinol 2019;2019:7570146.
22. Fujita N, Hayashi-Nishino M, Fukumoto H, et al. An Atg4B mutant hampers the lipidation of LC3 paralogues and causes defects in autophagosome closure. Mol Biol Cell. 2008;19(11):4651–4659. doi:10.1091/mbc.e08-03-0312
23. Kabeya Y, Mizushima N, Ueno T, et al. LC3, a mammalian homologue of yeast Apg8p, is localized in autophagosome membranes after processing. EMBO J. 2000;19(21):5720–5728. doi:10.1093/emboj/19.21.5720
24. Feng Y, He D, Yao Z, Klionsky DJ. The machinery of macroautophagy. Cell Res. 2014;24(1):24–41. doi:10.1038/cr.2013.168
25. Kihara A, Kabeya Y, Ohsumi Y, Beclin-phosphatidylinositol YT. 3-kinase complex functions at the trans-Golgi network. EMBO Rep. 2001;2(4):330–335. doi:10.1093/embo-reports/kve061
26. Zhang D, Wang W, Sun X, et al. AMPK regulates autophagy by phosphorylating BECN1 at threonine 388. Autophagy. 2016;12(9):1447–1459. doi:10.1080/15548627.2016.1185576
27. Daugan M, Dufay Wojcicki A, d’Hayer B, Boudy V. Metformin: an anti-diabetic drug to fight cancer. Pharmacol Res. 2016;113(Pt A):675–685. doi:10.1016/j.phrs.2016.10.006
28. Guo H, Kong W, Zhang L, et al. Reversal of obesity-driven aggressiveness of endometrial cancer by metformin. Am J Cancer Res. 2019;9(10):2170–2193.
29. Fan H, Yu X, Zou Z, et al. Metformin suppresses the esophageal carcinogenesis in rats treated with NMBzA through inhibiting AMPK/mTOR signaling pathway. Carcinogenesis. 2019;40(5):669–679. doi:10.1093/carcin/bgy160
30. Fan X, Wang J, Hou J, et al. Berberine alleviates ox-LDL induced inflammatory factors by up-regulation of autophagy via AMPK/mTOR signaling pathway. J Transl Med. 2015;13:92. doi:10.1186/s12967-015-0450-z
31. Kim YC, Guan KL. mTOR: a pharmacologic target for autophagy regulation. J Clin Invest. 2015;125(1):25–32. doi:10.1172/JCI73939
32. Yang ZJ, Chee CE, Huang S, Sinicrope F. Autophagy modulation for cancer therapy. Cancer Biol Ther. 2011;11(2):169–176. doi:10.4161/cbt.11.2.14663
33. Mukhopadhyay S, Chatterjee A, Kogan D, Patel D, Foster DA. 5-Aminoimidazole-4-carboxamide-1-beta-4-ribofuranoside (AICAR) enhances the efficacy of rapamycin in human cancer cells. Cell Cycle. 2015;14(20):3331–3339. doi:10.1080/15384101.2015.1087623
34. Mukhopadhyay S, Saqcena M, Chatterjee A, Garcia A, Frias MA, Foster DA. Reciprocal regulation of AMP-activated protein kinase and phospholipase D. J Biol Chem. 2015;290(11):6986–6993. doi:10.1074/jbc.M114.622571
 © 2020 The Author(s). This work is published and licensed by Dove Medical Press Limited. The
full terms of this license are available at https://www.dovepress.com/terms
and incorporate the Creative Commons Attribution
- Non Commercial (unported, 3.0) License.
By accessing the work you hereby accept the Terms. Non-commercial uses of the work are permitted
without any further permission from Dove Medical Press Limited, provided the work is properly
attributed. For permission for commercial use of this work, please see paragraphs 4.2 and 5 of our Terms.
© 2020 The Author(s). This work is published and licensed by Dove Medical Press Limited. The
full terms of this license are available at https://www.dovepress.com/terms
and incorporate the Creative Commons Attribution
- Non Commercial (unported, 3.0) License.
By accessing the work you hereby accept the Terms. Non-commercial uses of the work are permitted
without any further permission from Dove Medical Press Limited, provided the work is properly
attributed. For permission for commercial use of this work, please see paragraphs 4.2 and 5 of our Terms.