Back to Journals » Drug Design, Development and Therapy » Volume 14
Metformin Decreases Insulin Resistance in Type 1 Diabetes Through Regulating p53 and RAP2A in vitro and in vivo
Authors Ren GF, Xiao LL, Ma XJ, Yan YS, Jiao PF
Received 13 February 2020
Accepted for publication 7 May 2020
Published 17 June 2020 Volume 2020:14 Pages 2381—2392
DOI https://doi.org/10.2147/DDDT.S249557
Checked for plagiarism Yes
Review by Single anonymous peer review
Peer reviewer comments 2
Editor who approved publication: Dr Tuo Deng
This paper has been retracted.
Gao-Fei Ren, 1 Li-Li Xiao, 2 Xiao-Jun Ma, 1 Yu-Shan Yan, 1 Peng-Fei Jiao 3
1Department of Endocrinology, The First Affiliated Hospital of Zhengzhou University, Zhengzhou 450052, Henan Province, People’s Republic of China; 2Department of Cardiology, The First Affiliated Hospital of Zhengzhou University, Zhengzhou 450052, Henan Province, People’s Republic of China; 3Department of Respiratory, The First Affiliated Hospital of Zhengzhou University, Zhengzhou 450052, Henan Province, People’s Republic of China
Correspondence: Peng-Fei Jiao
Department of Respiratory, The First Affiliated Hospital of Zhengzhou University, No. 1, Jianshe East Road, Zhengzhou 450052, Henan Province, People’s Republic of China
Tel +86 371-66913257
Email [email protected]
Purpose: Patients with type 1 diabetes (T1D) are associated with a high risk of multiple complications, so the development of T1D treatment is urgently needed. This study was set out to explore the molecular mechanism of metformin in the treatment of T1D insulin resistance.
Patients and Methods: Subcutaneous adipose tissues were collected from 68 T1D patients and 51 healthy controls. Insulin resistance model rats and cells were constructed and treated with metformin respectively. Western blot was used to detect p53 and RAP2A protein levels, and qPCR was utilized to measure p53 and RAP2A mRNA levels. SiRNA and RAP2A siRNA vectors were constructed to observe their effects on insulin resistance model cells.
Results: In T1D, p53 was up-regulated, while RAP2A was down-regulated. Metformin could effectively improve insulin resistance and inflammatory response while down-regulating p53 and up-regulating RAP2A. P53 induced insulin resistance and inflammatory response by inhibiting RAP2A and promoted apoptosis.
Conclusion: Metformin improves T1D insulin resistance and inflammatory response through p53/RAP2A pathway, and the regulation of p53/RAP2A pathway is conducive to improving the efficacy of metformin in the treatment of insulin resistance.
Keywords: type 1 diabetes, p53, RAP2A, insulin resistance, metformin
Introduction
As one of the most common types of diabetes,1 type 1 diabetes (T1D) is a chronic immune disease caused by the erroneous work of pancreatic cells and the immune system, with the clinical manifestations of insulin deficiency and hyperglycemia.2 Untimely and inaccurate treatment of T1D will result in manifold complications in patients. For example, Hainsworth et al3 showed that T1D patients with hyperglycemia were highly likely to develop retinopathy. In addition, Gilsanz et al4 exhibited that T1D patients with depression were often accompanied by a high risk of dementia. While according to Chaytor et al,5 it was quite common for elderly patients with late T1D to suffer from cognitive impairment. At the same time, significantly elevated apolipoprotein C3 in T1D patients increased the risk of cardiovascular disease.6 Understanding the molecular mechanism of the occurrence of T1D, therefore, contributes greatly to the development of T1D therapy. Although there are increasing studies focusing on the pathogenesis of T1D, the molecular network of T1D remains elusive.
The p53 protein encoded by the TP53 gene is a well-known transcription factor that can regulate genes at the transcriptional level by suppressing the binding of other transcription factors to target sequences.7 It is well established that p53 protein is closely associated with cell metabolism. As reported by Lowman et al,8 p53 increased glutamate levels in mouse embryonic fibroblasts through Slc7a3/mTORC1, thereby promoting cell survival. In the study of Kim et al,9 wild-type p53 (WTp53) reduced pyruvate consumption in mitochondria by up-regulating PUMA, and accelerated anaerobic oxidation of sugars in cells. Moon et al10 confirmed that p53 inhibited tumor growth by suppressing the mevalonic acid pathway. It is worth mentioning that multiple studies11–15 have demonstrated that p53 is involved in insulin resistance, which means that p53 is closely related to diabetes. While RAP2A belongs to the RAS protein family. Abnormally expressed RAP2A is closely bound up with the occurrence of various cancers like gastric cancer, thyroid cancer, nasopharyngeal cancer, and liver cancer.16–19 Akt phosphorylation is an important part of the insulin delivery pathway, and RAP2A is closely linked to Akt phosphorylation,20 so it is highly possible that RAP2A may participate in the insulin pathway through Akt.
Metformin is a common insulin sensitizer.21 In this study, 3D3-L1 cells were induced by dexamethasone and mice were induced by high glucose and high fat to construct insulin resistance models, and metformin treatment was performed on insulin model cells and rats, aiming to understand the molecular mechanism of metformin treatment of T1D insulin resistance and its relationship with p53 and RAP2A.
Patients and Methods
T1D Patients
Subcutaneous adipose tissue samples were collected from 68 T1D patients in the First Affiliated Hospital of Zhengzhou University, including 42 males and 26 females, with a mean age of (54.14±8.25) years, a course of disease of (15.58±3.75) years, a BMI of 21.16±0.74 and an insulin sensitivity index (ISI) of 8.79±0.34. In addition, another 51 healthy controls, including 29 males and 22 females, with an average age of (51.87±6.97) years, a BMI of 18.25±0.63 and an ISI of 11.41±0.27 were included as the control group. Inclusion criteria: Patients diagnosed with T1D and exhibiting insulin resistance. Exclusion criteria: Persons with mental illness; Patients with hypertension, kidney or coronary heart diseases; Patients with malignant tumors, acute inflammation or trauma. Hyperinsulinemic-euglycemic clamp technique was employed to evaluate the degree of insulin resistance, and insulin resistance was judged by comparing the insulin sensitivity index of healthy controls and T1D patients. There were no statistically significant differences in age and gender between the two groups (P=0.116, P=0.706), but there were statistical differences in BMI and ISI (P<0.001, P<0.001). The study was approved by the Medical Ethics Committee of the First Affiliated Hospital of Zhengzhou University, and all the participants were informed of the whole process of the study and signed the informed consent. Subcutaneous adipose tissues (2 g) were taken from the abdomen, removed the clearly visible blood vessels on the tissue block, and rinsed with sterile normal saline before placing them in a sterile and RNA-free EP tube. Then the tissue blocks were frozen in liquid nitrogen for 24 hours and stored in the refrigerator at −80 °C for later use. After the operation, the patients were closely observed with anti-bacterial and anti-infection intervention.
Establishment of Insulin Resistance Model
The differentiation of 3T3-L1 cells (ATCC, USA) into mature adipocytes was induced using 3-isobutyl-1-methylxanthine (MIBX) + dexamethasone + insulin. Then, 1 mol/L dexamethasone was applied to construct insulin resistance model cells, and the fluid was exchanged every 48 h. The glucose consumption of the culture medium was measured during the fluid exchange. When the glucose consumption was over 2.5 mmol/L, the cells were considered to be successfully developed insulin resistance. After that, the modeled cell adherents were inoculated in T25 culture flasks (Thermo Fisher Scientific) and cultured in an animal cell incubator (Binder, Germany) at 37°C and 5%CO2. The culture medium was DMEM medium (Hyclone) + 10% fetal bovine serum solution (Gibco) + 1% penicillin/streptomycin solution (100X, Solarbio). Before transfecting the cells with expression vectors, the medium was changed to serum-free medium in advance. P53 siRNA, RAP2A siRNA, and NC siRNA were purchased from Shanghai Sangon Biotechnology Co., Ltd. Lipofectamine 2000 transfection kit (invitrogen, USA) was employed to transfect the cell line in accordance with the kit instructions. Fresh medium was replaced 8 h after transfection to avoid killing the cells.
Approved by the Medical Ethics Committee of the First Affiliated Hospital of Zhengzhou University, six week male rats (Hunan SJA Laboratory Animal Co., Ltd.) without obvious abnormal behavior and pathogen infection were selected. After one week of general feeding, the rats were fasted for 24 hours, and then injected intraperitoneally with alloxan. Seventy-two hours and 1 week later, the fasting blood glucose of rat tail tip was measured, and the diabetic model was successfully established when the blood glucose level was higher than that 16.7mmol/L after two times of detection. The procedures were conducted in strict accordance with the guidelines for the Care and Use of Laboratory Animals (NIH publication, 1996 revision, No. 85–23). The tissue blocks were subcutaneous tissues collected from the abdomen of the rats, and the collection process was as follows: the rats were anesthetized with 2% pentobarbital sodium (40 mg/kg body weight) after preoperative fasting for 14 hours. An incision was then made in the middle of the rat abdomen to obtain subcutaneous tissue. The tissue blocks were frozen in liquid nitrogen for 24 hours and stored in the refrigerator at −80 °C for testing.
MTT Assay
Four 96-well plates were selected, where the transfected cells were inoculated according to the specification of 2×10³ per well, with 3 wells in each group. The cells were then cultured at 37 °C and 5%CO2. One well plate was taken out every 24 hours, at which point 5 mg/mL of MTT solution was added at 10 μL/well, and the culture was then continued for 4 hours. After removing the culture medium, 100 μL dimethyl sulfoxide (Solarbio Company) was added, and the OD value at 570 nm was measured by a microplate reader. The experiment was repeated 3 times to draw the cell viability-time curve.
Glucose Assay
The insulin-resistant cells were treated with metformin (0.5–2.0mmol/L), and the medium was replaced after 48 h. Glucose content in the medium was measured using the Glucose Assay kit (Abcam), and the Glucose consumption was calculated.
GTT and ITT for Glucose Tolerance and Insulin Sensitivity
Metformin was added to the feed at a dose of 3×10² mg/kg body weight. Insulin tolerance test (ITT): Insulin-resistant rats were stopped from feeding for 12 h, and their blood glucose index was detected, which was recorded as T=0 min. The rats were then intraperitoneally injected with insulin (dose: 0.5 U/kg), and the fasting glucose of the rats was detected at 15, 30, 60, 90 and 120 min after the injection. Glucose tolerance test (GTT): After fasting the insulin-resistant rats for 12 h, their blood glucose index was detected and recorded as T=0 min. The glucose (dose: 2 g/kg body weight) was intraperitoneally injected into the abdominal cavity of the rats, and the fasting glucose was detected at 15, 30, 60, 90 and 120 min after the injection.
qPCR
Trizol method was utilized to extract total RNA from tissues or cells. The total OD value of RNA at 260–280nm was detected by UV spectrophotometer, and those with OD260/OD280>1.8 were selected for subsequent qPCR detection. FastKing One-Step Reverse Transcription-Fluorescence Quantification Kit (Beijing Tiangen Corporation, FP314) and ABI PRISM 7000 (Applied Biosystems, USA) instruments were employed to quantify RNA levels. p53 mRNA and RAP2A mRNA primers were purchased from Shanghai Sangon Biotechnology Co., Ltd. The qPCR reaction system (50 μL) was as follows: upstream primer 1.25 μL, downstream primer 1.25 μL, probe 1.0 μL, RNA template 10 pg/μg, 50 × ROX Reference Dye ROX 5 μL, and RNase-Free ddH2O was added to meet the total reaction volume of 50 μL. Reaction process: Reverse transcription at 50°C for 30 min, one cycle; Predenaturation at 95°C for 3 min, one cycle; Denaturation at 95°C for 15 s, and annealing at 60°C for 30s, 40 cycles. The results were analyzed by ABI PRISM 7000 instrument. The internal reference gene was β-actin, and the data were standardized by 2–ΔΔCt method.
Western Blot
First, the cells were rinsed with cold PBS for 3 times, added with a lysis buffer containing 20 mM Tris-HCl solution (pH7.5, Solarbio company) and protein inhibitor (Solarbio company), and then carefully pipetted the solution so that the cells can be fully lyzed. Then, the solution was centrifuged at 1.6×10⁴ xg for 15 min at 4 °C, and 50 μL of the obtained supernatant was was processed for the determination of its protein concentration by BCA method. Next, 20 μg of protein and equivalent molecular weight standards were loaded into SDS-PAGE gel wells, and electrophoresed at 100 V for 2 h to isolate the protein. Then, the separated protein was transferred to a nitrocellulose (NC) membrane and left at room temperature for 1 h (blocked with 5% skimmed milk-PBS solution). The protein to be tested and β-actin primary antibody were then added and left to stand at 4 °C overnight. After that, the NC membrane was washed with PBS for three times, followed by the addition of goat anti-rabbit secondary antibody (HRP cross-linked), then continued to stand at room temperature for 1h. Finally, the NC membrane was washed with PBS solution and visualized using ECL chemiluminescence solution. The internal reference protein was β-actin, and the relative expression level of the protein to be tested = the gray value of the band to be tested/the gray value of the β-actin band. The proteins to be tested, as well as the β-actin primary and secondary antibody goat anti-rabbit (HRP cross-linked) were purchased from Abcam Company, Shanghai, China.
Co-Immunoprecipitation
The protein was extracted with the same method as mentioned in Western blot in the last paragraph. After washing twice with PBS buffer solution, 50% Protein A/G agarose resin was prepared with PBS buffer solution, and was added to the protein sample to eliminate non-specific binding proteins. Followed by the addition of 5 μg p53 antibody and RAP2A antibody, and gently shook at 4°C overnight. After centrifugation at 1×10³ g for 5 min, the supernatant was discarded, and the protein sample was repeated washing 4 times with 1 mL IP buffer. Western blot was used to identify precipitated proteins, with the same method as mentioned in Western blot.
Statistics and Analysis
Statistical analysis of the collected data was performed by SPSS 20.0 (Asia Analytics Formerly SPSS China), and the picture rendering was conducted using GraphPad Prism 6.0. The experiment was repeated three times. The measurement data were expressed as Mean±SD. The independent sample t test was employed for statistical differences between TID patients and healthy controls, and insulin resistance rats model group and Metformin group. One-way ANOVA was applied to compare the statistical differences between insulin resistance cells in each group, and the post-hoc pair-wise comparison was performed by LSD-t test. All data were double-tailed. With 95% as its confidence interval, a statistically significant difference was assumed at P<0.05.
Results
Metformin Improved Insulin Resistance
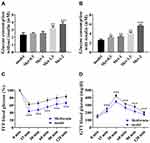
3T3-L1 cells were induced by dexamethasone to construct an insulin resistance model, and insulin resistance model cells were treated with different concentrations of metformin (0.5–2.0 nmol/L). After 24 h of metformin treatment, the glucose content in the culture medium was detected using a glucose detection kit. When treated with metformin alone, it was observed that 0.5 nmol/L and 1.0 nmol/L of metformin promoted a small but not statistically significant increase in glucose consumption in insulin-resistant cells (Figure 1A). When increased the metformin concentration to 1.5 nmol/L and 2.0 nmol/L, the glucose consumption of the two groups was statistically higher than that of the model group, and 2.0 nmol/L metformin had the best effect on promoting cell glucose consumption. What’s more, when metformin was co-administered with insulin to cells (Figure 1B), 0.5 to 2.0 nmol/L metformin was found to dramatically increased glucose consumption in cells. It was worth mentioning that the increase of glucose consumption in the metformin + insulin groups was greater than that in the metformin group, which suggested that the combination of the two was more effective in improving insulin resistance. Based on the effects of metformin on insulin-resistant cells, an insulin resistance rats model was constructed to study the effect of metformin on the improvement of insulin resistance in vivo. The ITT and GTT results showed that after metformin treated insulin-resistant rats, the blood glucose levels of the rats decreased statistically at 15, 30, 60, and 90 minutes (Figure 1C and D), and the effect of metformin combined with insulin was better than that of metformin, indicating that metformin could improve insulin resistance by promoting insulin absorption in model cells or rats.
Metformin Down-Regulated p53 and Up-Regulated RAP2A
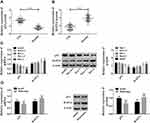
Western blot and qPCR were employed to detect the differentially expressed genes in subcutaneous adipose tissues of 68 T1D patients and 51 healthy controls. The results demonstrated that p53 increased in adipose tissues of T1D patients while RAP2A decreased (Figure 2A). As shown in Figure 2B and C, p53 was up-regulated while RAP2A was down-regulated in adipose tissues and insulin-resistant cells of insulin-resistant rats. After metformin treatment, whereas, p53 in cells and rat fat cells decreased and RAP2A increased. These results suggested that metformin might improve insulin resistance in T1D by regulating p53 and RAP2A (Figure 2D).
Metformin Improved Insulin Resistance by Activating IRS1/p-PI3K/Akt Pathway
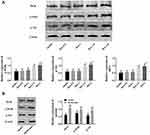
In the process of insulin mediated glucose absorption, the IRS1/PI3K/Akt pathway was quite remarkable, so the disorder of this pathway was an important cause of insulin resistance. In this section, Western blot was used to detect IRS1, p-PI3K (PI3K phosphorylated) and p-Akt (Akt phosphorylated), and the effects of metformin on the insulin pathway was evaluated by the changes of the three. The results (Figure 3) exhibited that IRS1, p-PI3K, and p-Akt were down-regulated in adipose tissues and insulin-resistant cells of insulin-resistant rats, while after metformin treatment, the expression levels of these three raised, indicating that metformin improved insulin resistance by activating the IRS1/p-PI3K/Akt pathway.
Metformin Inhibited Apoptosis by Down-Regulating p53
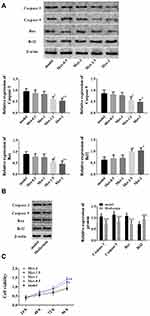
In view of the abnormal expression of p53 in T1D patients and insulin resistance model and the down-regulation of p53 caused by metformin, we hypothesized that metformin might improve the symptoms of insulin resistance model by reducing the apoptosis caused by p53. Therefore, MTT was adopted to detect cell vitality, and Western blot to detect Caspase 3, Caspase 9, Bax and Bcl2 in insulin-resistant cells and rat adipose tissues. The results (Figure 4) demonstrated that in insulin-resistant cells and rats, Caspase 3, Caspase 9 and Bax were up-regulated while Bcl2 was down-regulated. While the opposite results were observed after metformin treatment, that is, Caspase 3, Caspase 9 and Bax were down-regulated while Bcl2 was up-regulated. In addition, MTT results showed that metformin increased the viability of insulin-resistant cells. All these results indicated that metformin inhibited apoptosis and promoted cell viability by down-regulating p53.
Metformin Improved the Inflammatory Response in Insulin Resistance Models
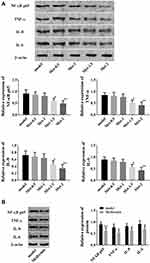
Inflammation is a common symptom of T1D, and the pathways involved in insulin resistance are closely related to inflammatory factors. As indicated above, metformin can activate the insulin pathway, so does metformin therefore regulate the inflammatory response in the insulin resistance model? In this part, the effects of metformin on the inflammatory response were evaluated by detecting NF-κB p65, TNF-α, IL-8, and IL-6. The results revealed that in insulin-resistant cells and rats, NF-κB p65, TNF-α, IL-8, and IL-6 were all up-regulated, while similarly, these indicators all elevated after metformin treatment, suggesting that metformin could improve the inflammatory response in insulin resistance models (Figure 5).
p53 Induced Insulin Resistance by Inhibiting RAP2A
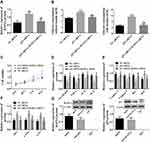
In light of the aforementioned effects of metformin on insulin resistance, this section focused on discussing whether metformin could improve insulin resistance by regulating p53 and RAP2A. p53 siRNA and RAP2A siRNA vectors were constructed to regulate p53 and RAP2A in insulin-resistant cells, and their effects on insulin resistance were studied. In was found that RAP2A was up-regulated when p53 was down-regulated, suggesting that p53 might inhibit RAP2A in insulin-resistant cells (Figure 6A). In addition, when p53 was down-regulated, glucose consumption in insulin-resistant cells increased significantly, while inhibiting RAP2A could offset this increase in glucose consumption caused by p53 down-regulation (Figure 6B), which indicated that p53 inhibited glucose consumption by down-regulating RAP2A. What’s more, when cells were co-cultured with 1 nmol/L insulin, the glucose consumption increment caused by down-regulation of p53 was significantly higher than that of the non-insulin group, suggesting that p53 inhibited insulin sensitivity by down-regulation of RAP2A. Moreover, as shown in Figure 6C–F, the decreased vitality, apoptosis, inflammatory response and IRS1/p-PI3K/p-Akt pathway disorders caused by down-regulation of p53 could all be offset by down-regulation of RAP2A.
The relationship between p53 and RAP2A was verified by CO-IP method. If p53 could interact with RAP2A, the p53 antibody would precipitate both p53 and RAP2A, and then RAP2A bands could be found when the precipitated protein was detected by Western blot. It was found that P53 could be precipitated with RAP2A antibody, and p53 bands were also obtained by subsequent Western blot detection of p53. All these demonstrated that p53 can bind to and interact with RAP2A (Figure 6G).
The above results indicated that p53 induced insulin resistance by inhibiting RAP2A, and metformin up-regulated RAP2A by inhibiting p53, thereby activating the IRS1/p-PI3K/p-Akt pathway and inhibiting apoptosis and inflammatory responses.
Discussion
In present study, we found that p53 was up-regulated and RAP2A was down-regulated in subcutaneous tissue samples of T1D patients. Combined with the results of correlation analysis, we speculated that their abnormal expressions might be related to T1D insulin resistance. In addition, inhibition of p53 resulted in up-regulation of RAP2A, and co-immunoprecipitation indicated that p53 could interact with RAP2A, suggesting that p53 may regulate insulin resistance by inhibiting RAP2A. When studying the downstream of p53, Wu et al22 found that RAP2A was the downstream target of p53 in osteosarcoma cells, and p53 changed the downstream of MMP2, MMP9 and Akt by regulating RAP2A. The results of this study also confirmed that p53 could directly regulate RAP2A. It is particularly noteworthy that in the study of Wu et al, p53 up-regulated RAP2A, while in this study, p53 inhibited RAP2A, which may be due to the tissue-specific regulation of p53 on RAP2A.
The RAS protein family to which RAP2A belongs plays an indispensable role in the insulin pathway. In the insulin pathway, insulin binds to insulin receptors to drive Akt phosphorylation, a process based on RAS facilitation.23 Wu et al20 also pointed out that RAP2A promoted Akt phosphorylation. In addition, Akt phosphorylation can inhibit apoptosis and inflammatory responses.24,25 Therefore, in current study, the up-regulation of RAP2A caused by the down-regulation of p53 activated the downstream IRS1/PI3K/Akt pathway and inhibited the apoptosis pathway and inflammatory factors, which ultimately improved insulin resistance.
Metformin has a non-negligible role in T1D treatment strategies. Long-term use of metformin may reduce the possibility of cardiovascular disease in T1D patients,26 and metformin may be involved in the regulation of insulin sensitivity in T1D patients.27,28 In this study, when metformin was used to treat the insulin resistance model, it was found that metformin can cause the down-regulation of p53 and the up-regulation of RAP2A, accompanied by the activation of the IRS1/p-PI3K/Akt pathway, the reduction of pro-inflammatory factors, and the reduction of apoptosis. In combination with the effects of metformin on p53 and RAP2A and the regulatory mechanism of p53/RAP2A pathway, we hypothesized that metformin increased insulin sensitivity and promoted glucose consumption by inhibiting the p53/RAP2A pathway.
This study explored the molecular mechanism of metformin in the treatment of T1D insulin resistance and believed that metformin increased insulin sensitivity through the p53/RAP2A pathway. We found that p53 promoted insulin resistance by inhibiting RAP2A in adipose tissues, while p53 down-regulated insulin resistance as a suppressor in liver tissues,11 which indicated that p53 had two-sided effects on insulin. Besides, the regulation of p53 on RAP2A was also tissue-specific. Therefore, whether the p53/RAP2A pathway is tissue-specific can be further discussed in future experimental designs.
Conclusion
In summary, this study aims to explore the molecular mechanism of metformin in the treatment of T1D insulin resistance. It is found that metformin up-regulates RAP2A by inhibiting p53, and the up-regulated RAP2A induces the activation of downstream NF-B inflammation pathway, IRS1/PI3K/Akt pathway and apoptosis pathway, ultimately improving insulin resistance. The discovery of this mechanism provides new therapeutic ideas for T1D insulin resistance-inhibition of p53 or up-regulation of RAP2A can help improve the treatment effect of metformin.
Acknowledgments
This study was supported by National Natural Science Foundation of China (Grant No: 81400800) and the Key scientific research projects of universities in Henan Province (Grant No: 20A320034).
Disclosure
The authors report no conflicts of interest in this work.
References
1. Bullard KM, Cowie CC, Lessem SE, et al. Prevalence of diagnosed diabetes in adults by diabetes type - United States, 2016. MMWR Morb Mortal Wkly Rep. 2018;67(12):359–361. doi:10.15585/mmwr.mm6712a2
2. DiMeglio LA, Evans-Molina C, Oram RA. Type 1 diabetes. Lancet. 2018;391(10138):2449–2462. doi:10.1016/S0140-6736(18)31320-5
3. Hainsworth DP, Bebu I, Aiello LP, et al. Risk factors for retinopathy in type 1 diabetes: the DCCT/EDIC study. Diabetes Care. 2019;42(5):875–882. doi:10.2337/dc18-2308
4. Gilsanz P, Schnaider Beeri M, Karter AJ, Quesenberry CP, Adams AS, Whitmer RA. Depression in type 1 diabetes and risk of dementia. Aging Ment Health. 2019;23(7):880–886. doi:10.1080/13607863.2018.1455167
5. Chaytor NS, Barbosa-Leiker C, Ryan CM, Germine LT, Hirsch IB, Weinstock RS. Clinically significant cognitive impairment in older adults with type 1 diabetes. J Diabetes Complications. 2019;33(1):91–97. doi:10.1016/j.jdiacomp.2018.04.003
6. Kanter JE, Shao B, Kramer F, et al. Increased apolipoprotein C3 drives cardiovascular risk in type 1 diabetes. J Clin Invest. 2019;129(10):4165–4179. doi:10.1172/JCI127308
7. Strycharz J, Drzewoski J, Szemraj J, Sliwinska A. Erratum to “is p53 involved in tissue-specific insulin resistance formation? Oxid Med Cell Longev. 2017;2017:8036902.
8. Lowman XH, Hanse EA, Yang Y, et al. p53 promotes cancer cell adaptation to glutamine deprivation by upregulating Slc7a3 to increase arginine uptake. Cell Rep. 2019;26(11):3051–3060 e3054. doi:10.1016/j.celrep.2019.02.037
9. Kim J, Yu L, Chen W, et al. Wild-type p53 promotes cancer metabolic switch by inducing PUMA-dependent suppression of oxidative phosphorylation. Cancer Cell. 2019;35(2):191–203 e198. doi:10.1016/j.ccell.2018.12.012
10. Moon SH, Huang CH, Houlihan SL, et al. p53 represses the mevalonate pathway to mediate tumor suppression. Cell. 2019;176(3):564–580 e519. doi:10.1016/j.cell.2018.11.011
11. Zhang X, Duan W, Lee WN, et al. Overexpression of p53 improves blood glucose control in an insulin resistant diabetic mouse model. Pancreas. 2016;45(7):1010–1017. doi:10.1097/MPA.0000000000000637
12. Nelson LE, Valentine RJ, Cacicedo JM, Gauthier MS, Ido Y, Ruderman NB. A novel inverse relationship between metformin-triggered AMPK-SIRT1 signaling and p53 protein abundance in high glucose-exposed HepG2 cells. Am J Physiol Cell Physiol. 2012;303(1):C4–C13. doi:10.1152/ajpcell.00296.2011
13. Shimizu I, Yoshida Y, Katsuno T, et al. p53-induced adipose tissue inflammation is critically involved in the development of insulin resistance in heart failure. Cell Metab. 2012;15(1):51–64. doi:10.1016/j.cmet.2011.12.006
14. Minamino T, Orimo M, Shimizu I, et al. A crucial role for adipose tissue p53 in the regulation of insulin resistance. Nat Med. 2009;15(9):1082–1087. doi:10.1038/nm.2014
15. Tikoo K, Tripathi DN, Kabra DG, Sharma V, Gaikwad AB. Intermittent fasting prevents the progression of type I diabetic nephropathy in rats and changes the expression of Sir2 and p53. FEBS Lett. 2007;581(5):1071–1078. doi:10.1016/j.febslet.2007.02.006
16. Wang L, Zhu B, Wang S, et al. Regulation of glioma migration and invasion via modification of Rap2a activity by the ubiquitin ligase Nedd4-1. Oncol Rep. 2017;37(5):2565–2574. doi:10.3892/or.2017.5572
17. Lee YE, He HL, Chen TJ, et al. The prognostic impact of RAP2A expression in patients with early and locoregionally advanced nasopharyngeal carcinoma in an endemic area. Am J Transl Res. 2015;7(5):912–921.
18. Prabakaran I, Grau JR, Lewis R, Fraker DL, Guvakova MA. Rap2A is upregulated in invasive cells dissected from follicular thyroid cancer. J Thyroid Res. 2011;2011:979840. doi:10.4061/2011/979840
19. Zheng X, Zhao W, Ji P, et al. High expression of Rap2A is associated with poor prognosis of patients with hepatocellular carcinoma. Int J Clin Exp Pathol. 2017;10(9):9607–9613.
20. Wu JX, Du WQ, Wang XC, et al. Rap2a serves as a potential prognostic indicator of renal cell carcinoma and promotes its migration and invasion through up-regulating p-Akt. Sci Rep. 2017;7(1):6623. doi:10.1038/s41598-017-06162-7
21. Giannarelli R, Aragona M, Coppelli A, Del Prato S. Reducing insulin resistance with metformin: the evidence today. Diabetes & Metabolism. 2003;29(4):6S28–35. doi:10.1016/S1262-3636(03)72785-2
22. Wu JX, Zhang DG, Zheng JN, Pei DS. Rap2a is a novel target gene of p53 and regulates cancer cell migration and invasion. Cell Signal. 2015;27(6):1198–1207. doi:10.1016/j.cellsig.2015.02.026
23. Molinaro A, Becattini B, Mazzoli A, et al. Insulin-driven PI3K-AKT signaling in the hepatocyte is mediated by redundant PI3Kα and PI3Kβ activities and is promoted by RAS. Cell Metab. 2019;29(6):1400–1409 e1405. doi:10.1016/j.cmet.2019.03.010
24. Carvalho BC, Oliveira LC, Rocha CD, et al. Both knock-down and overexpression of Rap2a small GTPase in macrophages result in impairment of NF-κB activity and inflammatory gene expression. Mol Immunol. 2019;109:27–37. doi:10.1016/j.molimm.2019.02.015
25. Zhao Y, Song W, Wang Z, et al. Resveratrol attenuates testicular apoptosis in type 1 diabetic mice: role of Akt-mediated Nrf2 activation and p62-dependent Keap1 degradation. Redox Biol. 2018;14:609–617. doi:10.1016/j.redox.2017.11.007
26. Petrie JR, Chaturvedi N, Ford I, et al. Cardiovascular and metabolic effects of metformin in patients with type 1 diabetes (REMOVAL): a double-blind, randomised, placebo-controlled trial. Lancet Diabetes Endocrinol. 2017;5(8):597–609. doi:10.1016/S2213-8587(17)30194-8
27. Bjornstad P, Schafer M, Truong U, et al. Metformin improves insulin sensitivity and vascular health in youth with type 1 diabetes mellitus. Circulation. 2018;138(25):2895–2907. doi:10.1161/CIRCULATIONAHA.118.035525
28. Cree-Green M, Bergman BC, Cengiz E, et al. Metformin improves peripheral insulin sensitivity in youth with type 1 diabetes. J Clin Endocrinol Metab. 2019;104(8):3265–3278. doi:10.1210/jc.2019-00129
 © 2020 The Author(s). This work is published and licensed by Dove Medical Press Limited. The full terms of this license are available at https://www.dovepress.com/terms.php and incorporate the Creative Commons Attribution - Non Commercial (unported, v3.0) License.
By accessing the work you hereby accept the Terms. Non-commercial uses of the work are permitted without any further permission from Dove Medical Press Limited, provided the work is properly attributed. For permission for commercial use of this work, please see paragraphs 4.2 and 5 of our Terms.

