Back to Journals » Journal of Inflammation Research » Volume 11
Metformin ameliorated methotrexate-induced hepatorenal toxicity in rats in addition to its antitumor activity: two birds with one stone
Authors Rizk FH, El Saadany AA ![]() , Dawood L, Elkaliny HH, Sarhan NI
, Dawood L, Elkaliny HH, Sarhan NI ![]() , Badawi R, Abd-Elsalam S
, Badawi R, Abd-Elsalam S ![]()
Received 30 June 2018
Accepted for publication 17 September 2018
Published 8 November 2018 Volume 2018:11 Pages 421—429
DOI https://doi.org/10.2147/JIR.S178767
Checked for plagiarism Yes
Review by Single anonymous peer review
Peer reviewer comments 4
Editor who approved publication: Professor Ning Quan
Fatma H Rizk,1 Amira A El Saadany,2 Lamees Dawood,3 Heba H Elkaliny,4 Naglaa I Sarhan,4 Rehab Badawi,5 Sherief Abd-Elsalam5
1Department of Physiology, Faculty of Medicine, Tanta University, Tanta, Egypt; 2Department of Pharmacology, Faculty of Medicine, Tanta University, Tanta, Egypt; 3Department of Biochemistry, Faculty of Medicine, Tanta University, Tanta, Egypt; 4Department of Histology, Faculty of Medicine, Tanta University, Tanta, Egypt; 5Department of Tropical, Faculty of Medicine, Tanta University, Tanta, Egypt
Abstract: Methotrexate (MTX) is a drug used in treatment of various malignancies. Unfortunately, it leads to life-threatening complications including hepatorenal toxicity. Previous studies revealed the protective effects of metformin (MET) on hepatorenal toxicity in other models in addition to its anticancer effects. The current study investigates the effect of MET on MTX-induced hepatorenal toxicity and the possible mechanisms involved in this toxicity which can be overwhelmed by MET. Thirty male rats were divided into 3 groups: normal control, MTX treated and MET/MTX treated. After 7 days, MTX induced hepatorenal toxicity as proved by histological examinations and biochemical analysis of liver and kidney functions. Also, it led to significant increase in hepatic and renal malondialdehyde levels, significant decrease in hepatic and renal total antioxidant capacity levels and Na+/K+-ATPase activities and significant up regulation of mRNA expressions of nuclear factor kappa-light-chain-enhancer of activated B cells, cyclooxygenase-2 and caspase 3 compared with the control group. While, MET could significantly reduce hepatorenal toxicity and counteract the effects of MTX on all measured parameters. In conclusion, MET can be an effective adjuvant to MTX chemotherapy that could ameliorate its hepatorenal toxicity through antioxidant, anti-inflammatory and anti-apoptotic mechanisms.
Keywords: hepatorenal toxicity, metformin, methotrexate
Introduction
Combination therapy is an important strategy in cancer treatment. The combination of two or more drugs increases the efficacy and safety of the treatment compared with a monotherapy regimen.1
Methotrexate (MTX) is a cytotoxic drug that is used in the treatment of various malignant disorders.2 Unfortunately, cytotoxic effects of MTX do not affect tumor cells only, but extend to affect other vital organs such as the liver and kidneys.3 The hepatorenal toxicity of MTX in these organs may be due to several factors including oxidative stress, inflammation and apoptosis.4 Therefore, it is imperative to combine it with another drug which could decrease its toxicity and increase its efficacy.
Metformin (1,1-dimethylbiguanide) is one of most important drugs which is used in treatment of type 2 diabetes mellitus.5 In addition, previous clinical and experimental studies revealed that it had preventive and curable effects on cancer in different organs, including the liver and it inhibited the resistance to breast cancer treatment.6,7 Moreover, it prevented the deleterious effects of oxidative stress in different cell types and it had anti-inflammatory effects.8,9
All these findings suggested that metformin (MET) might have a preventive effect against MTX induced hepatorenal toxicity and could be a good adjuvant compound to anticancer therapy.
Here, we propose to replicate the preventive effects of MET on MTX-induced hepatic toxicity in rats that were previously studied by Hadi et al10 and in rabbits to investigate, for the first time, the effect of MET on renal toxicity induced by MTX with exploring the possible mechanisms of this effect.
Material and methods
Drugs and chemicals
Metformin was obtained from Cid Co, Egypt, in the form of tablet freshly prepared in distilled water. Methotrexate was obtained from Shanxi PUDE pharmaceutical Co. (Shanxi, China), in the form of vial freshly prepared in saline for intraperitoneal injection (ip) in rats.
All chemicals used, unless otherwise described, were purchased from Sigma (Sigma-Aldrich Co., St Louis, MO, USA) and were of high analytical grade.
Animals
Male Wistar albino rats weighing 230–290g were housed in clean cages in the Pharmacology Department, Faculty of Medicine, Tanta University, 5 rats in each cage. Rats were acclimatized to standard laboratory conditions (12:12 light–dark cycle, environmental temperature 24±2°C) for 15 days before starting the experiment with free access to water and food. All experiments of this study were performed during the same time of the day. All animals were cared for in accordance with the Guide for the Care and Use of Laboratory Animals (1996, published by National Academy Press, Washington, DC, USA). The experimental protocol was reviewed and approved by the animal care review committee at the Faculty of Medicine, Tanta University.
Experimental design
After the acclimatization period, 30 male rats were randomly and equally divided into 3 groups 10 rats in each.
Control group: normal group received 0.5 mL distilled water/rat orally by gastric gavage once daily for 7 days and 0.5 mL saline/rat ip at the first day only one hour after administration of distilled water.
MTX group: this group received single dose of MTX (20mg/kg) ip on the first day of experiment to induce hepatorenal toxicity.4
MET group: MET/MTX treated group MTX as in MTX group one hour after MET administration on the first day only. MET was administered once daily in a dose of (200mg/kg)10 for 7 days (first day with MTX then 6 days without MTX).
Collection of blood samples
At the end of the experiment, blood samples were collected by cardiac puncture, under light anesthesia using diethyl ether.11 Blood was collected in sterile plain tubes for serum separation then centrifuged at 3000rpm for 15 minutes. The separated serum was stored in aliquots at –80°C until used. The obtained serum was used to estimate colorimetrically the levels of aspartate aminotransferase (AST) enzyme activity, alanine aminotransferase (ALT) enzyme activity, urea and creatinine using commercial kits (BioSystems Company, Spain kits number 11567, 11568, 11,537 and 11,802 respectively).
Tissue sampling
Immediately after blood sampling, animals were sacrificed by cervical dislocation under deep ether anesthesia. Liver and kidney tissues were removed, rinsed with saline to eliminate blood contamination, dried by blotting with filter paper and weighed then divided into specimens for preservation in 10% formalin solution for histopathological examination. The remaining tissues were divided into small pieces (0.5g weight) then immediately frozen at –80°C for biochemical analysis of tissue homogenate.
Preparation of tissue homogenates
The liver and kidneys were homogenized using Glas-Col homogenizer and a 20% w/v homogenate was prepared in ice-cold phosphate buffer (0.01M, pH 7.4). The homogenate was centrifuged for 20 minutes at 3000 rpm then the supernatant was separated to avoid sample thawing and refreezing and was kept at −80°C until use.
Assessment of oxidative stress markers in liver and kidney tissue homogenates
The aliquot was used for the assessment of lipid peroxidation by measuring MDA levels which were estimated by the double heating method as previously described.12 This method is based on the use of spectrophotometry to measure the generated color by the reaction of thiobarbituric acid (TBA) with MDA at 532 nm. Then the absorbance coefficient of the MDA–TBA complex (absorbance coefficient of 1.56 × 105cm−1 M−1) was used to calculate the concentration of MDA and the results were expressed as nmol/g tissue.
Total antioxidant capacity (TAC) level was assessed using ferric reducing ability of tissue as previously described by Benzie and Szeto.13 We measured the ability of tissue antioxidants in reduction of ferric-tripyridyltriazine (Fe3+-TPTZ) to a ferrous form (Fe2+). Absorbance was measured at 593nm using a spectrophotometer (UV-visible). The results were expressed as nmol/mg protein in tissue.
The measurement of Na+/K+-ATPase activity was based on the measurement of inorganic phosphate produced from 3mm disodium adenosine triphosphate added to the incubation medium containing: 5mm KCL, 100mm NaCl, 6mm MgCl2, 0.1mm EDTA and 30mm Tris HCL of pH 7.4. The medium was incubated at 37°C in water bath for 5 minutes. Following this pre-incubation period, Na2ATP, at a final concentration of 3mm, was added into each tube and incubated at 37°C for 30 minutes. After the incubation, the tubes were placed in an ice bath to stop the reaction. The mixture was then centrifuged at 3500g, and Pi in the supernatant fraction was determined as previously described by Fiske and Subbarow.14 The specific activity of the enzyme was expressed as (μmol/mg protein/hour). The protein concentration of the supernatant was measured as previously described by Lowry.15
Quantitative RT-PCR analysis
Total RNA was isolated from rat liver and kidney using Gene JET RNA Purification Kit (# K0731, Thermo Fisher Scientific, Waltham, MA, USA) according to the manufacturer’s protocol and as previously described.16 Total RNA (5µg) was reverse transcribed using RevertAid H minus reverse transcriptase (#EP0451, Thermo Fisher Scientific) to produce cDNA. The latter was used as a template to determine the relative expression of the nuclear factor kappa-light-chain-enhancer of activated B cells (NF-κB), cyclooxygenase-2 (COX-2) , and caspase 3 (cas 3) genes using StepOnePlus real time PCR system (Thermo Fisher Scientific). The primers were designed by Primer 5.0 software (PREMIER Biosoft International, Palo Alto, CA, USA) and their sequences were as follow: NF-κB forward (F): 5′ CCTAGCTTTCTCTGAACTGCAAA 3′ , and NFKB reverse (R): 5′ GGGTCAGAGGCCAATAGAGA 3′, COX-2 F: 5′ GATTGACAGCCCACCAACTT 3′ , Cox2 R: 5′ GCGGATGCCAGTGATAGAGTG 3′ and Cas3 F: 5′ GGTATTGAGACAGACAGTGG 3′ and Cas3 R: 5′ CATGGGATCTGTTTCTTTGC 3′. The calculation of fold change in target gene expression depended on the housekeeping gene b-actin (with primer sequences; F: 5′ CGGGATGAACTCTCTCCTCA 3′ and R: 5′ CGCTCATTGCCGATAGTG 3′. The preparation of 25-µL PCR mix was done by adding 12.5µL of 2X Maxima SYBR Green/ROX qPCR Master Mix (# K0221, Thermo Fisher Scientific), 2µL of cDNA template, 1µL forward primer, 1µL reverse primer, and 8.5µL of nuclease free water. The conditions of thermal cycling were as follows: initial denaturation at 95°C for 10 minutes, 40–45 cycles of amplification of DNA denaturation at 95°C for 15 seconds, annealing at 60°C for 30 seconds, extension at 72°C for 30 seconds. At the end of the last cycle, the temperature was increased from 63°C to 95°C for melting curve analysis. The cycle threshold (Ct) values were calculated for target genes and the housekeeping gene. The relative gene expression was determined using 2−∆∆Ct method.17 The ratio of the targeted gene was normalized with β-actin and expressed as mean ±SE).
Histopathological examination
The liver and kidney specimens were collected, fixed in 10% formalin solution and embedded in paraffin followed by preparation of 5µm thick paraffin sections and staining with H&E dyes.18 The stained slides were examined and photographed using light microscopy (Olympus CX41) in Histology Department Faculty of Medicine Tanta University.
Five non-overlapping fields were examined at ×200 in each slide of each animal for quantification of liver and kidney histological observations. Quantification of liver histological observations was carried according to Knodell system that is based on the sum of scores of (I) periportal necrosis, (II) intralobular degeneration and focal necrosis, (III) portal inflammation, and (IV) fibrosis to yield a possible range of 0–22 as follow: (I) periportal necrosis: score 0 (none), score 1 (mild piecemeal necrosis), score 3 (moderate piecemeal necrosis), score 4 (marked piecemeal necrosis), score 5 (moderate piecemeal necrosis plus bridging necrosis), score 6 (marked piecemeal necrosis plus bridging necrosis), score 10 (multilobular necrosis); (II) intralobular degeneration and focal necrosis: score 0 (none), score 1 (mild = involvement <1/3 of lobules or nodules), score 3 (moderate = involvement 1/3–2/3 of lobules or nodules), score 4 (marked = involvement > 2/3 of lobules or nodules); (III) portal inflammation: score 0 (none), score 1(mild = involvement <1/3 of portal tracts), score 3 (moderate = involvement 1/3–2/3 of portal tracts), score 4 (marked = involvement > 2/3 of portal tracts); and (IV) fibrosis: score 0 (no fibrosis), score 1 (fibrosis portal expansion), score 3 (bridging fibrosis), score 4 (cirrhosis) to yield a possible range of 0–22.19 Quantification of renal histological observations was applied on what was previously described by Melnikov et al20 and it is based on grading of tubular necrosis, loss of brush border, cast formation, and tubular dilatation in five randomly chosen, non-overlapping fields (×200) as follows: score 0 (none), score 1 (≤10%), score 2 (11–25%), score 3 (26–45%), score 4 (46–75%), and score 5 (≥76%). The collected data of liver and kidney scores were organized, tabulated, and statistically analyzed.
Statistical analysis
Biochemical data were expressed as the mean ±SD. Comparison between different groups was carried out using one-way ANOVA then least significant difference as a post hoc test. Scores of histological observations were expressed as the median (minimum–maximum) and the comparison between different groups was carried out using Kruskal–Wallis H test. Statistical tests were performed with SPSS (IBM SPSS Statistics for Windows, version 23.0; IBM Corporation, Armonk, NY, USA). Differences were considered statistically significant if probability (P) value <0.05.
Ethical approval
Experiments were in accordance with the recommendations from the Declaration of Helsinki and the internationally accepted principles in the care and use of experimental animals. The experimental protocol was reviewed and approved by the ethics committee at the faculty of medicine, Tanta University.
Results
Biochemical results
Effects of methotrexate and metformin on liver enzymes and kidney functions
Administration of MTX significantly increased serum AST activity, ALT activity, urea level and creatinine level compared with the control group. While, administration of MET along with MTX significantly decreased these measured parameters compared with MTX group (Table 1).
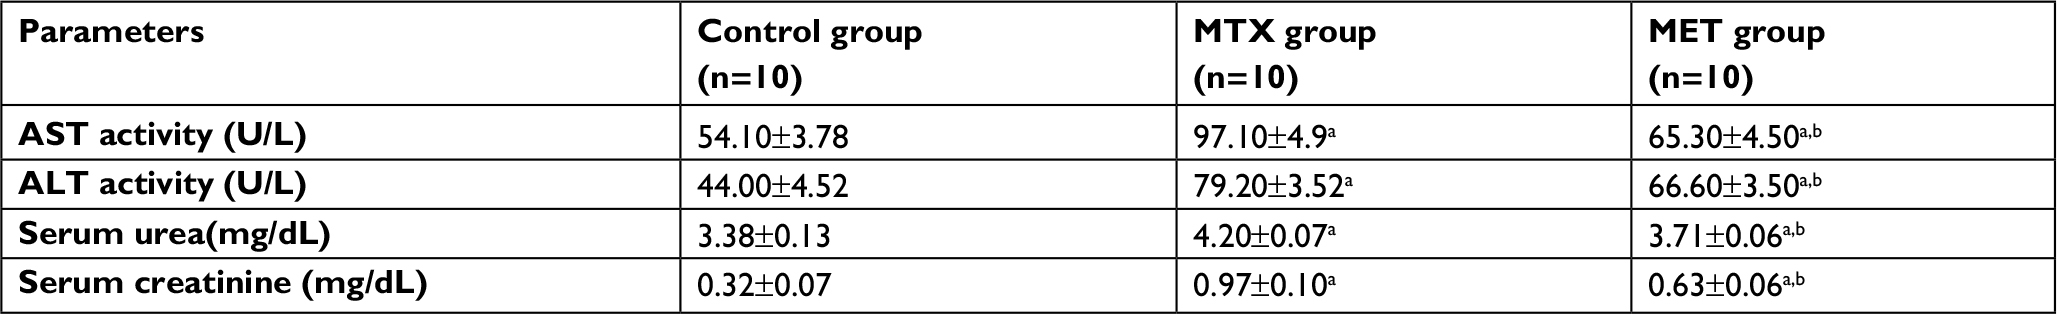 | Table 1 Effects of methotrexate and metformin on liver enzymes and kidney functions Notes: Data are given as mean ±SD. aP <0.05 vs control group. bP <0.05 vs MTX group. Abbreviations: ALT, alanine aminotransferase; AST, aspartate aminotransferase; MTX methotrexate; MET, metformin. |
Effects of methotrexate and metformin on hepatic and renal oxidative stress markers
MTX administration caused significant increase in hepatic and renal MDA levels compared with the control group but it significantly decreased the hepatic and renal TAC levels and Na+/K+-ATPase activities compared with the control group. However, MET administration along with MTX significantly decreased the hepatic and renal MDA levels compared with the MTX group and significantly increased the hepatic and renal TAC levels and Na+/K+-ATPase activities compared with MTX group (Tables 2 and 3).
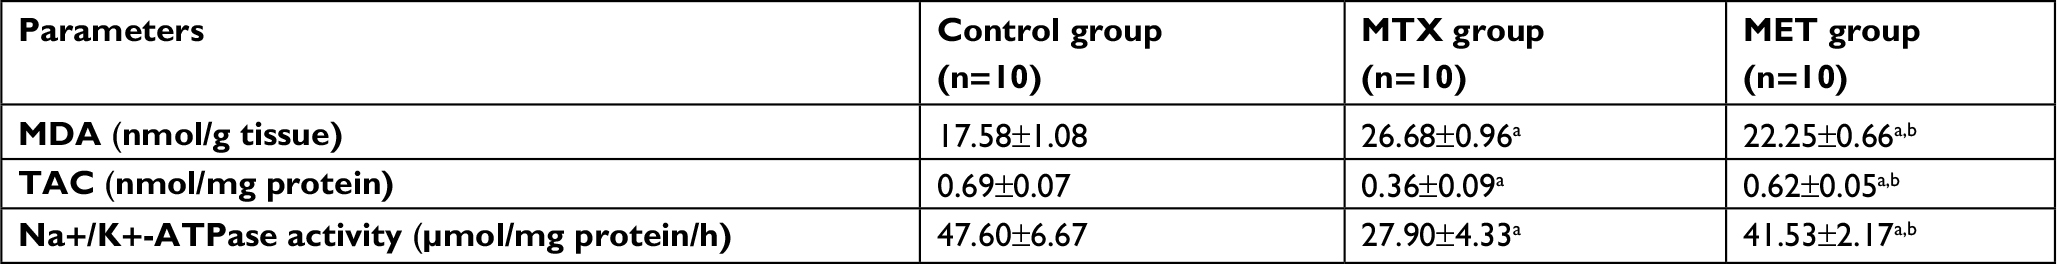 | Table 2 Effects of methotrexate and metformin on hepatic oxidative stress markers Notes: Data are given as mean ± SD. aP <0.05 vs control group. bP <0.05 vs MTX group. Abbreviations: MDA, malondialdehyde; TAC, total antioxidant capacity; MTX, methotrexate; MET, metformin. |
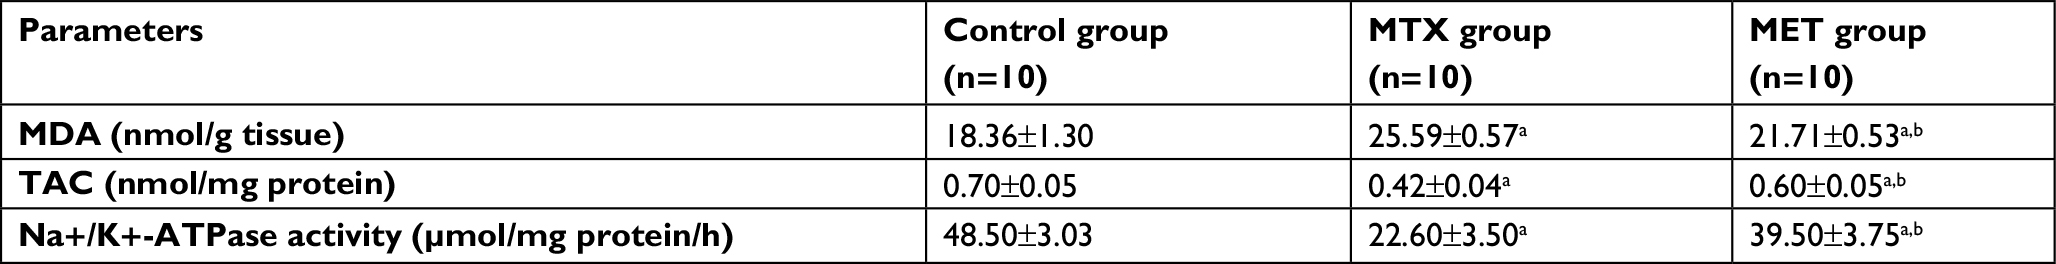 | Table 3 Effects of methotrexate and metformin on renal oxidative stress markers Notes: Data are given as mean ± SD. aP <0.05 vs control group. bP <0.05 vs MTX group. Abbreviations: MDA, malondialdehyde; TAC, total antioxidant capacity; MTX, methotrexate; MET, metformin. |
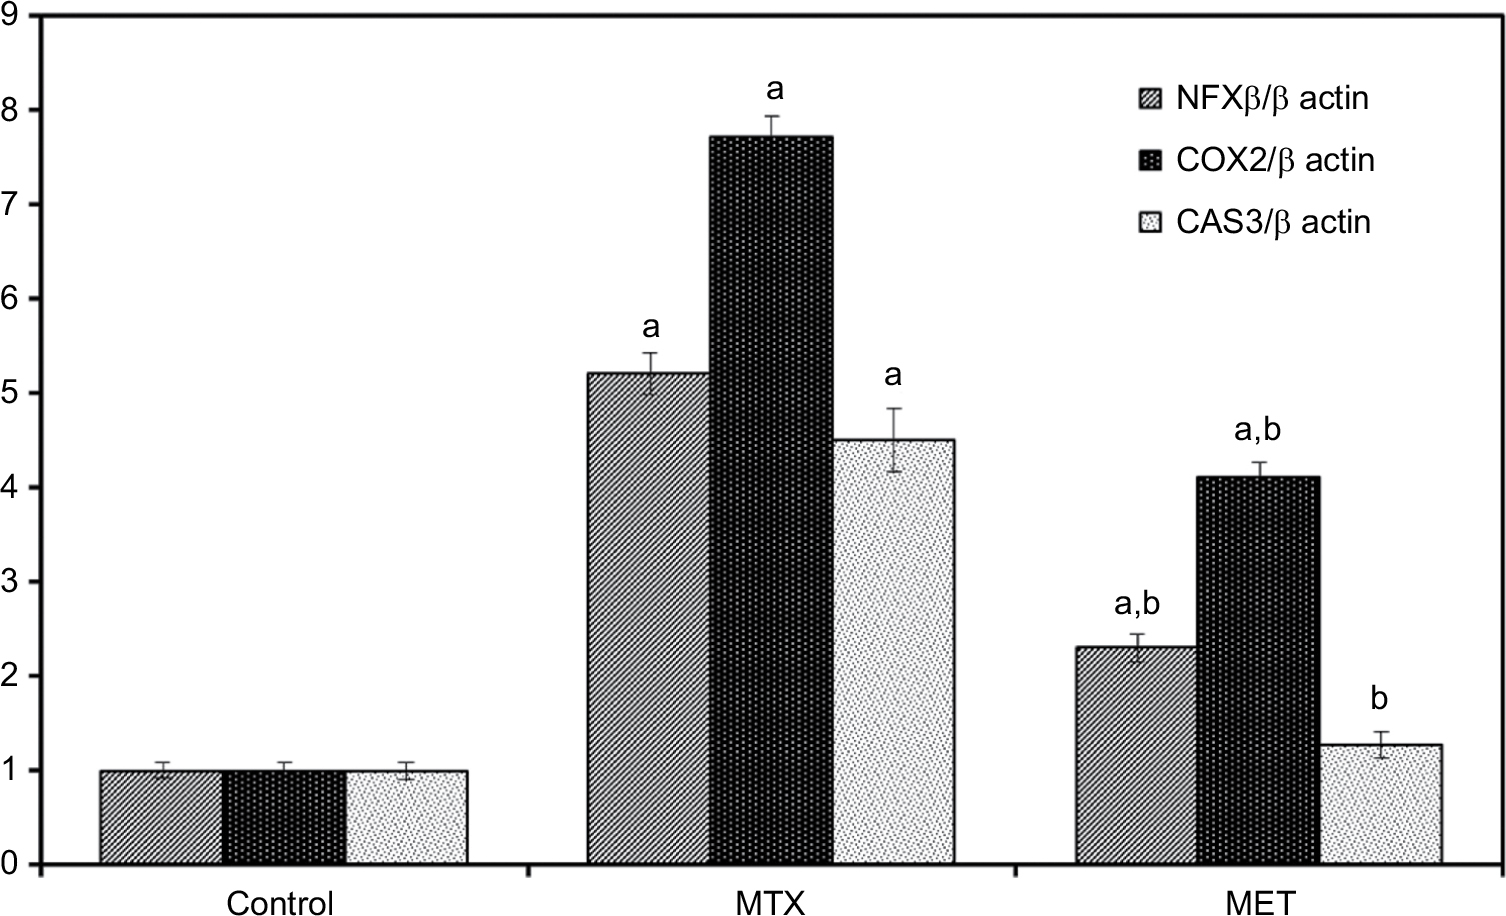
Effect of metformin on hepatic and renal NF-κB, COX-2 and Cas3 mRNA expressions
Administration of MTX led to significant up regulation of mRNA expressions of NF-κB, COX-2, and Cas 3 compared with the control group in both liver and kidney tissues. While, MET administration along with MTX led to statistically significant downregulation of these parameters compared with the MTX group and Cas 3 did not show significant differences compared with the control group in both the liver and kidney tissues (Figures 1 and 2).
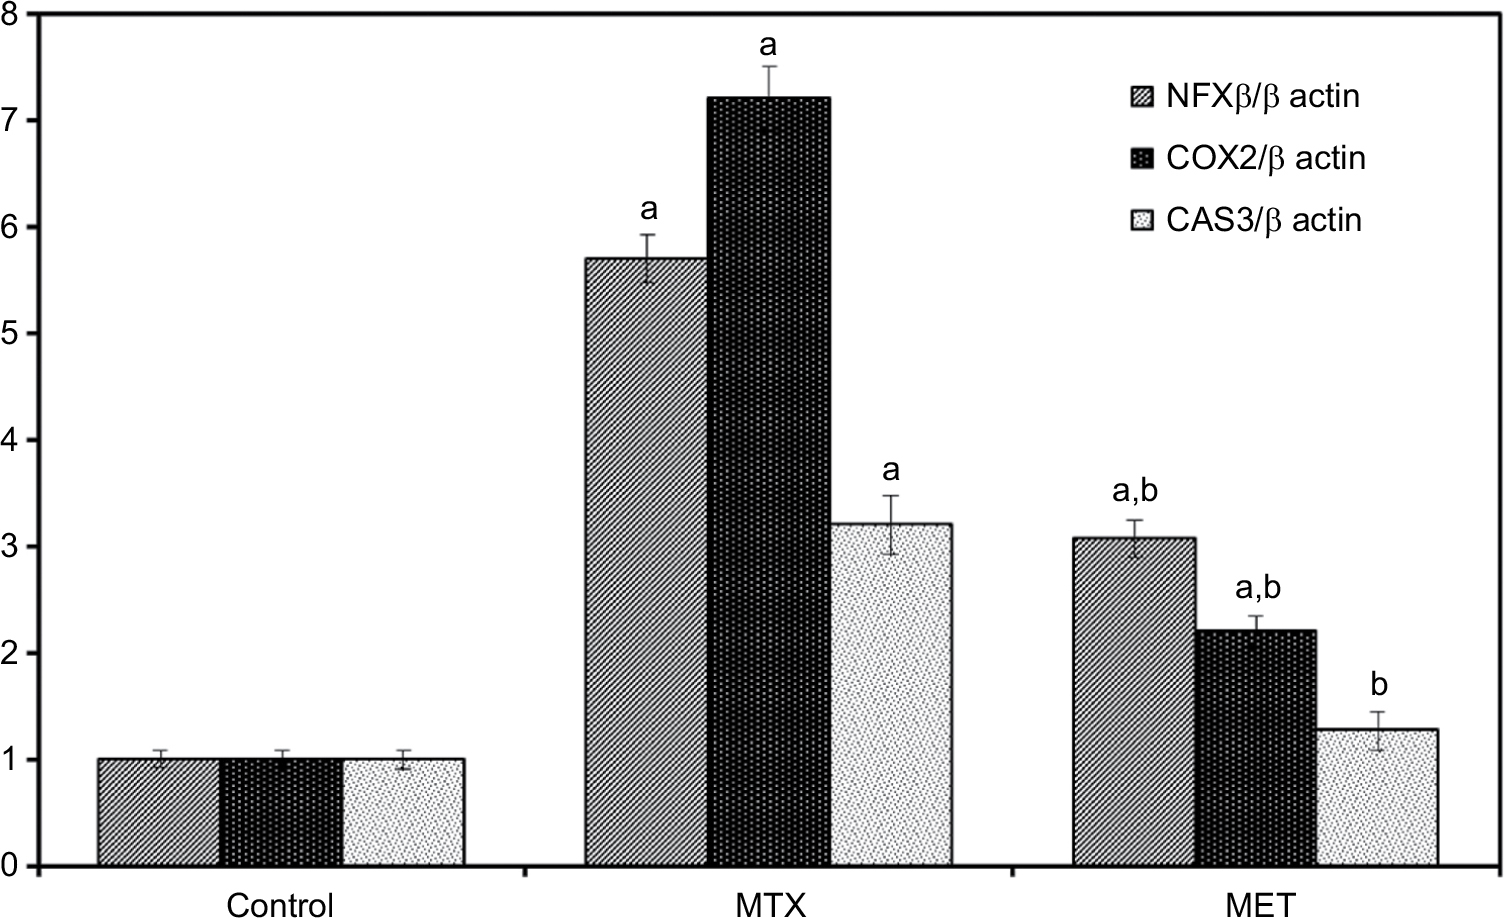 | Figure 1 Effect of metformin on hepatic NF-κB, COX-2, CAS 3 mRNA expression in rat with quantification of RT-PCR product. Notes: Data are given as mean ±SE. aP <0.05 vs control group. bP <0.05 vs MTX group. Abbreviations: NF-κB, nuclear factor kappa-light-chain-enhancer of activated B cells; COX-2, cyclooxygenase-2; CAS 3, caspase 3; MTX, methotrexate; MET, metformin. |
 | Figure 2 Effect of metformin on NF-κB, COX-2, CAS 3 mRNA expression in rat renal cortex with quantification of RT-PCR product. Notes: Data are given as mean ±SE. aP <0.05 vs control group. bP <0.05 vs MTX group. Abbreviations: NF-κB, nuclear factor kappa-light-chain-enhancer of activated B cells; COX-2, cyclooxygenase-2; CAS 3, caspase 3; MTX, methotrexate; MET, metformin. |
Histological results
Liver
H&E stained liver sections of the control group demonstrated widely spaced central veins surrounded by anastomosing polyhyderal hepatocytes with flocculent cytoplasm and central rounded single or double nuclei with prominent nucleoli. The cells are separated from each other by hepatic sinusoids (Figure 3A,B). MTX group showed loss of the normal hepatic architecture. This was in the form of thin few septa of portal fibrosis. Inflammatory cellular infiltration was evident in the portal areas. Focal areas of liver necrosis were observed. There was prominent hepatic steatosis in the form of cytoplasmic vesicles displacing and distorting the nucleus to form macrosteaotosis and microsteatosis (Figure 3C–F). The hepatotoxic effects of methotrexate including congestion, cellular infiltration and fibrosis disappeared in liver sections of the MET group except for mild dilation of the central veins and microsteatosis of some hepatocytes (Figure 3G,H).
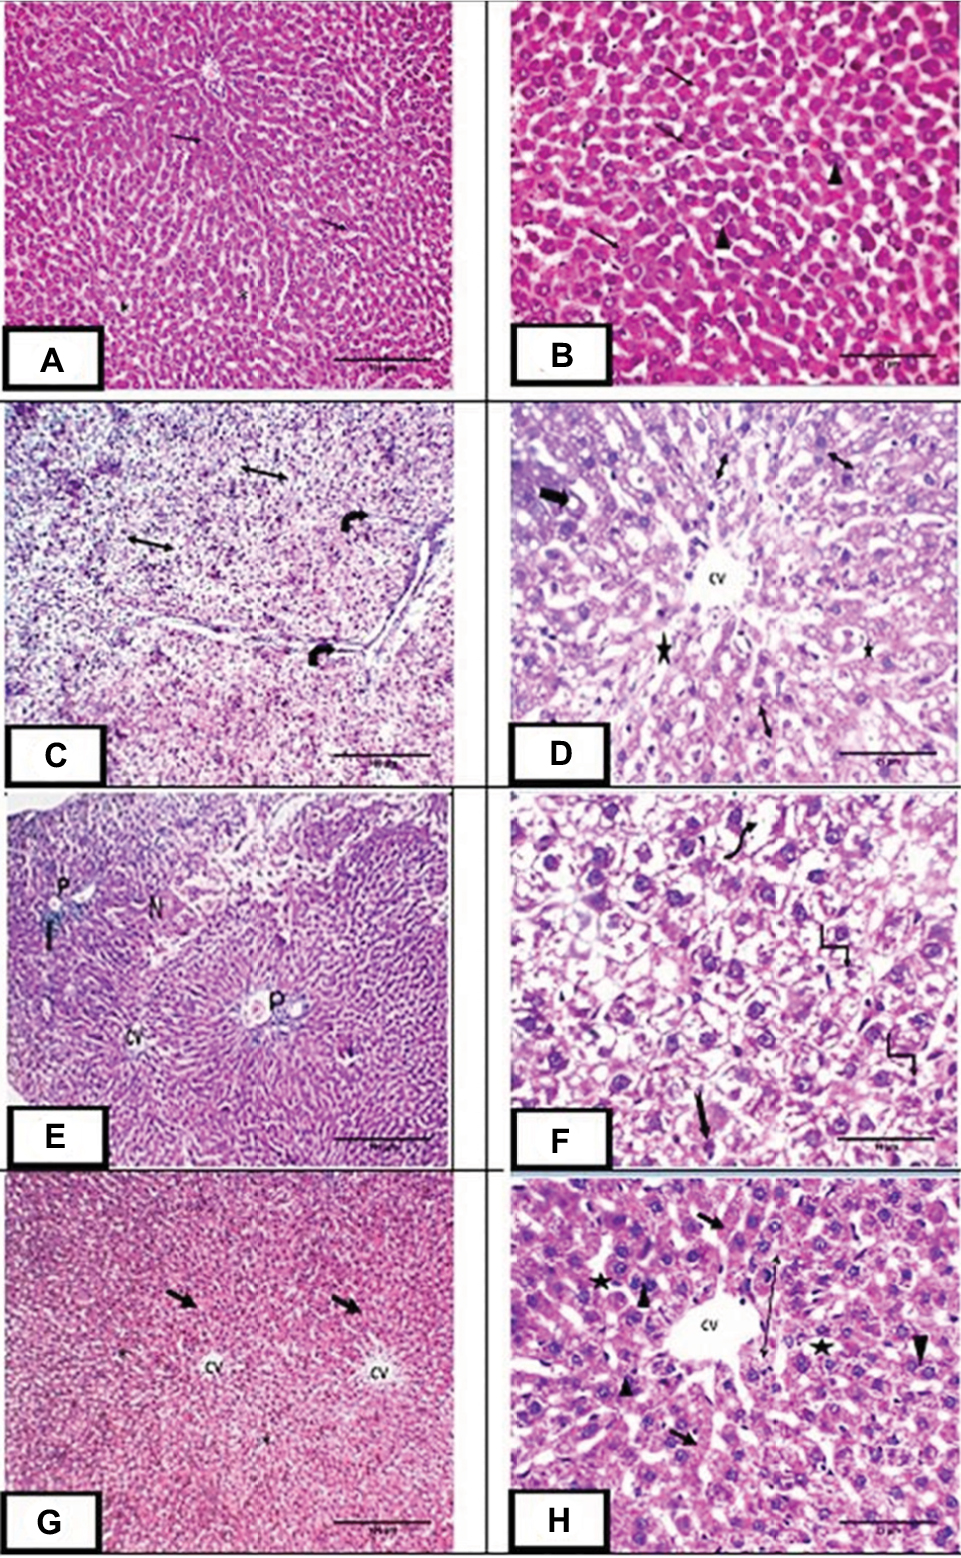 | Figure 3 H&E staining of liver sections: Notes: (A,B) Photomicrograph of liver sections of control group showing central vein (CV) surrounded by plates of polyhedral hepatocytes (arrow) with central rounded vesicular single or double nuclei (arrowhead). The spaces between cells are hepatic sinusoids (star). (C,D) Photomicrograph of liver sections of methotrexate treated group showing loss of architecture with thin few septa of portal fibrosis (curved arrow) and hepatic steatosis in the form of foamy appearance of the hepatocytes. Some hepatocytes demonstrate microsteatosis (double head arrow) and macrosteatosis (thick arrow). Dilated central vein (CV) surrounded by dilated hepatic sinusoids (*) were also observed. (E,F): Photomicrograph of liver sections of the same group showing central vein (CV), loss of architecture, necrosis (N) and cellular infiltration (I) at the portal area (P). The highly vacuolated hepatocytes exhibit nuclear pleomorphism (uneven size of the nuclei), karyolysis (wavy arrow), pyknosis (angled arrow), karyorrhexis (notched arrow). (G,H): Photomicrograph of liver sections of group III showing central vein (CV) surrounded by plates of hepatocytes (arrow) with central rounded single or double nuclei (arrowhead). Dilated hepatic sinusoids are seen between strands of hepatocytes (star). Some hepatocytes show microsteatosis (double head arrow). Magnification: (A, C, E & G) ×100, scale bar =100µm; (B, D & H) ×400, scale bar =25µm; (F) ×1000, scale bar =10µm. |
Kidney
H&E stained renal sections of the control group demonstrated normal Malpighian corpuscles with glomeruli of normal cellularity surrounded by Bowman’s capsule. Cortical tubular cells did not show vacuolations or exfoliations. Medullary tubules are also normal with normal vasculature (Figure 4A,B). MTX group demonstrated loss of normal cortical architecture. Malpighian renal corpuscle showed shrunken glomeruli and dilated capsular spaces with precipitation of some vacuolated acidophilic material. Tubular epithelial cells were greatly affected in the form of exfoliation, vacuolation and pyknosis of their nuclei. Inflammatory cellular infiltration and congested dilated peritubular blood capillaries were also observed (Figure 4C–F). MET group depicted preserved architecture except for some tubular vacuolations and mild congestion of peritubular blood capillaries (Figure 4G,H).
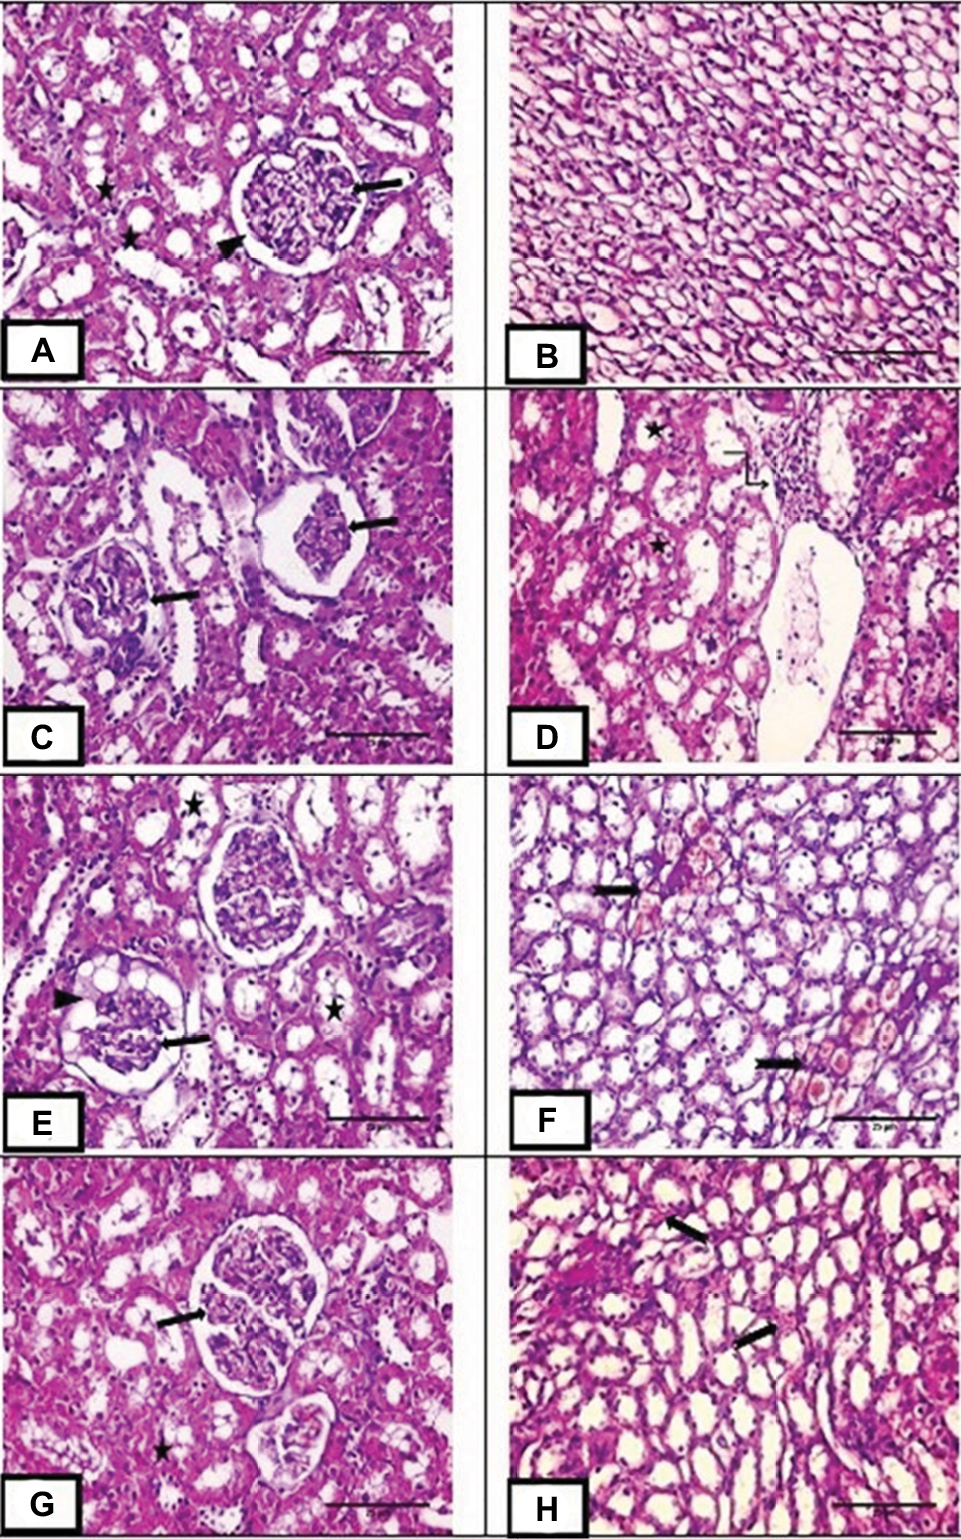 | Figure 4 H&E staining of renal sections. Notes: (A,B) Photo micrograph of renal sections of control group showing normal Malpighian corpuscle with normal glomerulus (arrow) surrounded by Bowman’s capsule (arrow head). Cortical tubules are of normal architecture (star) and medullary tubules showing normal vasculature. (C–F) Photomicrograph of renal sections of methotrexate treated group showing marked loss of normal glomerular architecture with glomerular collapse (arrow), dilated capsular space full of vacuolated acidophilic material (arrowhead). Tubular epithelial cells showing cytoplasmic vacuolation, pyknotic nuclei with some of them are exfoliated (star). Marked cellular infiltration are also observed (angled arrow). Medullary peritubular blood capillaries are dilated and congested (notched arrow). (G,H) photomicrograph of renal sections of group III showing preserved cortical architecture with normal Malpighian renal corpuscle (arrow) and normal cortical tubules except for some tubular vacuolations (star). Medullary peritubular blood capillaries showing mild congestion (notched arrow). Magnification: (A–H) ×400, scale bar =25µm. |
Comparison between the scores of liver and kidney histological observations in the studied groups
A Kruskal–Wallis H test showed that there were statistically significant differences (P<0.05) in the scores of liver and kidney histological observations between the studied groups (Table 4).
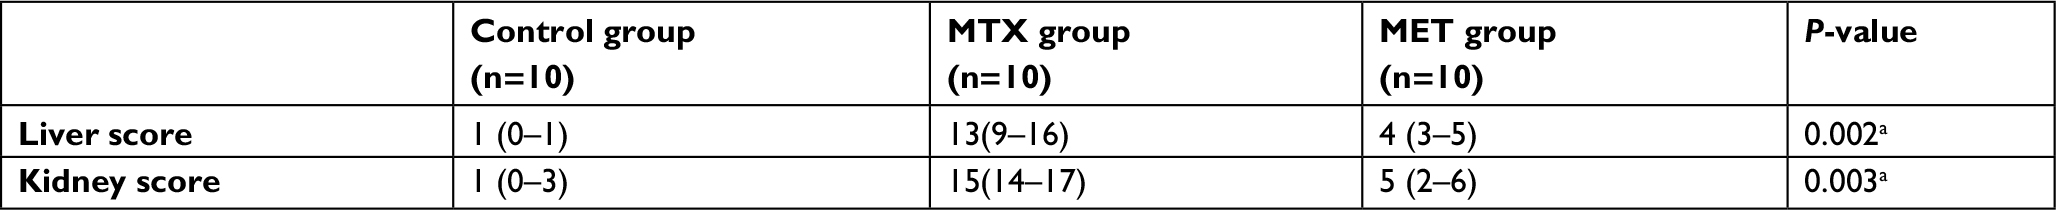 | Table 4 Comparison between the scores of liver and kidney histological observations in the studied groups Notes: Data are given as median (minimum – maximum). aP<0.05 was considered statistically significant in between groups. Abbreviations: MTX, methotrexate; MET, metformin. |
Discussion
This study investigated the possibility of protection of liver and kidney, against MTX-induced toxicity, by MET using the same dose that was used by previous experiment for ameliorating MTX-induced hepatic damage and explored the possible mechanisms involved in it.10
In the present study, MTX administration deteriorated both hepatic and renal functions as evident by biochemical analysis of ALT, AST, urea and creatinine which showed significant increases of these parameters compared with the control group.
The elevated serum activities of liver enzymes, ALT and AST are used as indicators of hepatic cell damage because both enzymes are present in the cytoplasm of hepatic cells and released when hepatic cells are exposed to injury with subsequent loss of cell membrane integrity and cellular leakage.21 MTX leads to cell damage due to its ability to bind with dihydrofolic reductase enzyme with subsequent prevention of conversion of folic acid to its active form, folinic acid. This inhibits the synthesis of nucleic acids and proteins which in turn leads to damage of organelles and cell membranes of hepatocytes allowing leakage of liver enzymes.22 In addition, MTX disturbs the kidney functions as more than 90% of MTX is filtered by the kidneys.23 MTX is poorly soluble at acidic pH so it precipitates in renal tubules and induces tubular injury.2 Moreover, MTX has a direct toxic effect on the renal tubular cells due to its inhibitory effect on dihydrofolic reductase enzyme.24
MTX-induced hepatorenal damage was confirmed by histological examinations of liver and kidney which revealed loss of normal hepatic and renal architecture.
The results of the present study suggested some of the possible mechanisms involved in MTX-induced hepatorenal toxicity. MTX administration induced oxidative stress as it led to significant increase in hepatic and renal MDA levels and significant decrease in hepatic and renal TAC levels and Na+/K+-ATPase activities compared with the control group. Oxidative stress occurs when there is imbalance between oxidants and antioxidants due to too much generation of free oxygen radicals to be overcome by antioxidants with subsequent cellular damage, lipid peroxidation,25 failure of Na+/K+-ATPase activity accompanied with cell membrane damage and decrease of TAC which is a reflection of all enzymatic and non-enzymatic antioxidants.26,27 MDA is a product of lipid peroxidation and its increase indicates that the profound lipid peroxidation is an important contributing factor in MTX-induced toxicity.25 The lipid peroxidation could be considered as a leading cause of elevated liver enzymes as it leads to damage of the cell membrane bilayers and subsequently necrosis with leakage of the cytoplasmic enzymes into the blood.28 These biochemical results were supported by the histological results of this study which showed focal areas of liver necrosis and exfoliated tubular epithelial cells of kidney.
In addition, free oxygen radicals may impair the mitochondrial function which cause energy deprivation and internalization of the Na–K-ATPase and decrease its activity.29,30 The activity of Na–K-ATPase is important for maintenance of normal polarized state of plasma membrane and normal functions of the cells especially renal epithelial cells which responsible for maintenance of solute reabsorption and volume homeostasis.31 Moreover, ATP depletion due to mitochondrial dysfunction disrupts the tight junctions and leads to leakage of extracellular fluid into the renal tubular lumen with subsequent disturbance of renal functions.32
However, concomitant administration of MET with MTX could protect the liver and kidney from the toxic effects of MTX as evident by significant decreases of ALT, AST, urea and creatinine compared with MTX group but they did not reach normal levels. These results were supported by histological examinations of liver and kidneys.
The hepatorenal protective effects of MET could be explained by their antioxidant effects as the results of the current study showed that concomitant administration of MET to MTX significantly decreased the hepatic and renal MDA levels and significantly increased the hepatic and renal TAC levels and Na+/K+-ATPase activities compared with MTX group. The antioxidant effects of MET may be attributed to its ability to increase the expression of heme oxygenase-1 (HO-1) that protects against oxidative stress-induced damage. Hence, MET could prevent oxygen free radical production with subsequent prevention of lipid peroxidation, cell membrane damage, exhaustion of antioxidant capacity and mitochondrial impairment.33
Another possible mechanisms of MTX-induced hepatorenal damage were demonstrated by the histological examinations of liver and kidney which revealed that MTX induce inflammatory and apoptotic responses in both organs.
Moreover, The biochemical analysis of the expression of inflammatory and apoptotic markers supported the histological findings as it showed that MTX administration led to significant up regulation of mRNA expressions of inflammatory markers including NF-κB and COX-2 and apoptosis marker cas3 compared with control group in both liver and kidney tissues. MTX-induced hepatorenal inflammation may be attributed to oxidative stress which stimulates TNF-a/NF-kB/COX-2 inflammatory pathway with subsequent motivation of automated cell death, apoptosis.4 TNF-α stimulates the phosphorylation of the I kappa B-alpha, that induces proteasome-mediated degradation and releases the active form of NF-κB that is translocated to the nucleus and activates many genes expression.34 These genes have binding sites for NF-κB at their promoter regions so when bound increase the expression of COX-2.35
COX-2, is an enzyme, activates the conversion of arachidonic acid to prostaglandins which play an important role in the development of the inflammatory response.36 The accumulated pro-inflammatory cytokines activate specific pro-apoptotic signals via caspase cascade.37 In addition, the caspase cascades could be initiated by MTX-induced oxidative stress which enhances DNA fragmentation and denaturation that activates c-Jun N-terminal kinase which in turn initiates programmed cell death via caspase cascades.38,39
However, the results of the current work showed that concomitant administration of MET along with MTX led to significant downregulation of NF-κB , COX-2 and cas 3 mRNA expressions in liver and kidney tissues. The anti-inflammatory and anti-apoptotic effects of MET might be explained by its antioxidant effects as proved by the results of this study. The anti-apoptotic effect of MET was previously studied in a model of doxorubicin-induced cardiotoxicity by Al-Kuraishy and Hussein.40 Therefore, we could consider MET is a rescue therapy for cancer treatment.
Conclusion
MET could reduce MTX-induced hepatorenal toxicity through antioxidant, anti-inflammatory and anti-apoptotic mechanisms. Since the anticancer effects of MET is now studied by previous experiments we could suspect that MET will be successful adjuvant to MTX chemotherapy that could prevent its toxicity on liver and kidney and increase its antitumor efficacy. Future studies are needed to evaluate the efficacy and safety of MTX after adding MET to it in different cancer models and to relate the rat findings to human.
Disclosure
The authors report no conflicts of interest in this work.
References
Bayat Mokhtari R, Homayouni TS, Baluch N, et al. Combination therapy in combating cancer. Oncotarget. 2017;8(23):38022. | ||
Widemann BC, Adamson PC. Understanding and managing methotrexate nephrotoxicity. Oncologist. 2006;11(6):694–703. | ||
Tousson E, Atteya E, El-Atrash E, Jeweely O. I. Abrogation by Ginkgo Byloba leaf extract on hepatic and renal toxicity induced by methotrexate in rats. J Cancer Res Treat. 2014;2(3):44–51. | ||
El-Sheikh AA, Morsy MA, Abdalla AM, Hamouda AH, Alhaider IA. Mechanisms of thymoquinone hepatorenal protection in methotrexate-induced toxicity in rats. Mediators Inflamm. 2015;2015:1–12. | ||
Nasri H, Baradaran A, Ardalan MR, Mardani S, Momeni A, Rafieian-Kopaei M. Bright renoprotective properties of metformin: beyond blood glucose regulatory effects. Iran J Kidney Dis. 2013;7(6):423. | ||
Bhalla K, Hwang BJ, Dewi RE, et al. Metformin prevents liver tumorigenesis by inhibiting pathways driving hepatic lipogenesis. Cancer Prev Res. 2012;5(4):544–552. | ||
Davies G, Lobanova L, Dawicki W, et al. Metformin inhibits the development, and promotes the resensitization, of treatment-resistant breast cancer. PLoS One. 2017;12(12):e0187191. | ||
Nasri H, Rafieian-Kopaei M. Metformin: Current knowledge. J Res Med Sci. 2014;19(7):658. | ||
Isoda K, Young JL, Zirlik A, et al. Metformin inhibits proinflammatory responses and nuclear factor-kappaB in human vascular wall cells. Arterioscler Thromb Vasc Biol. 2006;26(3):611–617. | ||
Hadi NR, Al-Amran FG, Swadi A. Metformin ameliorates methotrexate-induced hepatotoxicity. J Pharmacol Pharmacother. 2012;3(3):248. | ||
Beeton C, Garcia A, Chandy KG. Drawing blood from rats through the saphenous vein and by cardiac puncture. J Vis Exp. 2007;7(7):266. | ||
Draper HH, Csallany AS, Hadley M. Urinary aldehydes as indicators of lipid peroxidation in vivo. In Pryor WA, editor. Bio-Assays for Oxidative Stress Status: BOSS. Elsevier; 2001:184–190. | ||
Benzie IF, Szeto YT. Total antioxidant capacity of teas by the ferric reducing/antioxidant power assay. J Agric Food Chem. 1999;47(2):633–636. | ||
Fiske CH, Subbarow Y. The colorimetric determination of phosphorus. J. biol. Chem. 1925;66(2):375–400. | ||
Lowry OH, Rosebrough NJ, Farr AL, Randall RJ. Protein measurement with the Folin phenol reagent. J Biol Chem. 1951;193(1):265–275. | ||
El-Magd MA, Abbas HE, El-Kattawy AM, Mokhbatly A. Novel polymorphisms of the IGF1R gene and their association with average daily gain in Egyptian buffalo (Bubalus bubalis). Domest Anim Endocrinol. 2013;45(2):105–110. | ||
Livak KJ, Schmittgen TD. Analysis of relative gene expression data using real-time quantitative PCR and the 2(-Delta Delta C(T)) Method. Methods. 2001;25(4):402–408. | ||
Bancroft JD, Layton C. The hematoxylin and eosin. In Suvarna SK, Layton C, Bancroft JD, editors. Theory and practice of histological techniques. 7th ed. Philadelphia: Churchill Livingstone, Elsevier; 2013:173–214. | ||
Knodell RG, Ishak KG, Black WC, et al. Formulation and application of a numerical scoring system for assessing histological activity in asymptomatic chronic active hepatitis. Hepatology. 1981;1(5):431–435. | ||
Melnikov VY, Faubel S, Siegmund B, Lucia MS, Ljubanovic D, Edelstein CL. Neutrophil-independent mechanisms of caspase-1- and IL-18-mediated ischemic acute tubular necrosis in mice. J Clin Invest. 2002;110(8):1083–1091. | ||
Ramaiah SK. A toxicologist guide to the diagnostic interpretation of hepatic biochemical parameters. Food Chem Toxicol. 2007;45(9):1551–1557. | ||
Sakeran MI, Zidan N, Rehman H, Aziz AT, Saggu S. Abrogation by Trifolium alexandrinum root extract on hepatotoxicity induced by acetaminophen in rats. Redox Rep. 2014;19(1):26–33. | ||
Izzedine H, Launay-Vacher V, Karie S, Caramella C, de Person F, Deray G. Is low-dose methotrexate nephrotoxic? Case report and review of the literature. Clin Nephrol. 2005;64(4):315–319. | ||
Messmann R, Allegra C. Antifolates. Cancer Chemotherapy and Biotherapy. Philadelphia: Lippincott Williams & Wilkins; 2001:139:184. | ||
Jahovic N, Şener G, Çevik H, Ersoy Y, Arbak S, Yeğen BC. Amelioration of methotrexate-induced enteritis by melatonin in rats. Cell Biochem Funct. 2004;22(3):169–178. | ||
Çakır T, Baştürk A, Polat C, et al. Does alfa lipoic acid prevent liver from methotrexate induced oxidative injury in rats? Acta Cir Bras. 2015;30(4):247–252. | ||
Sharma SL, Chokshi SA, Chakraborti C. Enzymatic antioxidants, malondialdehyde, and total antioxidant activity as markers of oxidative-stress in arthritis and rheumatoid arthritis. NHL Journal of Medical Sciences. 2014;3(2). | ||
Walker TM, Rhodes PC, Westmoreland C. The differential cytotoxicity of methotrexate in rat hepatocyte monolayer and spheroid cultures. Toxicol In Vitro. 2000;14(5):475–485. | ||
Miyazono Y, Gao F, Horie T. Oxidative stress contributes to methotrexate-induced small intestinal toxicity in rats. Scand J Gastroenterol. 2004;39(11):1119–1127. | ||
Takiar V, Nishio S, Seo-Mayer P, et al. Activating AMP-activated protein kinase (AMPK) slows renal cystogenesis. Proc Natl Acad Sci U S A. 2011;108(6):2462–2467. | ||
Plotnikov EY, Chupyrkina AA, Jankauskas SS, et al. Mechanisms of nephroprotective effect of mitochondria-targeted antioxidants under rhabdomyolysis and ischemia/reperfusion. Biochim Biophys Acta. 2011;1812(1):77–86. | ||
Morales AI, Detaille D, Prieto M, et al. Metformin prevents experimental gentamicin-induced nephropathy by a mitochondria-dependent pathway. Kidney Int. 2010;77(10):861–869. | ||
Conde de La Rosa L, Vrenken TE, Buist-Homan M, Faber KN, Moshage H. Metformin protects primary rat hepatocytes against oxidative stress-induced apoptosis. Pharmacol Res Perspect. 2015;3(2):e00125. | ||
Brown K, Gerstberger S, Carlson L, Franzoso G, Siebenlist U. Control of I kappa B-alpha proteolysis by site-specific, signal-induced phosphorylation. Science. 1995;267(5203):1485–1488. | ||
Crofford LJ, Tan B, Mccarthy CJ, Hla T. Involvement of nuclear factor kappa B in the regulation of cyclooxygenase-2 expression by interleukin-1 in rheumatoid synoviocytes. Arthritis Rheum. 1997;40(2):226–236. | ||
Ricciotti E, Fitzgerald GA. Prostaglandins and inflammation. Arterioscler Thromb Vasc Biol. 2011;31(5):986–1000. | ||
Compare D, Coccoli P, Rocco A, et al. Gut–liver axis: the impact of gut microbiota on non- alcoholic fatty liver disease. Nutr Metab Cardiovasc Dis. 2012;22(6):471–476. | ||
Prahalathan C, Selvakumar E, Varalakshmi P. Protective effect of lipoic acid on adriamycin-induced testicular toxicity. Clin Chim Acta. 2005;360(1-2):160–166. | ||
Cho HW, Park SK, Heo KW, Hur DY. Methotrexate induces apoptosis in nasal polyps via caspase cascades and both mitochondria-mediated and p38 mitogen-activated protein kinases/Jun N-terminal kinase pathways. Am J Rhinol Allergy. 2013;27(1):e26–e31. | ||
Al-Kuraishy HM, Hussein RG. Caspase-3 levels (CASP-3) in doxorubicin induced-cardiotoxicity: role of metformin pretreatment. Research Journal of Oncology. 2017;1(1). |
 © 2018 The Author(s). This work is published and licensed by Dove Medical Press Limited. The
full terms of this license are available at https://www.dovepress.com/terms
and incorporate the Creative Commons Attribution
- Non Commercial (unported, 3.0) License.
By accessing the work you hereby accept the Terms. Non-commercial uses of the work are permitted
without any further permission from Dove Medical Press Limited, provided the work is properly
attributed. For permission for commercial use of this work, please see paragraphs 4.2 and 5 of our Terms.
© 2018 The Author(s). This work is published and licensed by Dove Medical Press Limited. The
full terms of this license are available at https://www.dovepress.com/terms
and incorporate the Creative Commons Attribution
- Non Commercial (unported, 3.0) License.
By accessing the work you hereby accept the Terms. Non-commercial uses of the work are permitted
without any further permission from Dove Medical Press Limited, provided the work is properly
attributed. For permission for commercial use of this work, please see paragraphs 4.2 and 5 of our Terms.