Back to Journals » OncoTargets and Therapy » Volume 12
Metabonomic Variation of Exopolysaccharide from Rhizopus nigricans on AOM/DSS-Induced Colorectal Cancer in Mice
Authors Lu Y, Wang J, Ji Y, Chen K ![]()
Received 8 August 2019
Accepted for publication 4 November 2019
Published 20 November 2019 Volume 2019:12 Pages 10023—10033
DOI https://doi.org/10.2147/OTT.S226451
Checked for plagiarism Yes
Review by Single anonymous peer review
Peer reviewer comments 2
Editor who approved publication: Dr Leo Jen-Liang Su
Yan Lu,1 Jiayue Wang,1 Yueshan Ji,1 Kaoshan Chen1–3
1School of Life Science, Shandong University, Qingdao 266000, People’s Republic of China; 2National Glycoengineering Research Center, Shandong University, Qingdao 266000, People’s Republic of China; 3Anhui Provincial Engineering Research Center for Polysaccharide Drugs, Anhui Province Key Laboratory of Active Biological Macromolecules, Drug Research & Development Center, School of Pharmacy, Wannan Medical College, Wuhu 241002, People’s Republic of China
Correspondence: Kaoshan Chen
School of Life Science and National Glycoengineering Research Center, Shandong University, No. 72 Binhai Road, Qingdao 266000, People’s Republic of China
Tel/Fax +86 532 5863 0858
Email [email protected]
Background: Colorectal cancer (CRC), which occurs at the junction of the rectum and sigmoid colon, is a common malignancy associated with poor prognosis and high mortality worldwide. The exopolysaccharide (EPS1-1), isolated from the fermentation broth of Rhizopus nigricans (R. nigricans), has been reported to possess anti-CRC properties. However, the metabolic alterations caused by azoxymethane (AOM) and dextran sulfate sodium (DSS) are still unknown.
Methods: In the present study, a mice colon cancer model was established by treatment with AOM/DSS. LC-MS/MS-based metabolomics studies were performed to analyze metabolic alterations at the tissue level. Partial least squares discriminant analysis (PLS-DA) was used to identify differentially expressed metabolites.
Results: Nineteen distinct metabolites were identified that were associated with disruptions in the following pathways: biosynthesis of unsaturated fatty acids, pyrimidine metabolism, phenylalanine metabolism, fatty acid metabolism, folate biosynthesis, and inositol phosphate metabolism. Furthermore, six significantly altered metabolites were involved in these six pathways. Compared with the Model group, the expression of cytosine, deoxyuridine, 20-hydroxy-leukotriene E4, and L-homocysteic acid was lower, whereas that of 2-dehydro-3-deoxy-6-phospho-D-gluconic acid and hematoporphyrin was higher in the EPS1-1 group.
Conclusion: The results of multivariate statistical analysis demonstrate a promising application of the above metabolites by EPS1-1 in CRC therapy. Deeper understanding of the related mechanism warrants further investigation.
Keywords: exopolysaccharide, Rhizopus nigricans, metabolomics, colorectal cancer, azoxymethane/dextran sulfate sodium, LC-MS/MS
Introduction
Colorectal cancer (CRC) is the second most common cancer in women and the most common cancer in men worldwide.1 With changes in life styles and nutritional habits, the incidence and mortality rates of CRC in China have increased gradually in recent years.2 The effective treatments for CRC are surgery, radiation, and chemotherapy in various combinations, but patients still typically have a poor prognosis, resulting in severe side effects, such as nausea, vomiting, weight loss, and anemia.3 Therefore, there is an urgent need to explore novel therapeutic agents for the treatment of CRC patients.
Increasing evidence has indicated that fungi polysaccharides possess various biological activities, including anti-tumor,4 anti-inflammatory,5 and immunopotentiation6 functions. Fungi polysaccharides, with no or poor toxicity, have attracted much attention in medical research. R. nigricans, a zygomycete filamentous fungus, is widely used in the pharmaceutical industry for processes such as biotransformation and production of organic acids.7 We previously reported that the exopolysaccharide (EPS1-1), isolated from the fermentation broth of R. nigricans, is a 9682 Da consisting of glucose, mannose, galactose, and fructose in β-anomeric configuration in the molar ratio of 5.89:3.64:3.20:1.00.8 Previous studies showed that EPS1-1 could induce apoptosis in HCT-116 colon cancer cells through the mitochondrial pathway8 and significantly inhibit the occurrence and development of AOM/DSS-induced colorectal cancer in mice.9 In addition, EPS1-1 also possesses immuno-enhancing activities.10 However, mechanistic studies aiming to understand EPS1-1-mediated metabolic alterations in colon cancer leading to cancer prevention have not been reported till date.
In recent years, metabolomics has emerged as a powerful tool for exploring metabolites (with molecular weight <1000 Da) and to characterize the metabolic phenotype of a biological system. It presents great potential for the investigation of perturbed metabolic profiles in tumor studies, prognostic or predicative interpretation of cancer status, and exploring the mechanisms of cancer drug intervention.11,12 With the emergence of liquid chromatography-mass spectrometry (LC-MS/MS)-based metabolomics, it is possible to profile and even quantify the metabolites found in a pathway. Metabolites have been applied widely in studies of CRC,13 breast cancer,14 lung cancer,15 bladder cancer,16 oral cancer,17 prostate cancer,18 pancreatic cancer,19 and so on. In this study, to investigate the metabolic profiles and potential biomarkers in a mouse model of AOM/DSS-induced CRC, LC-MS/MS-based metabolomics was used. Moreover, the effects of EPS1-1 against carcinogenesis and on the metabolic profile were also detected by this strategy. Our findings provide new insights into the diagnosis of cancer at the metabolic level and help to identify the underlying molecular mechanisms of EPS1-1 treatment.
Materials and Methods
Chemicals and Reagents
Azoxymethane (AOM) was purchased from Sigma Aldrich (St. Louis, MO, USA). Dextran sulfate sodium salt (DSS) was obtained from Yuanye Tech. Co. Ltd (Shanghai, China). DEAE Sepharose Fast Flow, Sephadex G-100, and Sephadex G-75 columns were purchased from GE Healthcare Life Sciences (Sweden). Methanol, fatty acids, ammonium acetate, cellulose acetate nitrate, and l-2-chlorophenylalanine were supplied from Dingguo Corp (Beijing, China).
Preparation of Exopolysaccharide (EPS1-1)
R. nigricans was isolated from straw and preserved in the Laboratory of Biomass Resources, Shandong University (Qingdao, China). EPS1-1 was obtained according to a previously reported method.8 Briefly, R. nigricans was cultured in potato dextrose broth at 28°C and 130 rpm for 10 days. The fermentation liquor was precipitated with three volumes of 95% ethanol overnight at 4°C. The precipitate was dissolved in distilled water for deproteinization by the savage method and decoloration by D301R resin, followed by dialysis and lyophilization. The colorless powder was further purified using DEAE-Sepharose column (1.6 cm × 20 cm), Sephadex G-100 column (1.6 cm × 60 cm), and Sephadex G-50 column (1.6 cm × 60 cm). The exopolysaccharide obtained was named EPS1-1.
Animal Experiments
The animal studies were performed in accordance with the regulations of the Affairs Concerning Experimental Animals of China and the Ethics Committee of Shandong University with the approval number SYDWLL-2018-12. Mouse-colitis-associated colorectal cancer was induced according to a previously described method.9 Thirty healthy male BALB/c mice (4–6 weeks old, body weight 18–22 g) were obtained from Beijing Vital River Laboratories Co. (Beijing, China). The mice were adapted to a new environment (25 ± 2°C, 40 ± 10% relative humidity, and a 12:12 light dark cycle) for a week and had free access to water and food. As shown in Figure 1A, mice were randomized into three groups: Model group (n = 10), intraperitoneally injected with AOM (10 mg/kg) and fed 2.5% DSS after a week for seven days and then normal water for 2 weeks for four cycles; EPS1-1 group (n = 10), orally treated with EPS1-1 (180 mg/kg) daily from the first day of the first cycle till the end; Control group (n = 10), free access to regular water and food. At the end of the experimental procedure, all mice were sacrificed and intestinal tissue samples (from cecum to the anal verge) were collected for metabolomic data analysis. Sera samples were used for the measurement of blood lipids. All samples were stored at −80°C until additional analysis.
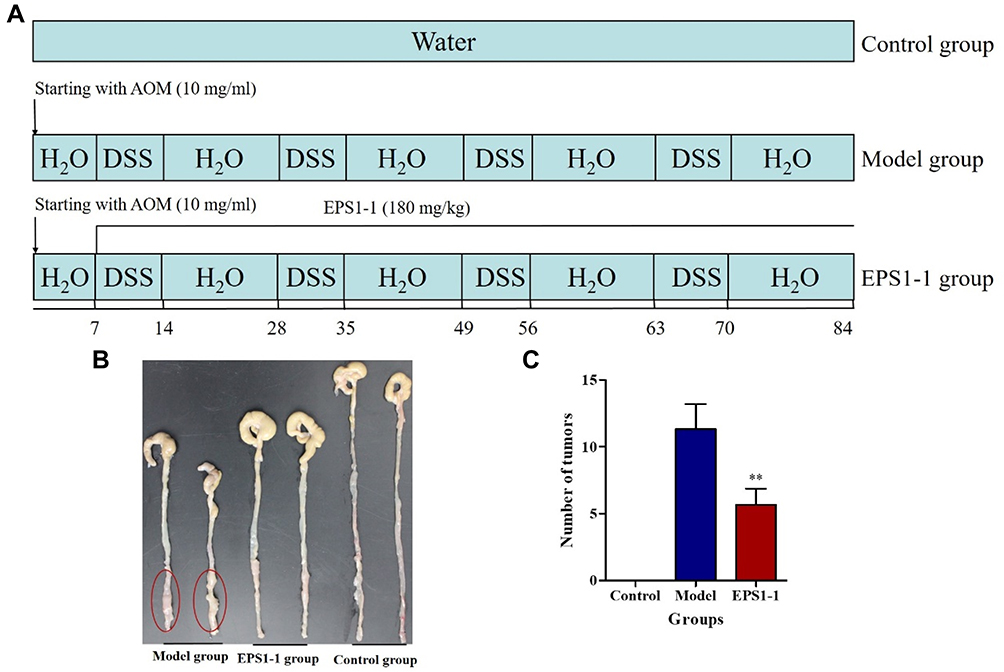 |
Figure 1 Effect of EPS1-1 on AOM/DSS-induced colorectal cancer. (A) Experimental procedure of a murine model of colorectal cancer induced by AOM/DSS. (B) Macroscopic photos of colon tissues in the Control, Model, and EPS1-1 groups. (C) Number of tumors in the Control, Model, and EPS1-1 groups was counted. Compared to the Model group, **p < 0.01. |
Extraction of Metabolites
Frozen intestinal tissues (100 mg) were individually ground with liquid nitrogen, following which 200 μL of L-2-chlorophenylalanine was added to the powder. 400 μL of precooled 80% methanol was added to 100 μL of each homogenate, followed by vortexing. Samples were incubated at −20°C for 60 mins and then centrifuged at 14,000 g at 4°C for 15 mins. The supernatants were transferred to a fresh microcentrifuge tube and dried under vacuum in a centrifugal evaporator. Dried metabolite pellets were redissolved in 80% methanol and analyzed by LC-MS/MS.
LC-MS/MS Analysis
LC-MS/MS analysis was performed using a Vanquish UHPLC system (Thermo Fisher) coupled with an Orbitrap Q Exactive HF-X mass spectrometer (Thermo Fisher) operating in the data-dependent acquisition (DDA) mode. Samples were injected onto an Accucore HILIC column (100 × 2.1 mm, 2.6 μm) using a 20-mins linear gradient at a flow rate of 0.3 mL/min. The eluents of the positive polarity mode were eluent A (0.1% FA in 95% CAN, 10 mM ammonium acetate) and eluent B (0.1% FA in 95% CAN, 10 mM ammonium acetate). The eluents of the negative polarity mode were eluent A (95% CAN, 10 mM ammonium acetate, pH 9.0) and eluent B (50% CAN, 10 mM ammonium acetate, pH 9.0). The solvent gradient was set as follows: 2% B, 1 min; 2–50% B, 16.5 mins; 50–2% B, 2.5 mins. Q-Exactive Hf-X mass spectrometer was operated in positive/negative polarity mode with spray voltage of 3.2 kV, capillary temperature of 320°C, sheath gas flow rate of 35 arb, and aux gas flow rate of 10 arb.
Data Processing and Multivariate Data Analysis
The acquired raw data from LC-MS/MS analysis were imported to the CD search library. Data pretreatment procedures such as peak detection, deconvolution, normalization, alignment, denoising, and data reduction were performed to obtain a list of mass and retention times corresponding to all the detected peaks from each data file in the data set. SIMCA_P software was used for principal component analysis (PCA) for showing the distribution of origin data, and PLS-DA was used to check the model’s validity. Based on variable importance in the projection (VIP) threshold of 1 from the PLS-DA model, metabolites responsible for the difference between the AOM/DSS-induced CRC mice and the other two groups could be obtained. In parallel, the metabolites identified by the OPLS-DA model were validated at a univariate level using the S-plots. Metabolic pathways were identified using Kyoto Encyclopedia of Genes and Genomes (KEGG) and MetPA. Statistical significance analysis was performed using SPSS 17.0 software (SPSS 17.0 (SPSS Inc., Chicago, IL)). Multiple group comparisons were tested using one-way analysis of variance (ANOVA) followed by Dunnett’s test. p-value <0.05 was considered to be statistically significant.
Results
EPS1-1 Inhibits Tumor Growth in AOM/DSS-Induced Colorectal Cancer Tissues
To demonstrate the anti-CRC properties of EPS1-1, a mouse model induced by AOM/DSS was generated as described previously (Figure 1A). Thirty male BALB/c mice were sacrificed at the end of the experiment and colon tissues were collected. As shown in Figure 1B and C, mice in EPS1-1 group demonstrated a significant decrease in the number of colon tumors as compared with the Model group, which are consistent with our previous reports.9 This suggests that EPS1-1 can effectively suppress AOM/DSS-induced colorectal cancer tumorigenesis.
LC-MS/MS Metabolite Analysis
Typical LC-MS/MS total ion current (TIC) chromatograms of colonic tissue samples from Control, Model, and EPS1-1 groups are shown in Figure 2. Majority of the peaks in the TIC profiles were identified by their retention times, mass spectra characteristics, and the LECO Fiehn Metabolomics Library. As shown in Figure 2, peaks among the three groups presented various differences, suggesting that the TIC chromatograms could mirror the distinction among the three groups.
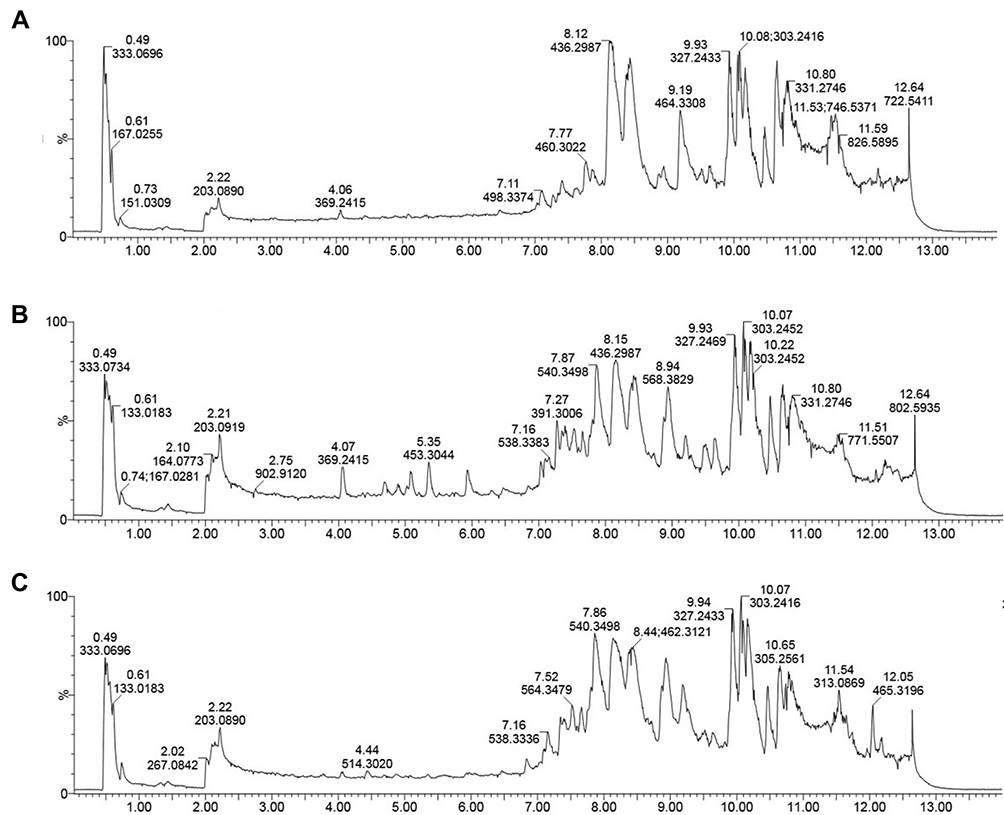 |
Figure 2 Representative LC-MS/MS total ion current (TIC) chromatograms of the three groups. (A) Control group; (B) Model group; (C) EPS1-1 group. |
Statistical Comparison of Metabolites in the Three Groups
To evaluate the effect of EPS1-1 on induced colorectal cancer mice, metabolomic data analysis was performed. PLS-DA was used to obtain a higher level of group separation, and hence, get a better understanding of variables responsible for classification. As shown in Figure 3, the PLS-DA score parameters were as follows: R2Y = 0.98, Q2Y = 0.2 for Model vs Control; R2Y = 0.98, Q2Y = 0.24 for EPS1-1 vs Control; and R2Y = 0.98, Q2Y = −0.04 for EPS1-1 vs Model (Figure 3A–C). These data indicate that the model was stable. To further validate our model, a signal 10-fold cross-validation was performed to evaluate the robustness and the predictive ability of the model.20 The R2 and Q2 intercept values were 0.95 and −0.78 (Figure 3D), 0.96 and −0.7 (Figure 3E), and 0.94 and −0.59 (Figure 3F) after 200 permutations for Model vs Control, EPS1-1 vs Control, and EPS1-1 vs Model, respectively. The low values of Q2 intercept highlighted the robustness of the models, and thus demonstrated a lower risk of over fitting.21 Therefore, these data indicate that the PLS-DA model could be used to identify differences among the three groups.
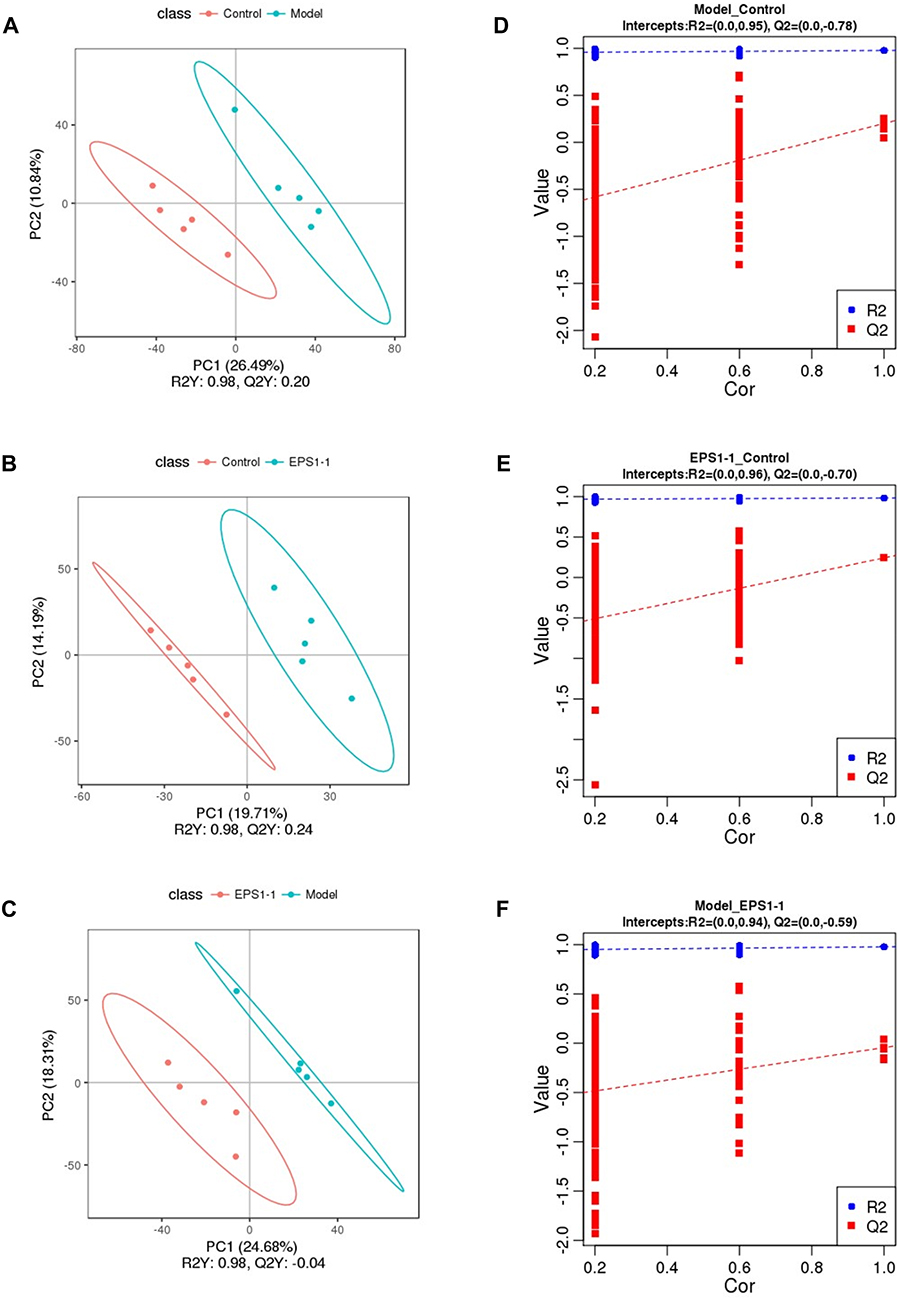 |
Figure 3 PLS-DA score plots (A–C), validation plots of PLS-DA valid (D–F) derived from LC-MS/MS metabolite profiles of Model vs Control (A and D), EPS1-1 vs Control (B and E), EPS1-1 vs Model (C and F). |
Metabolite Analysis Among the Three Groups
In this study, we detected 1257, 1257, and 1288 altered compounds for Model vs Control, EPS1-1 vs Control, and Model vs EPS1-1, respectively. Among these, the number of identified metabolites were 74, 45, and 13 for Model vs Control, EPS1-1 vs Control, and Model vs EPS1-1, respectively. A total of 19 significantly altered metabolites were identified based on p-values from the two-tailed student’s t-test (p < 0.05) and VIP values from the OPLS-DA models (VIP ≥ 1). However, 6 metabolites were ultimately identified as common to all three groups (Table 1). These significantly altered potential metabolites were cytosine, deoxyuridine, 2-dehydro-3-deoxy-6-phospho-Dgluconic acid, 20-hydroxy-leukotriene E4, hematoporphyrin, and L-homocysteic acid. Compared with the Control group, the altered metabolites included increased cytosine, deoxyuridine, 20-hydroxy-leukotriene E4, hematoporphyrin, and L-homocysteic acid. 2-dehydro-3-deoxy-6-phospho-D-gluconic acid was decreased when compared with Model group. Furthermore, L-homocysteic acid levels were lower, whereas 2-dehydro-3-deoxy-6-phospho-D-gluconic acid levels were higher in EPS1-1 group than the Model group, indicating that significant metabolic profiling changes were induced by EPS1-1. Heatmap in Figure 4 shows that the significantly altered metabolites in Model group were reversed in EPS1-1 group. The representative metabolites are displayed in box-and-whisker plots (Figure 5), along with the concentration range, median quartiles, and extremes. The change in metabolite expression upon EPS1-1 treatment is in accordance with its anti-tumor effects as demonstrated in our previous report.9
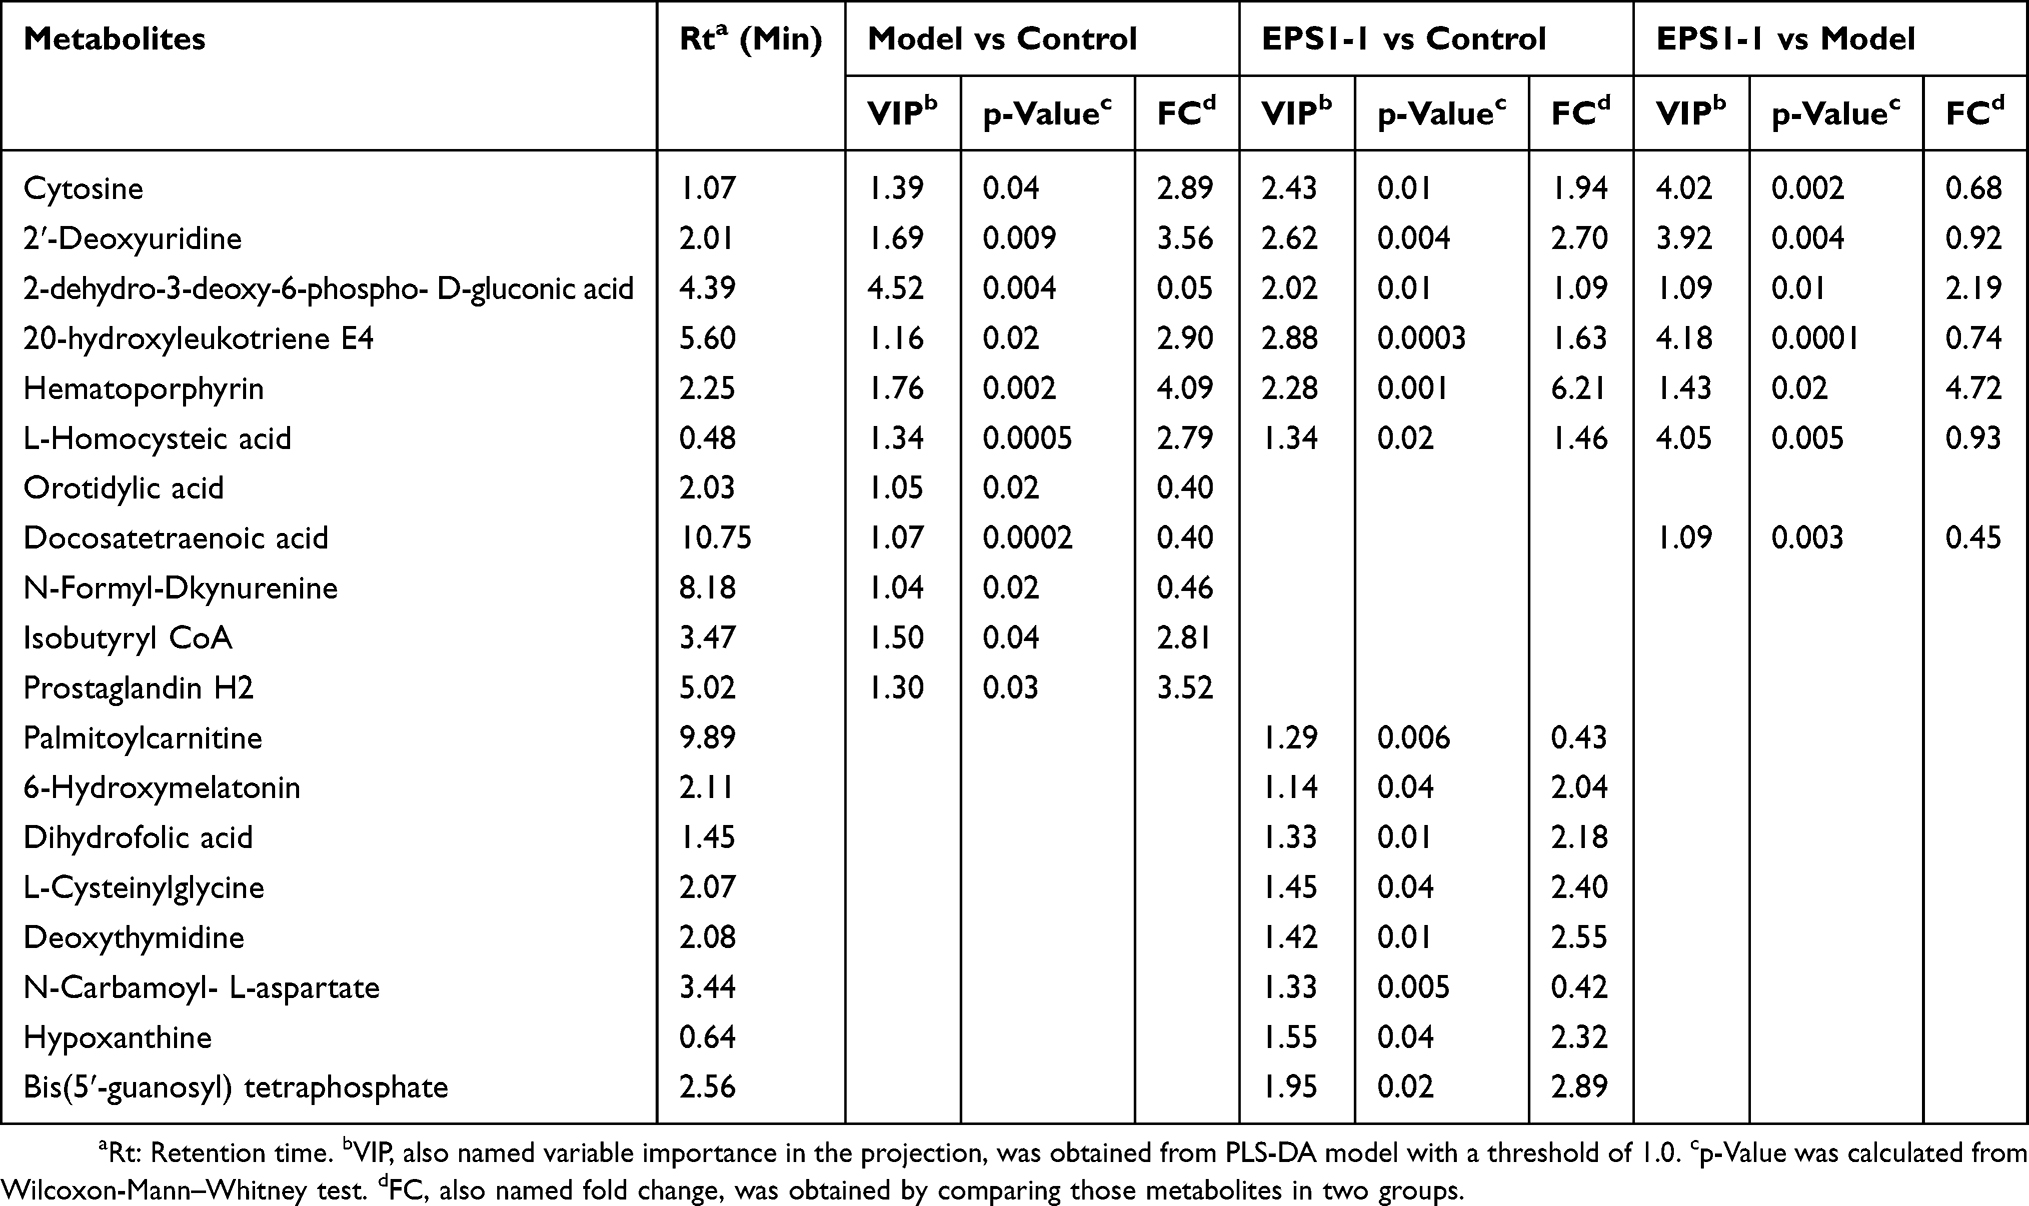 |
Table 1 List of Differential Metabolites in Colonic Tissues in Model Group Relative to Control Group, and EPS1-1 Group Relative to Control Group |
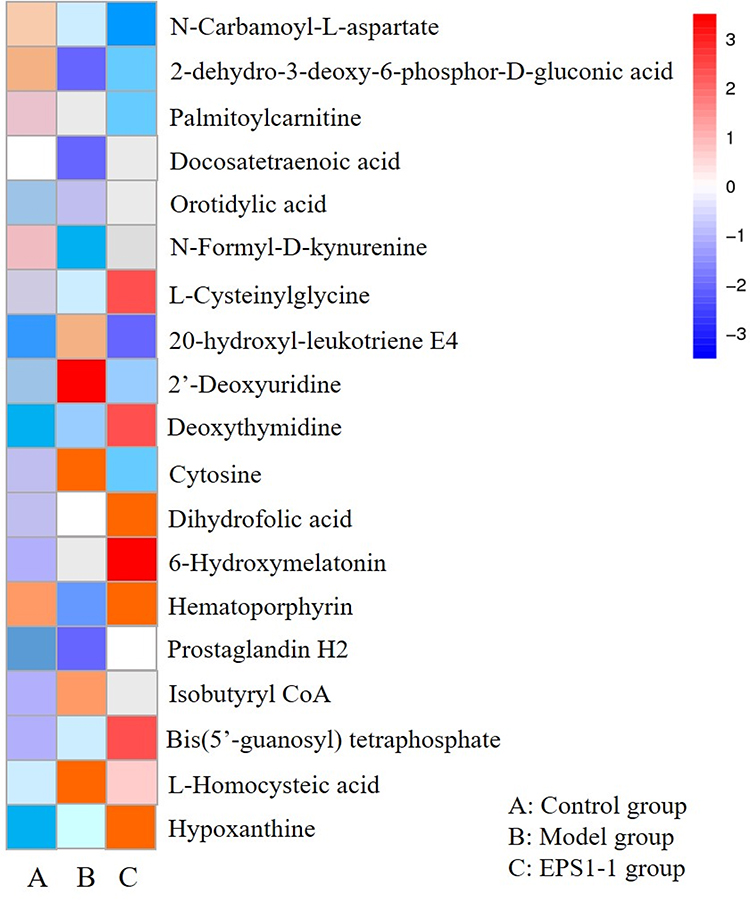 |
Figure 4 Heatmap indicates metabolic changes in the three groups (Control group, Model group, EPS1-1 group). Shades of red and blue represent fold increase and fold decrease of a metabolite, respectively. (A) Control group; (B) Model group: (C) EPS1-1 group. |
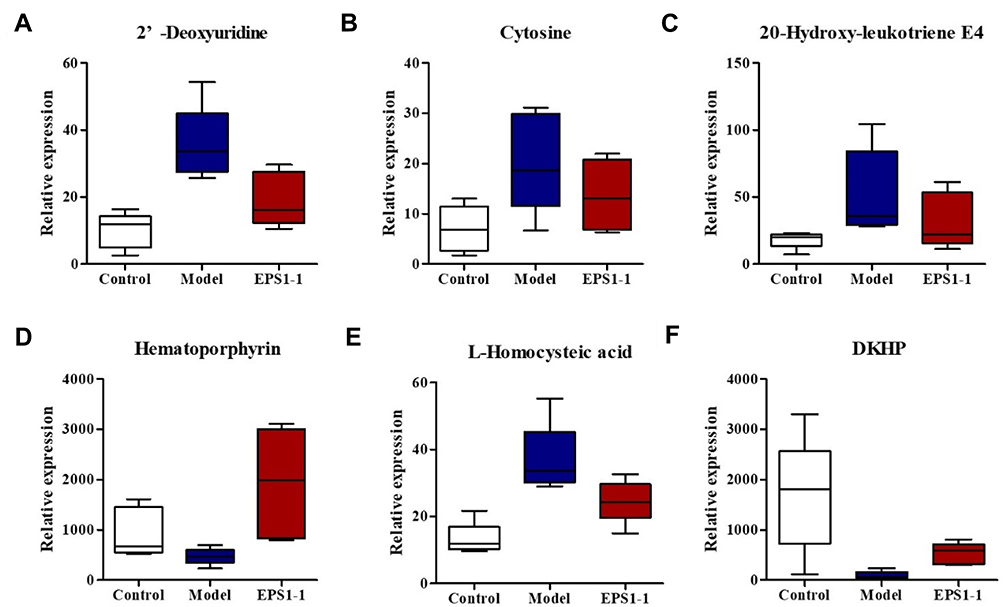 |
Figure 5 Box-and-whisker plots illustrating discrimination among the Control group, Model group, and EPS1-1 group. Horizontal line in the middle portion of the box, median; bottom and top boundaries of boxes, 25th and 75th percentiles, respectively; lower and upper whiskers, the minimum and maximum value, respectively. (A) 2ʹ-Deoxyuridine; (B) Cytosine; (C) 20-Hydroxy-leukotriene E4; (D) Hematoporphyrin; (E) L-Homocysteic acid; (F) 2-dehydro-3-phospho-D-gluconic acid (DKHP). |
Analyses of Perturbed Metabolic Pathways
Metabolomics analysis demonstrates not only individual metabolite variations, but also provides a holistic view of metabolic variations induced by biologically functional substances.22 In the present study, MetPA was used to identify the pathways involved in the anti-tumor effects of EPS1-1 on AOM/DSS-induced colorectal cancer. Enriched pathways related to the altered metabolites were identified through KEGG and literature review, and included biosynthesis of unsaturated fatty acids, pyrimidine metabolism, phenylalanine metabolism, tryptophan metabolism, inositol phosphate metabolism, arginine and proline metabolism, phenylpropanoid biosynthesis, fatty acid metabolism, and folate biosynthesis. Next, we listed six altered metabolic pathways with p-value <0.1, including biosynthesis of unsaturated fatty acids, pyrimidine metabolism, phenylalanine metabolism, fatty acid metabolism, folate biosynthesis, and inositol phosphate metabolism (Table 2 and Figure 6). Our results suggest that these six metabolic pathways represent the potential mechanisms underlying the anti-tumor effects of EPS1-1 on AOM/DSS-induced colorectal cancer in mice.
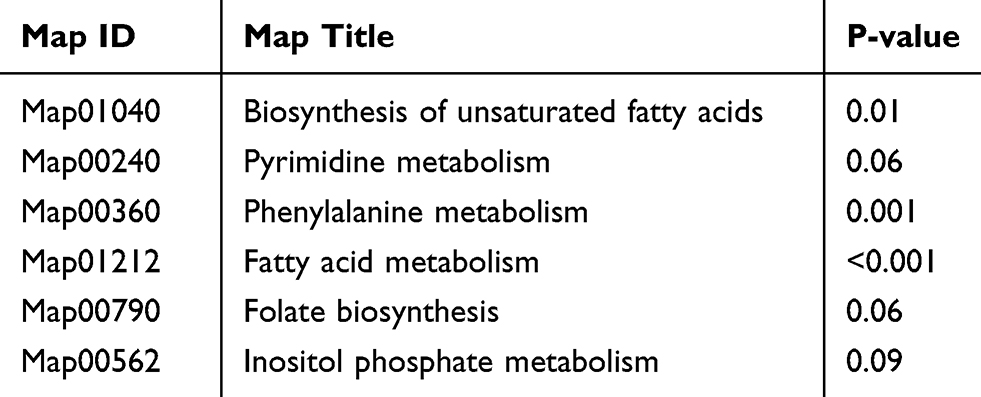 |
Table 2 List of Differential Metabolic Pathways in Colonic Tissues in Three Groups |
 |
Figure 6 Potential metabolic pathways related to AOM/DSS-induced colorectal cancer. (A) Model group vs Control group; (B) EPS1-1 group vs Control group. |
Discussion
Numerous studies in recent years have revealed that malignant tumors are closely related to altered metabolism, including pathways such as cell signaling, glycolysis, and respiration (known as the Warburg effect).23–25 Previous studies showed that EPS1-1 could significantly inhibit tumor growth in AOM/DSS-induced colorectal cancer in mice.9 In the past, urine and blood are the most frequently studied samples among a diverse range of types involved in human metabolomics studies.26 In this study, we aimed to provide a better understanding of the underlying mechanisms and to identify the differential metabolites via metabolomics profiling of mice colon tissues with AOM/DSS-induced colorectal cancer. Using LC/MS-based metabolomics, metabolome profiles were generated that showed significant variations in the Model group. The PLS-DA models derived from our metabolomic data were able to differentiate the Model group and EPS1-1 group from the Control group, highlighting the diagnostic potential of this noninvasive analytical approach. LC-MS/MS-based metabonomic study identified significant variations in the AOM group, which were characterized by 19 differentially expressed metabolites in mice colonic tissue. Differentially expressed metabolites are listed in Table 1. Heatmap (Figure 4) and box-and-whisker plots (Figure 5) show less significant fluctuations in metabolite levels in the EPS1-1 group, indicating that EPS1-1 is able to alleviate the AOM/DSS-induced metabolic perturbation in mice. The differential metabolites identified by MetPA mainly include docosatetraenoic acid, 2ʹ-deoxyuridine, cytosine, palmitoylcarnitine, 7,8-dihydrofolic acid (DHF), and 2-dehydro-3-deoxy-6-phospho-D-gluconic acid, which are involved in the biosynthesis of unsaturated fatty acids, pyrimidine metabolism, phenylalanine metabolism, fatty acid metabolism, folate biosynthesis, and inositol phosphate metabolism (Table 2 and Figure 6).
2ʹ-deoxyuridine, an important intermediate product of pyrimidine metabolism, is the downstream product of dUMP. It has been reported that iodine-labeled 2ʹ-deoxythymidine is highly expressed in small intestine and liver in tumor-bearing mice using a tracking technique.27 Compared with the Control group, 2ʹ-deoxyuridine was increased in the Model group, and serve as a tumor marker.
7,8-dihydrofolic acid (DHF) is a metabolite of the folic acid pathway. It was previously reported that DHF, like folate, could induce apoptosis in colon cancer cells by decreasing the protein expression of IGF-IR. This suggested that DHF is a potential anti-cancer substance.28 In our experiments, treatment with EPS1-1 significantly induced the expression of DHF, indicating that EPS1-1 could induce DHF production to suppress tumor growth, thus showing the anti-tumor activity.
In recent years, studies have indicated that tumor growth is closely related to tryptophan metabolism.29 Tryptophan affects tumor growth in vivo via two metabolic pathways: serotonin metabolism and kynurenine metabolism. Kynurenine metabolism is the main metabolic pathway associated with tryptophan and plays an important role in immune system function. N-formylkynurenine is the precursor substance of kynurenine.29 The level of N-formyl-kynurenine was significantly reduced in the Model group compared with Control group, suggesting that tryptophan metabolism was significantly disrupted and immune system functions were affected in AOM/DSS-induced colorectal cancer mice. In addition, serotonin metabolism is closely related to the nervous system and serves as an important neurotransmitter, 5-HT.30 6-hydroxymelatonin is a metabolite of the serotonin metabolic pathway. Compared with Control group, we found that the level of 6-hydroxymelatonin was significantly increased in the EPS1-1 group, indicating that EPS1-1 could alleviate AOM/DSS-induced colorectal cancer through the serotonin metabolic pathway.
Cyclooxygenases (COXs) are key enzymes mediating the conversion of free arachidonic acid into prostaglandins H2 (PGH2), which are the precursors of molecules such as prostaglandins, prostacyclin, and thromboxanes.31 COX-2 is upregulated in inflammatory and neoplastic states and catalyzes the synthesis of PGH2.32,33 High levels of the PGH2 were seen in the Model group compared with Control group. Proglumide, a gastrin and cholecystokinin receptor antagonist, has been shown to inhibit growth of transplantable murine colon carcinoma and to prolong survival in tumor-bearing mice.34 The level of proglumide was significantly decreased in AOM/DSS-induced mice compared with Control mice. Hematoporphyrin is an endogenous porphyrin produced by hydrolysis of hemoglobin. It has been reported that hematoporphyrin could inhibit the proliferation of tumor cells.35–37 The level of hematoporphyrin in EPS1-1 group was higher than the Model group, showing that EPS1-1 could induce the production of hematoporphyrin to suppress the growth of colorectal cancer cells.
A notable feature of the metabolic profile of the Model group was disrupted nucleic acid metabolism, as characterized by the increased levels of deoxyuridine and cytosine in colonic tissue.
In summary, we performed global tissue profiling and identified altered metabolites in mice with AOM/DSS-induced colorectal cancer. EPS1-1 was able to attenuate AOM/DSS-induced metabolic perturbations. It also appears that EPS1-1 induced significant metabolic alterations independent of the AOM/DSS-induced metabolic changes. Collectively, our results indicated that EPS1-1 can serve as a potential therapeutic agent for the treatment of colorectal cancer.
Strength and Limitation of This Study
The strength of this study lies in the use of two analytical techniques – LC and MS/MS. LC-MS/MS possesses high sensitivity and high unit mass accuracy to identify a number of metabolites. It can also conduct sophisticated library searches and/or sum formula calculations. A limitation of our study was the small sample size. For follow-up studies, we would expand the number of induced mice to identify additional cancer biomarkers.
Acknowledgment
This study is financially supported by the National Key Research and Development Program of China (No. 2018YFA0902000), Major Program of Shandong Province (the Key Technology) (No. 2015ZDJS04002), the Major State Basic Research Development Program of China (973 Program) (No. 2012CB822102), the High Technology Research and Development Program of China (863 Program) (No. 2012AA021501), and the Natural Science Foundation of Education Department of Anhui Province (No. KJ2018ZD025).
Disclosure
The authors report no conflicts of interest in this work.
References
1. Loke MF, Chua EG, Gan HM, et al. Metabolomics and 16S rRNA sequencing of human colorectal cancers and adjacent mucosa. PLoS One. 2018;13(12):e0208584. doi:10.1371/journal.pone.0208584
2. Bi W, Liu H, Shen J, et al. Chemopreventive effects of Ku-jin tea against AOM-induced precancerous colorectal lesions in rats and metabolomic analysis. Sci Rep. 2017;7(1):15893. doi:10.1038/s41598-017-16237-0
3. Ji X, Peng Q, Wang M. Anti-colon-cancer effects of polysaccharides: a mini-review of the mechanisms. Int J Biol Macromol. 2018;114:1127–1133. doi:10.1016/j.ijbiomac.2018.03.186
4. Usoltseva RV, Anastyuk SD, Ishina IA, et al. Structural characteristics and anticancer activity in vitro of fucoidan from brown alga Padina boryana. Carbohydr Polym. 2018;184:260–268. doi:10.1016/j.carbpol.2017.12.071
5. Mzoughi Z, Abdelhamid A, Rihouey C, et al. Optimized extraction of pectin-like polysaccharide from Suaeda fruticosa leaves: characterization, antioxidant, anti-inflammatory and analgesic activities. Carbohydr Polym. 2018;185:127–137. doi:10.1016/j.carbpol.2018.01.022
6. Wang J, Ge B, Li Z, et al. Structural analysis and immunoregulation activity comparison of five polysaccharides from Angelica sinensis. Carbohydr Polym. 2016;140:6–12. doi:10.1016/j.carbpol.2015.12.050
7. Chen G, Zhang P, Huang T, et al. Polysaccharides from Rhizopus nigricans mycelia induced apoptosis and G2/M arrest in BGC-823 cells. Carbohydr Polym. 2013;97(2):800–808. doi:10.1016/j.carbpol.2013.05.068
8. Yu W, Chen G, Zhang P, et al. Purification, partial characterization and antitumor effect of an exopolysaccharide from Rhizopus nigricans. Int J Biol Macromol. 2016;82::299–307. doi:10.1016/j.ijbiomac.2015.10.005
9. Song G, Lu Y, Yu Z, et al. The inhibitory effect of polysaccharide from Rhizopus nigricans on colitis-associated colorectal cancer. Biomed Pharmacother. 2019;112:108593. doi:10.1016/j.biopha.2019.01.054
10. Yu Z, Song G, Liu J, et al. Beneficial effects of extracellular polysaccharide from Rhizopus nigricans on the intestinal immunity of colorectal cancer mice. Int J Biol Macromol. 2018;115:718–726. doi:10.1016/j.ijbiomac.2018.04.128
11. Asante I, Pei H, Zhou E, et al. Exploratory metabolomic study to identify blood-based biomarkers as a potential screen for colorectal cancer. Mol Omics. 2019;15(1):21–29. doi:10.1039/C8MO00158H
12. Beger RD. A review of applications of metabolomics in cancer. Metabolites. 2013;3(3):552–574. doi:10.3390/metabo3030552
13. Zhang H, Qiao L, Li X, et al. Tissue metabolic profiling of lymph node metastasis of colorectal cancer assessed by 1H NMR. Oncol Rep. 2016;36(6):3436–3448. doi:10.3892/or.2016.5175
14. Budczies J, Denkert C. Tissue-based metabolomics to analyze the breast cancer metabolome. Cancer Res. 2016;207:157–175. doi:10.1007/978-3-319-42118-6_7
15. Cameron SJ, Lewis KE, Beckmann M, et al. The metabolomic detection of lung cancer biomarkers in sputum. Lung Cancer. 2016;94:88–95. doi:10.1016/j.lungcan.2016.02.006
16. Jobu K, Sun CH, Yoshioka S, et al. Metabolomics study on the biochemical profiles of odor elements in urine of human with bladder cancer. Biol Pharm Bull. 2012;35(4):639–642. doi:10.1248/bpb.35.639
17. Washio J, Takahashi N. Metabolomic studies of oral biofilm, oral cancer, and beyond. Int J Mol Sci. 2016;17(6). doi:10.3390/ijms17060870
18. Kelly RS, Vander Heiden MG, Giovannucci E, et al. Metabolomic biomarkers of prostate cancer: prediction, diagnosis, progression, prognosis, and recurrence. Cancer Epidemiol Biomarkers Prev. 2016;25(6):887–906. doi:10.1158/1055-9965.EPI-15-1223
19. Itoi T, Sugimoto M, Umeda J, et al. Serum metabolomic profiles for human pancreatic cancer discrimination. Int J Mol Sci. 2017;18(4). doi:10.3390/ijms18040767.
20. Liao W, Wei H, Wang X, et al. Metabonomic variations associated with AOM-induced precancerous colorectal lesions and resveratrol treatment. J Proteome Res. 2012;11(6):3436–3448. doi:10.1021/pr300284h
21. Yang P, Li Z, Zhang L, et al. Analysis of metabonomic profiling alterations in a mouse model of colitis-associated cancer and 2-deoxy-d-glucose treatment. RSC Adv. 2016;6(64):58862–58870. doi:10.1039/C6RA01718E
22. Lu S, Lu R, Song H, et al. Metabolomic study of natrin-induced apoptosis in SMMC-7721 hepatocellular carcinoma cells by ultra-performance liquid chromatography-quadrupole/time-of-flight mass spectrometry. Int J Biol Macromol. 2019;124:1264–1273. doi:10.1016/j.ijbiomac.2018.11.060
23. Qiu YP, Cai GX, Su MM, et al. Metabolite profiling of human colorectal cancer using GC-TOFMS and UPLC-QTOFMS. J Proteome Res. 2009;8:4844–4850. doi:10.1021/pr9004162
24. Qiu YP, Cai GX, Su MM, et al. Urinary metabonomic study on colorectal cancer. J Proteome Res. 2010;9:1627–1634. doi:10.1021/pr901081y
25. Warburg O. On the origin of cancer cells. Science. 2008;123(3191):309–314. doi:10.1126/science.123.3191.309
26. Dunn WB, Broadhurst D, Begley P, et al. Procedures for large-scale metabolic profiling of serum and plasma using gas chromatography and liquid chromatography coupled to mass spectrometry. Nat Protoc. 2011;6(7):1060–1083. doi:10.1038/nprot.2011.335
27. Dupertuis YM, Buchegger F, Pichard C. A balanced deoxyribonucleoside mixture increased the rate of DNA incorporation of 5-[125I]Iodo-2ʹ-deoxyuridine in glioblastoma cells. Cancer Biother Radio. 2003;18:7–16. doi:10.1089/108497803321269287
28. Attias Z, Werner H, Vaisman N. Folic acid and its metabolites modulate IGF-I receptor gene expression in colon cancer cells in a p53-dependent manner. Endocr Relat Cancer. 2006;13(2):571–581. doi:10.1677/erc.1.01156
29. Crotti S, D’Angelo E, Bedin C, et al. Tryptophan metabolism along the kynurenine and serotonin pathways reveals substantial differences in colon and rectal cancer. Metabolomics. 2017;13(12). doi:10.1007/s11306-017-1288-6.
30. Zhang H-L, Zhang A-H, Miao J-H, et al. Targeting regulation of tryptophan metabolism for colorectal cancer therapy: a systematic review. RSC Adv. 2019;9(6):3072–3080. doi:10.1039/C8RA08520J
31. Ahmadi B, Nikzamir A, Ghafari SM, et al. Lack of association between cyclooxygenase 2-765G/C gene polymorphism and breast cancer risk in Ahvaz, west-south Iran. Mol Biol Rep. 2014;41(2):997–1001. doi:10.1007/s11033-013-2944-1
32. Zha S, Yegnasubramanian V, Nelson WG, et al. Cyclooxygenases in cancer: progress and perspective. Cancer Lett. 2004;215(1):1–20. doi:10.1016/j.canlet.2004.06.014
33. Elander N, Ungerback J, Olsson H, et al. Genetic deletion of mPGES-1 accelerates intestinal tumorigenesis in APC (Min/+) mice. Biochem Biophys Res Commun. 2008;372(1):249–253. doi:10.1016/j.bbrc.2008.05.026
34. Beauchamp RD, Townsend CM, Singh P, et al. Proglumide, a gastrin receptor antagonist, inhibits growth of colon cancer and enhances survival in mice. Ann Surg. 1985;202(3):303–309. doi:10.1097/00000658-198509000-00005
35. Shang Z, Ren X, Zhu X, et al. Experimental study on in vitro tumor cell killing by focused bi-frequency ultrasound activated hematoporphurin derivatives. Australas Phys Eng Sci Med. 2006;29(3):267–271. doi:10.1007/BF03178576
36. Kim D, Lee MH, Koo MA, et al. Suppression of T24 human bladder cancer cells by ROS from locally delivered hematoporphyrin-containing polyurethane films. Photochem Photobiol Sci. 2018;17(6):763–772. doi:10.1039/C7PP00424A
37. Choi H, Lim W, Kim JE, et al. Cell death and intracellular distribution of hematoporphyrin in a KB cell line. Photomed Laser Surg. 2009;27(3):453–460. doi:10.1089/pho.2008.2334
 © 2019 The Author(s). This work is published and licensed by Dove Medical Press Limited. The
full terms of this license are available at https://www.dovepress.com/terms
and incorporate the Creative Commons Attribution
- Non Commercial (unported, 3.0) License.
By accessing the work you hereby accept the Terms. Non-commercial uses of the work are permitted
without any further permission from Dove Medical Press Limited, provided the work is properly
attributed. For permission for commercial use of this work, please see paragraphs 4.2 and 5 of our Terms.
© 2019 The Author(s). This work is published and licensed by Dove Medical Press Limited. The
full terms of this license are available at https://www.dovepress.com/terms
and incorporate the Creative Commons Attribution
- Non Commercial (unported, 3.0) License.
By accessing the work you hereby accept the Terms. Non-commercial uses of the work are permitted
without any further permission from Dove Medical Press Limited, provided the work is properly
attributed. For permission for commercial use of this work, please see paragraphs 4.2 and 5 of our Terms.