Back to Journals » Diabetes, Metabolic Syndrome and Obesity » Volume 13
Metabolic Score for Insulin Resistance Is Correlated to Adipokine Disorder and Inflammatory Activity in Female Knee Osteoarthritis Patients in a Chinese Population
Authors Ding L, Gao YH, Li YR, Huang YF, Wang XY, Qi X
Received 9 February 2020
Accepted for publication 26 May 2020
Published 19 June 2020 Volume 2020:13 Pages 2109—2118
DOI https://doi.org/10.2147/DMSO.S249025
Checked for plagiarism Yes
Review by Single anonymous peer review
Peer reviewer comments 2
Editor who approved publication: Dr Konstantinos Tziomalos
Lu Ding, Yu-Hang Gao, Ye-Ran Li, Yi-Fan Huang, Xin-Yu Wang, Xin Qi
Department of Orthopaedic Surgery, The First Hospital of Jilin University, Jilin University, Chang Chun, People’s Republic of China
Correspondence: Xin Qi
Department of Orthopaedic Surgery, The First Hospital of Jilin University, Jilin University, Xinmin St 71, Chang Chun, People’s Republic of China
Tel +8615843073202
Fax +86043181875600
Email [email protected]
Purpose: This study was to evaluate the metabolic score for insulin resistance (METS-IR) in female knee osteoarthritis (KOA) patients in a Chinese population. The associations between METS-IR and adipokines, erythrocyte sedimentation rate (ESR), and C-reactive protein (CRP) were investigated.
Patients and Methods: This study included 4686 women from the 2011 China Health and Retirement Longitudinal Study (CHARLS) and 108 women who underwent arthroplasty of KOA at a university hospital. The clinical data were collected, and adipokines were evaluated. METS-IR was calculated in the KOA patients and compared with the national baseline. Logistic regression analyses were applied to explore the associations of METS-IR with adipokines, ESR, and CRP.
Results: Receiver operating characteristic curve analysis of METS-IR and metabolic syndrome (MetS) in national baseline showed an area under the curve value of 0.851, with sensitivity of 0.777 and specificity of 0.772. The METS-IR of KOA was higher than the national baseline level (40.29 ± 6.98 vs 36.20 ± 8.50, P < 0.01), even after adjusting age. In addition, the METS-IR was higher in patients with KOA who had MetS than in those without metabolic syndrome (nMetS), even after adjusting body mass index (BMI). After adjusting for age and BMI, METS-IR was associated with CRP (OR 1.238, 95% confidence interval (CI) 1.088, 1.409, P < 0.01), ESR (OR 1.124, 95% CI 1.008, 1.254, P = 0.036), plasma leptin (OR 1.123, 95% CI 1.052, 1.199, P < 0.01), plasma resistin (OR 1.134, 95% CI 1.011, 1.271, P = 0.031), and plasma adiponectin (OR 0.865, 95% CI 0.771, 0.971, P = 0.014).
Conclusion: METS-IR in female KOA was higher than that of the national baseline. The METS-IR was related to adipokine disorder and inflammatory activity. These findings suggest that METS-IR can be used to evaluate the degree of involvement of MetS in KOA.
Keywords: knee osteoarthritis, metabolic syndrome, insulin resistance, metabolic score for insulin resistance
Corrigendum for this paper has been published.
Introduction
Knee osteoarthritis (KOA) is a common bone and joint disease, which can cause severe joint dysfunction and disrupt quality of life. KOA has traditionally been considered to be related to the aging of articular cartilage and mechanical wear.1,2 However, with more in-depth research, several risk factors for KOA have been identified, including age, sex, body weight, articular injuries, metabolic disorders, genetic predispositions, and inflammation.3,4 In recent years, the impact of obesity on KOA has become a research hotspot, and obesity-induced arthritis has been suggested to be mainly caused by long-term excessive mechanical load and wear. Other studies demonstrated that metabolic disorders and chronic low-grade systemic inflammation could cause joint tissue damage, which might initiate and accelerate the process of KOA development.5 Moreover, metabolic syndrome (MetS)-associated osteoarthritis (OA) has been proposed as a characteristic phenotype of OA.6
MetS represents a group of clinical manifestations consisting of abdominal obesity along with abnormal blood glucose and lipid metabolism.7 These characteristics indicate a severe energy metabolism disorder, which is related to the development of many diseases8 such as cardiovascular disease, type 2 diabetes, fatty liver, and obesity-related cancers.9 There is also accumulating evidence for an important role of MetS in the onset and progression of KOA, leading to the concept of systemic regulation of the joint tissues.10 Abnormal expression of various adipokines in patients with MetS, such as increased expression levels of leptin, visfatin, and resistin along with decreased expression levels of adiponectin,11 may have pro-inflammatory and pro-degradation effects on the joint tissue.12 Therefore, these adipokines may serve as a bridge linking the mechanisms of MetS and KOA. With the exception of adiponectin, the circulating levels of other adipokines such as leptin and resistin were found to be increased in patients with OA, even after adjusting the model for body mass index (BMI).12 Clinical studies have also shown that the expression level of visfatin in the serum and synovial fluid (SF) is increased in OA.13 We previously reported that patients with OA and MetS (MetS-OA) had higher leptin expression and lower adiponectin expression levels than those without MetS (nMetS-OA).14
In the past few years, MetS has been increasingly regarded as representing a low inflammatory state, accompanied by an increase in systemic inflammation activity.15 A variety of immune cells, including macrophages, T cells, B cells, and neutrophils, have been associated with MetS-related inflammation. The adipose tissue can secrete inflammatory mediators, including cytokines [such as interleukin (IL)-1, IL-6, IL-8, and tumor necrosis factor (TNF)-α] and adipokines (such as leptin, adiponectin, resistin, and visfatin). In addition, the adipose tissue can also promote the shift of macrophages from alternatively activated macrophages (M2) in lean individuals to classically activated macrophages (M1) in the presence of obesity. This conversion results in decreased expression of anti-inflammatory factors secreted by M2, such as IL-10, insulin-like growth factor (IGF-1), and transforming growth factor (TGF)-β, along with increased expression of pro-inflammatory factors secreted by M1, such as IL-1, IL-6, and TNF-α. Collectively, these factors will maintain the body in a long-term low inflammation state. In turn, abnormalities of these immune cells, adipokines, and inflammatory factors can cause synovitis, cartilage metabolism disorders, subchondral bone changes, and joint pain, which might initiate or accelerate the process of KOA development.16 Increased levels of C-reactive protein (CRP) and the erythrocyte sedimentation rate (ESR) in plasma are considered markers of low-grade systemic inflammation and have been related to both MetS and progressive KOA.2,17 Previous studies have shown that the level of CRP was higher in patients with OA than in those without, and was related to the degree of pain and radiographic progression of OA.18–20 Šalamon et al demonstrated that the prevalence of MetS in patients with OA was 1.6-times higher than that in patients with rheumatoid arthritis, and patients with MetS-OA had higher expression levels of CRP and ESR than those of the nMetS-OA group.21
Bello-Chavolla and colleagues proposed the metabolic score for insulin resistance (METS-IR) in 2018,22,23 which was established based on certain metabolic indicators in MetS. METS-IR is highly correlated with body fat content,22 and can be used to quantify the degree of metabolic abnormalities in a subject while evaluating insulin resistance (IR). However, to our knowledge, the correlations between METS-IR and adipokines, CRP, and ESR have not yet been explored, especially in KOA patients. Therefore, the current study was designed to investigate these associations. If the disorder of adipokine and activity of inflammation could be evaluated by METS-IR, future studies concerning metabolic-associated KOA would be facilitated.
Patients and Methods
Subjects
National baseline survey data were obtained from the 2011 China Health and Retirement Longitudinal Study (CHARLS), which is a biennial and nationally representative longitudinal survey conducted by the China Center for Economic Research at Peking University.24 We included data of 4686 women from the CHARLS 2011 national survey for this analysis. For collection of clinical data and specimens of KOA, we selected 108 female patients who underwent arthroplasty at the Department of Orthopedic Surgery and Sports Medicine of the First Hospital of Jilin University from May 2015 to January 2018. The inclusion criteria were as follows: (i) diagnosis of KOA complies with the OA diagnostic criteria of the American College of Rheumatology; (ii) not used any drugs or received drug tests in the past month; (iii) denied any knee trauma and history of surgery; (iv) female patients. The exclusion criteria were as follows: (i) did not voluntarily sign the informed consent form; (ii) secondary OA; (iii) received intra-articular injection treatment in the past 6 months; (iv) previous history of knee trauma or knee arthrosis infection; and (v) patients with autoimmune disease or disease affecting other parts of the body, such as asthma, systemic lupus erythematosus, rheumatoid arthritis, and tumors. The diagnosis of MetS was based on the National Cholesterol Education Program Adult Treatment Panel III (NCEP-ATP III) standard for Asians.25 OA patients with MetS and OA patients without MetS were classified in the MetS-OA group and nMetS-OA group, respectively.
Clinical Measurements
Data on the patients’ medical history and previous medications were collected. The same doctor performed anthropometric measurements on all patients, including height, weight, waist circumference (WC), and blood pressure (BP), and calculated the body mass index [BMI; weight (kg)/height (m2)]. Laboratory test results analyzed included ESR, CRP, fasting blood glucose (FBG), total cholesterol, triglycerides (TG), high-density lipoprotein cholesterol (HDL-C), and low-density lipoprotein cholesterol (LDL-C). The levels of CRP and ESR were determined by scatter turbidimetry using a Siemens special protein analyzer (Siemens Healthcare Diagnostics Products, GmbH, Munich, Germany). FBG and serum lipids were analyzed using a Synchron LX120 autoanalyzer (Beckman-Coulter, Brea, CA, USA). METS-IR was calculated according to the method proposed by Bello-Chavolla and colleagues22,23 using the following formula: METS-IR = (ln [(2 × FPG) + TG] × BMI)/(ln[HDLc]).
Adipokine Assays
Blood samples were taken from patients after a fast of at least 8 h before surgery. During the operation, the SF was carefully extracted with a syringe before cutting the joint capsule to avoid mixing blood and fat. The blood and SF samples were transferred to the laboratory for processing within 10 min. The samples were centrifuged at 4°C, 10,000 rpm/min for 5 min. The specimens were aliquoted, coded, and stored at –80°C until testing. Commercial enzyme-linked immunosorbent assay (ELISA) kits were used to determine the adipokine concentration according to the manufacturer instructions (leptin and adiponectin ELISA kits from R&D Systems, Abingdon, UK; resistin ELISA kit from CUSABIO, Wuhan, China).
Statistical Analysis
Receiver operating characteristic (ROC) curve analysis was used to analyze the diagnostic efficacy of METS-IR for MetS. The independent samples t-test or Mann–Whitney U-test was used to compare the clinical data, METS-IR, and laboratory parameters of the MetS-OA and nMetS-OA groups. The chi-square test was used to evaluate differences in categorical variables between groups. One-sample t-tests were used to compare the sample means and population means. The distribution of continuous variables was assessed with the Kolmogorov–Smirnov test. Binary logistic regression was used to assess the correlations while adjusting for confounders such as age and BMI. P < 0.05 was considered to indicate a statistically significant difference. All statistical analyses were performed using SPSS 25 (IBM Corp., Armonk, NY, USA).
Results
METS-IR and MetS in Chinese Women
The average age of the 4686 Chinese women from the CHARLS 2011 national survey was 59.43 years (SD = 9.82, range: 40–97 years), 2224 (47.46%) of whom were classified in the MetS group and 2462 (25.26%) classified in the nMetS group. The anthropometric and laboratory data for all included women are summarized in Table 1. Significant differences in the majority of indicators were found between the MetS and nMetS groups, with the exception of height (P = 0.994). The age, weight, BMI, WC, BP, FBG, TG, and METS-IR levels of the MetS group were higher than those of the nMetS group, whereas the HDL-C level was lower in the MetS group than that of the nMetS group. ROC curve analysis to test the diagnostic efficacy of METS-IR on MetS in Chinese women showed a cut-off value of 35.38 (area under the curve = 0.851), with sensitivity of 0.777 and specificity of 0.772 (Figure 1).
 |
Table 1 Clinical and Laboratory Characteristics of Participants in the CHARLS 2011 National Survey |
 |
Figure 1 ROC curve analysis of METS-IR and MetS for Chinese women in the CHARLS 2011 national survey. |
METS-IR in Female KOA
This study included 108 female patients who underwent arthroplasty for KOA at the Department of Orthopedic Surgery and Sports Medicine of the First Hospital of Jilin University from May 2015 to January 2018. The average age of the patients was 64.65 years (SD = 8.319, range: 42–83 years), 57 (52.78%) of whom were classified in the MetS group. There were no significant differences in age (P = 0.426), height (P = 0.206), and SF resistin level (P = 0.318) between the MetS-OA and nMetS-OA groups, whereas the METS-IR of the MetS-OA group was higher than that of the nMetS-OA group (P < 0.001; Table 2, Figure 2A). To exclude the influence of BMI, we divided the MetS-OA and nMetS-OA groups into three subgroups according to BMI: <25 kg/m2, 25–30 kg/m2, and >30 kg/m2. The differences in METS-IR between the MetS-OA and nMetS-OA groups were still statistically significant for comparisons within each BMI level (Table 3, Figure 2B–D). The one-sample t-test showed that patients with KOA had significantly higher METS-IR (40.29 ± 6.98 vs 36.20 ± 8.50, P < 0.001). Comparing patients with MetS and nMetS separately, the METS-IR was higher in patients with KOA in each group; this difference remained statistically significant after adjusting for age (Table 4).
 |
Table 2 Clinical and Laboratory Characteristics of Patients with KOA in the Present Study |
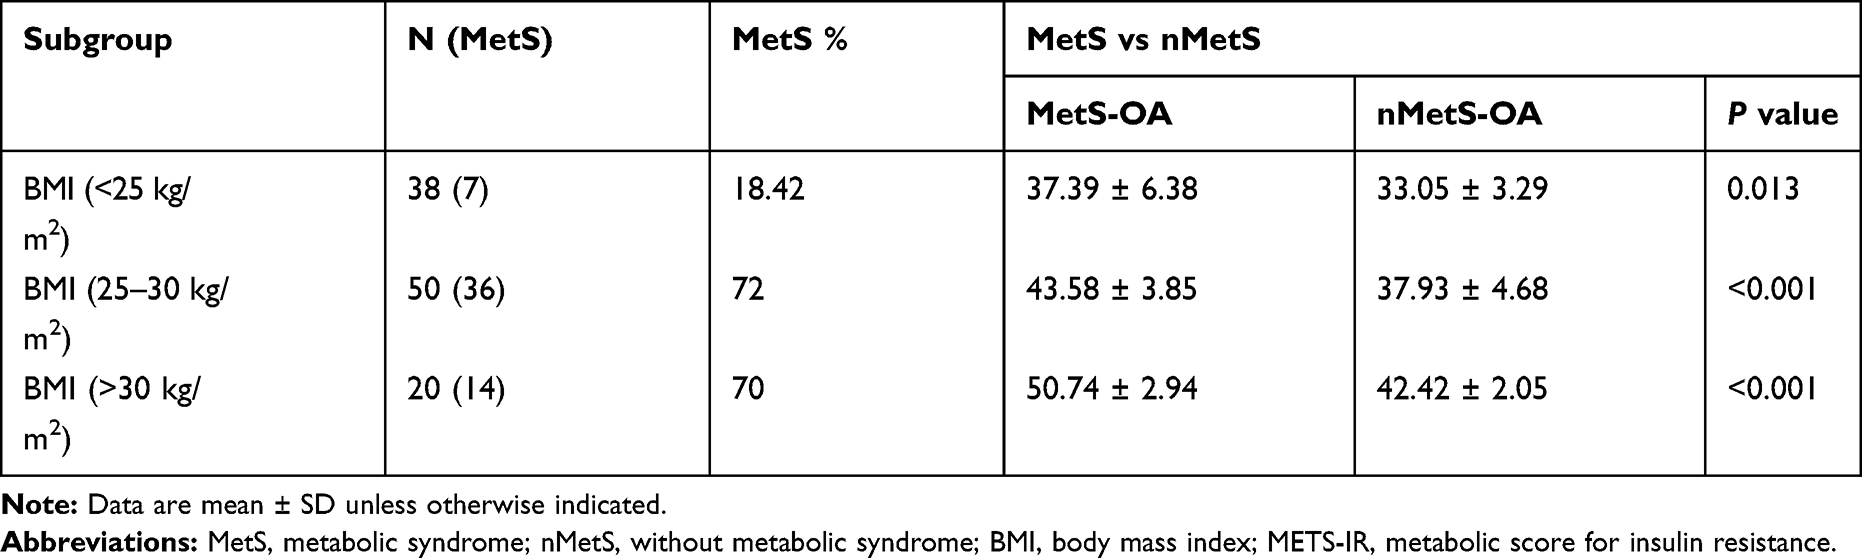 |
Table 3 Comparative Analysis of METS-IR in the MetS-OA and nMetS-OA Groups After Adjusting for BMI |
 |
Table 4 Comparison of METS-IR in Patients with KOA with That of Participants in the CHARLS 2011 National Survey |
 |
Figure 2 METS-IR comparative analysis of MetS-OA and nMetS-OA groups. (A) METS-IR comparison between MetS-OA and nMetS-OA groups without adjusting for BMI. (B) METS-IR comparison between MetS-OA and nMetS-OA groups with BMI <25 kg/m2. (C) METS-IR comparison between MetS-OA and nMetS-OA groups with BMI 25–30 kg/m2. (D) METS-IR comparison between MetS-OA and nMetS-OA groups with BMI > 30 kg/m2. |
Logistic Regression Analysis of Adipokines and Inflammation Indicators with Confounders
We used the median values as the cut-off points to convert the data of CRP, ESR, and adipokines into binary variables, and then performed logistic regression analysis with METS-IR, BMI, and age. The results showed that CRP, ESR, leptin, resistin, and adiponectin levels in the plasma and leptin levels in the SF were significantly associated with METS-IR, but were not associated with BMI and age. Adiponectin and resistin levels in the SF were not associated with METS-IR, BMI, or age (Table 5).
 |
Table 5 Multiple Logistic Regression Analysis of CRP, ESR and Adipokines |
Discussion
OA is a common disabling disease, which is mainly concentrated in middle-aged and elderly patients, and has a higher incidence in women than in men.26 As a group of clinical manifestations characterized by metabolic abnormalities, MetS also has the highest incidence in middle-aged and elderly women.27 Recently, accumulating evidence has indicated that MetS-OA, as a new OA phenotype, plays an important role in the initiation and progression of OA.5,6 Previous studies suggested IR as the main pathological basis of MetS.28 However, the evaluation of IR in previous studies was mainly based on fasting insulin, which includes the homeostatic model assessment for IR (HOMA-IR) and the quantitative insulin sensitivity check index (QUICKI). In 2018, Bello-Chavolla et al22 generated a non-insulin-based fasting IR index (METS-IR), which showed higher accuracy compared to other insulin-based methods. Therefore, we used the METS-IR to evaluate the activity of MetS in the present study.
We analyzed data from 4686 Chinese women included in the CHARLS 2011 national survey as the baseline for the Chinese female population. Among Chinese women, METS-IR showed better diagnostic significance for MetS, demonstrating the validity of this index to quantify the activity of MetS for Chinese women with high accuracy. Previously used indicators to evaluate the activity of MetS were mostly based on the cumulative number of diagnostic criteria, which can divide patients into MetS or nMetS groups according to a small change in a single indicator,29 resulting in potentially inaccurate classification that may not reflect the true metabolic level of subjects. By contrast, METS-IR is a continuous scoring system that can accurately reflect the IR level of a patient and to some extent the activity of MetS.
In this study, all indicators in the MetS-OA group differed from those of the nMetS-OA except for age and height. In MetS-OA patients, METS-IR, leptin, and resistin were significantly higher than those of the nMetS-OA patients, and the adiponectin level was significantly lower than that of the nMetS-OA group. In addition, the METS-IR of the MetS-OA group was consistently higher than that of the nMetS-OA group within each BMI subgroup. These results proved that MetS-OA patients have higher MetS activity and an adipokine disorder. Moreover, the METS-IR was higher in KOA patients, regardless of MetS status, than that of the national baseline, and this difference persisted after adjusting the model for the influence of age. This finding indicated that the activity of metabolic disorders was higher in KOA patients. Previous studies have shown that a variety of adipokines play a role in promoting inflammation and cartilage degradation in the pathological process of KOA.30,31 IR was reported to directly participate in the pathological process of KOA by increasing the expression level of TNF-α in synovial cells, and the consequent synovitis can trigger or worsen KOA.32 In addition, IR can cause an imbalance in glucose metabolism, leading to chronic hyperglycemia, which in turn triggers oxidative stress, inflammatory reactions, and cell damage.33 We consider that the impact of MetS on KOA is not only based on a mechanical load but also related to changes in metabolism of the joint tissues through adipokines and IR to accelerate the process of KOA. In addition, pain and dysfunction of the knee joint will inevitably lead to reduction in an individual’s physical activity, resulting in fat accumulation and aggravated energy metabolism disorders, which further exacerbate IR and MetS.34
A significant finding of the current study was that the METS-IR was positively related to some adipokines and inflammatory markers. The expression levels of CRP, ESR, leptin, adiponectin, and resistin in the plasma and the leptin level in the SF were all significantly associated with METS-IR. MetS leads to a state of chronic low-grade systemic inflammation,5 and certain markers of inflammation are elevated in this condition. Previous studies have shown that MetS patients have higher CRP and ESR levels than nMetS patients,35,36 and MetS-OA patients have higher expression levels of CRP and ESR than nMetS-OA patients.21 These previous studies are in line with the present findings. Moreover, many studies have demonstrated that adipokines participate in the pathological process of KOA by regulating inflammation, cartilage metabolism, and chondrocyte death.37–39
Leptin and resistin can induce the expression of IL-1β in chondrocytes. IL-1β is a pro-inflammatory factor that can induce the expression of enzymes that degrade the extracellular matrix, thereby reducing the main components of cartilage synthesis (collagen type II alpha-1 and aggrecan), causing cartilage destruction.40,41 Leptin can also directly induce the production of cartilage metalloproteinase-9 and -13, thereby affecting cartilage metabolism.41 Previous studies have shown that the intra-articular fat is another important source of adipokines.5 The expression level of leptin is significantly increased in cartilage with advanced OA compared to that with minimal OA, and the expression of leptin inside the joint was closely related to the severity of OA.41 In addition, the concentration of plasma adiponectin in obese patients was reported to be generally low, which increased after exercise or weight loss.42 The concentration of adiponectin in plasma has also been negatively correlated with the severity of OA.43 However, the role of adiponectin in KOA has thus far been controversial.44
Anyway, evaluating severity of adipokine disorder and inflammation in KOA patients needs many additional workups, a simple and reliable method should be developed. METS-IR is an index that can reflect the level of metabolic disorder of the body, which can quantify the activity of MetS, as confirmed in the CHARLS 2011 national survey. Since METS-IR can predict the levels of certain adipokines, ESR, and CRP in vivo, it can be a valuable tool for clinicians to conveniently evaluate the role of metabolic processes in KOA development, and can facilitate further research on metabolic-associated KOA.
However, there are still some shortcomings in this study. First, the relatively small size of the KOA group was a limitation. However, patients in both the KOA group and the cohort were selected from the northern region of China, suggesting that these findings could be applied to a certain Chinese population. Second, because the majority of the included KOA patients had severe and end-stage disease as they were undergoing joint replacement, the correlation analysis for the severity of KOA and metabolic indicators could not be performed; therefore, further research on these associations is needed including patients with early-stage OA. Third, this was a cross-sectional study, which can only reflect the metabolic state of the patients at a particular point in time, and cannot reflect the metabolic changes occurring over a longer period. Therefore, further longitudinal research is needed in the future to validate these results.
Conclusion
In summary, we found that METS-IR has better diagnostic value on the activity of MetS in Chinese women than other conventional markers. The METS-IR of female KOA patients was higher than that based on national baseline data. We also demonstrated significant associations of METS-IR with adipokines and inflammatory indicators. These findings suggest that the activity of MetS and levels of adipokines may be non-invasively predicted using the METS-IR in Chinese women with KOA. This tool can further facilitate research in the field of metabolic-associated KOA.
Ethics Approval and Consent to Participate
This study was reviewed and approved by the Medical Ethics Committee of the First Hospital of Jilin University (No. 2015-284). Informed consent was obtained from all participants.
Acknowledgments
We extend sincere gratitude to the staff of the Department of Orthopaedic Surgery for their assistance during this study.
Disclosure
The authors declare that they have no conflicts of interest.
References
1. Han CD, Yang IH, Lee WS, Park YJ, Park KK. Correlation between metabolic syndrome and knee osteoarthritis: data from the Korean National Health and Nutrition Examination Survey (KNHANES). BMC Public Health. 2013;13:603. doi:10.1186/1471-2458-13-603
2. Engström G, Gerhardsson de Verdier M, Rollof J, Nilsson PM, Lohmander LS. C-reactive protein, metabolic syndrome and incidence of severe hip and knee osteoarthritis. A population-based cohort study. Osteoarthritis Cartilage. 2009;17(2):168–173. doi:10.1016/j.joca.2008.07.003
3. Das SK, Farooqi A. Osteoarthritis. Best Pract Res Clin Rheumatol. 2008;22(4):657–675. doi:10.1016/j.berh.2008.07.002
4. Scanzello CR. Chemokines and inflammation in osteoarthritis: insights from patients and animal models. J Orthop Res. 2017;35(4):735–739. doi:10.1002/jor.23471
5. Berenbaum F, Griffin TM, Liu-Bryan R. Review: metabolic regulation of inflammation in osteoarthritis. Arthritis Rheumatol. 2017;69(1):9–21. doi:10.1002/art.39842
6. Courties A, Sellam J, Berenbaum F. Metabolic syndrome-associated osteoarthritis. Curr Opin Rheumatol. 2017;29(2):214–222. doi:10.1097/BOR.0000000000000373
7. Samson SL, Garber AJ. Metabolic syndrome. Endocrinol Metab Clin North Am. 2014;43(1):1–23. doi:10.1016/j.ecl.2013.09.009
8. Eckel RH, Grundy SM, Zimmet PZ. The metabolic syndrome. Lancet. 2005;365(9468):1415–1428. doi:10.1016/S0140-6736(05)66378-7
9. Catrysse L, van Loo G. Inflammation and the metabolic syndrome: the tissue-specific functions of NF-κB. Trends Cell Biol. 2017;27(6):417–429. doi:10.1016/j.tcb.2017.01.006
10. Puenpatom RA, Victor TW. Increased prevalence of metabolic syndrome in individuals with osteoarthritis: an analysis of NHANES III data. Postgrad Med. 2009;121(6):9–20. doi:10.3810/pgm.2009.11.2073
11. Chedraui P, Pérez-López FR, Escobar GS, et al. Circulating leptin, resistin, adiponectin, visfatin, adipsin and ghrelin levels and insulin resistance in postmenopausal women with and without the metabolic syndrome. Maturitas. 2014;79(1):86–90. doi:10.1016/j.maturitas.2014.06.008
12. Courties A, Gualillo O, Berenbaum F, Sellam J. Metabolic stress-induced joint inflammation and osteoarthritis. Osteoarthritis Cartilage. 2015;23(11):1955–1965. doi:10.1016/j.joca.2015.05.016
13. Duan Y, Hao D, Li M, et al. Increased synovial fluid visfatin is positively linked to cartilage degradation biomarkers in osteoarthritis. Rheumatol Int. 2012;32(4):985–990. doi:10.1007/s00296-010-1731-8
14. Dong N, Gao YH, Liu B, et al. Differential expression of adipokines in knee osteoarthritis patients with and without metabolic syndrome. Int Orthop. 2018;42(6):1283–1289. doi:10.1007/s00264-018-3761-x
15. Zhuo Q, Yang W, Chen J, Wang Y. Metabolic syndrome meets osteoarthritis. Nat Rev Rheumatol. 2012;8(12):729–737. doi:10.1038/nrrheum.2012.135
16. Urban H, Little CB. The role of fat and inflammation in the pathogenesis and management of osteoarthritis. Rheumatology (Oxford). 2018;57(suppl_4):iv10–10iv21. doi:10.1093/rheumatology/kex399
17. Alende-Castro V, Alonso-Sampedro M, Vazquez-Temprano N, et al. Factors influencing erythrocyte sedimentation rate in adults: new evidence for an old test. Medicine (Baltimore). 2019;98(34):e16816. doi:10.1097/MD.0000000000016816
18. Stannus OP, Jones G, Blizzard L, Cicuttini FM, Ding C. Associations between serum levels of inflammatory markers and change in knee pain over 5 years in older adults: a prospective cohort study. Ann Rheum Dis. 2013;72(4):535–540. doi:10.1136/annrheumdis-2011-201047
19. Pearle AD, Scanzello CR, George S, et al. Elevated high-sensitivity C-reactive protein levels are associated with local inflammatory findings in patients with osteoarthritis. Osteoarthritis Cartilage. 2007;15(5):516–523. doi:10.1016/j.joca.2006.10.010
20. Stürmer T, Brenner H, Koenig W, Günther KP. Severity and extent of osteoarthritis and low grade systemic inflammation as assessed by high sensitivity C reactive protein. Ann Rheum Dis. 2004;63(2):200–205. doi:10.1136/ard.2003.007674
21. Šalamon L, Morović-Vergles J, Marasović-Krstulović D, et al. Differences in the prevalence and characteristics of metabolic syndrome in rheumatoid arthritis and osteoarthritis: a multicentric study. Rheumatol Int. 2015;35(12):2047–2057. doi:10.1007/s00296-015-3307-0
22. Bello-Chavolla OY, Almeda-Valdes P, Gomez-Velasco D, et al. METS-IR, a novel score to evaluate insulin sensitivity, is predictive of visceral adiposity and incident type 2 diabetes. Eur J Endocrinol. 2018;178(5):533–544. doi:10.1530/EJE-17-0883
23. Liu XZ, Fan J, Pan SJ. METS-IR, a novel simple insulin resistance indexes, is associated with hypertension in normal-weight Chinese adults. J Clin Hypertens. 2019;21(8):1075–1081. doi:10.1111/jch.13591
24. Li C, Liu T, Sun W, Wu L, Zou ZY. Prevalence and risk factors of arthritis in a middle-aged and older Chinese population: the China health and retirement longitudinal study. Rheumatology (Oxford). 2015;54(4):697–706. doi:10.1093/rheumatology/keu391
25. Grundy SM, Cleeman JI, Daniels SR, et al. Diagnosis and management of the metabolic syndrome: an American Heart Association/National Heart, Lung, and Blood Institute Scientific Statement. Circulation. 2005;112(17):2735–2752. doi:10.1161/CIRCULATIONAHA.105.169404
26. Hunter DJ, Bierma-Zeinstra S. Osteoarthritis. Lancet. 2019;393(10182):1745–1759. doi:10.1016/S0140-6736(19)30417-9
27. Gluvic Z, Zaric B, Resanovic I, et al. Link between metabolic syndrome and insulin resistance. Curr Vasc Pharmacol. 2014;12(1):1.
28. Yin DT, He H, Yu K, et al. The association between thyroid cancer and insulin resistance, metabolic syndrome and its components: a systematic review and meta-analysis. Int J Surg. 2018;57:66–75. doi:10.1016/j.ijsu.2018.07.013
29. Soldatovic I, Vukovic R, Culafic D, Gajic M, Dimitrijevic-Sreckovic V. siMS score: simple method for quantifying metabolic syndrome. PLoS One. 2016;11(1):e0146143. doi:10.1371/journal.pone.0146143
30. Koskinen A, Vuolteenaho K, Nieminen R, Moilanen T, Moilanen E. Leptin enhances MMP-1, MMP-3 and MMP-13 production in human osteoarthritic cartilage and correlates with MMP-1 and MMP-3 in synovial fluid from OA patients. Clin Exp Rheumatol. 2011;29(1):57–64.
31. Kroon F, Veenbrink AI, de Mutsert R, et al. The role of leptin and adiponectin as mediators in the relationship between adiposity and hand and knee osteoarthritis. Osteoarthritis Cartilage. 2019;27(12):1761–1767. doi:10.1016/j.joca.2019.08.003
32. Griffin TM, Huffman KM. Editorial: insulin resistance: releasing the brakes on synovial inflammation and osteoarthritis. Arthritis Rheumatol. 2016;68(6):1330–1333. doi:10.1002/art.39586
33. Ormazabal V, Nair S, Elfeky O, Aguayo C, Salomon C, Zuñiga FA. Association between insulin resistance and the development of cardiovascular disease. Cardiovasc Diabetol. 2018;17(1):122. doi:10.1186/s12933-018-0762-4
34. Jeong J, Yu J. Prevalence and influencing factors of metabolic syndrome among persons with physical disabilities. Asian Nurs Res. 2018;12(1):50–55. doi:10.1016/j.anr.2018.02.001
35. Azevedo S, Santos-Faria D, Leite Silva J, et al. Obesity, metabolic syndrome and other comorbidities in rheumatoid arthritis and psoriatic arthritis: influence on disease activity and quality of life. Acta Reumatol Port. 2019;44(4):322–324.
36. Bahia L, Aguiar LG, Villela N, et al. Relationship between adipokines, inflammation, and vascular reactivity in lean controls and obese subjects with metabolic syndrome. Clinics (Sao Paulo). 2006;61(5):433–440. doi:10.1590/S1807-59322006000500010
37. Su YP, Chen CN, Huang KC, et al. Leptin induces MMP1/13 and ADAMTS 4 expressions through bone morphogenetic protein-2 autocrine effect in human chondrocytes. J Cell Biochem. 2018;119(4):3716–3724. doi:10.1002/jcb.26593
38. Huang ZM, Du SH, Huang LG, Li JH, Xiao L, Tong P. Leptin promotes apoptosis and inhibits autophagy of chondrocytes through upregulating lysyl oxidase-like 3 during osteoarthritis pathogenesis. Osteoarthritis Cartilage. 2016;24(7):1246–1253. doi:10.1016/j.joca.2016.02.009
39. Francin PJ, Guillaume C, Humbert AC, et al. Association between the chondrocyte phenotype and the expression of adipokines and their receptors: evidence for a role of leptin but not adiponectin in the expression of cartilage-specific markers. J Cell Physiol. 2011;226(11):2790–2797. doi:10.1002/jcp.22627
40. Zhang Z, Zhang Z, Kang Y, et al. Resistin stimulates expression of chemokine genes in chondrocytes via combinatorial regulation of C/EBPβ and NF-κB. Int J Mol Sci. 2014;15(10):17242–17255. doi:10.3390/ijms151017242
41. Simopoulou T, Malizos KN, Iliopoulos D, et al. Differential expression of leptin and leptin’s receptor isoform (Ob-Rb) mRNA between advanced and minimally affected osteoarthritic cartilage; effect on cartilage metabolism. Osteoarthritis Cartilage. 2007;15(8):872–883. doi:10.1016/j.joca.2007.01.018
42. Oh DK, Ciaraldi T, Henry RR. Adiponectin in health and disease. Diabetes Obes Metab. 2007;9(3):282–289. doi:10.1111/j.1463-1326.2006.00610.x
43. Honsawek S, Chayanupatkul M. Correlation of plasma and synovial fluid adiponectin with knee osteoarthritis severity. Arch Med Res. 2010;41(8):593–598. doi:10.1016/j.arcmed.2010.11.007
44. Lago R, Gomez R, Otero M, et al. A new player in cartilage homeostasis: adiponectin induces nitric oxide synthase type II and pro-inflammatory cytokines in chondrocytes. Osteoarthritis Cartilage. 2008;16(9):1101–1109. doi:10.1016/j.joca.2007.12.008
 © 2020 The Author(s). This work is published and licensed by Dove Medical Press Limited. The
full terms of this license are available at https://www.dovepress.com/terms
and incorporate the Creative Commons Attribution
- Non Commercial (unported, 3.0) License.
By accessing the work you hereby accept the Terms. Non-commercial uses of the work are permitted
without any further permission from Dove Medical Press Limited, provided the work is properly
attributed. For permission for commercial use of this work, please see paragraphs 4.2 and 5 of our Terms.
© 2020 The Author(s). This work is published and licensed by Dove Medical Press Limited. The
full terms of this license are available at https://www.dovepress.com/terms
and incorporate the Creative Commons Attribution
- Non Commercial (unported, 3.0) License.
By accessing the work you hereby accept the Terms. Non-commercial uses of the work are permitted
without any further permission from Dove Medical Press Limited, provided the work is properly
attributed. For permission for commercial use of this work, please see paragraphs 4.2 and 5 of our Terms.