Back to Journals » Cancer Management and Research » Volume 11
Metabolic profile and structure–activity relationship of resveratrol and its analogs in human bladder cancer cells
Authors Yang Y, Zhang G, Li C, Wang S, Zhu M, Wang J, Yue H, Ma X, Zhen Y, Shu X ![]()
Received 26 February 2019
Accepted for publication 9 April 2019
Published 21 May 2019 Volume 2019:11 Pages 4631—4642
DOI https://doi.org/10.2147/CMAR.S206748
Checked for plagiarism Yes
Review by Single anonymous peer review
Peer reviewer comments 2
Editor who approved publication: Dr Antonella D'Anneo
Yang Yang,1,2 Guangyuan Zhang,2 Chuangang Li,3 Sihan Wang,2 Manning Zhu,2 Jinan Wang,2 Hangtian Yue,2 Xiaodong Ma,2 Yuhong Zhen,2 Xiaohong Shu1,2
1College of Integrative Medicine, Dalian Medical University, Dalian 116044, People’s Republic of China; 2College of Pharmacy, Dalian Medical University, Dalian 116044, People’s Republic of China; 3Department of Urology, The Second Affiliated Hospital of Dalian Medical University, Dalian 116023, People’s Republic of China
Purpose: Resveratrol (RV), a promising anti-cancer candidate, is limited in application for its poor bioavailability. However, the better bioavailability has been found in some RV derivatives. So in this paper, we explore the structure–activity relationship and the metabolic profiles of RV and its analogs (polydatin [PD], oxyresveratrol [ORV], acetylresveratrol [ARV]) in human bladder cancer T24 cells, and then evaluate their active forms and key chemical functional groups which may determine the fate of tumor cells.
Methods: Drug sensitivity is evaluated by MTT assay, HE staining and flow cytometry analysis after T24 cells treated with RV, PD, ORV and ARV, respectively. Then the drug metabolites, in alive and dead T24 cells, also in T24 cell supernatant and lysates, are qualitatively and quantitatively analyzed by high-performance liquid chromatography, liquid chromatography coupled with tandem mass spectrum and high-resolution mass spectrometry technologies, respectively.
Results: RV, ORV and ARV inhibit bladder cancer cells growth in a dose- and time-dependent manner, and exert the anti-tumor potency to T24 cells in order of ORV>ARV>RV>PD. Meanwhile, similar metabolic profiles of the above compounds are found not only in cell supernatant and lysate, but also in dead and alive T24 cells after drug treatment, and the main metabolites of RV, ORV and PD are their prototypes, but ARV is mainly metabolized to RV.
Conclusion: The inhibitory potencies to T24 cells in the order of ORV>ARV>RV>PD are related to the structure and metabolism of RV and its analogs. Meanwhile, the number and position of free phenolic hydroxyl groups play a prominent role in antitumor activities. Therefore, protecting phenolic hydroxyl groups, and inhibiting drug metabolism to keep phenolic hydroxyl groups free would be the promising strategies to ensure the bioactivity of RV and its analogs, and thus to improve RV’s bioactivity and promote RV clinical translation.
Keywords: bladder cancer, resveratrol, oxyresveratrol, acetylresveratrol, polydatin, structure–activity relationship
Introduction
Resveratrol (RV, trans-3,5,4’-trihydroxy-stilbene; Figure 1A), a dietary polyphenol, is enriched in our daily food and is well known for its anticancer activity.1,2 It has been reported that RV shows good pharmacological activity against bladder cancer both in in vitro and in vivo.3,4 Clinically, bladder cancer treatment depends on the cancer stage, and chemotherapy is an important part of a series of treatments include surgery and radiotherapy. However, conventional chemotherapeutic drugs such as cisplatin and adriamycin, which are prone to serious side effects, so detoxification and synergistic therapy has become an important strategy for the treatment of bladder cancer.5,6 Experimental studies suggest that RV may reduce the renal toxicity caused by cisplatin,5 and more importantly RV shows good safety in healthy volunteers,7 therefore, RV would be a potential candidate for bladder cancer chemoprevention and chemotherapy. However, high absorption but low bioavailability is an obvious obstacle to RV,7,8 so how to improve the bioavailability and thus to improve the bioactivity is still an urgent problem for RV application.
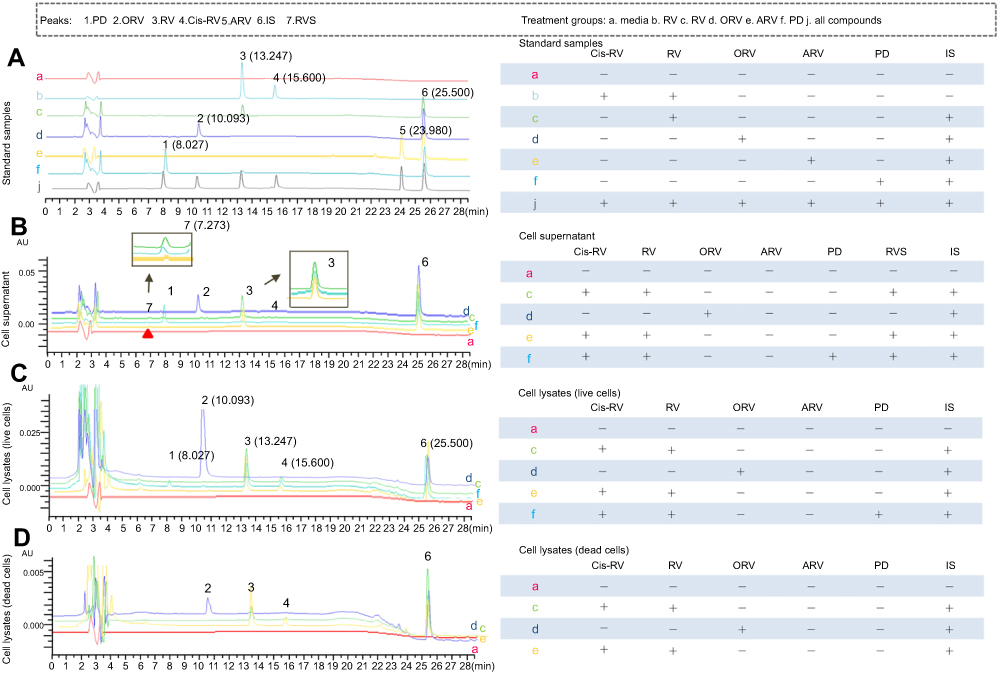 | Figure 3 HPLC analysis on the metabolites of trans-resveratrol (RV) and its analogs acetylresveratrol (ARV), oxyresveratrol (ORV) or polydatin (PD) in T24 cells. (A) In order to determine the mobile phases and identify the retention time of each compound, compound standard was prepared. HPLC chromatogram of control cell lysates (a), cis-RV was prepared by exposure of trans-RV-containing solution to natural light for 48 hrs, and analyzed by HPLC (b, tR3=13.247, tR4=15.600), trans-RV standard and internal standard/IS was dissolved in methanol and analyzed by HPLC (c, tR3=13.247), ORV standard and internal standard/IS was dissolved in methanol and analyzed by HPLC (d, tR2=10.293), ARV standard and internal standard/IS was dissolved in methanol and analyzed by HPLC (e, tR5=23.980), PD standard was dissolved in methanol and analyzed by HPLC (f, tR1=8.027), all of the standards were mixed in methanol and analyzed by HPLC (j). (B) To determine the metabolites in each group and whether there was any difference between the groups, cell lysate and supernatant was detected separately. Culture media incubation with RV without T24 cells for 48 hrs (a), T24 cells supernatant was analyzed after incubation with 100 μM RV for 48 hrs (c, detected retention time of peaks: tR3=13.247; tR4=15.600; tR6=25.500; tR7=7.273), T24 cells supernatant was analyzed after incubation with 100 μM ORV for 48 hrs (d, tR2=10.293; tR6=25.500), T24 cells supernatant was analyzed after incubation with 100 μM ARV for 48 hrs (e, tR3=13.247 tR4=15.600; tR6=25.500; tR7=7.273), T24 cells supernatant was analyzed after incubation with 100 μM PD for 48 hrs (f, tR1=8.027; tR3=13.247; tR6=25.500; tR7=7.273). (C) and (D) To identify if there was any different metabolite in the dead and alive cells which might cause different fate, the lysates of the dead and live cells were detected separately. Control cell lysate was analyzed after incubation with normal culture for 48 hrs (a), alive and dead T24 cells lysates were analyzed after incubation with 100 μM RV (c), ORV (d), ARV (e) for 48 hrs, respectively. And PD (f) was only analyzed in alive cells. Peaks: 1. PD; 2. ORV; 3. trans-RV; 4. cis-RV; 5. ARV; 6. 1,8-dihydroxy anthraquinone (IS); 7. Resveratrol monosulfate (RVS). |
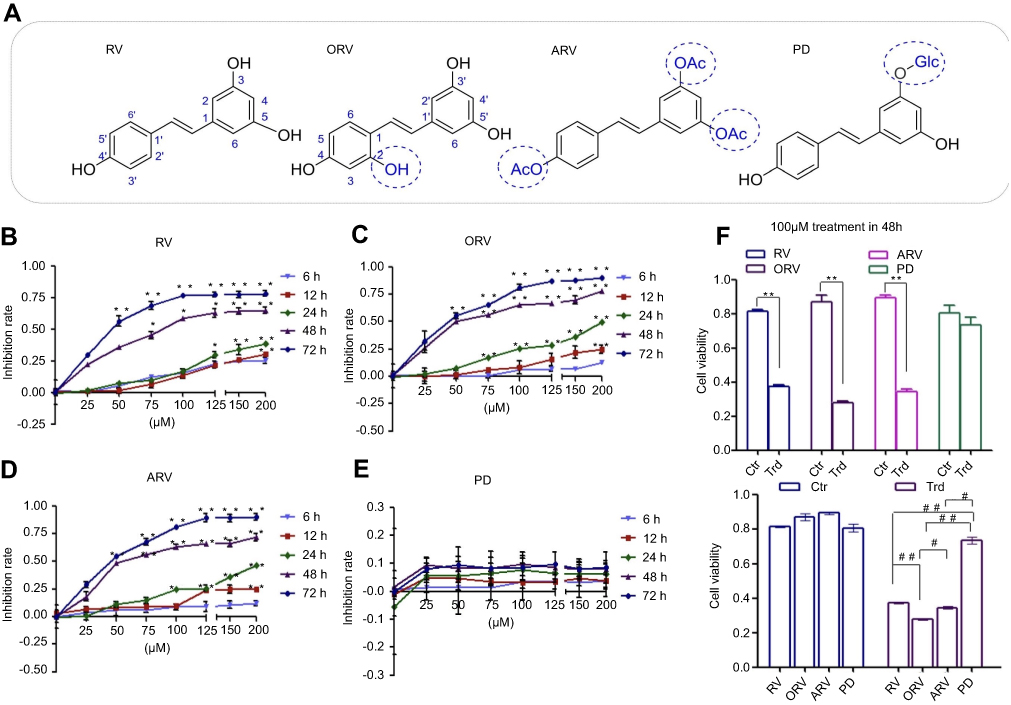 | Figure 1 Chemical structure and inhibitory effect of resveratrol and its analogs in T24 cells. (A) The chemical structure of trans-resveratrol (RV); acetylresveratrol (ARV); oxyresveratrol (ORV); polydatin (PD). (B)–(E) T24 cells were exposed to serial dilutions (0, 25, 50, 75, 100, 125, 150 and 200 μM) of the above compounds at five different time points (6 , 12, 24, 48 and 72 hrs), respectively. (F) Inhibitory effects of 100 μM investigated compounds were compared after 48-hr incubation. The values obtained using the MTT assay and depicted in the figures were analyzed with GraphPad Prism 5 to establish the IC50 (see Table 1). Data were expressed as mean±SD (n=3). Bars mean standard errors, *P<0.05, **P<0.001 revealed significant difference between treatment and control cells. #P<0.05, ##P<0.001 showed significant difference between different compound treatments. Ctr, untreated T24 cells; Trd, T24 cells treated with different compounds. The experiments were performed in triplicate with similar results. |
Bioavailability, especially the oral bioavailability, is generally believed to depend on water solubility, membrane permeability and metabolic stability of the given drugs.9 RV exhibits poor aqueous solubility and thus impairs its bioavailability.10 The increasing dosage (up to 50 mg·kg−1) or even coated with cyclodextrins, however, do not improve the bioavailability of RV.11 Besides, the poor metabolic stability of RV is also reported to lower its bioavailability and thus reduce its bioactivity.8,12 In vitro and in vivo studies showed that the sulfated or glucuronated RV metabolites could weaken its bioactivity compared to its parent form.13,14 In our previous study, we have already found that RV could efficiently inhibit tumor growth and induce apoptosis of human bladder cancer T24 cells, but shows less sensitivity to another cell line EJ. In addition, we have found that different sensitivities of those cells are not caused by their metabolism. Considering that the bioactive form is still RV itself and its sulfated metabolites reduce the pharmaceutical effect on T24 cells, so modifying the chemical structure of RV could affect the bioactivity of RV.15 To rule out different cell type characteristics impact, here, we chose the sensitive cell line T24 as a cell model to determine the structure–activity relationship.
To further study the structure–activity relationship of RV, some RV analogs are selected in this study. ARV, 3,5,4’-tri-O-acetylresveratrol, an analog of RV with three hydroxyls replaced by acetyls; ORV, trans-2,3’,4,5’-tetrahydroxystilbene, a hydroxylated analog of RV; and PD, 3,5,4’-trihydroxystilbene 3-glucoside, a RV 3-O-glucoside (Figure 1A). The above RV analogs possess the same parent chemical structure but conjugate with different functional groups, thus provide favorable conditions to study the structure–activity relationship of RV and its analogs. In this study, we selected RV, ARV, ORV and PD to treat human bladder cancer T24 cells to 1) evaluate and compare their anticancer activity; 2) qualitatively and quantitatively investigate the metabolic characteristics of these compounds in the bladder cancer cells, especially their metabolic profile in cell lysates; 3) analyze the structure–activity relationship of the similar compounds, especially the roles of the phenolic hydroxyl groups. Based on the bioactivity evaluation and metabolic analysis of RV, ARV, ORV and PD, we want to explore their structure–activity relationship and figure out the key functional groups, which may help us to search or synthesize more effective RV derivatives for bladder cancer therapy.
Materials and methods
Chemicals and reagents
MTT and propidium iodide (PI) were purchased from Sigma (SigmaChem Co., St. Louis, USA), RV and its derivatives (ORV, ARV, PD) were purchased from Sigma (SigmaChem Co.), dissolved in dimethyl sulfoxide (DMSO; Sigma Chem Co.) as stocking solution of 100 mmol·L–1 in −20°C and were wrapped in aluminum foil for protecting against light. For all experiments, the optimum working concentrations of these chemicals were prepared by diluting in DMEM, and the final concentration of DMSO in cultured medium was <0.2% which caused no measurable effect on cell growth.
Cell culture and treatment
The human bladder cancer cell line T24 (ATCC® HTB4TM) was obtained from the Type Culture Collection of the Chinese Academy of Sciences (Shanghai, China)/American Type Collection (ATCC, Rockville, USA). Cells were cultured in DMEM (Invitrogen Co., Grand Island, NY, USA) supplemented with 10% FBS (Gibco Life Science) and 100 mg·mL–1 of penicillin-streptomycin (Invitrogen Co.), under an atmosphere of 95% air and 5% CO2 at 37°C. The cells (5×10⁴ mL–1) were plated to 100 mm dishes (Nunc A/S, Roskilde, Denmark) with coverslips and incubated for 24 hrs before further experiments. Then, the coverslips were collected after treatment with/without the chemicals for morphologic evaluation.
Sensitivity evaluation
For viability assays, T24 cells (5×10³) were seeded in 96-well plates with DMEM medium overnight. Then, cells were treated with various concentrations of RV, ARV, ORV and PD (0–200 μmol·L–1), and 0.2% DMSO was used in control group. After incubation with T24 cells for 6, 12, 24, 48 and 72 hrs, respectively, MTT was added to each well and incubated at 37°C for 4 hrs. Then, intracellular formazan crystals were dissolved in DMSO and measured the absorbance data by a spectrophotometer (Thermo Fisher Scientific, USA) at 490 nm. The IC50 values were calculated by the GraphPad Prime 5 software. All the experiments were repeated in triplicate.
Morphological investigation
The cell-bearing coverslips were harvested from each experimental group treated with/without RV and its analogs, and fixed properly for HE staining. Briefly, the coverslips were washed with PBS in three times. Then, they were stained with hematoxylin for 5 mins and washed with PBS. After stained with eosin for 3 mins, the coverslips were dehydrated and cleared with xylene before placed in the slides. Finally, photographs were taken by using a light microscope (Leica DMI6000B, Wetzlar, Germany).
Flow cytometry analysis
After being treated with/without RV, ARV, ORV and PD, approximately 1×10⁶ cells were suspended in 100 μL of PBS, and then 200 μL of 70% ethanol were added and vortex for flow cytometry analysis. Following the treatment, the cells were harvested and washed twice with PBS. Apoptotic or necrotic cells were quantified using an annexin V-FITC-PI double staining kit (BD Biosciences, San Jose, CA, USA). Cells were centrifuged and resuspended in a binding buffer containing FITC-conjugated annexin V and PI. Then, samples were incubated for 15 mins in the dark prior to be assessed by dual-color flow cytometry by FC500 flow cytometer with CXP software (Beckman Coulter, Fullerton, CA, USA). Cells were classified as follows: live cells (Annexin/PI), necrotic cells (Annexin/PI+), early apoptotic cells (Annexin+/PI) or late apoptotic cells (Annexin+/PI+). The data were analyzed by flow cytometry CXP analysis software. To establish the confidential conclusions, the experiments were repeated at least three times.
Sample preparation
Preparation of standard solutions: solutions of RV, ORV, ARV, PD, and internal standard (IS, 1,8-dihydroxyanthraquinone, 200 μg·mL–1) in methanol were freshly prepared at five concentrations (23.75, 47.5, 95, 190, 285, 380 μmol·L–1) before detection. Meanwhile, standard solution samples were prepared in replicates (n=5 for the inter-day and intra-day validation respectively) at five concentration levels representing the entire range of concentrations. The relative standard deviations of intra-day and inter-day assay variations were all <10% which was acceptable by the guidelines for bioanalytical method validation.16 All the solutions were stored at 4°C in dark.
Sample preparation: after treatment with RV and its derivatives, T24 cells and cell-free media were harvested, respectively. The cells were washed with PBS three times and added to 950 μL methanol and 50 μL IS in a centrifuge tube, then centrifuged at RCF 10,000 g for 15 mins at 4°C. And finally, the last eluted solution was collected and 10 μL was injected HPLC and liquid chromatography-mass spectrometry (LC-MS) analysis. In all cases, the solution samples manipulation was performed in dark glass bottles to minimize the possible photochemical isomerization of trans-RV to its cis-form.14
Altogether 11 kinds of samples were subjected to HPLC analysis: Sample 1, blank DMEM supernatant; Sample 2, cis-RV (prepared by ultraviolet light for 1 hr);15 Sample 3, standard RV in DMEM; Sample 4, standard ORV in DMEM; Sample 5, standard ARV in DMEM; Sample 6, standard PD in DMEM; Sample 7, all mixed standard chemicals in DMEM; Sample 8, cell lysate or supernatant from T24 cells treated with 100 μmol·L–1 RV for 48 hrs; Sample 9, cell lysate or supernatant from T24 cells treated with 100 μmol·L–1 ORV for 48 hrs; Sample 10, cell lysate or supernatant from T24 cells treated with 100 μmol·L–1 ARV for 48 hrs; Sample 11, cell lysate or supernatant from T24 cells treated with 100 μmol·L–1 PD for 48 hrs.
Sample analysis by HPLC
The analyses were performed on the HITACHI HPLC system (Hitachi High-Technologies Corporation, Tokyo, Japan) consisted of a HITACHI 5110 pump, 5210 autosampler and 5430 diode array detector. The detection was carried out at a wavelength of 303 nm and 5,310 column oven was set at 30°C.17 All the separation of the samples was carried out on a Cosmosil C18-AR-II column (5 μm, 4.6 mm×250 mm; NacalaiTesque, Japan) with a mobile phase consisted of 20% acetonitrile (mobile Phase A, acetic acid adjusted pH 3.5) and 80% acetonitrile (mobile Phase B, acetic acid adjusted pH 3.5) at a flow rate of 1 mL·min–1. The mobile phases were degassed by sonication for 15 mins at room temperature before use and the gradient elution mode was carried out as follows:
0–14 mins, linear gradient from A:B (0:100, v/v) to A:B (60:40, v/v); 14–20 mins, the liner gradient from A:B (60:40, v/v) to A:B (0:100, v/v), the mobile phase was held on A:B (0:100, v/v). Each run was followed by equilibration time of 15 mins before the next injection. Ultraviolet spectra were monitored at 303 nm, and the flow rate was 1 mL·min–1. The data were collected and analyzed with Chemstation software.
Identification of metabolite(s) by LC-MS/MS and HRMS
To further identify the metabolite(s) of the compounds in T24 cells, the purified samples were analyzed by direct online liquid chromatography coupled with tandem mass spectrum (LC-MS/MS) under the chromatographic series (Agilent Technol Inc., Santa Clara, CA, USA) coupled to an Applied Biosystems API 3200 QTrap tandem mass spectrometer (Applied Biosystem/MDS SCIEX, Foster City, CA, USA). Standard solutions and sample solutions were prepared as described in previous section. In addition to the HPLC conditions described in previous section, the ion spray interface and the mass spectrometric parameters were optimized to obtain maximum sensitivity before use. The mass spectrometer determination of the samples was performed in a negative ion mode and the full-scan data acquisition was operated by scanning over the range of m/z 100–600 in profile mode, using a 2 ms pause between scans and a 2 s cycle time.18 All the identification was based on their retention time and ion fragmentations in the MS and MS/MS mode. Meanwhile, the data were obtained by the Applied Biosystem/MDS SCIEX analyst software (Version 1.4.1).
And then, to confirm the metabolites, high-resolution mass spectrometry (HRMS) analysis was performed on the LC-ESI-IT-TOF-MS (Shimadzu Co., Kyoto, Japan). The samples were performed in a negative ion mode at a resolution of 10,000 FWHM. After correctingthe accurate masses, the samples were injected onto a Shim-pack VP-ODS column (5 μm, 2.0×150 mm; Shimadzu Co., Kyoto, Japan). The column temperature was set at 40°C, and the flow rate was 0.6 mL·min–1. The mobile phase consisted of two phases: Phase A was acetonitrile and 10 mmol·L–1 acetic acid water solution (95:5, v/v, pH 3.0), and Phase B was 10 mmol·L–1 acetic acid water solution (pH 3.0) and set at a flow rate of 1 mL/min. A gradient elution was carried out as in the following: 0 min (95/5), 5 mins (70/30), 5.5 mins (40/60), 12.5 mins (40/60), 12.6 mins (95/5). The column was equilibrated with 5% Phase B for 5 mins before the next run. MS data were processed with LC-MS solution ver. 3.4 software (Shimadzu, Japan).
Statistical analyses
Data were given as the mean±standard deviation, IC50 values and statistical analyses were performed using GraphPad Prism 5 software. MTT data were analyzed with one-way ANOVA. It was considered statistically significant if the p-value is <0.05.
Results
RV, ORV, PD and ARV showed different inhibitory effects on T24 cells
In order to examine the effects of RV and its analogues on the viability of bladder cancer cells, T24 cells were subjected to a wide range of drug concentrations (0–200 μmol·L–1) at five different time points (6, 12, 24, 48 and 72 hrs), then MTT assays were performed. As shown in Figure 1, with increasing concentrations of the compounds at each time point, RV, ORV and ARV inhibited the growth of T24 cells in a dose- and time-dependent manner (Figure 1B–D), however, PD was not capable of inhibiting T24 cells growth (Figure 1E). Based on the above results, 100 μM drug concentration and 48 hrs treatment were chosen as the following research condition.
As shown in Table 1, RV and its analogs showed different inhibiting effect on T24 cells. ORV exhibited a strong inhibition of 67.68%, and its IC50 value was 47.46 μM. In addition, the IC50 of RV and ARV were 69.33 and 53.49 μM, and their inhibition rate to T24 cells were 54.34% and 61.29%, respectively. However, the IC50 of PD was not obtained and only showed 8.64% inhibition after 100 μM PD treatment. Compared with other compounds, T24 cells showed less sensitive to PD (Figure 1E–F).
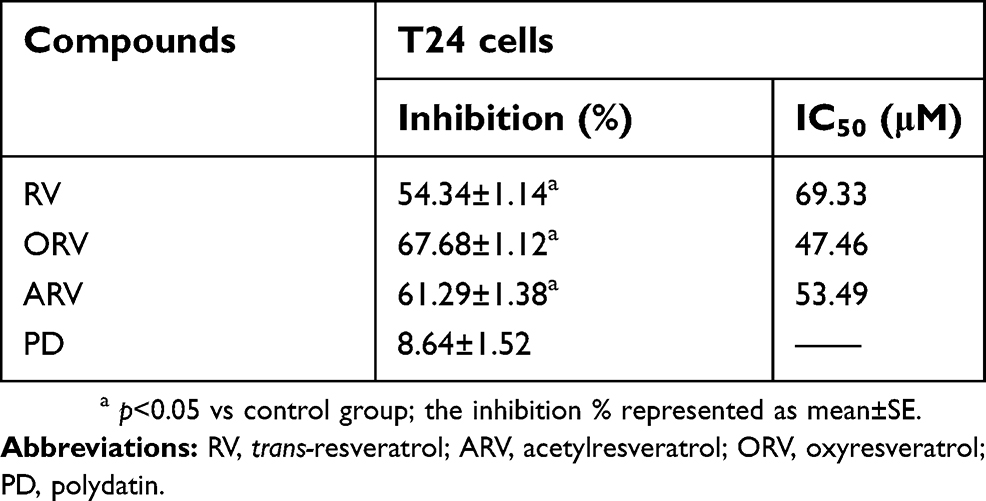 | Table 1 Inhibitory effects of RV and its analogs in T24 cells |
RV, ORV and ARV induced T24 cells morphological changes, except PD
To further assess the effects of RV and its derivatives, the morphological changes were detected using H&E staining. Figure 2A shows that T24 cells were full of polygons and fusiform in basal condition, but RV, ORV or ARV treated T24 cells showed the characteristics of condensed nuclei, shrinkage cell body and some slight edge boundaries (Figure 2A). However, PD-treated cells showed neither significant morphology change (Figure 2A) nor proliferation inhibition which was in accordance with the presence of cell numbers and MTT results (Figure 1E).
 | Figure 2 Morphological changes and apoptosis determination in T24 cells after resveratrol and its analogs treatment. (A) HE morphological staining performed on T24 cells without (control) and with 100 μM trans-resveratrol (RV), acetylresveratrol (ARV), oxyresveratrol (ORV) or polydatin (PD) incubation for 48 hrs (100×). T24 cells at a density of 4×10⁵ cells per well were cultured in dishes with coverslips, then the cell coverslips were harvested after 48 hr-treatment without (Control) and with 100 μM RV (ORV, ARV or PD). (B) RV and its analogs induced T24 cells apoptosis which analyzed by flow cytometry (FCM). Cells treated with 100 μM RV or its analogs were double-stained with annexin V and PI. The gate setting distinguished among living cells (bottom left), necrotic cells (top left), early apoptotic cells (bottom right) and late apoptotic cells (top right). (C) and (D) The cell apoptosis was analyzed with GraphPad Prism 5. Data were expressed as mean±SD (n=3). Bars mean standard errors, *, #P<0.05, **, ++, ##P<0.001 reveal significant difference between treatment and control cells. Ctr, untreated T24 cells. Data revealed a representative experiment in triplicate with similar results. |
RV, ORV and ARV induced T24 cells apoptosis, except PD
RV and its analogs showed growth-inhibiting effect on T24 cells, and the following step is to investigate whether they could induce apoptosis or not. RV, ORV and ARV could induce T24 cells apoptosis, but PD did not show obvious apoptosis-inducing effect on T24 cells (Figure 2B, C). Among all the compounds, ORV showed strongest apoptosis-inducing effect on T24 cells (Figure 2C). Compared with control, the number of early apoptotic T24 cells increased from 0.53±0.04% to 1.19±0.06% and the number of late apoptotic cells increased from 2.11±0.054% to 4.65±0.03% after RV treatment (Figure 2D). While the numbers of early and late apoptotic cells were changed to 3.68±0.02% and 34.12±7.4% after ORV treatment (Figure 2D). The numbers of early and late apoptotic cells were changed to 2.02±0.02% and 8.06±0.036% in ARV treatment group (Figure 2D). In PD treatment group, the early and late apoptotic cells were 0.51±0.01% and 2.15±0.029%, respectively, which indicated that PD induced less apoptotic effect on T24 cells. The above results revealed that RV, ORV and ARV, but not PD, could significantly induce T24 cells apoptosis.
Identification of metabolite(s) of RV and its analogues in T24 cells
After incubation with T24 cells, the metabolites of RV and its analogs were determined by HPLC, and the chromatograms of these samples are illustrated in Figure 3. In order to eliminate the interferer, standard samples were prepared, and HPLC analyses showed that only one compound was detected in each standard group. Meanwhile, the mobile phases and the gradient elution mode were detected and suitable for all the compounds, which are shown in Figure 3A j. The retention time corresponding to the peaks of 13.247, 15.600, 10.293, 23.980, 8.027 and 25.500 were of RV (peak 3), cis-RV (peak 4), ORV (peak 2), ARV (peak 5), PD (peak 1) and IS (peak 6), respectively (Figure 3A). By comparison with the blank and reference solution with retention time PD (peak 1), ORV (peak 2), RV (peak 3), cis-RV (peak 4), IS (peak 6) and RVS (peak 7, retention time 7.273 mins) could be found both in cell supernatant (Figure 3B) and in cell lysate (Figure 3C), separately, but ARV (peak 5) could not be detected (Figure 3B and C). Meanwhile, RVS (peak 7) as a main metabolite in PD, RV and ARV treatment cells was also detected both in supernatant and lysate, which was not marked in lysate for its tiny peak, but could be found based on its retention time, and also could be proved in the following experiments by LC-MS/MS and HRMS. Besides, we were also interested in whether there were any different metabolites between dead and alive cells after drug treatment, which might be the key constituents dominating the fate of T24. Since RV, ORV and ARV, not PD, caused cell death, dead cells were collected in RV, ORV and ARV treatment group. As shown in Figure 3C and D, in each group, dead and alive T24 cell lysate showed similar metabolic profile after drug treatment.
Further identification by LC-MS/MS and HRMS
For further identify the metabolite(s), ESI operated in negative ion mode was used for the LC-MS/MS analysis. The retention time was 6.975 mins for RV (M1), 5.912 mins for RVS (M2), 6.476 mins for cis-RV (M3), 5.753 mins for ORV (M4) and 5.319 min for PD (M5). Representative chromatogram is presented in Figure 4A. As illustrated in Table 2, the following precursor-product ion transitions were observed: m/z 227→185→143 for RV, m/z 227→185→143 for cis-RV which was considered as an isomeric RV with mass spectral features identical to RV, m/z 307→227→185→143 for RVS, m/z 243→201→159 for ORV, m/z 389→227→185→143 for PD, and which were consistent with our previous findings.14
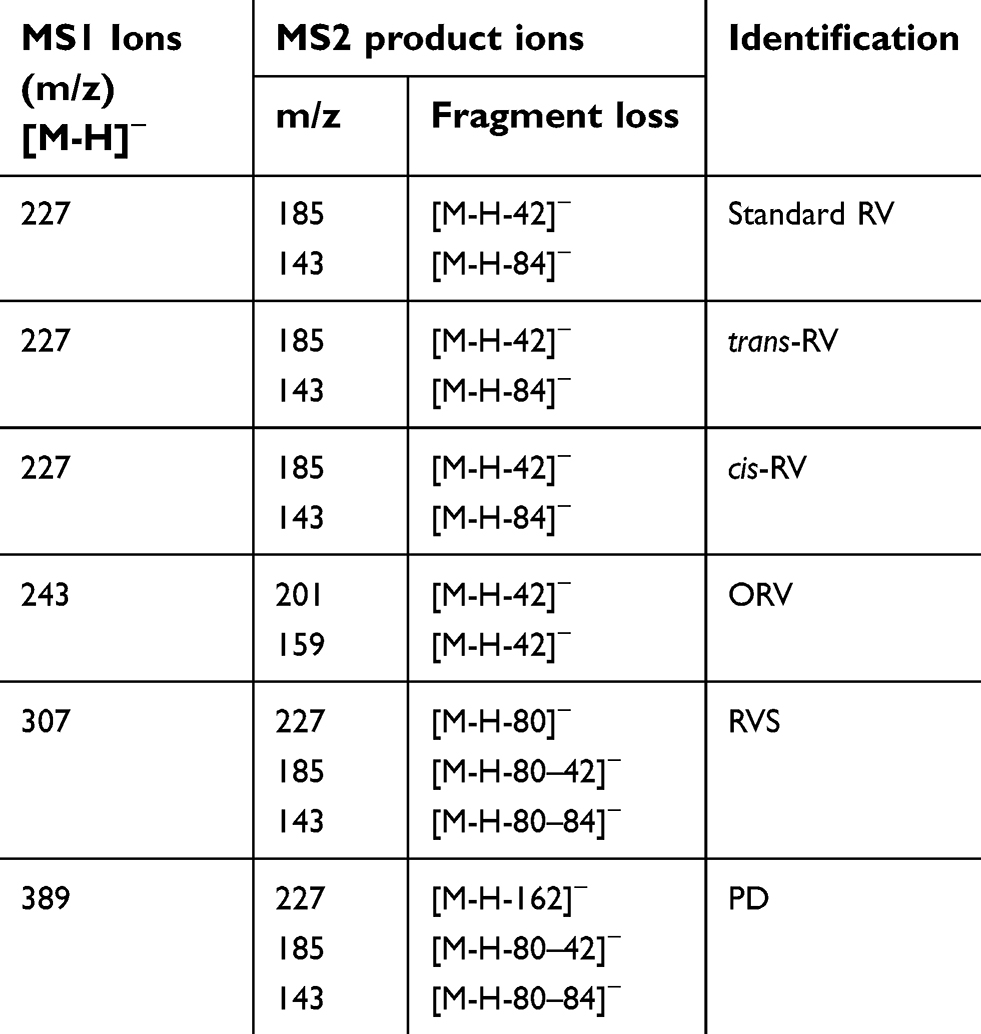 | Table 2 LC-MS/MS analysis on the metabolites of RV and its analogs in T24 cells |
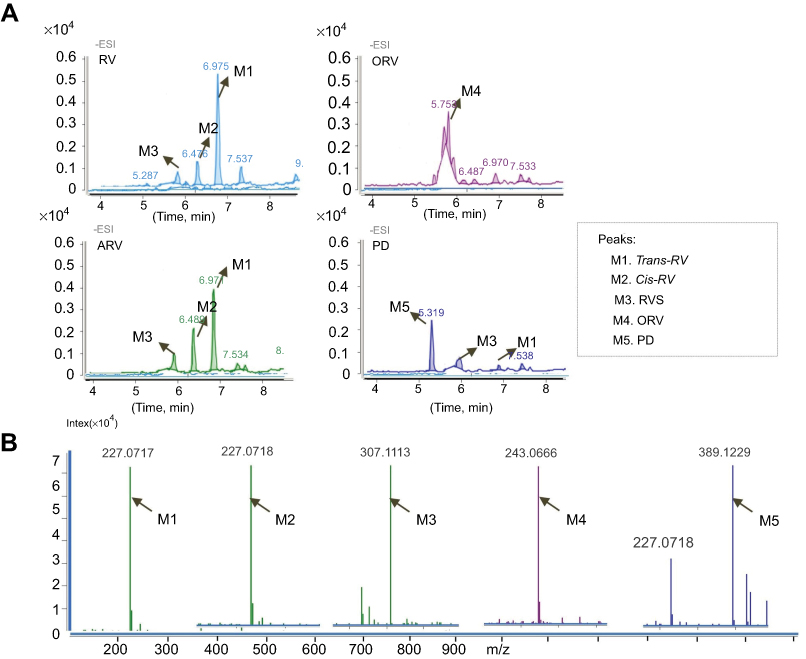 | Figure 4 MS and HRMS analysis on the metabolites of trans-resveratrol (RV) and its analogs acetylresveratrol (ARV), oxyresveratrol (ORV) or polydatin (PD) in T24 cells. (A) Total ion chromatogram (TIC) of the supernatant of T24 cells treated with 100 μM RV (ORV, ARV or PD) for 48 hrs. Peak M1, M2, M3, M4 and M5 indicated the retention time corresponding to the different mass composition of metabolites, respectively. (B) Shimadzu LC-MS-IT-TOF-based HRMS analysis of RV (ORV, ARV or PD) metabolites in T24 cells. Arrows labeled as M1, M2, M3, M4 and M5 indicated the exact molecular ion weight [M-H]− of 227.0717 (C14H11O3, calculated m/z 227.0708), 227.0718 (C14H11O3, calculated m/z 227.0708), 307.01113 (C14H11SO6, calculated m/z 307.0276), 243.0666 (C14H12O4, calculated m/z 243.2427), 389.1229 (C20H22O8, calculated m/z 389.2817), respectively. M1 represents trans-RV; M2 represents cis-RV; M3 represents RVS; M4 represents ORV; M5 PD, respectively. |
HRMS reconfirmed the result of LC-MS/MS, which showed the [M-H]– molecular ion exact mass as 227.0717 (C14H11O3, calculated m/z 227.0708), 227.0718 (C14H11O3, calculated m/z 227.0708), 307.1113 (C14H11SO6, calculated m/z 307.0276), 243.0666 (C14H11O4, calculated m/z 243.2426) and 389.1229 (C20H21O8, calculated m/z 389.3838) (Figure 4B).
Quantitative analysis of main metabolite(s) in T24 cells
All the metabolites of RV and its analogs were evaluated according to the methods described above. Peaks in the achieved chromatograms were recognized by comparing the retention time with those of standard solutions and reconfirmed by LC-MS/MS and HRMS. The main metabolites in cell supernatant and lysate samples were identified and quantified by HPLC/DAD chromatography.16 Figure 3 illustrates the peak 3 (RV) with a retention time of 13.247 mins, as the main metabolite peak was found both in RV and ARV cell supernatant and lysates. Besides, peak 2 (ORV) and peak 1 (PD) were the main metabolites found in ORV and PD treated cell supernatant and cell lysate, respectively. Peak 7 (RVS) was also observed in some groups, but could not be quantified because of its minimal peak-area which is not in the range of standard curve. The calibration curves constructed by plotting the peak-area ratios of RV, ORV, PD to IS versus the nominal concentrations in the standard biological samples using linear regression analysis are listed in Table 3. The calibrations were linear over a certain range in all biological samples (cell supernatant and lysate) with a good correlation coefficient (r) larger than 0.995 (Table 3).
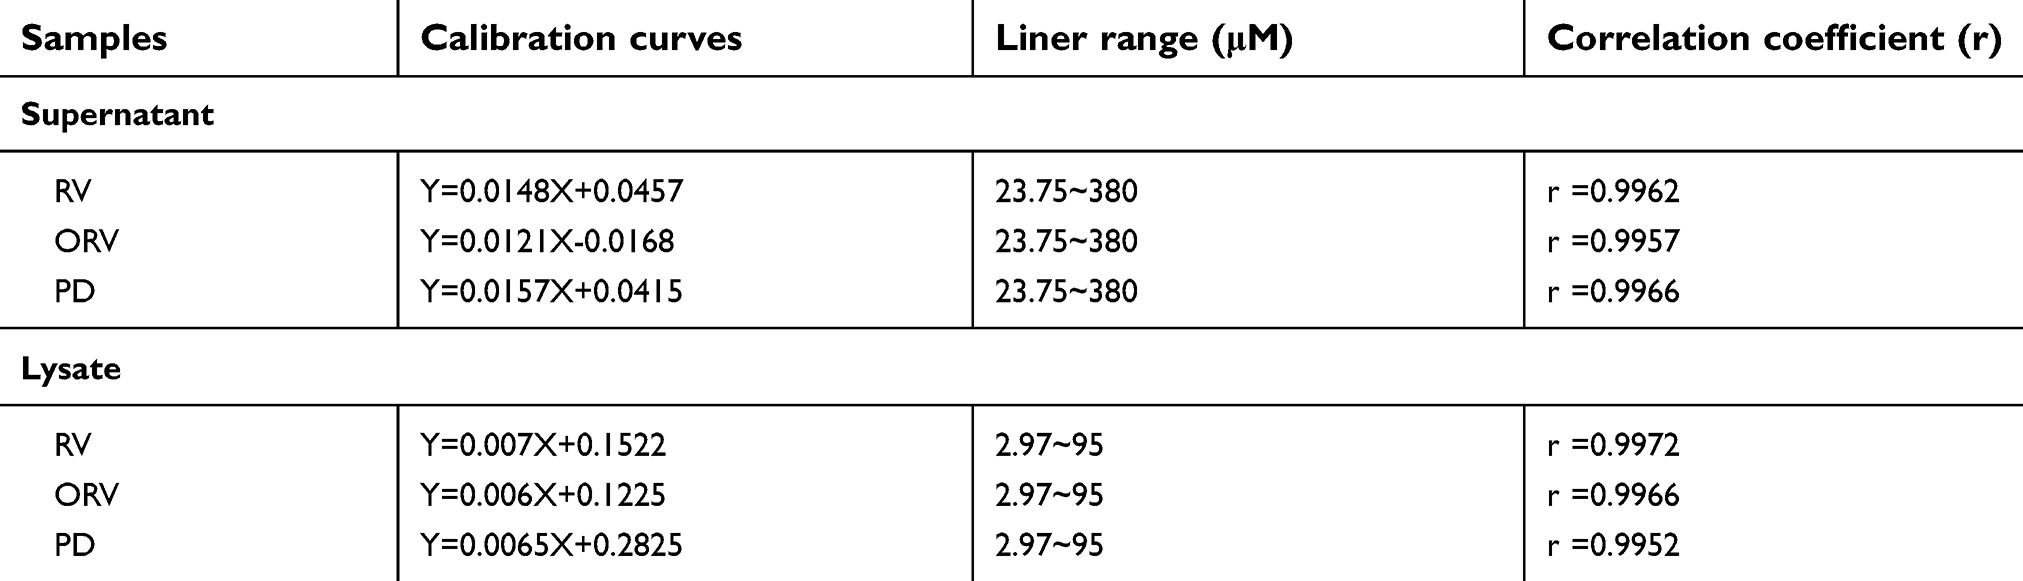 | Table 3 Calibration curves for RV and its analogs in biological samples |
Cellular uptake of RV and its derivatives in T24 cells at the different time points (6, 12, 24 and 48 hrs) were evaluated after 100 μM RV, ORV, ARV or PD treatment (Figure 5, Table 3). Figure 5A illustrates that the concentration of drugs in the supernatant showed different time- and dose-fashion. RV, ORV and PD got their maximal concentration of (37.852±5.123) μM at 48 hrs, (49.519±2.128) μM at 12 hrs and (45.379±0.581) μM at 24 hrs in RV, ORV and PD treatment group, respectively. However, ARV was not found in ARV treatment group, but RV was detected at a maximal concentration of (51.768±3.834) μM at 12 hrs after ARV treatment. Moreover, the 48 h treatment cell supernatant results revealed that the mean ratio of ORV in ORV treatment group was almost 1.25 times lower than RV in RV and ARV treatment group; almost 1.66 times lower than PD but 7.43 times higher than RV in PD treatment group (Figure 5B). Meanwhile, the cell lysates were also collected to evaluate the intracellular drug concentrations. According to the results (Figure 5C), ORV treatment group showed obvious high concentration of ORV and increased to a maximum of (8.008±0.802) μM at 48 hrs. Besides, RV could also be detected and valuated in PD treatment group which increased to a maximum of (0.605±0.183) μM after 12-hr incubation. Compared with main metabolites in cell supernatant in Figure 5B, the situation changed in cell lysates showed that the mean ratio of ORV was 5.39 times and 4.54 times higher than RV in RV and ARV treatment group, 8.72 and 37.64 times higher than RV and PD in PD treatment group, respectively (Figure 5D).
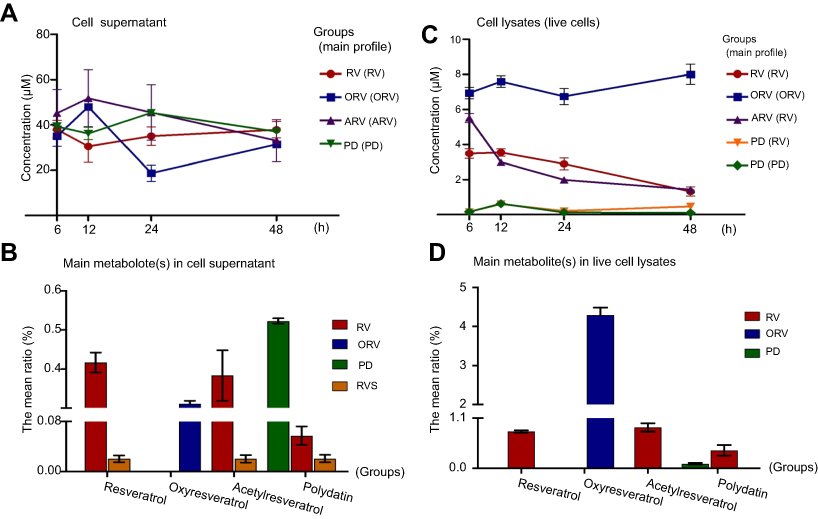 | Figure 5 Quantitative analysis on the main profiles of trans-resveratrol (RV) and its analogs acetylresveratrol (ARV), oxyresveratrol (ORV) or polydatin (PD) in T24 cells. The supernatant and lysate of T24 cells were collected for LC-MS analysis after 100 μM RV (ORV, ARV and PD) treatment for 6, 12, 24 and 48 hrs, respectively. All the standard solutions, samples and internal standard (IS, 1, 8-dihydroxyanthraquinone, 200 μg mL–1) were freshly prepared before detection. (A) and (C) The concentration of main metabolites in supernatant was calculated using calibration curves for each compound, and showed the changes in different time points. Values were represented as means±SD, n=3–5. (B) and (D) All the metabolites in supernatant and cell lysate were detected, and the mean ratios of peak area were used to show all detectable metabolites of four compounds after 48-hr incubation in T24 cells. |
Discussion
The anti-proliferative activities of RV and its analogs were compared in human bladder cancer T24 cells, and their IC50 values showed that the compounds exhibited the inhibitory potencies to T24 cells in order of ORV>ARV>RV>PD after 48-hr treatment. The above results demonstrated that ORV, a hydroxylated analog of RV, exerted higher inhibiting activity than RV, but PD, 3-OH glycosylated RV, showed lower activity than RV. Compared with the chemical structure of RV, ORV has an extra -OH group but PD lacks one -OH group (Figure 1A), which indicated that the increased phenolic hydroxyl groups would be helpful for their anticancer activity.
The anticancer activity was tightly associated with the phenolic hydroxyl groups in the aromatic rings of RV,19,20 but in the case of ARV, there are no phenolic hydroxyl groups in its chemical structure, which exhibited stronger antitumor activity than RV in T24 cells. The above results suggested that ARV might produce more powerful active compound(s) during the metabolic process. Therefore, the metabolic active form determination of RV and its analogs in T24 cells became an important issue need to be solved in our research.
HPLC, LC-MS/MS and HRMS detection showed that RV was the main metabolite during the metabolic process of ARV, which was consistent with the findings of Osmond et al who also found that ARV could be converted into RV via the hydrolysis of the acetyls.21 The measured concentration of RV in ARV-treated T24 cell lysate was higher than in RV-treated group and exerted even stronger activity, which meant that ARV was better absorbed, and the acetyl groups could protect the phenolic hydroxyl groups from sulfation or glucuronidation, and thus improved its biopotency and bioavailability. In vivo, ARV also underwent a rapid metabolism and the transformed RV could be detected both in mouse and rat models.21,22 In addition, it was reported that ARV could significantly enhance the targeting therapy of RV to the liver, which was seven times higher than administration of equimolar RV.22 The above study could explain why only transformed RV could be detected after ARV-treatment and why ARV exhibited stronger anti-proliferative effect than RV did in T24 cells. Our findings indicated that RV was the active metabolite of ARV in T24 cells, and the increased therapeutic action of ARV was related to the presence of phenol hydroxyl groups from the hydrolysis of the acetyls during metabolism.
In the metabolic process of PD, RV was also found as the main metabolite in PD-treated T24 cells, but most of the PD (about 53%) still kept in the cell supernatant and only a small amount of PD (<1%) could convert to RV and transport into T24 cells. Compared to the cellular drug concentration with the IC50 of RV, the transformed RV from PD was too low to exert inhibitory effects on T24 cells. The study implied that PD could be metabolized into RV, however, PD was absorbed poorly and 3-glycoside group substituting for 3-OH would lead to lower bioavailability and biopotency. So, we assumed that 3-phenol hydroxyl was a key functional group for the antitumor activity of RV in T24 cells. The hypothesis was demonstrated by Herath et al who also found that RV tended to lose its pharmacological activities with the substitution of its hydroxyl groups.23 Besides, Miksits et al reported that all the sulfated metabolites of RV were less potent against MCF-7, MDA-MB-231 and ZR-75–1 cells,24 which suggested that the conjugation of the phenolic hydroxyl groups with sulfuric acid would affect the anti-tumor activity of RV, so the RV parent compound possessed stronger pharmacological activities than its metabolites for their lacking 3- or 4’-phenolic hydroxyl groups.18,25
The presence of phenolic hydroxyl groups in the stilbenes was required for the antitumor activity, which was further proved in the ORV treated T24 cells. ORV, possessing an extra hydroxyl group at 2’-position, kept a higher concentration of ORV in ORV-treated group than the concentration of RV in RV-treated group (Figure 5D), and exerted a stronger inhibitory effect on T24 cells than RV did. This is in line with the report of Kim et al26 that ORV dominated over its precursor against murine melanoma B-16 cells. Our HPLC and LC/MS analysis showed that ORV prototype was dominated in T24 cells during the metabolism of ORV, and about 45% of ORV was detected in T24 cell lysates. Herein, the stronger antitumor activity of ORV indicated that the active metabolite of ORV was its prototype, which possessed a better absorption and stability, thus exerted the favorable pharmacological effect. Furthermore, ORV was reported to be transported into the tissue and its absorption ratio was estimated to be about 50%.27 In our study, ORV prototype, possessing the largest number of phenolic hydroxyl groups, exerted the strongest activity among the four compounds. Here, our data provided extra evidence to support the conclusion that the number and position of hydroxyl groups played a key role in the bioactivity of stilbenes.19,28
Conclusion
In this paper, our findings demonstrated that the structure–activity relationship can affect the antitumor activity of RV and its analogs. Some strategies such as optimization of drug delivery routes and formulations, and synergistic or additive interactions with various phytochemicals were reported to increase RV’s bioavailability, in addition, modulation of RV metabolism was also reported to improve RV’s bioactivity.29,30 Here, we focused on the chemical structure and metabolism of RV and its analogs, to investigate how they affect the bioavailability and bioactivity. The results proved that the number and position of free phenolic hydroxyl groups were key points to the pharmacological activity of RV and its analogs, which was also consistent with our previous report.20 Therefore, adding phenolic hydroxyl groups to stilbene structure, preparing prodrug such as ARV to protect phenolic hydroxyl groups, and inhibiting drug metabolism to keep phenolic hydroxyl groups free would be the promising strategies to ensure the bioactivity of RV and its analogues possessing stronger pharmacological activity, and thus to improve RV’s bioactivity and promote RV clinical translation.
Abbreviation list
ARV, acetylresveratrol; DMSO, dimethyl sulfoxide; DTT, DL-dithiothreitol; HRMS, high-resolution mass spectrometry; ICC, immunocytochemical staining; IC50, 50% inhibitor concentration; IS, internal standard; LC-ESI-IT-TOF-MS, liquid chromatography combined with electrospray ionization ion trap time-of-flight mass spectrometry; LC-MS, liquid chromatography coupled with tandem mass spectrum; LOQ, limit of quantitation; MS, mass spectrum; MTT, methyl thiazolyl tetrazolium; ORV, oxyresveratrol; PD, polydatin; PI, propidium iodide; QC, quality control; RV, resveratrol; RVS, resveratrol monosulfate; TIC, total ion chromatogram.
Chemical compounds studied in this article
trans-resveratrol (PubChem CID: 445154); oxyresveratrol (PubChem CID: 5281717); acetylresveratrol (PubChem CID: 5962587); polydatin (PubChem CID: 5281718); cis-resveratrol (PubChemCID:1548910). More information is available at:
Acknowledgments
This work was supported by the grants from National Natural Science Foundation of China (No. 81672945 and 81072063) and Liaoning Provincial Natural Science Foundation of China (No. 201602234).
Disclosure
The authors report no conflicts of interest in this work.
References
1. Gambini J, Inglés M, Olaso G, et al. Properties of resveratrol: in vitro and in vivo studies about metabolism, bioavailability, and biological effects in animal models and humans. Oxid Med Cell Longev. 2015;2015:837042. doi:10.1155/2015/659750
2. Gliemann L. What are the chances that resveratrol will be the drug of tomorrow? Pharmacol Res. 2018;129:139–140. doi:10.1016/j.phrs.2018.02.004
3. Wu ML, Li H, Yu LJ, et al. Short-term resveratrol exposure causes in vitro and in vivo growth inhibition and apoptosis of bladder cancer cells. PLoS One. 2018;9:e89806. doi:10.1371/journal.pone.0089806
4. Bai Y, Mao QQ, Qin J, et al. Resveratrol induces apoptosis and cell cycle arrest of human T24 bladder cancer cells in vitro and inhibits tumor growth in vivo. Cancer Sci. 2010;101:488–493. doi:10.1111/j.1349-7006.2009.01415.x
5. Valentovic MA. Evaluation of resveratrol in cancer patients and experimental models. Adc Cancer Res. 2018;137:171–188.
6. Hu B, Yan Y, Tong F, et al. Lumbrokinase/paclitaxel nanoparticle complex: potential therapeutic application in bladder cancer. Int J Nanomedicine. 2018;13:3625–3640. doi:10.2147/IJN.S166438
7. Rotches-Ribalta M, Andres-Lacueva C, Estruch R, Escribano E, Urpi-Sarda M. Pharmacokinetics of resveratrol metabolic profile in healthy humans after moderate consumption of red wine and grape extract tablets. Pharmacol Res. 2012;66:375–382. doi:10.1016/j.phrs.2012.08.001
8. Walle T, Hsieh F, Mh D, Oatis JE
9. Hurst S, Loi CM, Brodfuehrer J, El-Kattan A. Impact of physiological, physicochemical and biopharmaceutical factors in absorption and metabolism mechanisms on the drug oral bioavailability of rats and humans. Expert Opin Drug Metab Toxicol. 2007;3:469–489. doi:10.1517/17425225.3.4.469
10. Bertacche V, Lorenzi N, Nava D, Pini E, Sinico C. Host-Guest Interaction Study of resveratrol with natural and modified cyclodextrins. J Incl Phenom Macrocycl Chem. 2006;55:279–287. doi:10.1007/s10847-006-9047-8
11. Das S, Lin HS, Ho PC, Ng KY. The impact of aqueous solubility and dose on the pharmacokinetic profiles of resveratrol. Pharm Res. 2008;25:2593–2600. doi:10.1007/s11095-008-9677-1
12. Baur JA, Sinclair DA. Therapeutic potential of resveratrol: the in vivo evidence. Nat Rev Drug Discov. 2006;5:493–506. doi:10.1038/nrd2060
13. Kenealey JD, Subramanian L, Van Ginkel PR, et al. Resveratrol metabolites do not elicit early pro-apoptotic mechanisms in neuroblastoma cells. J Agric Food Chem. 2011;59:4979–4986. doi:10.1021/jf104901g
14. Shu XH, Li H, Sun Z, et al. Identification of metabolic pattern and bioactive form of resveratrol in human medulloblastoma cells. Biochem Pharmacol. 2010;79:1516–1525. doi:10.1016/j.bcp.2010.01.022
15. Yang Y, Li C, Li H, et al. Differential sensitivities of bladder cancer cell lines to resveratrol is unrelated to its metabolic profile. Oncotarget. 2017;8:40289–40304. doi:10.18632/oncotarget.15041
16. Juan ME, Maijó M, Planas JM. Quantification of trans-resveratrol and its metabolites in rat plasma and tissues by HPLC. J Pharm Biomed Anal. 2010;51:391–398. doi:10.1016/j.jpba.2009.03.026
17. Qian G, Leung SY, Lu G, Leung KS. Optimization and validation of a chromatographic method for the simultaneous quantification of six bioactive compounds in Rhizoma et Radix Polygoni Cuspidati. J Pharm Pharmacol. 2008;60:107–113. doi:10.1211/jpp.60.1.0014
18. Shu XH, Li H, Sun XX, et al. Metabolic patterns and biotransformation activities of resveratrol in human glioblastoma cells: relevance with therapeutic efficacies. PLoS One. 2011;6:e27484. doi:10.1371/journal.pone.0027484
19. Murias M, Jäger W, Handler N, et al. Antioxidant, prooxidant and cytotoxic activity of hydroxylated resveratrol analogues: structure-activity relationship. Biochem Pharmacol. 2005;69:903–912. doi:10.1016/j.bcp.2004.12.001
20. Nawaz W, Zhou Z, Deng S, et al. Therapeutic versatility of resveratrol derivatives. Nutrients. 2017;9:E1188. doi:10.3390/nu9111188
21. Osmond GW, Masko EM, Tyler DS, Freedland SJ, Pizzo S. In vitro and in vivo evaluation of resveratrol and 3,5-dihydroxy-4‘-acetoxy-trans-stilbene in the treatment of human prostate carcinoma and melanoma. J Surg Res. 2013;179:e141–148. doi:10.1016/j.jss.2012.02.057
22. Liang L, Liu X, Wang Q, Cheng S, Zhang S, Zhang M. Pharmacokinetics, tissue distribution and excretion study of resveratrol and its prodrug 3,5,4‘-tri-O-acetylresveratrol in rats. Phytomedicine. 2013;20:558–563. doi:10.1016/j.phymed.2012.12.012
23. Herath W, Khan SI, Khan IA. Microbial metabolism. Part 14. Isolation and bioactivity evaluation of microbial metabolites of resveratrol. Nat Prod Res. 2013;27:1437–1444. doi:10.1080/14786419.2012.722089
24. Miksits M, Wlcek K, Svoboda M, et al. Antitumor activity of resveratrol and its sulfated metabolites against human breast cancer cells. Planta Med. 2009;75:1227–1230. doi:10.1055/s-0029-1185533
25. Stivala LA, Savio M, Carafoli F, et al. Specific structural determinants are responsible for the antioxidant activity and the cell cycle effects of resveratrol. J Biol Chem. 2001;276:22586–22594. doi:10.1074/jbc.M101846200
26. Kim YM, Yun J, Lee CK, Lee H, Min KR, Kim Y. Oxyresveratrol and hydroxystilbene compounds. Inhibitory effect on tyrosinase and mechanism of action. J Biol Chem. 2002;277:163400–163444.
27. Qiu F, Komatsu K, Saito K, Kawasaki K, Yao X, Kano Y. Pharmacological properties of traditional medicines. XXII. Pharmacokinetic study of mulberroside A and its metabolites in rat. Biol Pharm Bull. 1996;19:1463–1467.
28. Fauconneau B, Waffo-Teguo P, Huguet F, Barrier L, Decendit A, Merillon J. Comparative study of radical scavenger and antioxidant properties of phenolic compounds from Vitis vinifera cell cultures using in vitro tests. Life Sci. 1997;61:2103–2110.
29. Amri A, Chaumeil JC, Sfar S, Charrueau C. Administration of resveratrol: what formulation solutions to bioavailability limitations?. J Control Release. 2012;158:182–193. doi:10.1016/j.jconrel.2011.09.083
30. Smoliga JM, Blanchard O. Enhancing the delivery of resveratrol in humans: if low bioavailability is the problem, what is the solution? Molecules. 2014;19:17154–17172. doi:10.3390/molecules191117154
 © 2019 The Author(s). This work is published and licensed by Dove Medical Press Limited. The
full terms of this license are available at https://www.dovepress.com/terms
and incorporate the Creative Commons Attribution
- Non Commercial (unported, 3.0) License.
By accessing the work you hereby accept the Terms. Non-commercial uses of the work are permitted
without any further permission from Dove Medical Press Limited, provided the work is properly
attributed. For permission for commercial use of this work, please see paragraphs 4.2 and 5 of our Terms.
© 2019 The Author(s). This work is published and licensed by Dove Medical Press Limited. The
full terms of this license are available at https://www.dovepress.com/terms
and incorporate the Creative Commons Attribution
- Non Commercial (unported, 3.0) License.
By accessing the work you hereby accept the Terms. Non-commercial uses of the work are permitted
without any further permission from Dove Medical Press Limited, provided the work is properly
attributed. For permission for commercial use of this work, please see paragraphs 4.2 and 5 of our Terms.