
Back to Journals » International Journal of General Medicine » Volume 19
Metabolic Endotypes for Dialysis Risk Stratification in Chronic Kidney Disease Stages G2–G4: A Pragmatic Cluster Analysis Using Routine Laboratory Tests
Authors Guo L, Shu P  , Qin D, Jiang W, Xu F, Wang T, Zeng X, Li J
Received 1 April 2026
Accepted for publication 2 July 2026
Published 9 July 2026 Volume 2026:19 613767
DOI https://doi.org/10.2147/IJGM.S613767
Checked for plagiarism Yes
Review by Single anonymous peer review
Peer reviewer comments 5
Editor who approved publication: Professor David E. Stec
Li Guo, Peng Shu, Dan Qin, Wei Jiang, Fang Xu, Ting Wang, Xingruo Zeng, Jun Li
Department of nephrology, The Central Hospital of Wuhan, Hubei, Province, People’s Republic of China
*These authors contributed equally to this work
Correspondence: Jun Li, Email [email protected]
Objective: Chronic kidney disease (CKD) affects over 850 million people globally, but traditional staging based on eGFR and albuminuria fails to capture metabolic heterogeneity and divergent outcomes in CKD stages G2–G4 (15 < eGFR < 90 mL/min/1.73m2). We aimed to identify metabolic endotypes using routine laboratory tests and link them to dialysis initiation.
Methods: This single-center retrospective cohort study included 400 CKD stages G2–G4 patients (2022– 2024) from The Central Hospital of Wuhan. Nine routine biomarkers (estimated glomerular filtration rate [eGFR], uric acid, glucose, phosphate, parathyroid hormone [PTH], albumin, hemoglobin, D-dimer, total cholesterol) underwent robust preprocessing, followed by unsupervised K-means clustering. The nine input variables were selected a priori based on their established roles in core CKD pathophysiological pathways (CKD‑MBD, malnutrition‑inflammation‑anemia, and glycolipid‑uric acid dysregulation), grounding the clustering in biological mechanisms rather than purely empirical data‑driven reduction. Optimal clusters (K=4) were confirmed via multiple statistical metrics and clinical interpretability.
Results: Four distinct metabolic endotypes emerged: 1) Inflammatory-hypercoagulable (high D-dimer, low albumin); 2) Severe CKD-MBD-anemia (lowest eGFR/hemoglobin, highest PTH); 3) Metabolically favorable (highest eGFR/albumin/hemoglobin, lowest D-dimer); 4) Glycolipid-uric acid dysregulation (high glucose/uric acid/phosphate). Dialysis rates differed drastically: 59.4% (Endotype 2), 46.7% (Endotype 4), 38.7% (Endotype 1), and 6.7% (Endotype 3) (all P< 0.001). Multivariable logistic regression incorporating metabolic endotype, age, gender, and eGFR yielded a corrected AUC of 0.838 (95% CI: 0.763– 0.915) for predicting dialysis initiation, with a sensitivity of 94.6% and specificity of 69.4%.
Conclusion: This pragmatic approach, based on routinely available laboratory tests, suggests potential application value for risk stratification in clinical practice and provides a preliminary framework for future precision medicine research. However, given the single‑center retrospective design, its generalizability requires external validation in large‑scale prospective multi‑center cohorts before clinical implementation.
Keywords: chronic kidney disease, metabolic endotype, k-means unsupervised clustering, risk stratification, dialysis initiation, routine laboratory biomarkers
Introduction
Chronic kidney disease (CKD) affects more than 850 million people worldwide and is a major driver of cardiovascular morbidity and premature mortality.1 Although diabetes, hypertension, and obesity are well-established risk factors for CKD development and progression.2 Substantial heterogeneity persists in disease trajectories and clinical outcomes—even among individuals with similar baseline kidney function.3 This variability suggests that traditional staging systems, which rely primarily on estimated glomerular filtration rate (eGFR) and albuminuria, fail to capture the underlying biological diversity that shapes individual risk.2
Indeed, recent large-scale cohort analyses have demonstrated that patients within narrow eGFR strata—particularly in CKD stages G2–G4 (CKD Stage 2–4 (eGFR 15–89 mL/min/1.73m2))—exhibit markedly divergent risks of death, hospitalization, and kidney failure.4 For example, a pooled analysis of 11 international cohorts revealed that among individuals with eGFR 30–44 mL/min/1.73m2, some maintained stable kidney function for years while others rapidly progressed to end-stage kidney disease (ESKD), independent of conventional risk factors.3 Similarly, in the Chronic Renal Insufficiency Cohort (CRIC) Study, patients with eGFR 20–30 mL/min/1.73m2 showed over three-fold differences in all-cause mortality, highlighting the inadequacy of eGFR alone for risk stratification.4 These findings underscore an urgent need to move beyond static functional metrics toward biologically informed classification strategies.
The concept of “endotype”—a disease subgroup defined by shared pathophysiological mechanisms rather than surface-level clinical features—offers a promising framework for addressing this challenge.5 Unlike descriptive phenotypes, endotypes reflect causal pathways and may guide targeted interventions, as successfully demonstrated in asthma and chronic obstructive pulmonary disease (COPD), where biomarker-defined endotypes inform biologic therapy selection.6,7 In CKD, data-driven approaches have identified subgroups associated with inflammation, fibrosis, or metabolic dysfunction; however, these efforts have largely focused on early-to-moderate CKD (eGFR ≥45 mL/min/1.73m2).8 To date, no study has systematically characterized metabolic endotypes in CKD stages G2–G4, a population with high symptom burden, complex comorbidities, and limited therapeutic options.9
Applying this endotype framework to late-stage CKD, we focused on three interrelated pathophysiological axes that are particularly relevant to metabolic disturbances in CKD stages G2–G4. First, chronic kidney disease–mineral and bone disorder (CKD-MBD)—characterized by hyperphosphatemia, secondary hyperparathyroidism, and uric acid accumulation—promotes vascular calcification and renal fibrosis via mitochondrial dysfunction and NOD-like receptor family pyrin domain containing 3 (NLRP3) inflammasome activation.10 Second, the malnutrition–inflammation–anemia syndrome reflects a state of chronic low-grade inflammation that suppresses hepatic albumin synthesis, disrupts iron homeostasis, and blunts erythropoietin response, leading to hypoalbuminemia, anemia, and increased vulnerability to infections and sarcopenia.11,12 Third, dysregulation of glucose and lipid metabolism—including insulin resistance and the so-called “lipid paradox” (where low total cholesterol paradoxically predicts higher mortality)—is tightly linked to systemic inflammation and protein-energy wasting.13,14 Critically, these axes interact: hyperuricemia amplifies NLRP3-driven inflammation, which in turn exacerbates insulin resistance and albumin loss, while anemia-induced tissue hypoxia further impairs cellular energetics.15,16 Thus, a reductionist focus on single pathways cannot capture the integrated pathobiology of CKD stages G2–G4.
Given this complexity and the documented heterogeneity within eGFR-defined strata, we hypothesize that distinct metabolic endotypes exist among patients with CKD stages G2–G4.
Despite the recognized heterogeneity in CKD G2–G4, no previous study has systematically characterized metabolic endotypes in this specific population using unsupervised clustering of routine laboratory tests. The most relevant prior work includes the comprehensive review by Miguel et al, which summarized metabolic subgroups in early-to-moderate CKD (eGFR ≥45 mL/min/1.73m2) but relied heavily on specialized biomarkers (eg., metabolomics, urinary proteomics) not available in routine practice. Similarly, the CRIC study by Grams et al demonstrated marked heterogeneity in adverse outcomes within narrow eGFR strata, yet used composite endpoints (death, hospitalization, ESKD) rather than focusing specifically on dialysis initiation, and did not generate clinically actionable subgroups based on routine labs. In parallel, widely used clinical prediction tools such as the KDIGO (Kidney Disease: Improving Global Outcomes)risk classification and the Kidney Failure Risk Equation (KFRE) have been developed to estimate CKD progression risk using eGFR, albuminuria, age, and sex. While these tools provide valuable quantitative risk estimates, they are not designed to generate discrete, biologically interpretable subgroups that reflect underlying pathophysiological heterogeneity—a distinction that our endotype-based approach seeks to address. Our study aims to fill these gaps by: (a) focusing exclusively on CKD stages 2–4 (eGFR 15–89 mL/min/1.73m2)—a population with high symptom burden and limited therapeutic options; (b) using only nine routinely available laboratory tests, including D-dimer as a novel clustering variable reflecting inflammation-coagulation crosstalk; and (c) linking endotypes to dialysis initiation as a single, clinically relevant hard endpoint. This pragmatic approach is designed for immediate translatability to routine practice without additional costs or specialized assays.
Finally, we acknowledge the absence of clinical variables such as blood pressure, BMI, diabetes duration, cardiovascular disease history, medication usage, and HbA1c, which are established predictors of CKD progression. We did not include these variables in the clustering algorithm because our goal was to identify metabolic endotypes grounded in pathophysiological pathways rather than to generate a comprehensive prognostic model. However, the lack of these data limits our ability to assess whether the observed endotypes are independent of, or modified by, these clinical factors. Future studies integrating both laboratory and clinical covariates are needed to determine whether combining these data sources improves endotype definition and risk stratification.
Therefore, this study aimed to three main objectives: (1) to identify data-driven metabolic endotypes in a well-characterized cohort of CKD stages G2–G4 patients using unsupervised clustering of routinely available laboratory parameters; (2) to characterize the distinct metabolic signatures of each endotype; and (3) to evaluate the association of these endotypes with the clinical outcome of hemodialysis initiation and verify their predictive value for this outcome.
Methods
This study was rigorously conducted in strict adherence to the STROBE (Strengthening the Reporting of Observational Studies in Epidemiology) statement (for observational studies) and the TRIPOD (Transparent Reporting of a multivariable prediction model for Individual Prognosis Or Diagnosis) statement (for predictive modeling/clustering analysis studies), ensuring transparency and reproducibility in research design, data processing, and statistical analysis.
Study Design and Population
This study was a single-center retrospective cohort study. The subjects were patients with chronic kidney disease stages 2–4 who were treated as outpatients or inpatients in the Department of Nephrology at The Central Hospital of Wuhan from January 2022 to December 2024. Dialysis initiation was defined as the first recorded session of hemodialysis or peritoneal dialysis during the follow-up period (January 2022 to December 31, 2024), as documented in the hospital’s electronic medical records. We acknowledge that dialysis initiation may be influenced by non-biological factors including physician decision-making, patient preference, socioeconomic status, healthcare accessibility, and regional practice variations. As these factors are inherent to retrospective clinical study designs and could not be fully captured or adjusted for in the present analysis, the absolute dialysis rates across endotypes should be interpreted with caution. For patients who initiated dialysis during the study period, the time from study enrollment (first laboratory assessment) to dialysis initiation was calculated based on the date of the first dialysis session recorded in the electronic medical record. For patients who did not initiate dialysis, exact follow-up durations were not consistently available in the retrospective dataset.
Eligible patients were aged ≥ 18 years with confirmed CKD duration ≥ 3 months, eGFR between 15 and 90 mL/min/1.73 m2 (corresponding to CKD stages G2–G4 per the 2024 KDIGO guidelines),2 and complete records for all nine laboratory parameters. Exclusion criteria were: (1) acute kidney injury; (2) malignancy; (3) prior renal replacement therapy; (4) severe liver disease (Child-Pugh class C), severe infection, or active autoimmune disease; and (5) clinical data missing rate >10% that could not be reasonably supplemented. No patients were excluded for these reasons, as data on muscle mass, cystatin C, dietary purine intake, and alcohol consumption were not systematically recorded in the retrospective electronic medical records and therefore could not be assessed.
Sample Size Estimation
Sample size was determined following established guidelines for cluster analysis. First, the rule of thumb that the total sample size should be at least 5–10 times the number of clustering variables was applied—with 9 variables, this yielded a minimum requirement of 45–90 cases.17 Second, to ensure adequate stability for subgroup comparisons, a minimum of approximately 20 cases per subgroup was considered. Based on these considerations, we enrolled 439 patients, substantially exceeding both the variable-derived minimum (45–90) and the per-subgroup requirement (≥80 for 4 subgroups), thereby ensuring stable clustering and reliable intergroup comparisons.
Ethics and Data Management
This study was approved by the Medical Ethics Committee of The Central Hospital of Wuhan (Ethics Approval No.: WHZXKYL-2024-115). As a retrospective study, informed consent from participants was waived. All research data were extracted from the hospital’s Electronic Medical Record (EMR) system and Laboratory Information System (LIS). Data underwent anonymization (removal of identifiable information such as names, ID numbers, and contact details, replaced with unique codes), stored on encrypted servers, and strictly adhered to the Guidelines for Data Security in Healthcare Institutions. Data were used exclusively for this study.
Variable Selection and Data Processing
Variable Selection and Basis
Nine laboratory indicators were selected a priori as input variables for clustering, based on their established roles in the core pathophysiological pathways of CKD stages G2–G4—namely metabolic dysfunction, inflammation, CKD-MBD, and the malnutrition-inflammation-anemia complex1,2,8,9,11,12—and on their availability in routine clinical practice. These indicators reflect baseline test results obtained at enrollment or within the preceding month, before any targeted interventions (eg., urate-lowering drugs, phosphate binders, or nutritional support). Albuminuria was excluded due to a 36.8% missing rate, which would have introduced severe selection bias if included.
- Estimated glomerular filtration rate (eGFR), calculated using the 2021 CKD-EPI creatinine equation, served as the primary indicator of global renal function and defined CKD stages G2–G4 (CKD Stage 2–4 (eGFR 15–89 mL/min/1.73m2));2
- Uric acid (UA) was included as a marker of purine metabolism and oxidative stress, with evidence linking it to NLRP3 inflammasome activation and renal fibrosis;8,16
- Total cholesterol (TC) and fasting glucose (GLU) reflected dysregulated lipid and glucose metabolism, central to the “metabolic crossroads” of insulin resistance and the reverse epidemiology (“lipid paradox”) observed in CKD stages G2–G4;8,9,13,14
- Serum phosphate (P) and intact parathyroid hormone (PTH) represented key components of the CKD-MBD axis, associated with vascular calcification and bone disorders;2,10
- Albumin (ALB) and hemoglobin (Hb) were selected as integrated markers of the malnutrition-inflammation-anemia syndrome, strongly predictive of mortality in CKD populations;11,12
- D-dimer was included as an indicator of chronic prothrombotic inflammation and endothelial dysfunction.8
While clinical variables such as blood pressure, BMI, diabetes duration, cardiovascular disease history, medication usage, and HbA1c are important predictors of CKD progression, we deliberately excluded them from the clustering algorithm for the following reasons. First, our objective was to identify metabolic endotypes based on pathophysiological pathways (CKD-MBD, malnutrition-inflammation-anemia, and glycolipid-uric acid dysregulation), rather than to build a comprehensive clinical prediction model. Including heterogeneous clinical covariates—such as comorbidities or treatment history—would risk producing “comorbidity phenotypes” that reflect disease burden rather than underlying metabolic mechanisms. Second, variables like blood pressure, BMI, and medication use are subject to substantial temporal variability and may change dynamically during follow-up, whereas laboratory biomarkers provide more stable reflections of systemic metabolic status at a given time point. Third, while HbA1c is a valuable marker of glycemic control, we used fasting glucose as a more universally available and routinely measured parameter in our clinical setting; the inclusion of HbA1c was limited by a high missing rate (>40%) in the retrospective dataset. Nevertheless, we acknowledge the potential value of these variables and have noted their absence as a limitation; future studies incorporating both laboratory and clinical covariates may further refine endotype definitions and enhance clinical utility. All biomarkers were measured using standardized assays on certified clinical analyzers (eg., Beckman AU5800, Roche Cobas e601), consistent with routine clinical practice.
To assess the robustness of our clustering results to the exclusion of albuminuria, we performed two prespecified sensitivity analyses. First, we repeated the entire K-means clustering procedure (identical nine variables, preprocessing, K=4, and random seed) exclusively in the subset of patients with available urine albumin-to-creatinine ratio (uACR) data (n=304). Second, we applied MICE (Multiple Imputation by Chained Equations)-based multiple imputation (5 imputations) for missing uACR values and repeated clustering with 10 variables (original 9 + imputed uACR) in the full cohort (n=400). The consistency of cluster centroids, endotype-specific metabolic profiles, and dialysis risk gradients was compared with the primary analysis.
Data Preprocessing
Data Preprocessing and Quality Control
Data cleaning: Prior to analysis, the nine variables intended for clustering underwent structured cleaning. All variables were temporarily converted to character format to facilitate uniform formatting: leading and trailing whitespace was removed, mixed Chinese–English punctuation was standardized (eg., commas replaced with decimal points where appropriate), and non-numeric or invalid entries—including symbols such as “–”, “nan”, “unknown”, or other non-quantifiable strings—were identified and excluded. The cleaned variables were then recast as numeric types. Any values that could not be unambiguously interpreted as valid numbers after this process were coded as missing. The proportion of missing data per variable was calculated both before and after cleaning to quantify data loss and assess data quality.
Missing data handling: Missing values arising from the cleaning procedure—or present in the original dataset—were imputed using median-based single imputation. For each variable, the median was computed from its observed (non-missing) values and used to fill missing entries. To enhance clinical plausibility of imputed values, extreme outliers beyond established physiological or laboratory reference ranges (eg., uric acid <100 or >800 μmol/L; serum phosphate <0.3 or >3.0 mmol/L) were first flagged and recoded as missing prior to median calculation. This two-step approach ensured that imputation was based only on clinically credible observations.
Outlier management: Outliers were defined using a dual-criteria strategy combining clinical knowledge and statistical thresholds. First, values falling outside evidence-based clinical reference intervals were classified as clinically implausible and treated as missing. Second, statistical outliers were identified using a modified interquartile range (IQR) rule. The multiplier applied to the IQR was tailored to each variable based on its distributional characteristics and clinical behavior—for instance, 2.5×IQR was used for eGFR and hemoglobin, whereas 1.5×IQR was applied to more tightly distributed markers. All identified outliers (whether clinical or statistical) were conservatively recoded as missing rather than deleted, preserving sample size while preventing distortion of cluster structure. These newly introduced missing values were subsequently incorporated into the same median imputation pipeline.
This conservative approach was chosen to address the concern that some extreme laboratory values may represent clinically meaningful severe CKD cases rather than measurement errors. Recoding rather than deleting ensures that these patients are not excluded from the analysis entirely, while the subsequent median imputation preserves the central tendency of each variable. The physiological reference ranges used for outlier identification were based on established clinical guidelines.2
Data standardization: Given substantial heterogeneity in scale and unit across the nine variables, robust standardization was performed prior to clustering. Specifically, each variable was transformed using the RobustScaler approach, which centers and scales data based on the median and IQR (ie., Zrobust =(X−median)/IQR). This method is less sensitive to residual outliers compared to conventional Z-score standardization and is better suited to real-world clinical datasets with skewed distributions or measurement artifacts. Standardization was implemented using the RobustScaler class from the sklearn.preprocessing module in Python (version 3.14) (scikit-learn v1.4+).
Statistical Analysis
All statistical analyses and visualizations were performed in Python (v3.10+) using pandas, scipy, scikit-learn, matplotlib, and seaborn. Continuous variables were primarily reported as median (interquartile range) due to non-normal distributions and compared across clusters using the Kruskal–Wallis H-test with Bonferroni-corrected Mann–Whitney U-tests for post hoc pairwise comparisons; normally distributed variables (eg., age) were summarized as mean ± SD. Categorical variables were presented as frequency (%) and analyzed by chi-squared test or Fisher’s exact test (with Monte Carlo simulation when needed). A two-sided α = 0.05 was used for all tests. For multiple pairwise comparisons, Bonferroni correction was applied; adjusted P-values are reported where applicable.
Clustering Analysis Procedure
K-means clustering was selected for this study because of its clinical interpretability and computational simplicity. While we acknowledge that K-means assumes spherical clusters, the input space consisted of only nine standardized laboratory variables with low multicollinearity, making the spherical assumption reasonable. More importantly, the quality of the clustering solution was confirmed by convergence across multiple validation metrics (silhouette score, Calinski-Harabasz index, Davies-Bouldin index, and elbow method) and by clear separation of subgroups in principal component analysis (PCA) visualization. K-means has also been successfully applied in previous CKD subtyping studies,8 supporting its suitability for this context.
Unsupervised clustering was performed using the K-means algorithm as implemented in the sklearn.cluster module of Python (scikit-learn v1.4+), with k-means++ initialization, Euclidean distance, a maximum of 300 iterations, 20 random initializations (n_init=20), and a fixed random seed (random_state=42) to ensure reproducibility.
The optimal number of clusters (K) was determined through an integrative framework combining multiple statistical criteria (elbow method, silhouette score, Calinski-Harabasz index, and Davies-Bouldin index) and clinical interpretability. A composite score was derived from these metrics to identify the optimal K, with clinical interpretability prioritized when multiple K values showed comparable statistical support. The final K=4 was selected only after confirming that all resulting subgroups exhibited coherent metabolic profiles and alignment with known pathophysiological mechanisms of late-stage CKD. Detailed descriptions of the clustering metrics and composite scoring are provided in Supplementary Methods S1.
Verification of Cluster Stability
Cluster stability was validated through a combination of algorithm parameter control and dimensionality reduction visualization: a fixed random seed (random_state=42) and multiple centroid initializations (n_init=20) ensured the reproducibility of clustering outcomes and minimized the impact of random factors. In addition, PCA was performed for dimensionality reduction, and the first two principal components explained 39.6% of the total variance, which clearly validated the separation of inter-cluster boundaries with no cross-contamination, confirming the stability and distinctiveness of the identified endotypes.
Bootstrap stability assessment: To quantitatively evaluate the stability of the clustering solution, we performed bootstrap resampling with 500 iterations. In each iteration, a bootstrap sample (with replacement) was drawn from the original dataset, K-means clustering (K=4) was applied, and the Jaccard similarity was calculated between the co-association matrix of the original clustering and that of the bootstrap-derived clustering. Jaccard similarity measures the proportion of patient pairs consistently assigned to the same cluster across bootstrap samples, with values >0.85 indicating high stability, 0.75–0.85 indicating good stability, and <0.75 suggesting moderate to low stability.
Supplementary Analysis
For subgroups with small sample sizes (n<20), robustness validation for inter-group comparisons was performed using the bootstrap method with 1,000 resamples to reduce statistical bias caused by insufficient sample size.Simultaneously, a heatmap of cluster centers will be generated to illustrate the standardized mean values across nine variables for each subgroup, thereby facilitating subtype nomenclature and feature summarization.
Results
Patient Selection and Cohort Overview
Of 439 patients initially screened, 39 were excluded due to acute kidney injury (n = 1), malignancy (n = 3), kidney transplantation (n = 4), or excessive missing data (>10%; n = 31), resulting in a final analytic cohort of 400 patients with eGFR 15–89 mL/min/1.73m2 (Figure 1: Study Flow Diagram). Table 1 presents the baseline clinical and metabolic features, as well as the primary outcome of dialysis initiation, of 400 enrolled patients stratified into four metabolic endotypes (Endotype 1: n=62; Endotype 2: n=128; Endotype 3: n=150; Endotype 4: n=60). The study follow-up lasted from January 2022 to December 31, 2024. Demographically, age and gender distribution exhibited no statistically significant variations across Endotypes (both P>0.05), while smoking status differed modestly (P=0.037), with Endotype 3 showing the lowest smoking rate (6.7%). Clinically, Endotype 2 was predominantly composed of CKD Stage 4 patients (68.8%) and had the highest dialysis rate (59.4%), whereas Endotype 3 was mainly Stage 3 (80.0%) with the lowest dialysis rate (6.7%). Endotype 4 had the highest prevalence of diabetes (76.7%) and corresponding elevated glucose levels (8.49±1.15 mmol/L). Key metabolic biomarkers, including PTH, albumin, hemoglobin, uric acid, phosphorus, and D-dimer, also differed significantly among Endotypes (P<0.05 or P<0.001), with notably elevated PTH levels in Endotype 1 (117.55±48.08 pg/mL).Number of participants with missing data for each variable of interest are shown in Supplementary Table S1. Among the 400 patients, 72 (18.0%) initiated dialysis during the study period. For these patients, the median time from study enrollment to dialysis initiation was 12.0 months (IQR: 8.0–16.0 months; range: 1–27 months).
 |
Table 1 Baseline Characteristics of the Study Cohort Stratified by Final Metabolic Endotype |
 |
Figure 1 Study flow diagram of patient selection and analytic cohort derivation. |
Determination of the Optimal Clustering Solution
Unsupervised K-means clustering on nine standardized laboratory variables initially yielded four subgroups, with patient counts of 62, 128, 150, and 60, respectively (Figure 2: Cluster Size Distribution). To determine the optimal number of clusters, we evaluated multiple validation metrics: the silhouette score peaked at K = 4 (mean = 0.17), the elbow method showed a clear inflection point, and complementary indices (Calinski–Harabasz and Davies–Bouldin) supported this solution (Figure 3: Cluster Validation Metrics).
 |
Figure 2 Distribution of patients across the four metabolic endotypes identified by unsupervised clustering. |
 |
Figure 3 Cluster validation metrics supporting the selection of K = 4 as the optimal number of clusters. |
Clinical Filtering and Final Endotype Definition
Cluster analysis yielded four statistically optimal clusters, which were subsequently termed metabolic endotypes and all retained for further analysis, given their consistency with the study’s inclusion criteria (CKD Stage 2–4, eGFR 15–89 mL/min/1.73m2). Among them, Endotype 2 (n=150) exhibited a median eGFR of 50.07±15.53 mL/min/1.73m2, falling within the CKD Stage 3a range (45–59 mL/min/1.73m2) and thus fully compliant with the study’s enrollment scope. Retention of this subgroup was critical to capturing the full metabolic heterogeneity of the CKD stages G2–G4 cohort, as it represents a distinct subset with relatively preserved renal function. The four endotypes (total n=400) displayed non-overlapping biochemical profiles, laying the foundation for subsequent phenotypic and prognostic analyses.
Demographic and Confounding Assessment
Age distributions did not differ significantly across the four preliminary clusters (mean range: 65.2–67.9 years; p = 0.243; Figure 4). Figure 4 further confirmed that age distribution was comparable across endotypes, ruling out age as a confounding factor for cluster assignment.Furthermore, a scatter plot of age versus eGFR revealed no systematic clustering by demographic factors, suggesting that metabolic heterogeneity is independent of chronological age (Figure 5).
 |
Figure 4 Age distribution across the four preliminary metabolic endotypes. |
 |
Figure 5 Scatter plot of age versus estimated glomerular filtration rate, colored by metabolic endotype. |
Distinct Metabolic Signatures of the Four Endotypes
The four retained endotypes exhibited stark differences across all nine input variables (all P<0.001, Kruskal–Wallis test; Figure 6). Their distinct metabolic signatures were as follows:Inflammatory-hypercoagulable endotype (Endotype 1, n=62): characterized by the highest D-dimer (1.88 mg/L FEU) and relatively low serum albumin (32.97 g/L)—the core basis for naming—reflecting a prothrombotic and inflammatory phenotype.Severe CKD-MBD-anemia endotype (Endotype 2, n=128): Presented with the highest parathyroid hormone (PTH, 117.55 pg/mL), lowest estimated glomerular filtration rate (eGFR, 24.25 mL/min/1.73m2), and lowest hemoglobin (97.34 g/L) — the core basis for naming one disorder and malnutrition-anemia syndrome.Metabolically favorable endotype (Endotype 3, n=150): Showed the highest eGFR (50.07 mL/min/1.73m2, consistent with CKD Stage 3a), albumin (40.83 g/L), and hemoglobin (126.37 g/L), along with the lowest D-dimer (0.42 mg/L FEU) — the core basis for naming renal function. Glycolipid-uric acid dysregulation endotype (Endotype 4, n=60): displayed the highest uric acid (390.17 μmol/L), fasting glucose (8.49 mmol/L), and serum phosphorus (1.20 mmol/L)—the core basis for naming—indicating concurrent dysglycemia, hyperuricemia, and dysphosphatemia.
 |
Figure 6 Variable-wise boxplots showing the distribution of nine core metabolic indicators across the four metabolic endotypes. |
These characteristic patterns were intuitively captured by a radar chart displaying median values on the original scale (Figure 7). Principal component analysis further confirmed robust separation of the four endotypes in reduced-dimensional space, with the first two components explaining 39.6% of the total variance and distinct delineation of cluster centers (Figure 8).
 |
Figure 7 Radar chart depicting the metabolic profile of the four clinically retained endotypes. |
 |
Figure 8 Principal component analysis (PCA) of the four final metabolic endotypes. |
Analytical Robustness and Feature Independence
A correlation heatmap of the nine input variables demonstrated low multicollinearity, with the majority of pairwise Spearman correlation coefficients below |0.5| (Figure 9). This supports the suitability of these features for multivariate clustering without substantial redundancy.
 |
Figure 9 Spearman correlation heatmap of the nine variables used in clustering. |
Clinical Outcomes by Endotype
The incidence of dialysis initiation during follow-up differed significantly across the four metabolic endotypes (Table 1): Inflammatory-hypercoagulable endotype (Endotype 1), 38.7%; Severe CKD-MBD-anemia endotype (Endotype 2), 59.4% (highest, P < 0.001 vs. all other endotypes); Metabolically favorable endotype (Endotype 3), 6.7% (lowest, P < 0.001 vs. all other endotypes); and Glycolipid-uric acid dysregulation endotype (Endotype 4), 46.7%. The Metabolically favorable endotype (Endotype 3, n=150) exhibited the lowest dialysis initiation rate (6.7%) and was therefore designated as the reference group (Odds Ratio [OR] = 1.00). In contrast, the Severe CKD-MBD-anemia endotype (Endotype 2, n=128) had the highest dialysis risk, with a dialysis rate of 59.4% and an OR of 20.46 (95% CI: 9.84–42.55) compared to the reference group. The Glycolipid-uric acid dysregulation endotype (Endotype 4, n=60) showed an intermediate dialysis rate (46.7%) and a significantly elevated relative risk (OR = 12.25, 95% CI: 5.41–27.75). The Inflammatory-hypercoagulable endotype (Endotype 1, n=62) had a dialysis rate of 38.7% and an OR of 8.84 (95% CI: 3.89–20.08), indicating a substantially higher risk than the Metabolically favorable endotype. These findings confirm that metabolic endotypes identified by unsupervised clustering effectively stratify dialysis risk in CKD G2–G4 patients, with the Severe CKD-MBD-anemia endotype representing the highest-risk subgroup and the Metabolically favorable endotype the lowest-risk subgroup.
Predictive Performance of Metabolic Endotypes for Dialysis Initiation
To rigorously evaluate the discriminative ability of the identified metabolic endotypes, we constructed a multivariable logistic regression model with dialysis initiation as the dependent variable, incorporating age, gender, eGFR, and metabolic endotype as categorical predictors (with the Metabolically favorable endotype as the reference group). Predicted probabilities derived from this model were used to generate the ROC curve. The model achieved an AUC of 0.838 (95% CI: 0.762–0.915) on the validation set (Figure 10), indicating good discriminative performance. At the optimal threshold, sensitivity was 94.6% and specificity was 69.4%. The overall model was highly significant (Wald χ2 = 18.6, p < 0.001), confirming that metabolic endotype contributes independently to the prediction of dialysis initiation beyond conventional risk factors. 3.9 Sensitivity Analysis for Albuminuria Exclusion.
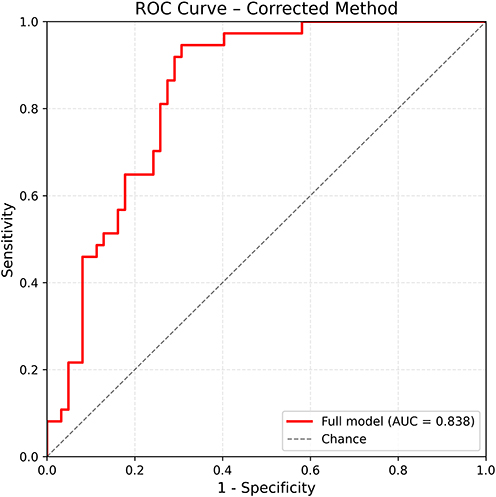 |
Figure 10 Receiver operating characteristic (ROC) curve for metabolic endotypes predicting dialysis initiation. |
To evaluate whether the exclusion of patients with missing uACR data introduced selection bias, we performed two sensitivity analyses. First, in the uACR-available subcohort (n=304, 76.0% of the original cohort), the four-cluster solution was reproduced with consistent metabolic heterogeneity. The dialysis risk gradient remained evident: the highest-risk endotype showed a dialysis rate of 66.7%, while the lowest-risk endotypes showed 0% (Supplementary Table S2). Second, after MICE-based multiple imputation of missing uACR values and clustering with 10 variables (original 9 + imputed uACR) in the full cohort (n=400), the four-endotype structure was preserved, and the dialysis risk stratification remained essentially unchanged, with the high-risk endotype showing a dialysis rate of 66.7% and the low-risk endotypes showing 0% (Supplementary Table S3. Furthermore, comparison of baseline characteristics between patients with and without uACR data revealed no significant differences in age, eGFR, or diabetes prevalence (all p>0.05), suggesting that uACR data were missing largely at random. These findings indicate that the exclusion of uACR-missing patients did not substantially distort the clustering structure or the identification of key endotypes.
Bootstrap Cluster Stability
To quantitatively assess the stability of the four-cluster solution, we performed bootstrap resampling with 500 iterations. The mean Jaccard similarity between bootstrap-derived and original cluster assignments was 0.903 (95% CI: 0.673–0.989), indicating high stability of the clustering solution. This confirms that the identified metabolic endotypes are robust to random sampling variations and not an artifact of the specific dataset.
Discussion
In a retrospective cohort of 400 Chinese patients with CKD stages G2–G4, unsupervised K-means clustering of nine routinely measured clinical laboratory variables identified four distinct metabolic endotypes with clear biochemical signatures. Although clustering is inherently exploratory, the four-cluster solution was supported by convergence across multiple validation metrics, low pairwise correlations among input variables, and reproducibility in sensitivity analyses. Importantly, cluster assignment was not confounded by age, and subgroup separation reflected biochemical rather than demographic patterns. We acknowledge that the silhouette score was modest, reflecting the inherent complexity and continuum of clinical CKD data. However, additional lines of evidence—including algorithmic stability, clear PCA-based cluster separation, consistent reproducibility in sensitivity analyses, and coherent biological mapping with significantly different dialysis rates across endotypes—collectively support the validity of the clustering solution. This stability was further quantified by bootstrap resampling, which yielded a mean Jaccard similarity of 0.903 (95% CI: 0.673–0.989), indicating high stability. The modest variance explained by the first two principal components reflects the inherent multi-dimensionality of clinical CKD data and does not undermine the robustness of the four-endotype structure.
We acknowledge that the cluster names used in this study are descriptive labels based on the dominant biochemical features of each subgroup, and should not be interpreted as validated mechanistic designations. While the clustering variables were selected based on established pathophysiological pathways, we did not perform mechanistic validation (eg., cytokine profiling, genetic studies, or functional experiments) to confirm the underlying biology. Future studies incorporating such mechanistic approaches will be valuable to validate the biological distinctness of these endotypes. The characteristics of these subgroups align with patterns previously described in CKD. Endotype 2, defined by the lowest eGFR, lowest hemoglobin, and highest PTH, reflects a constellation commonly observed in CKD stages G2–G4, where progressive nephron loss leads to impaired erythropoietin production and dysregulation of mineral metabolism.2,18,19 Notably, while many prior risk prediction models for kidney failure rely heavily on eGFR and albuminuria alone,20,21 our findings demonstrate that even among patients with similarly low eGFR (<45 mL/min/1.73m2), heterogeneity in systemic metabolic parameters further stratifies dialysis risk—suggesting that conventional staging may overlook important biological variation. Our findings are consistent with classical descriptions of CKD-MBD and renal anemia in advanced CKD,2,10,18,19 confirming that the combination of low eGFR, low hemoglobin, and elevated PTH identifies a high-risk population. However, our results extend these observations by demonstrating that patients with this metabolic signature experience dialysis rates substantially higher than other groups with similar eGFR. This suggests that the concurrent presence of these metabolic disturbances confers risk beyond what would be predicted by eGFR alone—an aspect not captured by conventional staging systems that focus primarily on kidney function.
The higher incidence of dialysis in Endotype 2 is consistent with its more severely reduced kidney function at baseline. In contrast, Endotype 1 was characterized by elevated D-dimer and low serum albumin—features associated with systemic inflammation, malnutrition, and hypercoagulability in CKD populations.22,23 Although these patients had relatively preserved eGFR compared to Endotype 2, their distinct metabolic milieu may reflect a different pathway of disease progression. This observation contrasts with several large cohort studies in which inflammatory markers (eg., CRP, IL-6) were strong predictors of all-cause mortality but showed weaker or inconsistent associations with ESKD.24,25 Our data reinforce the notion that the drivers of kidney failure requiring dialysis may differ from those of death in CKD—a distinction often obscured when studies use composite endpoints.
Endotype 1 (inflammatory-hypercoagulable) warrants particular attention. Despite relatively preserved eGFR, this group exhibited an intermediate dialysis rate—substantially higher than the metabolically favorable endotype but lower than the severe CKD‑MBD‑anemia endotype. This observation raises a critical question: does this elevated risk merely reflect a higher burden of comorbidities, or does it suggest a unique progression pathway less dependent on eGFR decline?
We propose two non‑mutually exclusive mechanistic explanations. First, the combination of elevated D‑dimer (1.88 mg/L) and hypoalbuminemia (32.97 g/L) is consistent with a chronic low‑grade inflammatory and prothrombotic state that may promote renal fibrosis and microvascular injury through pathways partially independent of GFR decline. D‑dimer, as a marker of coagulation‑fibrinolysis activation, has been independently associated with kidney function deterioration and ESKD risk in several cohort studies.22,23 Suggesting that endothelial dysfunction and microthrombosis may accelerate the transition to dialysis even when baseline renal function is not severely compromised. Second, the biochemical signature of Endotype 1—low albumin, elevated D‑dimer, relatively preserved eGFR—aligns with the “malnutrition‑inflammation‑atherosclerosis” syndrome described in CKD populations,11,12 where systemic inflammation and poor nutritional status act synergistically to drive disease progression. This pattern does not simply mirror a generic “high comorbidity” phenotype; rather, it suggests a distinct pathophysiology in which inflammatory and coagulatory disturbances contribute to ESKD risk independently of traditional GFR‑based staging.
Comparison with previously described CKD endotypes further contextualizes our findings. Miguel et al8 identified an “inflammatory” subgroup in early‑to‑moderate CKD (eGFR ≥45 mL/min/1.73m2), characterized by elevated CRP and IL‑6, which shares some features with our Endotype 1. However, our definition—relying on D‑dimer and albumin rather than CRP or IL‑6—captures a prothrombotic‑inflammatory axis that has not been previously emphasized in CKD subtyping. This distinction is clinically relevant because D‑dimer is routinely measured in many clinical settings and may serve as a readily available marker of this high‑risk inflammatory phenotype.
Notably, unlike previous subtyping efforts that relied on specialized biomarkers (eg., urinary proteomics, metabolomics) or broad composite outcomes, our endotypes are derived entirely from routine laboratory tests—offering a pragmatic framework for clinical translation. The identification of Endotype 1 as a distinct entity, with intermediate dialysis risk but relatively preserved eGFR, underscores the limitation of eGFR‑based staging alone and highlights that inflammatory‑coagulation pathways warrant specific attention in risk stratification, even in patients not yet presenting with advanced renal dysfunction. This finding also has potential implications for clinical trial enrichment: patients with Endotype 1 may be particularly suitable for trials evaluating anti‑inflammatory or anticoagulant interventions, as they represent a biologically coherent subgroup with elevated risk not fully captured by renal function alone.
Endotype 3 represents a low-risk subgroup within the CKD stages 2–4 cohort, predominantly comprising patients at CKD stage 3a (80.0%). Its core characteristics include relatively preserved renal function and favorable metabolic homeostasis—high albumin and hemoglobin levels indicate good nutritional status, while low D-dimer levels indicate mild chronic inflammation and endothelial injury. The identification of this subtype fills a gap in the CKD Stage 3a sub-stratification research, clarifying the low progression risk in patients with moderate renal function but well-controlled metabolism. This aligns with existing research demonstrating that inflammation control and nutritional optimization can delay CKD progression,26,27 and extends these findings by providing a distinct, clinically recognizable metabolic signature—the combination of preserved renal function, good nutritional status, and low inflammation—that identifies a low-risk subgroup within the G2–G4 spectrum. This integrated signature may offer a more practical tool for identifying patients suitable for conservative monitoring than individual markers alone.
Endotype 4 exhibited concurrent elevations in uric acid, glucose, and phosphate, a combination that has been linked to insulin resistance and altered renal handling of solutes in observational studies.28–30 The intermediate dialysis risk in this group suggests that metabolic factors beyond eGFR continue to influence disease trajectory even when kidney function is already substantially reduced. While hyperuricemia and dysglycemia have been implicated in CKD progression in earlier stages, their role in CKD stages G2–G4 remains less clear. Our findings are consistent with prior work linking these metabolic disturbances to CKD progression;28–30 however, previous studies have primarily focused on early-to-moderate CKD (eGFR ≥45 mL/min/1.73m2),8 whereas our results demonstrate that this metabolic phenotype persists and remains clinically relevant even in late-stage disease. This identification of a distinct subgroup with an intermediate dialysis risk highlights that such factors may still contribute to heterogeneity in advanced CKD, potentially identifying candidates for targeted metabolic interventions—a hypothesis that warrants prospective testing.
The metabolic endotypes identified in our study exhibited robust predictive performance for dialysis initiation. This performance outperforms traditional eGFR-based staging, which often fails to distinguish high-risk from low-risk patients within the same eGFR stratum.3,4 The high sensitivity ensures that most patients at risk of dialysis initiation are correctly identified, while the moderate-to-high specificity minimizes unnecessary intensification of monitoring or interventions for low-risk individuals. If validated in prospective cohorts, such predictive capacity could eventually assist clinicians in prioritizing resources for high-risk subgroups (eg., Endotype 2) and adopting a more conservative approach for low-risk patients (eg., Endotype 3). Importantly, this predictive value is derived from routinely available laboratory tests, further enhancing the translatability of our endotype framework to real-world clinical practice. We emphasize that the AUC analysis was intended as a secondary validation of the clinical relevance of the identified endotypes, not as the development of a standalone clinical prediction model. Formal calibration analyses—including calibration plots, Brier scores, and decision curve analysis—are best suited for validated prediction models intended for clinical deployment. Our study, by contrast, is exploratory and focused on endotype discovery. Such calibration assessments would be premature at this stage but represent a valuable direction for future prospective studies with larger, multi-center cohorts.
We also formally evaluated the incremental predictive value of metabolic endotypes beyond eGFR alone using net reclassification improvement (NRI) and integrated discrimination improvement (IDI). No statistically significant improvement was observed (NRI = 0.032, 95% CI: −0.083 to 0.145; IDI = −0.003, 95% CI: −0.014 to 0.010; ΔAUC = +0.002, 95% CI: −0.010 to 0.019). This suggests that eGFR remains the dominant short-term predictor of dialysis initiation in advanced CKD. The primary value of our endotype framework, therefore, lies not in short-term risk reclassification but in identifying biologically distinct subgroups that may inform mechanistic understanding and hypothesis generation for targeted interventions.
A strength of our approach is its reliance on laboratory tests that are routinely ordered in the clinical management of CKD—eGFR, hemoglobin, albumin, PTH, phosphate, uric acid, glucose, D-dimer, and total cholesterol. This contrasts with emerging subtyping strategies that depend on specialized assays (eg., urinary proteomics or metabolomics), which remain largely confined to research settings. While our variables lack mechanistic specificity, their ubiquity means that a similar clustering could, in principle, be replicated using electronic health records from diverse healthcare systems. That said, we acknowledge that D-dimer is not universally measured in stable CKD outpatients; its inclusion may limit generalizability in settings where it is reserved for acute thrombotic evaluation.
Our identification of four metabolically distinct endotypes in CKD stages G2–G4 aligns with and extends the findings of previous CKD subtyping studies, while addressing key gaps in clinical applicability.
First, Miguel et al8 systematically summarized metabolic subgroups in early-to-moderate CKD (eGFR ≥45 mL/min/1.73m2), highlighting inflammation, fibrosis, and metabolic dysfunction as core clustering axes. However, their work focused on patients with relatively preserved renal function, where disease progression is slower and therapeutic windows are broader. In contrast, our study targets CKD stages G2–G4 (eGFR 15–89 mL/min/1.73m2), a population with higher comorbidity burden, faster progression risk, and unmet needs for precise risk stratification. By including patients with eGFR as low as 15 mL/min/1.73m2, we captured endotypes linked to severe CKD-MBD, advanced malnutrition-anemia, and progressive metabolic dysregulation — phenotypes rarely emphasized in early CKD subtyping. This extension is critical, as CKD stages G2–G4 patients are at the highest risk of transitioning to ESKD but lack tailored risk assessment tools.
Second, Grams et al4 utilized the Chronic Renal Insufficiency Cohort (CRIC) to demonstrate marked heterogeneity in adverse outcomes within narrow eGFR strata of CKD stages G2–G4. Their study underscored the inadequacy of eGFR alone for risk stratification but relied on composite endpoints (death, hospitalization, ESKD) and a broad set of demographic and clinical covariates, limiting direct translation to routine practice. In contrast, our approach employs only nine routinely available laboratory biomarkers — all part of standard CKD follow-up panels — and focuses on dialysis initiation, a hard endpoint directly relevant to clinical decision-making. The pragmatism of our variable selection eliminates the need for specialized assays (eg., urinary proteomics, metabolomics) or complex data integration, making our endotype-based stratification feasible in primary care and resource-limited settings.
In parallel, several recent studies have applied machine learning approaches to predict CKD progression. Duong et al demonstrated that LightGBM and Random Forest models could predict 1‑year eGFR decline in CKD stages 3–5 with AUCs of 0.76–0.82 using routine laboratory variables.31 The Klinrisk machine learning model, validated in a large US population, achieved AUCs of 0.80–0.87 for 2‑year CKD progression and outperformed the standard KDIGO risk stratification system.32 While these studies focus on generating continuous risk scores or binary predictions, our approach differs by producing discrete, biologically interpretable metabolic endotypes—complementary to, rather than competing with, these ML‑based risk prediction tools.
Notably, both studies confirm that metabolic heterogeneity contributes independently to outcome variation beyond eGFR. However, our work advances this field by providing a clinically actionable framework: the four endotypes we identified map to distinct pathophysiological pathways (inflammation-coagulation, CKD-MBD-anemia, metabolic homeostasis, glycolipid-uric acid dysregulation) that are directly targetable by existing interventions. Such predictive capacity is clinically meaningful: it enables clinicians to prioritize resources for high-risk subgroups (eg., Endotype 2) and adopt a more conservative approach for low-risk patients (eg., Endotype 3).
Importantly, given the exploratory nature of this single‑center retrospective study, all interpretations regarding clinical implications should be viewed as hypothesis‑generating rather than practice‑changing. Based on the core pathophysiological features and dialysis risk stratification of each metabolic endotype, we offer preliminary, hypothesis‑generating considerations for potential clinical management approaches. These considerations are broadly aligned with established principles of CKD management,2,10,28 but we emphasize that they are not derived from treatment response data and require prospective validation in interventional studies before any clinical application can be considered (Supplementary Table S4).
Several limitations merit acknowledgment. First and most importantly, the exclusion of albuminuria (uACR) due to a 36.8% missing rate in our retrospective EMR dataset represents a core limitation of this study. Albuminuria is a cornerstone of KDIGO risk stratification, and its absence precludes direct comparison of our endotype-based model with established risk categories and may influence the clustering solution itself. To address this, we performed two sensitivity analyses: (i) re-clustering in the uACR-available subcohort (n=304), and (ii) multiple imputation of missing uACR followed by 10-variable clustering. Both analyses confirmed the stability of the four-endotype structure and the dialysis risk gradient (Supplementary Tables S3 and S4). Comparison of patients with and without uACR data revealed no significant differences in age, eGFR, or diabetes prevalence (all p>0.05), suggesting missingness at random. Nonetheless, we cannot entirely rule out residual selection bias, and future prospective studies with complete albuminuria data are essential to validate our endotype framework and to examine whether adding albuminuria improves or refines the clustering solution.
Second, this was a retrospective, single-center cohort; thus, the generalizability of these endotypes requires validation in independent, multi-ethnic populations.
Third, dialysis initiation—while a hard clinical endpoint—is influenced by non-biological factors including physician decision-making, patient preference, socioeconomic status, healthcare accessibility, and regional practice variation, which we could not fully adjust for and may have influenced the observed dialysis rates Future studies should consider incorporating objective, biologically driven endpoints such as sustained ≥40% decline in eGFR from baseline, rapid eGFR slope (eg., >5 mL/min/1.73m2 per year), or time to ESKD, which are less susceptible to practice pattern variations and may provide a more direct measure of disease progression.
Fourth, laboratory values were assessed at a single time point, precluding assessment of endotype stability or transitions over time.
Fifth, we lacked data on key covariates such as glycemic control (eg., HbA1c) and use of kidney-protective medications (eg., SGLT2 inhibitors, RAAS blockers), which may confound the observed associations.
Finally, we acknowledge the absence of clinical variables such as blood pressure, BMI, diabetes duration, cardiovascular disease history, medication usage, and HbA1c, which are established predictors of CKD progression. We did not include these variables in the clustering algorithm because our goal was to identify metabolic endotypes grounded in pathophysiological pathways rather than to generate a comprehensive prognostic model. However, the lack of these data limits our ability to assess whether the observed endotypes are independent of, or modified by, these clinical factors. Future studies integrating both laboratory and clinical covariates are needed to determine whether combining these data sources improves endotype definition and risk stratification.
Nonetheless, our findings suggest that metabolic heterogeneity persists even in CKD stages G2–G4 and is linked to differential risks of kidney failure requiring dialysis. Rather than proposing a new classification system, we view these endotypes as a pragmatic, lab-based framework that may assist in risk stratification at this proof‑of‑concept stage. Future prospective studies are needed to examine whether these subgroups predict trajectories of eGFR decline, response to specific therapies, or non-renal outcomes. If confirmed in larger cohorts, such an approach might offer a hypothesis-generating framework for future trial design considerations—for example, by potentially informing the selection of Endotype 4 patients for exploratory analyses in trials of urate-lowering or insulin-sensitizing agents. However, such applications remain speculative and would require dedicated prospective studies.
While K-means clustering was selected for its interpretability and precedent in CKD subtyping, we acknowledge that evaluating alternative clustering approaches (eg., hierarchical clustering, Gaussian mixture models, spectral clustering, consensus clustering) would further strengthen robustness. Future studies may apply these methods to confirm the generalizability of our endotype framework.
We acknowledge that the absence of precise time-to-dialysis data precluded Cox proportional hazards survival analysis and therefore we were unable to provide hazard ratios for each endotype. While we performed multivariable logistic regression adjusting for age, gender, and eGFR as an alternative, and provided odds ratios with 95% confidence intervals in Table 2 as a measure of relative risk, we recognize that hazard ratios would provide a more robust quantification of clinical risk differences. Future prospective studies with complete time-to-event data should apply Cox regression to further validate the independent prognostic value of these endotypes.
 |
Table 2 Dialysis Initiation Rates and Relative Risks of Metabolic Endotypes in Patients with CKD Stages 2–4 |
We acknowledge that eGFR was estimated using the creatinine-based CKD-EPI equation without cystatin C confirmation, and muscle mass was not assessed. While the CKD-EPI equation is the standard KDIGO-recommended approach, we cannot exclude the possibility of bias in patients with extremes of muscle mass. However, such cases are unlikely to have substantially affected the overall clustering results given the sample size and the fact that eGFR was used alongside eight other metabolic biomarkers in the clustering algorithm.
Conclusion
In this single‑center retrospective cohort of patients with CKD stages G2–G4, unsupervised K‑means clustering of nine routinely available laboratory tests preliminarily identified four metabolically distinct endotypes associated with substantially different risks of dialysis initiation. These endotypes reflect divergent pathophysiological patterns not captured by traditional eGFR‑based staging. Since the input variables are universally available in routine clinical practice, this pragmatic approach provides a preliminary framework for risk stratification and future precision medicine research. However, given the single‑center retrospective design, its generalizability and clinical utility await confirmation in large, prospective, multi‑ethnic, and multi‑center cohorts before clinical implementation can be considered. Future research should also explore associations with other clinical outcomes (eg., eGFR decline rate, cardiovascular events) and examine the stability of these endotypes over time.
Data Sharing Statement
The data that support the findings of this study are available on request from the corresponding author. The data are not publicly available due to privacy or ethical restrictions.
Ethics Approval and Consent to Participate
This study was approved by the Medical Ethics Committee of The Central Hospital of Wuhan (Ethics Approval No.: WHZXKYL-2024-115).
Acknowledgments
We thank the nephrology and laboratory teams at The Central Hospital of Wuhan for facilitating access to clinical data. We also acknowledge the patients whose anonymized records enabled this research.
Author Contributions
All authors made a significant contribution to the work reported, whether that is in the conception, study design, execution, acquisition of data, analysis and interpretation, or in all these areas; took part in drafting, revising or critically reviewing the article; gave final approval of the version to be published; have agreed on the journal to which the article has been submitted; and agree to be accountable for all aspects of the work.
Funding
No funding was received for this research.
Disclosure
The authors declare that they have no competing interests in this work.
References
1. Bikbov B, Purcell CA, Levey AS, et al. Global, regional, and national burden of chronic kidney disease, 1990–2017: a systematic analysis for the global burden of disease study 2017. Lancet. 2020;395(10225):709–22. doi:10.1016/S0140-6736(20)30045-3
2. Stevens PE, Ahmed SB, Carrero JJ, et al. KDIGO 2024 clinical practice guideline for the evaluation and management of chronic kidney disease. Kidney Int. 2024;105(4):S117–314.
3. Van Der Burgh AC, Sedaghat S, Ikram MA, Hoorn EJ, Chaker L. Trajectories of kidney function and risk of mortality. Int J Epidemiol. 2023;52(6):1959–1967. doi:10.1093/ije/dyad111
4. Grams ME, Yang W, Rebholz CM, et al. Risks of adverse events in advanced CKD: the chronic renal insufficiency cohort (CRIC) study. Am J Kidney Dis. 2017;70(3):337–346. doi:10.1053/j.ajkd.2017.01.050
5. Genkel VV, Shaposhnik II. Conceptualization of heterogeneity of chronic diseases and atherosclerosis as a pathway to precision medicine: endophenotype, endotype, and residual cardiovascular risk. Int. J. Chronic Dis. 2020;2020:1–9. doi:10.1155/2020/5950813
6. Lötvall J, Akdis CA, Bacharier LB, et al. Asthma endotypes: a new approach to classification of disease entities within the asthma syndrome. J Allergy Clin Immunol. 2011;127(2):355–360. doi:10.1016/j.jaci.2010.11.037
7. Woodruff PG, Agusti A, Roche N, Singh D, Martinez FJ. Current concepts in targeting chronic obstructive pulmonary disease pharmacotherapy: making progress towards personalised management. Lancet. 2015;385(9979):1789–1798. doi:10.1016/S0140-6736(15)60693-6
8. Miguel V, Shaw IW, Kramann R. Metabolism at the crossroads of inflammation and fibrosis in chronic kidney disease. Nat Rev Nephrol. 2025;21(1):39–56. doi:10.1038/s41581-024-00889-z
9. Moritz L, Schumann A, Pohl M, Köttgen A, Hannibal L, Spiekerkoetter U. A systematic review of metabolomic findings in adult and pediatric renal disease. Clin. Biochem. 123:110703. 10.1016/j.clinbiochem.2023.110703
10. Malluche HH, Qiao Q, Chen J, Issa M, Lima F. Presence and progression of changes in bone mass, bone quality, and vascular calcifications in patients with moderate to advanced reduction in kidney function: TH-PO158. J Am Soc Nephrol. 2024;35(10S). doi:10.1681/ASN.2024ny9zwzyq
11. Molnar MZ, Czira ME, Rudas A, et al. Association between the malnutrition-inflammation score and post-transplant anaemia. Nephrol Dial Transplant. 2011;26(6):2000–2006. doi:10.1093/ndt/gfq690
12. Kalantar-Zadeh K, Block G, McAllister CJ, Humphreys MH, Kopple JD. Appetite and inflammation, nutrition, anemia, and clinical outcome in hemodialysis patients. Am. J. Clin. Nutr. 2004;80(2):299–307. doi:10.1093/ajcn/80.2.299
13. Thurmann KE, Mukherjee TG, White MD. Inflammation-driven lipid suppression in hospitalized patients: insights into the inflammatory lipid paradox from a retrospective study. Cureus. 2025;17(8):e89488. doi:10.7759/cureus.89488
14. Saadati S, Godini R, Reddy A, Teede H, Mousa A. Metabolic crossroads in insulin resistance: exploring lipid dysregulation and inflammation. Front Immunol. 2025;16:1692742. doi:10.3389/fimmu.2025.1692742
15. Chung YJ, Swietach P, Curtis MK, Ball V, Robbins PA, Lakhal-Littleton S. Iron-deficiency anemia results in transcriptional and metabolic remodeling in the heart toward a glycolytic phenotype. Front Cardiovasc Med. 2020;7:616920. doi:10.3389/fcvm.2020.616920
16. Zhou X, Ji S, Chen L, et al. Gut microbiota dysbiosis in hyperuricaemia promotes renal injury through the activation of NLRP3 inflammasome. Microbiome. 2024;12(1):109. doi:10.1186/s40168-024-01826-9
17. Mooi E, Sarstedt M. Cluster Analysis. A Concise Guide to Market Research: The Process, Data, and Methods Using IBM SPSS Statistics. Berlin, Heidelberg: Springer; 2011:237–284. doi:10.1007/978-3-642-12541-6_9
18. Chen TK, Knicely DH, Grams ME. Chronic kidney disease diagnosis and management: a review. JAMA. 2019;322(13):1294. doi:10.1001/jama.2019.14745
19. Evenepoel P, Cunningham J, Ferrari S, et al. Diagnosis and management of osteoporosis in chronic kidney disease stages 4 to 5D: a call for a shift from nihilism to pragmatism. Osteoporos Int. 2021;32(12):2397–2405. doi:10.1007/s00198-021-05975-7
20. Aoki J, Kaya C, Khalid O, et al. CKD progression prediction in a diverse US population: a machine-learning model. Kidney Med. 2023;5(9). doi:10.1016/j.xkme.2023.100692
21. Ye Z, Zhang Y, Zhang Y, et al. Large-scale proteomics improve prediction of chronic kidney disease in people with diabetes. Diabetes Care. 2024;47(10):1757–1763. doi:10.2337/dc24-0290
22. Alves FC, Sun J, Qureshi AR, et al. The higher mortality associated with low serum albumin is dependent on systemic inflammation in end-stage kidney disease. PLoS One. 2018;13(1):e0190410. doi:10.1371/journal.pone.0190410
23. Jing YH, Zhong X, Li Y, Tao XY, chen JH. Correlation between serum albumin and D-dimer levels in 909 patients with non-valvular atrial fibrillation: a retrospective study from a single center in China. Med Sci Monit. 2022;28:e938511. doi:10.12659/MSM.938511
24. Kadatane SP, Satariano M, Massey M, Mongan K, Raina R. The role of inflammation in CKD. Cells. 2023;12(12):1581. doi:10.3390/cells12121581
25. Graterol Torres F, Molina M, Soler-Majoral J, et al. Evolving concepts on inflammatory biomarkers and malnutrition in chronic kidney disease. Nutrients. 2022;14(20):4297. doi:10.3390/nu14204297
26. Pillai SM, Herzog B, Seebeck P, Pellegrini G, Roth E, Verrey F. Differential impact of dietary branched chain and aromatic amino acids on chronic kidney disease progression in rats. Front Physiol. 2019;10:1460. doi:10.3389/fphys.2019.01460
27. Bao N, Chen F, Dai D. The regulation of host intestinal microbiota by polyphenols in the development and prevention of chronic kidney disease. Front Immunol. 2020;10:2981.PMID: 31969882; PMCID: PMC6960133. doi:10.3389/fimmu.2019.02981
28. Yin J, Luo M, Fu Q, Zhu H. Serum uric acid mediates the association between the estimated glucose disposal rate and chronic kidney disease in patients with diabetes or prediabetes: an analysis from NHANES 2005–2018. BMC Endocr Disord. 2025;25(1):262. doi:10.1186/s12902-025-02081-1
29. Liu S, Sun H, Liu J, Wang G. Accessing the relationship between six surrogate insulin resistance indexes and the incidence of rapid kidney function decline and the progression to chronic kidney disease among middle-aged and older adults in China: results from the china health and retirement longitudinal study. Diabetes Res Clin Pract. 2024;212:111705. doi:10.1016/j.diabres.2024.111705
30. Weaver DJ. Uric acid and progression of chronic kidney disease. Pediatr Nephrol. 2019;34(5):801–809. doi:10.1007/s00467-018-3979-2
31. Toan Duong T, Nguyen MT, Liao CT, et al. Personalized prediction of chronic kidney disease progression in patients with chronic kidney disease stages 3-5: a multicenter study using the machine learning approach. Stud Health Technol Inform. 2025;329:1165–1169. doi:10.3233/SHTI251022
32. Tangri N, Ferguson TW, Teng CC, et al. Validation of the Klinrisk Machine Learning Model for CKD Progression in a Large Representative US Population. J Am Soc Nephrol. 2026;37(2):326–337.PMID: 40768294; PMCID: PMC12889932. doi:10.1681/ASN.0000000817
 © 2026 The Author(s). This work is published and licensed by Dove Medical Press Limited. The
full terms of this license are available at https://www.dovepress.com/terms
and incorporate the Creative Commons Attribution
- Non Commercial (unported, 4.0) License.
By accessing the work you hereby accept the Terms. Non-commercial uses of the work are permitted
without any further permission from Dove Medical Press Limited, provided the work is properly
attributed. For permission for commercial use of this work, please see paragraphs 4.2 and 5 of our Terms.
© 2026 The Author(s). This work is published and licensed by Dove Medical Press Limited. The
full terms of this license are available at https://www.dovepress.com/terms
and incorporate the Creative Commons Attribution
- Non Commercial (unported, 4.0) License.
By accessing the work you hereby accept the Terms. Non-commercial uses of the work are permitted
without any further permission from Dove Medical Press Limited, provided the work is properly
attributed. For permission for commercial use of this work, please see paragraphs 4.2 and 5 of our Terms.