Back to Journals » International Journal of Chronic Obstructive Pulmonary Disease » Volume 12
Metabolic changes of different high-resolution computed tomography phenotypes of COPD after budesonide–formoterol treatment
Authors Wang C, Li JX, Tang D, Zhang JQ, Fang LZ, Fu WP, Liu L, Dai LM
Received 20 September 2017
Accepted for publication 26 October 2017
Published 6 December 2017 Volume 2017:12 Pages 3511—3521
DOI https://doi.org/10.2147/COPD.S152134
Checked for plagiarism Yes
Review by Single anonymous peer review
Peer reviewer comments 3
Editor who approved publication: Dr Chunxue Bai
Cheng Wang,1 Jun-Xiong Li,1 Dang Tang,2 Jian-Qing Zhang,1 Li-Zhou Fang,1 Wei-Ping Fu,1 Ling Liu,1 Lu-Ming Dai1
1Second Department of Respiratory Medicine, 2First Department of Neurosurgery, The First Affiliated Hospital of Kunming Medical University, Kunming, People’s Republic of China
Background: Metabolomics is the global unbiased analysis of all the small-molecule metabolites within a biological system. Metabolic profiling of different high-resolution computed tomography (HRCT) phenotypes of COPD patients before and after treatment may identify discriminatory metabolites that can serve as biomarkers and therapeutic agents.
Patients and methods: 1H nuclear magnetic resonance spectroscopy (1H-NMR)-based metabolomics was performed on a discovery set of plasma samples from 50 patients with stable COPD. Patients were assigned into two groups on the basis of HRCT findings including phenotype E (n=22) and phenotype M (n=28). After budesonide–formoterol treatment (160/4.5 µg ×2 inhalations twice daily for 3 months), clinical characteristics and metabolites were then compared between phenotype E pretreatment and posttreatment, phenotype M pretreatment and posttreatment, phenotype E pretreatment and phenotype M pretreatment, and phenotype E posttreatment and phenotype M posttreatment.
Results: Inhaled budesonide–formoterol therapy for both phenotype E (emphysema without bronchial wall thickening) and phenotype M (emphysema with bronchial wall thickening) was effective. However, phenotype E and phenotype M were different in response to therapy. Patients with phenotype M in response to therapeutic effects were significantly greater compared with phenotype E. Certain metabolites were identified, which were closely related to the treatment and phenotype. Metabolic changes in phenotype E or phenotype M after treatment may be involved with adenosine diphosphate (ADP), guanosine, choline, malonate, tyrosine, glycine, proline, l-alanine, l-valine, l-threonine leucine, uridine, pyruvic acid, acetone and metabolism disturbance. Metabolic differences between phenotype E and phenotype M in pretreatment and posttreatment covered glycine, D-glucose, pyruvic acid, succinate, lactate, proline, l-valine and leucine.
Conclusion: Bronchial wall thickening in COPD may be an indicator for predicting the better response to the treatment with bronchodilator and corticosteroid. The identification of metabolic alterations provides new insights into different HRCT phenotypes and therapeutic assessment of COPD.
Keywords: COPD, metabolomics, budesonide–formoterol, HRCT
Introduction
COPD is a highly prevalent respiratory disease characterized by nonreversible airway obstruction and an increased inflammatory response of the airways. It is predicted that COPD will be the third leading cause of death worldwide by 2020, which will continue to pose an ever-increasing problem well into the future due to high rates of smoking and air pollution.1 Meanwhile, COPD is a heterogeneous disease that can be described by different clinical phenotypes through clinical manifestations, physiological indexes, metabolites, inflammatory biomarkers and imaging features.2 Diversity of pathological changes of COPD may be associated with different clinical features and metabolites, including responsiveness to bronchodilators or inhaled corticosteroids. Therefore, assessment and management of clinical phenotypes are required to better guide the therapy for patients with COPD rather than focusing on the severity of airflow limitation only.
With the development of computed tomography (CT) imaging technology, high-resolution CT (HRCT) enables direct radiographic assessment of luminal caliber and wall thickness of small airways. According to the dominancy of emphysema with apparent low attenuation areas (LAAs) and the presence of bronchial wall thickening, HRCT phenotypes of COPD were classified into three – phenotype A: no or mild emphysema with or without bronchial wall thickening; phenotype E: apparent emphysema without bronchial wall thickening and phenotype M: apparent emphysema with bronchial wall thickening.3 Recent studies found that COPD phenotypes were different in response to bronchodilator and inhaled glucocorticoid therapy.4 Some patients respond well to glucocorticoid treatment, and some patients are less effective. So, HRCT provided detailed anatomic information and morphological changes for identifying phenotypes that can accurately assess the severity and pathology of COPD and evaluated therapeutic schedule and prognosis that allow for determining the best therapy so as to realize better clinical results.
Metabolomics is the comprehensive assessment of endogenous metabolites and can systematically identify and quantify the dynamic multiparametric metabolic response from living systems in a global and targeted manner.5 By means of measuring metabolic changes, including carbohydrates, amino acids, peptides, vitamins, nucleic acids, organic acids, alkaloids, inorganic species and polyphenols, in a cell, tissue or organism, biochemical effects induced by a disease or its therapeutic intervention can be determined.6 1H nuclear magnetic resonance spectroscopy (1H-NMR), a data-rich analytical technique, has the potential to generate a highly informative metabolic fingerprint via single measurement, which is possible to associate two or more biomarkers to enhance classification power for more accurate diagnosis and prognosis evaluation, reflecting the biochemical pathway mechanisms of disease.
Until recently, few studies have been carried out to validate the outcome of bronchodilator and corticosteroid treatment of different HRCT phenotypes of COPD and test the qualitative and quantitative metabolic changes pre and post treatment and metabolic characteristics of different HRCT phenotypes. Metabolic profiling of blood provides a global view of the metabolic status by constant regulatory mechanisms. Thus, our study was an attempt to explore the outcome of budesonide–formoterol (inhalation powder) in the treatment of different HRCT phenotypes and investigate the plasma metabolic differences in patients with phenotype E or M before and after treatment, to provide a novel comprehensive description of morphological phenotype to guide personalized therapy.
Patients and methods
Patients
COPD was diagnosed based on clinical history and symptoms and pulmonary function characterized by irreversible airflow limitation according to the Global Initiative for Chronic Obstructive Lung Disease (GOLD).7 A total of 163 stable COPD patients (≥40 years old) with post-bronchodilator forced expiratory volume in 1 second (FEV1) 40%–80% predicted and FEV1/forced vital capacity (FVC) <70% (moderate-to-severe COPD) were evaluated from outpatient clinics of Respiratory Medicine in the First Affiliated Hospital of Kunming Medical University between December 2015 and June 2017, and 50 patients were ultimately included in a cross-sectional study. The other 113 patients were excluded in line with exclusion criteria, including a respiratory tract infection or exacerbation of an airway disease in the previous 3 weeks, associated respiratory diseases, serious cardiovascular disease, cancer, cognitive impairment, immunodeficiency and unable to complete the protocol. Written informed consent was obtained from each subject, and the protocol was approved by the ethics committee of Kunming Medical University.
Study design
Phenotype A is characterized by the absence of emphysema or little emphysema showing LAA ≤ grade 1 regardless of existing bronchial wall thickening. We cannot exclude that patients with phenotype A may be asthmatic with fixed airflow limitation since airway remodeling, or bronchitis with irreversible airflow limitation. Therefore, phenotype A was not incorporated into the study. COPD patients were assigned into phenotype E pretreatment (EQ, n=22), phenotype M pretreatment (MQ, n=28), phenotype E posttreatment (EH, n=22) and phenotype M posttreatment (MH, n=28) based on the HRCT findings and pre–posttreatment. Budesonide–formoterol-pressurized metered-dose inhaler (160/4.5 μg ×2 inhalations; 320/9 μg), twice daily, was prescribed for COPD patients in a 3-month treatment period.8 The following data collected at inclusion were compared between groups: medical and smoking history, physical examination, blood samples and lung function including post-bronchodilator ratio of FEV1 to FVC% (FEV1/FVC%) and FEV1 in percentage of predicted (FEV1%), St George’s Respiratory Questionnaire (SGRQ) score and chest HRCT.
HRCT phenotypes and evaluation of emphysema and bronchitis
HRCT scanning (SomAToM; Siemens, Munich, Germany) at full inspiration (at tumor-to-liver contrast [TLC] level with 140 kVp, 200 mA and pitch of 1.375) was used. Three slices, 1 mm thick, were obtained at three anatomical levels: upper (near the superior margin of the aortic arch), middle (at the level of the carina) and lower lung field level (at the level of the orifice of the inferior pulmonary veins). Emphysema was scored visually by LAA in the bilateral upper, middle and lower lung fields on the basis of the method by Goddard et al.9 The score in each dimension was calculated according to the ratio of LAA to occupy in the lung field as follows: score 0, LAA <5%; score 1, 5% ≤ LAA <25%; score 2, 25% ≤ LAA <50%; score 3, 50% ≤ LAA <75% and score 4, LAA ≥75%. The severity of emphysema was graded in conformity to the sum of scores taken from six dimensions as follows: grade 0, total score =0; grade 1, total score =1–6; grade 2, total score =7–12; grade 3, total score =13–18 and grade 4, total score =19–24.3 Bronchial wall thickening in all lung fields was graded visually as follows: grade 0, bronchial wall thickening <30% of adjacent pulmonary artery diameter, and grade 2, bronchial wall thickening ≥50% of adjacent pulmonary artery diameter.3 The patients were classified into the two phenotypes according to the visual HRCT findings as follows: phenotype E (severity of emphysema ≥ grade 2 without bronchial wall thickening) and phenotype M (severity of emphysema ≥ grade 2 and bronchial wall thickening ≥ grade 1).
Sample preparation and 1H-NMR measurements
Blood samples (9 mL each) were collected in the morning and centrifuged at 4,000 rpm for 10 minutes at 4°C. The plasma samples were then immediately frozen and stored at −80°C until metabolomic analysis. For NMR analysis, plasma aliquots were thawed at room temperature, and then the plasma (400 μL) was mixed with phosphate-buffered saline (PBS; 0.6 M, 30 μL) and D2O (170 μL). The homogenized mixture was subsequently centrifuged at 12,000 rpm for 10 minutes at 4°C. After centrifugation, the supernatant (500 μL) for each sample was transferred into a 5 mm NMR tube.
1H-NMR measurements were obtained on a Varian INOVA 600 spectrometer at a 1H frequency of 600.13 MHz. Using a solvent pre-saturation pulse sequence, 1H-NMR spectra of the samples to suppress the residual water resonance were acquired. Using a Carr–Purcell–Meiboom–Gill pulse sequence, 1H-NMR spectra of the samples were acquired. At 128,000 data points, free induction decays (FIDs) were collected with a spectral width of 8,000 Hz and 32,000 sampling points. The cumulative number of 64 times and acquisition time of 2.04 seconds provided a total pulse recycle delay of 2.00 seconds. The data were zero filled by a factor, and FIDs were multiplied by an exponential weighting function equivalent to a line broadening of 0.5 Hz before the Fourier transform.
Data processing and multivariate statistical analysis
The phase and baseline of all 1H-NMR spectra were manually corrected using Mest Re Nova software (version 9.0.1.13254; Mestrelab Research, Santiago de Compostela, Spain). The range of δ 10–0 ppm in standard 1H-NMR spectra was automatically segmented into 400 regions at 0.01 ppm intervals with δ 4.4–0.4 ppm. The data from each sample were normalized to total area to correct for the NMR response shift. The spectrum was divided into a specified number of regions and the total signal area was integrated within each region to provide a numerical value. These values were then used as variables for data analysis.
The reduced and normalized NMR spectral data were submitted to SIMCA-Package (SIMCA-P) version 11.0 (Umetrics, Umea, Sweden) software package for multivariate analysis. The unsupervised principal component analysis (PCA) was first carried out to detect intrinsic clusters and possible outliers within the data set using mean-centered data. Subsequently, supervised partial least squares discriminant analysis (PLS-DA) modeling was applied to improve class discrimination. SIMCA-P was used to generate all the PLS-DA models and score plots and was performed to clarify which chemical shift regions carry the separating information. Cross-validation was used to validate the PLS-DA model according to the default settings in the software. The obtained parameters R2X (represents the total explained variation of the model) and Q2 (represents the predictability of the model) were further used to confirm the validity of these models. The significantly different expression of compound peaks (variable importance [VIP] >1.0) was listed by the software. Subsequently, the differentiated expressions of peaks were analyzed by discriminatory analysis.
Statistical analysis
SPSS 20.0 software (IBM Corporation, Armonk, NY, USA) was used for statistical analysis of the clinical data. Student’s t-test was used to compare two group experiments, and paired t-test was used to compare before and after treatment group experiments. χ2 test was used to compare categorical variables. Data are expressed as mean ± SD. P<0.05 was considered statistically significant.
Metabolite set enrichment analysis (MSEA)
A set of significantly altered metabolites was used as the input for the MSEA to identify the most altered metabolic pathways. The MSEA was performed with web portal for pathway analysis and visualization (http://www.msea.ca/MSEA/faces/Home.jsp). Overrepresentation analysis was used to screen affected pathways.
Results
Baseline characteristics of study participants
The characteristics of the 50 COPD patients enrolled in the study are summarized in Table 1. There was no significant difference between phenotype E and phenotype M with respect to age, gender, BMI and smoking (P>0.05). Regarding lung function data, FEV1% predicted and FEV1/FVC% of both phenotype E and phenotype M were significantly higher in posttreatment compared with the pretreatment following 3 months (P<0.05). FEV1% predicted and FEV1/FVC% had no significant difference between phenotype E and phenotype M in pretreatment (P>0.05). FEV1% predicted and FEV1/FVC% of phenotype M were significantly higher in posttreatment compared with phenotype E (P<0.05), and the change in FEV1% predicted and FEV1/FVC% of phenotype M in pre–posttreatment was also significantly higher (P<0.05). SGRQ total score of both and phenotypes E and M was improved significantly in posttreatment compared with pretreatment (P<0.05). SGRQ total score of phenotype M in pretreatment and posttreatment was significantly higher compared with phenotype E (P<0.05), and the change in SGRQ total score of phenotype M in pre–posttreatment was significantly higher (P<0.05).
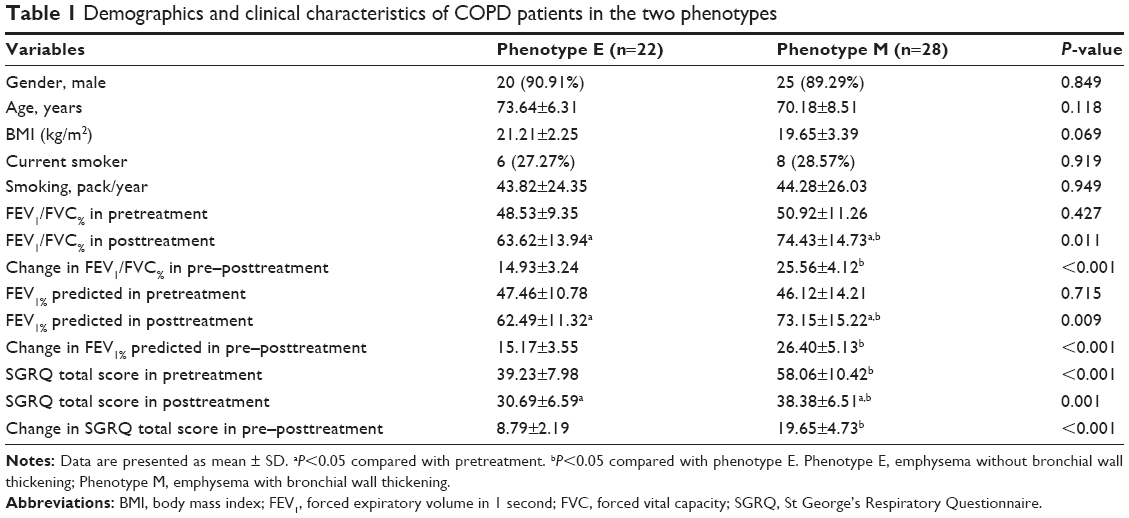 | Table 1 Demographics and clinical characteristics of COPD patients in the two phenotypes |
Determination of metabolic differences in plasma according to 1H-NMR spectroscopy
With the major metabolites in the integrate regions assigned, typical 1H-NMR spectra of COPD patient samples are shown in Figure 1. The spectra were processed and converted into 400 integral regions of 0.01 ppm width. The metabolic-related 1H-NMR chemical shift spectrum can be found in the published literatures and online databases (http://www.hmdb.ca).10 Abundant endogenous metabolites including several amino acids were detected according to these spectral data. It is impossible to get consistent comparison results across all the subjects because of the high individual variability and large complexity, and the NMR spectra of samples were subjected to multivariate statistical data analysis to identify the metabolic differences.
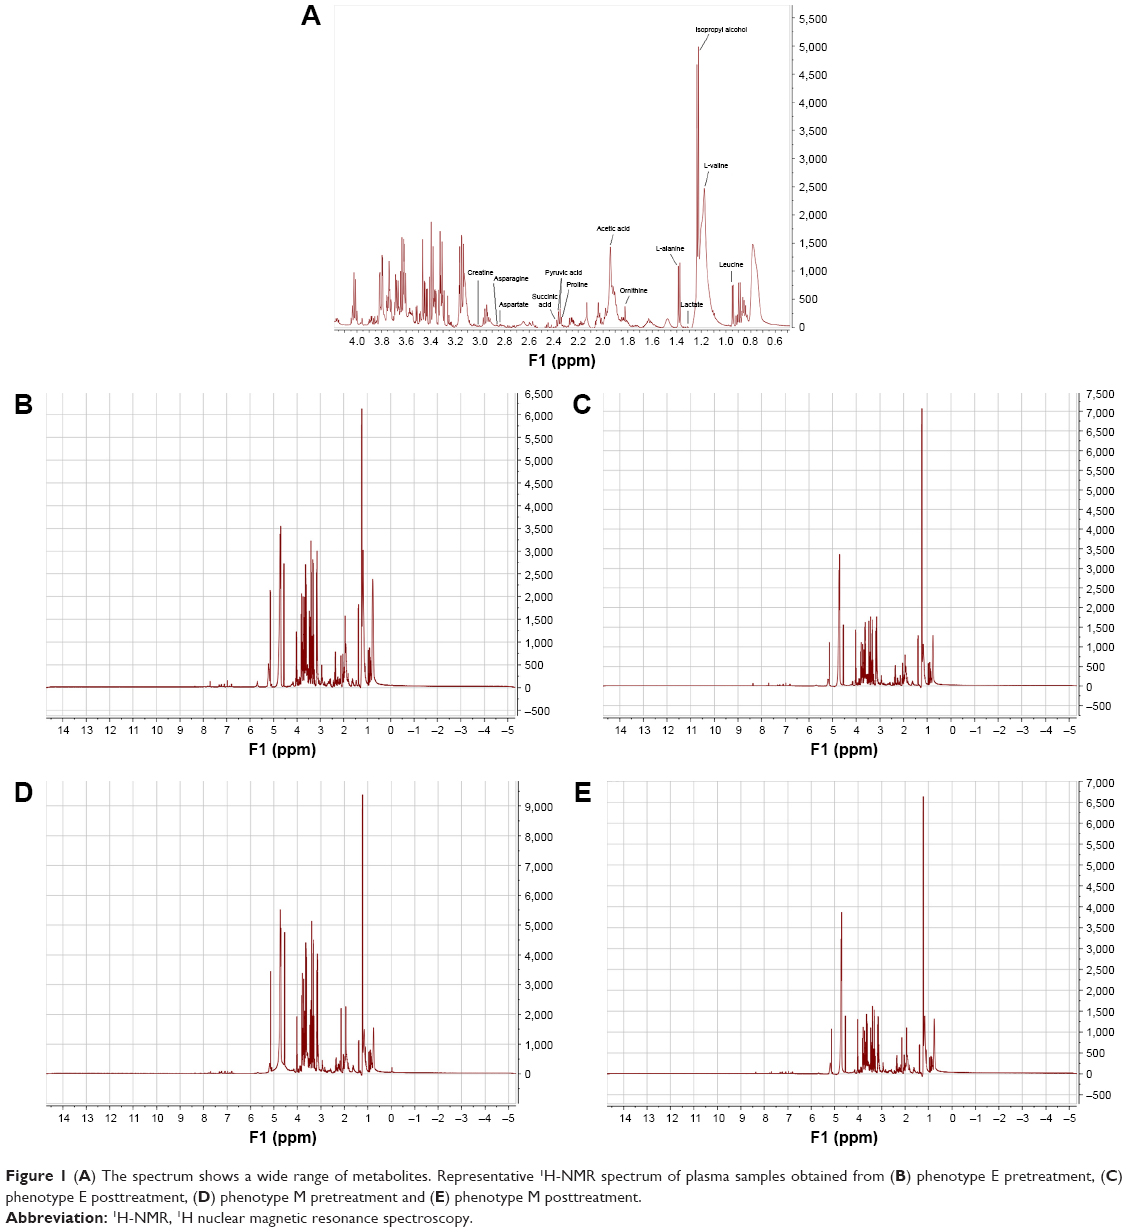 | Figure 1 (A) The spectrum shows a wide range of metabolites. Representative 1H-NMR spectrum of plasma samples obtained from (B) phenotype E pretreatment, (C) phenotype E posttreatment, (D) phenotype M pretreatment and (E) phenotype M posttreatment. |
Identification of discriminatory metabolites
PCA was first performed based on the normalized NMR spectral data as an exploratory unsupervised analysis to obtain a general overview of sample distribution. The first and second principal components (PC1 and PC2) were calculated for the models. The PCA score plot is shown in Figure 2, and the explained variances are shown in parentheses. Panel validation could be discriminated according to their metabolite content. The two different groups are completely separated.
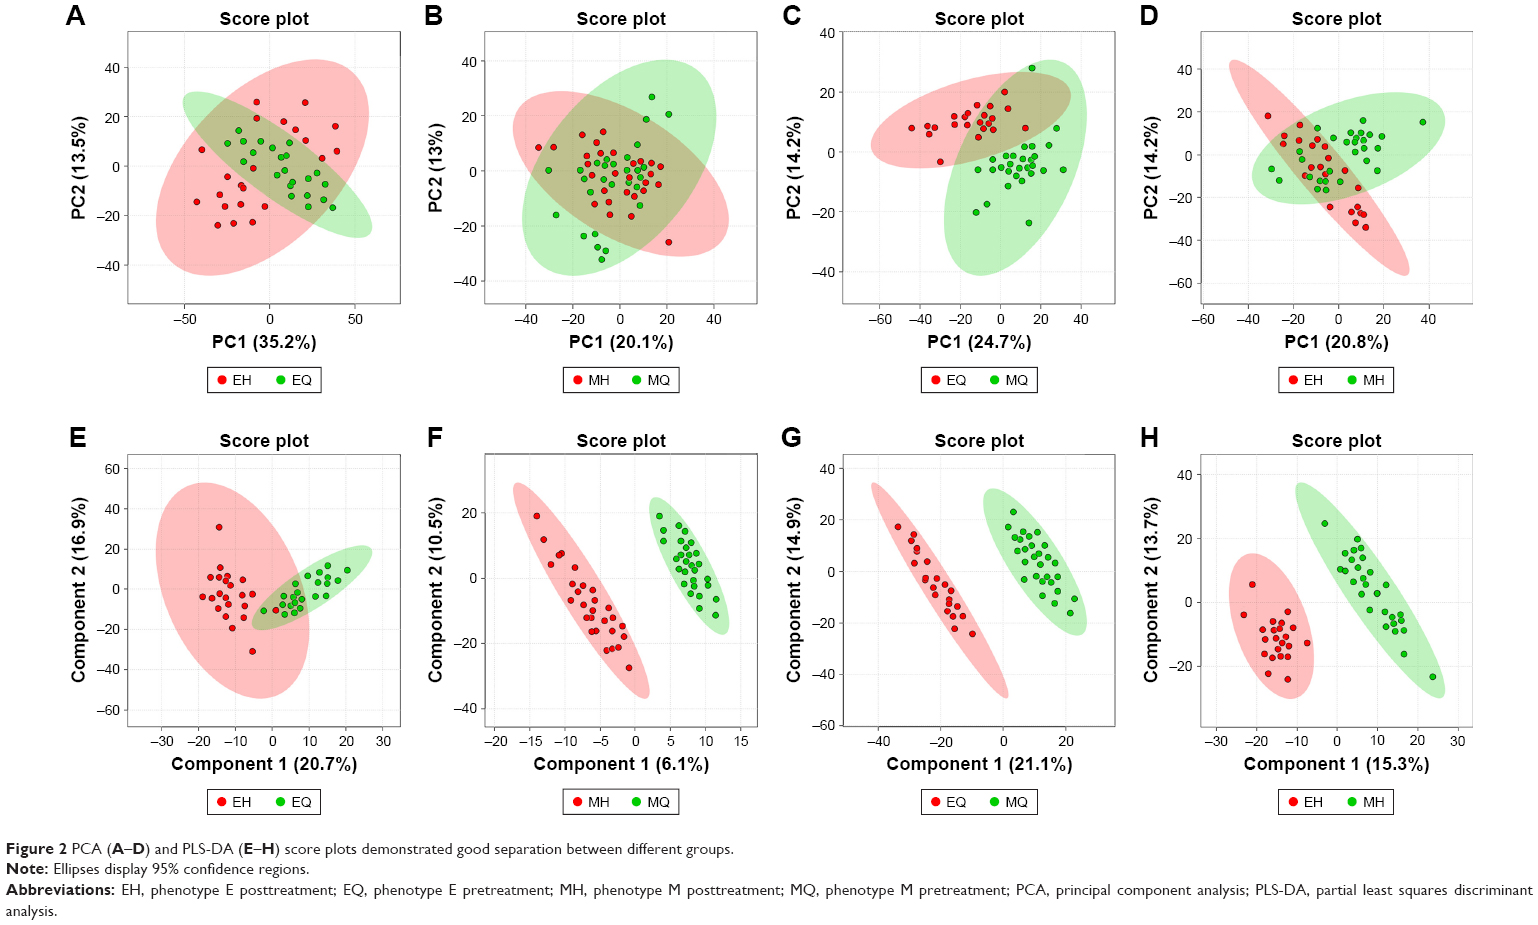 | Figure 2 PCA (A–D) and PLS-DA (E–H) score plots demonstrated good separation between different groups. |
To corroborate data and reinforce classification, the PLS-DA was applied in our study. The PLS-DA score plot is shown in Figure 2. Panel confirms the existence of two clearly distinct groups of individuals. The two different groups are characterized by different metabolite concentrations. The resulting supervised models were tested by iteratively predicting the class membership of every sample. Subsequently, the obtained parameters R2X, which represents the total explained variation of the model, and Q2, which represents the predictability of the model, were used to describe the quality of these models. The expected R2 and Q2 depend highly on their application fields and should be >0.5 and >0.4, respectively, indicating a significant biological model. In our established model, the value of R2 in Table 2 indicates that the PLS-DA model had been successfully established. As summarized in Table 2, the model has good fit and can well differentiate different groups as follows: MH and MQ (R2X =0.029, Q2 =0.338); EH and EQ (R2X =0.107, Q2 =0.273); EQ and MQ (R2X =0.203, Q2 =0.547); EH and MH (R2X =0.102, Q2 =0.0473). The VIP score is a quantitative measure that indicates the contribution of a single variable to the description of both independent variables and the response variable. VIP >1 was considered to be the greatest contributor to the group difference. Finally, independent t-test (P<0.05) and fold change (FC ≥2) between two groups were used to screen discriminatory metabolites.
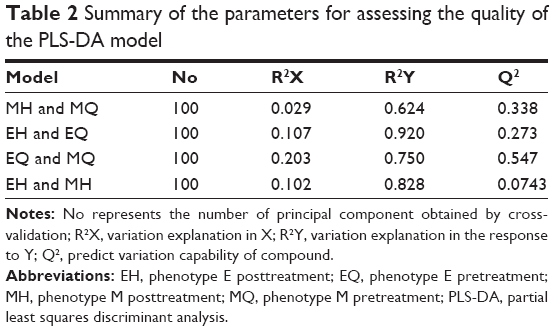 | Table 2 Summary of the parameters for assessing the quality of the PLS-DA model |
The main molecular markers for the observed differences were found (Table 3). The metabolomic analysis of the plasma of phenotype E patients showed that adenosine diphosphate (ADP), guanosine, choline, malonate, tyrosine, glycine, proline, L-alanine, L-valine and leucine were significantly upregulated, meanwhile pyruvic acid, acetone and lactate were significantly downregulated in posttreatment compared with pretreatment (P<0.05). A total of 13 metabolites were found to be regulated in posttreatment compared with pretreatment of phenotype M patients. ADP, guanosine, L-threonine, choline, glycine, proline, tyrosine, L-alanine, L-valine and leucine were significantly upregulated, and uridine, acetone and lactate were downregulated (P<0.05). Several biomarkers were identified, of which glycine, D-glucose and pyruvic acid levels were lower, while succinate and lactate levels were higher in phenotype M compared with phenotype E before treatment (P<0.05). After treatment, glycine, D-glucose and pyruvic acid levels were still lower, while proline, L-valine and leucine levels were higher in phenotype M compared with phenotype E (P<0.05).
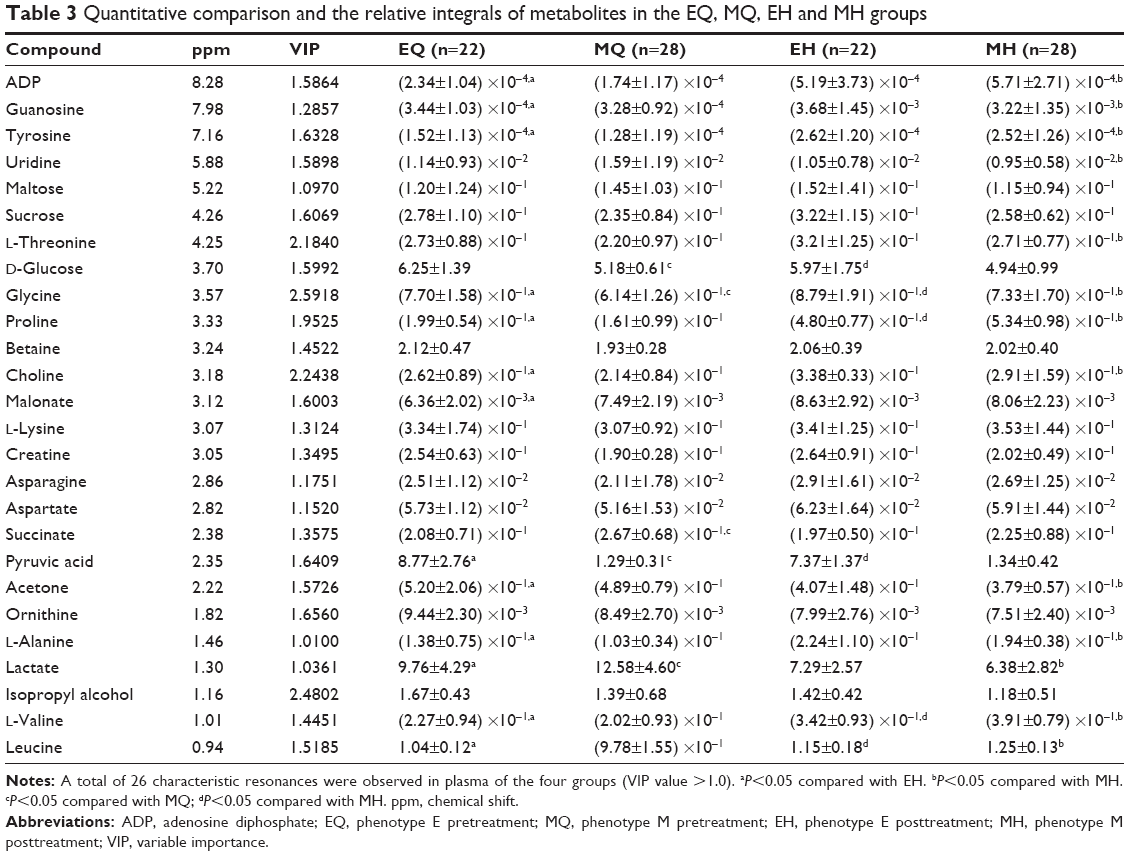 | Table 3 Quantitative comparison and the relative integrals of metabolites in the EQ, MQ, EH and MH groups |
Discussion
In this study, we have identified the treatment outcome of budesonide–formoterol in patients with phenotype E and M as well as analyzed discriminatory metabolites in patients with phenotype E or M before and after treatment. Furthermore, discriminatory metabolites were determined between patients with phenotypes E and M including pre- and posttreatment. Our analyses showed that baseline characteristics and lung function measurements might not differentiate phenotype E from M. SGRQ total score was associated with the HRCT phenotypes. Inhaled corticosteroid plus bronchodilator therapy for both phenotypes E and M was effective. However, phenotype E and phenotype M were different in response to therapy. Patients with phenotype M in response to therapeutic effects were significantly greater compared with phenotype E. Hence, it may be reasonable that the presence of bronchial wall thickening is significantly associated with the reversibility in response to the treatment with bronchodilator and corticosteroid. Patients with phenotype M also show increased airway inflammation and wall thickening in the small airway which might be implicated in the reversibility by bronchodilator and corticosteroid. In contrast, patients with phenotype E appear mild airway wall thickening in the small airway, and the airflow limitation is mainly by reason of the decreased elastic recoil. Moreover, combined usage of formoterol and budesonide has been demonstrated to underline a greater effect on airway inflammation than either drug alone with a complementary interaction. Therefore, it seems likely that bronchial wall thickening may be an indicator for predicting the better response to the treatment with bronchodilator and corticosteroid.11
Metabolites analyzed by 1H-NMR with high-efficiency qualitative and quantitative spectral differences have been demonstrated by several authors to diagnose a variety of respiratory diseases.12,13 Metabolic profiling of serum and urine by 1H-NMR-based spectroscopy had been reported previously to discriminate patients with COPD and healthy individuals.14 Metabolomic analysis recently identified the gender dependency of circulating metabolic profiles in COPD, providing further molecular evidence of a female-driven subphenotype of COPD.15 Significantly increased or decreased metabolites among these studies were shown to be responsible for intergroup separation. On the basis of these interesting results, the metabolite content of plasma collected from subjects with COPD was explored to find biomarkers, to provide HRCT classification and to respond to therapeutic effect.
The metabolomic analysis of the plasma in patients with phenotypes E and M showed significant differences before and after treatment. We speculate that COPD patients with reduced pulmonary ventilation function make less oxygen accessible to transport from the lungs to other parts of the body. Pulmonary gas exchange impairment may lead to arterial hypoxemia and reduced oxygen delivery to skeletal muscle during exercise. Exercise intolerance and dyspnea are the most frequently occurring complaints in patients. Weakness of both skeletal and respiratory muscles contributes to these complaints, while locomotor muscle wasting is related to altered muscle metabolism and gene expression in COPD patients.16,17 Then, the body resorts to consuming carbohydrate, protein and fat at a higher rate as a compensatory mechanism. Amino acids are used in the biosynthesis of proteins, and their reduced levels are consistent with muscle wasting. The higher routine respiration in COPD could be controlled by elevated cytoplasmic ATPase activity leading to elevated mitochondrial ADP which can stimulate respiration in the absence of exogenous ADP titration.18 A previous study found that muscle energy metabolism of stable COPD patients was disturbed, including an imbalance in production and utilization of (adenosine triphosphate) ATP, and lower ATP/ADP ratio in the patients.19 Guanosine can be phosphorylated to become guanosine monophosphate, cyclic guanosine monophosphate, guanosine diphosphate and guanosine triphosphate to play important roles in various biochemical processes such as synthesis of nucleic acids and proteins. Choline can suppress inflammation and oxidative stress when given in substantial amounts in patients with asthma. Increased choline levels may be an adaptive response to control the severity of inflammation.20 Malonate is a competitive inhibitor of the enzyme succinate dehydrogenase which can decrease cellular respiration. L-Valine and leucine belong to branched-chain amino acids (BCAAs), which regulate protein turnover and glucose homeostasis with a continuous flux of BCAAs to skeletal muscle.21 Decreased BCAAs have been found in previous studies of COPD patients, and the lower levels of BCAAs are the result of proteolysis, potentially due to wasting and enhanced gluconeogenesis under hypoxia conditions.22,23 Tyrosine, glycine, proline, L-threonine and L-alanine are proteinogenic amino acids which can be transformed into glucose for energy. Uridine plays a role in the glycolysis pathway of galactose. Lactate levels are associated with hypoxia-induced restricted exercise capacity. A significant decrease in uridine and lactate after treatment shows that anaerobic glycolysis energy supply is reduced. Pyruvic acid supplies energy through the citric acid cycle when oxygen is present, and alternatively ferments to produce lactate when oxygen is lacking. Pyruvate, the conjugate base, is a key intermediate in several metabolic pathways. Elevated expression level of pyruvate has also been found in serum from lung cancer as well as exhaled breath condensate samples from COPD patients.24,25 Acetone is produced from acetyl-CoA when energy is obtained from fatty acids due to lack of carbohydrates. The observed increase in acetone suggests the utilization of storage lipids as an alternative energy resource. Persisting airway inflammation, irreversible airflow obstruction and an existing systemic inflammatory response of COPD patients lead to consumption of body energy and malnutrition, which induce disordered energy and lipid and amino acid metabolism. Budesonide–formoterol treatment improves lung function, decreases symptoms, acts anti-inflammatory effects, and metabolic change occured in parallel pattern, indicating metabolites are associated with treatment regulation.
Several biomarkers were identified between phenotypes E and M before treatment. Repeated exposure to noxious particles can trigger a distinct inflammatory cascade in the small airways and lung parenchyma of COPD. Lung inflammatory proteinase production and alveolar septal cell apoptosis lead to destruction of alveolar structures to form emphysema. Chronic inflammation-induced matrix deposition around the small airways causes the small airway wall thickening.26 Bronchial wall thickening in large or intermediate airways on HRCT reflects the wall thickening in smaller airways.27 Therefore, the higher level of inflammation is likely to generate the thicker airway walls. It can be concluded that phenotype M might show increased levels of inflammation versus phenotype E. Many aspects of the clinical phenotype with COPD are also related to inflammation.28 Glycine plays a part in regulating the transcription of inflammatory cytokines in inflammatory cells to suppress the formation of free radicals and inflammatory cytokines.29 In addition, glycine consumption and expression of the mitochondrial glycine biosynthetic pathway are strongly correlated with rates of proliferation across cancer cells.30 Pyruvic acid is closely related to inflammatory cells, and their factors which can remove excess free radicals inhibit cytokine chemokines and related mRNA expression to act as antioxidant and anti-inflammatory.31 The lower levels of glycine and pyruvic acid in phenotype M may suggest its high inflammation level. The decreased level of glucose was related to the proliferation of inflammatory cells which needed carbohydrates to supply energy. Lactate bridges the gap between high lactate levels in wound healing, chronic inflammation and cancer development.32 So, phenotype M showed increased lactate level led to bronchial wall thickening. Succinate is an intermediate of the tricarboxylic acid (TCA) cycle and plays a crucial role in ATP in mitochondria. Recent study has found that succinate may directly regulate hypoxia-inducible factor-1α (HIF-1α) signaling to promote inflammation by macrophages, and succinate as an inflammatory signal.33 After treatment, there were differences in metabolites between phenotypes M and E. The increased amino acid levels revealed that the effect of the therapy in phenotype M was better than that in phenotype E, when lung function was improved and inflammation was suppressed after treatment. The MSEA indicated that the main differences were related to protein biosynthesis, amino acid metabolism, gluconeogenesis and glycolysis (Figure 3).
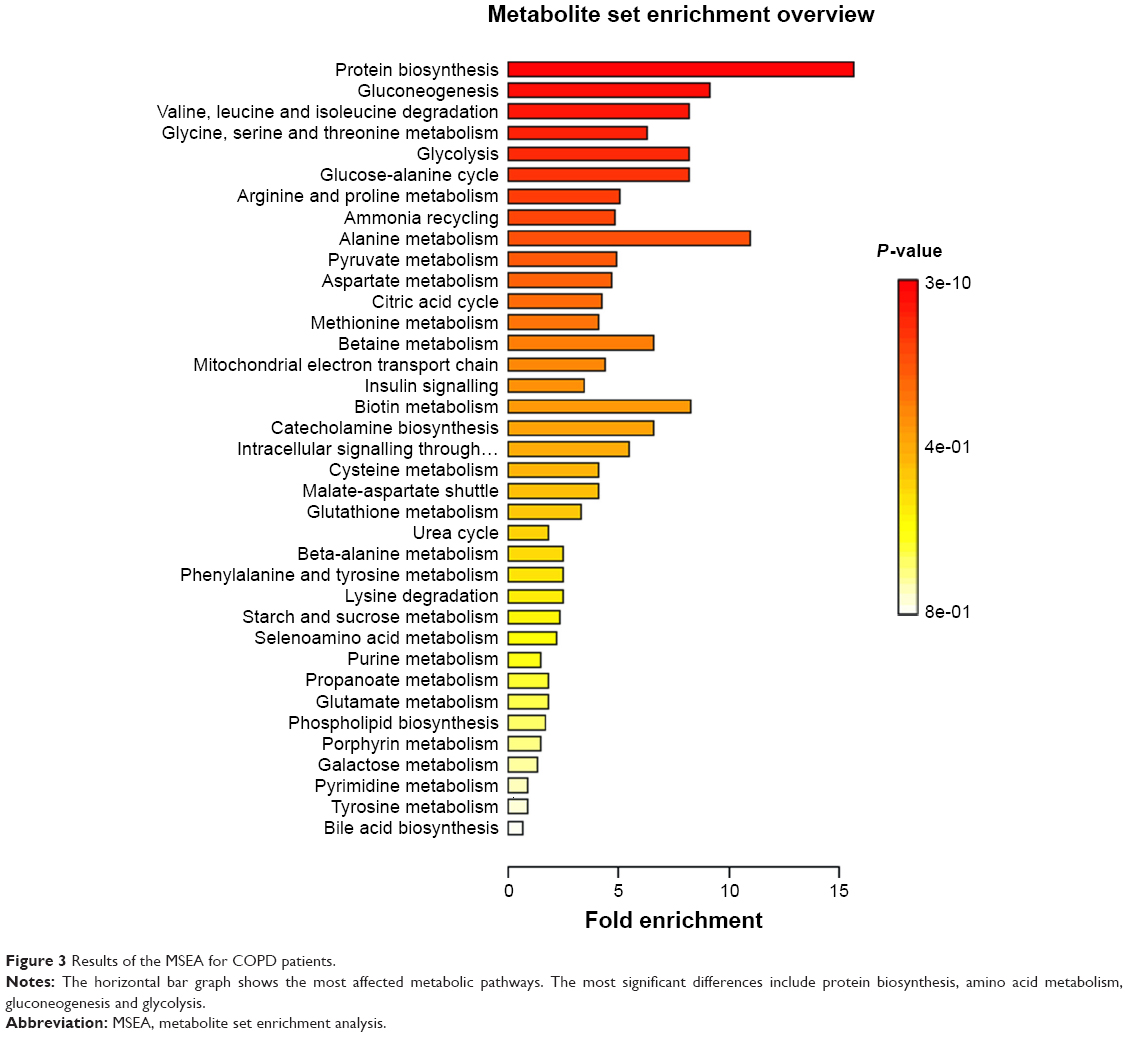 | Figure 3 Results of the MSEA for COPD patients. |
There are some limitations in the current study. The data were analyzed in a moderately limited number of subjects, and without other samples such as lung tissue, exhaled breath condensate and urine. Moreover, individual’s metabolic profile reflects complex interactions among genome, environmental factors, diet and symbiotic gut microbes.34 The combinations of different metabolic profiles with gene, genetic transcription and protein are proposed to explore biomarkers involved with COPD. To develop these meaningful biomarkers applied to the clinic need further validation.
Conclusion
Overall, the results suggest that the HRCT morphological phenotypes of COPD show several clinical characteristics and different responses to treatment with budesonide–formoterol. Bronchial wall thickening may be an indicator for predicting the better response to the treatment with bronchodilator and corticosteroid. This study focuses on the discovery of potential biomarkers of different aspects of COPD. Metabolic profiling exhibits a significantly metabolic discrimination between phenotype E pretreatment and posttreatment, phenotype M pretreatment and posttreatment, phenotype E pretreatment and phenotype M pretreatment and phenotype E posttreatment and phenotype M posttreatment. Certain metabolites are identified that are closely related to treatment and phenotype. Metabolic change in phenotype E or phenotype M after treatment may be involved with energy, amino acids and lipid metabolism disturbance regulated by lung function improvement, symptom reduction and anti-inflammatory effects. Metabolic difference between phenotypes E and M including pretreatment and posttreatment may be associated with inflammatory proliferation and inflammation suppression. This study shows that metabolic profiling of human plasma samples could become a promising clinical tool to differentiate HRCT phenotypes of COPD and therapeutic assessment.
Acknowledgments
This study was supported by grants from the National Natural Science Foundation of China (grant no 81160006) and Kunming Medical University Doctoral Innovation Fund. The authors are grateful to the staff at the Second Department of Respiratory Medicine, The First Affiliated Hospital of Kunming Medical University, for their help in recruiting patients for the study.
Disclosure
The authors report no conflicts of interest in this work.
References
Mirrakhimov AE. Chronic obstructive pulmonary disease and glucose metabolism: a bitter sweet symphony. Cardiovasc Diabetol. 2012;11:132. | ||
Agusti A, Sin DD. Biomarkers in COPD. Clin Chest Med. 2014;35(1):131–141. | ||
Sun XW, Gu SY, Li QY, et al. Pulmonary function parameters in high-resolution computed tomography phenotypes of chronic obstructive pulmonary disease. Am J Med Sci. 2015;349(3):228–233. | ||
Miravitlles M, Calle M, Soler-Cataluña JJ. Clinical phenotypes of COPD: identification, definition and implications for guidelines. Arch Bronconeumol. 2012;48(3):86–98. | ||
Nicholson JK, Lindon JC. Systems biology: metabonomics. Nature. 2008;455(7216):1054–1056. | ||
Adamko DJ, Nair P, Mayers I, et al. Metabolomic profiling of asthma and chronic obstructive pulmonary disease: a pilot study differentiating diseases. J Allergy Clin Immunol. 2015;136(3):571–580. | ||
Vogelmeier CF, Criner GJ, Martinez FJ, et al. Global strategy for the diagnosis, management and prevention of chronic obstructive lung disease 2017 report. Am J Respir Crit Care Med. 2017;195(5):557. | ||
Trudo F, Kern DM, Davis JR, et al. Comparative effectiveness of budesonide/formoterol combination and tiotropium bromide among COPD patients new to these controller treatments. Int J Chron Obstruct Pulmon Dis. 2015;10:2055–2066. | ||
Goddard PR, Nicholson EM, Laszlo G, Watt I. Computed tomography in pulmonary emphysema. Clin Radiol. 1982;33(4):379–387. | ||
Deja S, Porebska I, Kowal A, et al. Metabolomics provide new insights on lung cancer staging and discrimination from chronic obstructive pulmonary disease. J Pharm Biomed Anal. 2014;100:369–380. | ||
Sin DD, Johnson M, Gan WQ, Man SF. Combination therapy of inhaled corticosteroids and long-acting beta2-adrenergics in management of patients with chronic obstructive pulmonary disease. Curr Pharm Des. 2004;10(28):3547–3560. | ||
Motta A, Paris D, D’Amato M, et al. NMR metabolomic analysis of exhaled breath condensate of asthmatic patients at two different temperatures. J Proteome Res. 2014;13(12):6107–6120. | ||
Airoldi C, Ciaramelli C, Fumagalli M, et al. 1H NMR to explore the metabolome of exhaled breath condensate in α1-antitrypsin deficient patients: a pilot study. J Proteome Res. 2016;15(12):4569–4578. | ||
Wang L, Tang Y, Liu S, et al. Metabonomic profiling of serum and urine by 1H NMR-based spectroscopy discriminates patients with chronic obstructive pulmonary disease and healthy individuals. PLoS One. 2013;8(6):e65675. | ||
Naz S, Kolmert J, Yang M, et al. Metabolomics analysis identifies sex-associated metabotypes of oxidative stress and the autotaxin-lysoPA axis in COPD. Eur Respir J. 2017;49(6):1602322. | ||
Jagoe RT, Engelen MP. Muscle wasting and changes in muscle protein metabolism in chronic obstructive pulmonary disease. Eur Respir J Suppl. 2003;46(5):52s–63s. | ||
Crul T, Testelmans D, Spruit MA, et al. Gene expression profiling in vastus lateralis muscle during an acute exacerbation of COPD. Cell Physiol Biochem. 2010;25(5):491–500. | ||
Naimi AI, Bourbeau J, Perrault H, et al. Altered mitochondrial regulation in quadriceps muscles of patients with COPD. Clin Physiol Funct Imaging. 2011;31(2):124–131. | ||
Pouw EM, Lang KD, Gosker HR, et al. Muscle metabolic status in patients with severe COPD with and without long-term prednisolone. Eur Respir J. 2000;16(2):247–252. | ||
Nobakht M, Gh BF, Aliannejad R, Rezaei-Tavirani M, Taheri S, Oskouie AA. The metabolomics of airway diseases, including COPD, asthma and cystic fibrosis. Biomarkers. 2015;20(1):5–16. | ||
Layman DK, Walker DA. Branched-chain amino acids: metabolism, physiological function, and application. J Nutrition. 2006;136(1):319S–323S. | ||
Snowden S, Dahlén SE, Wheelock CE. Application of metabolomics approaches to the study of respiratory diseases. Bioanalysis. 2012;4(18):2265–2290. | ||
Ubhi BK, Riley JH, Shaw PA, et al. Metabolic profiling detects biomarkers of protein degradation in COPD patients. Eur Respir J. 2012;40(2):345–355. | ||
Rocha CM, Carrola J, Barros AS, et al. Metabolic signatures of lung cancer in biofluids: NMR-based metabonomics of blood plasma. J Proteome Res. 2011;10(9):4314–4324. | ||
De LG, Paris D, Melck D, et al. Metabonomic analysis of exhaled breath condensate in adults by nuclear magnetic resonance spectroscopy. Eur Respir J. 2008;32(5):1175–1183. | ||
Sethi S, Mahler DA, Marcus P, Owen CA, Yawn B, Rennard S. Inflammation in COPD: implications for management. Am J Med. 2012;125(12):1162–1170. | ||
Nakano Y, Wong JC, de Jong PA, et al. The prediction of small airway dimensions using computed tomography. Am J Respir Crit Care Med. 2005;171(2):142–146. | ||
Perez T, Mal H, Aguilaniu B, et al. COPD and inflammation: statement from a French expert group. Phenotypes related to inflammation. Rev Mal Respir. 2011;28(2):192–215. | ||
Effenberger-Neidnicht K, Jägers J, Verhaegh R, de Groot H. Glycine selectively reduces intestinal injury during endotoxemia. J Surg Res. 2014;192(2):592–598. | ||
Jain M, Nilsson R, Sharma S, et al. Metabolite profiling identifies a key role for glycine in rapid cancer cell proliferation. Science. 2012;336(6084):1040–1044. | ||
Das UN. Pyruvate is an endogenous anti-inflammatory and anti-oxidant molecule. Med Sci Monit. 2006;12(5):RA79–RA84. | ||
Hirschhaeuser F, Sattler UGA, Muellerklieser W. Lactate: a metabolic key player in cancer. Cancer Res. 2011;71(22):6921. | ||
Mills E, O’Neill LAJ. Succinate: a metabolic signal in inflammation. Trends Cell Biol. 2014;24(5):313–320. | ||
Holmes E, Loo RL, Stamler J, et al. Human metabolic phenotype diversity and its association with diet and blood pressure. Nature. 2008;453(7193):396–400. |
 © 2017 The Author(s). This work is published and licensed by Dove Medical Press Limited. The
full terms of this license are available at https://www.dovepress.com/terms
and incorporate the Creative Commons Attribution
- Non Commercial (unported, 3.0) License.
By accessing the work you hereby accept the Terms. Non-commercial uses of the work are permitted
without any further permission from Dove Medical Press Limited, provided the work is properly
attributed. For permission for commercial use of this work, please see paragraphs 4.2 and 5 of our Terms.
© 2017 The Author(s). This work is published and licensed by Dove Medical Press Limited. The
full terms of this license are available at https://www.dovepress.com/terms
and incorporate the Creative Commons Attribution
- Non Commercial (unported, 3.0) License.
By accessing the work you hereby accept the Terms. Non-commercial uses of the work are permitted
without any further permission from Dove Medical Press Limited, provided the work is properly
attributed. For permission for commercial use of this work, please see paragraphs 4.2 and 5 of our Terms.