Back to Journals » Medical Devices: Evidence and Research » Volume 8
Measuring postural stability with an inertial sensor: validity and sensitivity
Authors Neville C, Ludlow C, Rieger B
Received 3 July 2015
Accepted for publication 18 August 2015
Published 5 November 2015 Volume 2015:8 Pages 447—455
DOI https://doi.org/10.2147/MDER.S91719
Checked for plagiarism Yes
Review by Single anonymous peer review
Peer reviewer comments 3
Editor who approved publication: Dr Scott Fraser
Christopher Neville,1 Caleb Ludlow,1 Brian Rieger2
1Department of Physical Therapy Education, 2Upstate Concussion Center, SUNY Upstate Medical University, Syracuse, NY, USA
Introduction/purpose: To examine the concurrent validity, and sensitivity, of an inertial sensor for use in the assessment of postural sway.
Methods: This was a laboratory-based, repeated-measures design with ten healthy participants. Concurrent validity was tested between an inertial sensor, forceplate, and rigid-body kinematics across three commonly used balance tests. Further, the inertial sensor measures were compared across eight commonly used tests of balance. Variables manipulated include stance position, surface condition, and eyes-open versus eyes-closed.
Results: The inertial sensor was correlated to both the forceplate-derived measures (r=0.793) and rigid-body kinematics (r=0.887). Significant differences between the balance tests were observed when tested with the inertial sensor. In general, there was a three-way interactions between the three balance factors (surface, stance, and vision) leading to pairwise comparisons between each balance test. The root-mean-square showed an increase across tasks of greater difficulty ranging from an average of 0.0368 with two legs, eyes-open to 0.911 when tested during tandem stance, eyes-closed tested on a foam pad.
Conclusion: The new inertial sensor shows promise for use in the assessment of postural sway. Additionally, the inertial sensor appears sensitive to differences in balance tasks of varying degrees of difficulty when tested in a healthy sample of young adults. This inertial sensor may provide new opportunities for further research in the assessment of balance changes in the mild traumatic brain injury population.
Keywords: balance, concussion, forceplate, posturography, accelerometer
Introduction
Postural sway has been described as the movement of the center of mass (COM) as one maintains upright balance and is measured across a wide range of clinical populations. These include patients with neurological disorders such as Parkinson’s disease,1,2 older adults at risk for falls,3 and patients with head injuries.4 Although laboratory-based measures of postural sway have been used for all of these patient populations, the development of portable and easy-to-use measures of balance may be particularly needed in the assessment of individuals with mild traumatic brain injuries (mTBIs) who are commonly assessed outside of the medical or research environments.5 It has been established that competitive football players who become concussed during a season are three times more likely to become concussed a second time within the same season as compared with nonconcussed teammates.6 There is concern that deficits in balance may be a contributing factor to these increased risks, although neurocognitive impairments such as decreased concentration or visual disturbances may also play a role.4,5,7 To assess deficits in balance, the use of newer inertial sensors may allow objective measurement of postural sway, usually completed using laboratory equipment, to become available in a portable system. This may be particularly valuable in the assessment of mTBI because these injuries are many times not managed in a doctor’s office but rather assessments are made at local schools or at an athletic venue (sideline). It remains a goal, and a challenge, to develop a device and output measures that are valid when compared with laboratory-based measures. Testing in healthy samples to establish validity and reliability is warranted before targeting patient populations such as those with mTBI.
In the research laboratory setting, measurement of postural sway is common using forceplates to record center of pressure (COP), while measuring movement of COM is less common but is also available using motion capture methods.8 Forceplates can be used to measure the COP of the ground reaction force.9 Measures of COP have been used to quantify how much sway is seen during a standing test. Movement of the COP has been shown sensitive in identifying older adults at risk for falls,9–11 individuals with Parkinson’s disease,2,12 and differences between standing conditions such as foot position (tandem stance versus feet together)13 or whether the eyes are open or closed.14 However, measuring the COP with a forceplate characterizes the response to maintain the COM within the base-of-support rather than measuring the actual movement of the COM.15 Interestingly, although forceplate-derived measures are the most widely reported, and thus a good measure for comparison, moderate correlations to an inertial sensor placed near the COM should be expected. Body-worn accelerometers, regardless of where they are placed, continue to be compared with forceplate-derived measures for validation with moderate to good correlations (intraclass correlation coefficient =0.55–0.86),1,16 while comparisons to kinematic movement has been reported less frequently and usually during a walking task.8 Further, advances in technology have suggested the use of inertial sensors containing three-axis accelerometers, magnetometers, and gyroscopes may provide even greater accuracy to detect movement. A clear advantage of inertial sensors over laboratory-based measures is lower cost and easy portability but metrics sensitive to balance differences still need exploration.
The assessment of postural stability requires devices and metrics that are sensitive to subtle differences that exist between individuals and between balance tasks. The interaction of three systems, vestibular, visual, and somatosensory, to control postural stability may warrant the need for a combination of metrics to capture deficits across patient populations with unique impairments. As the systems used to control balance are impaired, an increase in the amount of postural sway might be described in the time domain. However, in the frequency domain, the sway has been shown to decrease as balance tests increase in difficulty.17,18 The root-mean-square (RMS) is a time-domain measure, representing the average variance of a signal captured during a balance test.3,19 Frequency-domain measures such as the centroid frequency (CF) have also been described and are used to describe differences between patients with Parkinson’s disease and controls.1,2 Both time-domain and frequency-domain measures may provide insight into postural sway.
Although numerous clinical balance tests exist, perhaps the most widely used low-cost, portable test for postural stability is the balance error scoring system (BESS), which was designed to be easily and quickly completed “in-the-field” (not requiring a clinical or research setting or equipment).20 The BESS manipulates the support surface (foam and firm) and the base of support (single-leg, double-leg, and tandem stance position) across six tasks that are completed with the eyes-closed. Adapted from laboratory-based tests that require equipment including the sensory organization tests,21 the BESS includes the more difficult tasks (single-leg and tandem stance on a foam pad with eyes-closed) to facilitate scoring through visual observation of each time the participants lose their balance. The BESS is clearly more portable, cost-effective, and easier to administer than equipment-based tests, but evidence regarding its validity and reliability are mixed.13,20,22,23 The use of portable technology may improve the known issues of reliability and inherent problems with sensitivity/specificity reported with the BESS. Chang et al13 used a Wii Balance Board to quantify COP movement and found improved reliability and validity compared with the BESS. Further investigation with portable technology may not only improve reliability and validity but allow investigation of more subtle effects removed from the BESS such as testing conditions with the eyes-open versus eyes-closed. The use of portable sensors to measure postural sway may improve early detection of mTBI, which may otherwise go unnoticed using a qualitative test that relies on visual observation.
The purpose of this study was to assess the validity and sensitivity of an inertial sensor to measure postural sway. This purpose was undertaken in a healthy control group before future work could target patient populations. To address this purpose, the study included two parts: part I, to assess the validity of the sensor against known measures, and part II, to assess the sensitivity of the sensor to detect differences in postural sway across varied test conditions. Part I was a study of concurrent validity comparing the inertial sensor to forceplate-derived measures of acceleration and rigid-body measures of motion. Part II was to assess if differences in metrics of postural stability measured with the inertial sensor would be identified across a set of balance tests. The balance tests were chosen to capture differences that vision, vestibular, and somatosensory input could have on postural stability. In part I, it was hypothesized that the inertial sensor would be significantly correlated to concurrent measures of postural stability (forceplate and rigid-body motion) with higher correlations to rigid-body motion compared with forceplate-derived measures. In part II, it was hypothesized that differences between conditions commonly used in the clinical assessment of postural stability would be significantly different when measured with the inertial sensor.
Methods
Subjects
Ten subjects between the ages of 20 and 34 volunteered to participate in the study. The study was approved by the Institutional Review Board at Upstate Medical University, and all subjects gave written informed consent before participation. The subjects included three males and seven females with an average height, weight, and BMI of 171.7±7.0 cm, 67.4±8.4 kg, 23.3±1.5 kg/m2, respectively. All subjects were free of any history of neurological or orthopedic injuries that might impact their postural stability including any past injury such as mTBI. The subjects were all deemed healthy with no current complaints of pain, weakness, or balance deficits and were not currently taking any medication that was thought to potentially influence postural stability.
Protocol
For all of the study procedures, subjects were asked to complete balance tests without shoes and instructed to maintain an upright standing position while being as still as possible. Forceplate data were collected at 1080 Hz using a Kistler model 9287B (Buffalo, NY, USA) forceplate, while the kinematic data were collected at 120 Hz using a 12-camera VICON 512 motion capture system (Vicon Motion Systems, Los Angeles, CA, USA) and workstation software (version 4.6; Vicon Motion Systems). The kinematic data were captured from a set of three retro-reflective markers rigidly attached to a thermoplastic base. The base was taped to the inertial sensor case, which was securely fastened via a belt to the subject’s trunk. A local orthogonal coordinate system was assigned to the rigid-body maker set for tracking the linear and rotational movement. The inertial sensor (Motion Intelligence, Inc., Ithaca, NY, USA) was positioned on a belt and secured tightly on the posterior trunk at the level of L5, near the body’s COM. Data from the inertial sensor were output at 250 Hz for 3D linear and angular acceleration (±1.7 g’s range).
The kinematic and forceplate data were postprocessed using The Motion Monitor software (Version 8.78; Innsport Inc., Chicago, IL, USA) and output for further analysis using a custom MATLAB program (MathWorks, Natick, MA, USA). The inertial sensor data in each axis were converted from grams to meter per second squared. The acceleration due to gravity (estimated as 9.81 m/s2) and any sensor bias were then subtracted before the signal was filtered using a low-pass, first-order Butterworth filter with a 20 Hz cutoff frequency. The magnitude of acceleration was calculated as follows:

where Avm is the acceleration vector magnitude, Ax the component of linear acceleration as measured along the x-axis, Ay the component of linear acceleration as measured along the y-axis, and Az the component of linear acceleration as measured along the z-axis.
The inertial sensor data were then interpolated using a MATLAB Piecewise cubic interpolation function, resulting in data at 1080 samples per second, consistent with the sampling rate of the forceplate form.
For the rigid-body motion data, the displacement data were twice differentiated and then filtered using a low-pass, first-order Butterworth filter with a 4 Hz cutoff frequency. The filtered data were interpolated and acceleration magnitude was calculated in the same manner as the inertial sensor data. The forceplate data were scaled from its voltage output to force in Newton. Channel data were summed to derive force in the x-axis, force in the y-axis, and force in the z-axis. The mass of the test subject was calculated as the mean force in the z-axis (vertical) divided by gravitational acceleration (9.81 m/s2). The force in each axis was then divided by this calculated mass to derive acceleration in each direction. The acceleration magnitude was calculated in the same manner as the inertial sensor data with no interpolation required.
Study procedures – part I
In part I of the study, to determine concurrent validity, each participant was asked to perform three separate balance test conditions each held for 30 seconds, in random order, while data from a forceplate, kinematics from a motion capture system, and data from the inertial sensor were concurrently collected. All balance tests were completed in a motion analysis laboratory standing in the center of the room on an in-floor imbedded forceplate. The three balance tasks were chosen to represent the various conditions typically tested across a balance assessment (vision, size of the base of support, and support surface). The three tasks included 1) standing on two feet with medial malleoli touching, hands on hips, with eyes-open; 2) tandem stance (dominant foot forward), hands on hips, with eyes-closed; and 3) tandem stance (dominant foot forward), hands on hips, with eyes-open, on a foam pad. Data from all three devices (inertial sensor, forceplate, and rigid-body motion) were synchronized programmatically, post-collection, using MATLAB by calculating the cross-correlation between the three signals while completing five mini-hops at the beginning and end of each of the three balance tasks. Once synchronized, the beginning and end of each balance test (including the mini-hops and 5 seconds of static standing on either end) was removed leaving 20 seconds of balance data, which were output for statistical analysis. The RMS was output from each of the devices acceleration output (acceleration from the inertial measurement unit, differentiated acceleration from the rigid-body motion, and calculated acceleration of the COP movement from the forceplate) to represent the magnitude of the variability seen recorded from each condition. The RMS was calculated using the following equation:
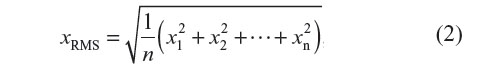
where xRMS is the root-mean-square, n the number of samples, and x each sample value correspondingly (1, 2, 3, etc).
Study procedures – part II
In part II of the study, to determine the inertial sensors’ sensitivity between differing balance tasks, subjects were asked to complete an expanded series of eight balance tasks chosen to challenge their balance while wearing only the inertial sensor. The eight balance tests were again completed in a motion analysis laboratory under controlled condition that limited distractions and lasted 30 seconds each. The eight balance tasks included the following:
- standing with feet together, hands on hips, with eyes-open (TLEO);
- standing with feet together, hands on hips, with eyes-closed (TLEC);
- tandem stance (dominant foot forward), hands on hips, with eyes-open (TSEO);
- tandem stance (dominant foot forward), hands on hips, with eyes-closed (TSEC);
- standing with feet together, hands on hips, with eyes-open, on a foam pad (TLEOfp);
- standing with feet together, hands on hips, with eyes-closed, on a foam pad (TLECfp);
- tandem stance (dominant foot forward), hands on hips, with eyes-open, on a foam pad (TSEOfp); and
- tandem stance (dominant foot forward), hands on hips, with eyes-open, on a foam pad (TSECfp).
From each of the balance tasks, two output variables were compared. In the time domain, the RMS, representing the magnitude of the variability in acceleration, was compared between conditions. Second, in the frequency domain, the spectral CF was compared as a measure of the frequency of the signal. The spectral centroid measure, calculated in the frequency domain, was not filtered but calculated from the raw 250 Hz data. The spectral centroid is used to characterize the weighted mean of the frequencies present in the inertial sensor signal. Spectral centroid was calculated using the following equation:
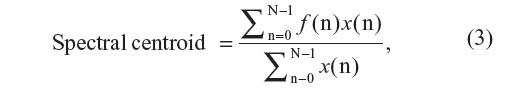
where x(n) is the weighted frequency value, or magnitude, of bin number n, and f(n) represents the center frequency of this bin.
Data analysis
In part I of the study (validity), the three balance conditions were combined, and bivariate correlations between the forceplate, rigid-body motion, and inertial sensor measures were completed using a Pearson correlation. Significance level was set at the alpha <0.05. The r values and r2 values were reported to represent the amount of correlation (r value) between the measures and amount of shared variance (r2). Although it was expected that the inertial sensor and motion capture outputs would be highly correlated, the current correlation analysis was chosen to allow for any numerical errors introduced by the double differentiation of the marker trajectories and to allow comparison with the forceplate analysis. In part II of the study (sensitivity), a three-way analysis of variance model was used to compare the three balance factors (stance – feet together and tandem, surface – firm and foam, and vision – eyes-open and eyes-closed) and repeated for each variable (RMS and spectral centroid). In the event of a significant interaction, main effects were ignored, and pairwise comparisons between balance tests were explored using a Bonferroni correction for multiple comparisons.
Results
Part I – concurrent validity
Across the conditions tested, the inertial sensor was significantly (P<0.001) correlated with the forceplate (r=0.79) and significantly (P<0.001) correlated with the rigid-body movement of L4–L5 segment (r=0.88; Figures 1 and 2).
 | Figure 1 Correlation between the inertial sensor and forceplate. |
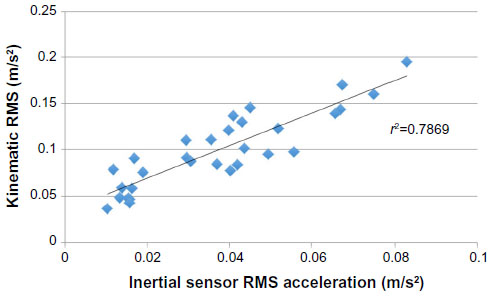 | Figure 2 Correlation between the inertial sensor and rigid-body motion. |
Part II – sensitivity
There was a significant (P<0.001) main effect for condition for the RMS and spectral centroid measure. A main effect for each factor (stance, surface, and vision) was observed (Table 1), while two-way interactions and three-way interactions between the factors were also observed. The three-way interaction between stance, surface, and vision was significant (P=0.006) and allowed post hoc comparisons between each of the balance tests. These comparisons are included in Table 2.
 | Table 1 Three-way ANOVA between the three balance factors (stance, vision, and surface) |
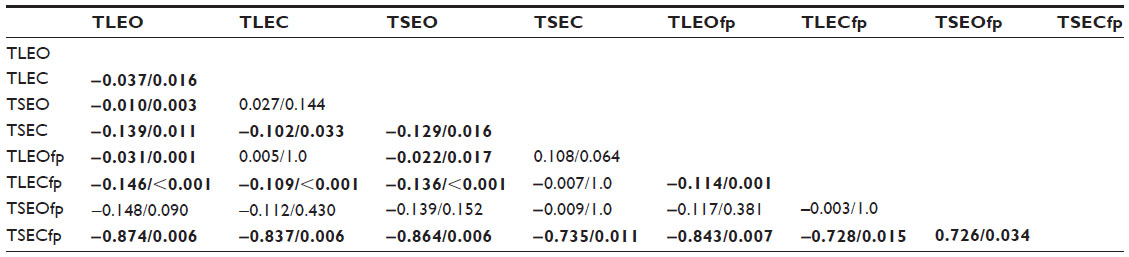 | Table 2 Pairwise comparisons between balance tests |
Discussion
New to this study is the validation of an inertial sensor with forceplate-derived measures and kinematic motion. Although accelerometers have been already validated, validation to forceplate and rigid-body motion is rare, and newer inertial sensor technology may improve sensitivity and precision of the measurement. As hypothesized, there were strong correlations between the inertial sensor and forceplate and even higher correlations between the inertial sensor and kinematics. Additionally, the RMS of the inertial sensor showed an expected increase across successively more challenging balance tasks. Interestingly, the frequency of the motion decreased across the successively more challenging balance tasks. The use of an inertial sensor to assess balance may have utility across various patient populations but particularly in those with mTBI that are typically initially assessed outside of the research or clinical environment, such as athletic facilities for student-athletes or combat arenas for soldiers. Validity when compared with laboratory-based measures and sensitivity to balance conditions that manipulate vision, proprioception, and vestibular control of balance is a first step in using inertial sensors more widely.
It was hypothesized there would be a higher correlation between the inertial sensor and kinematic measures compared with forceplate-derived measures. There was 63% (r=0.79) of the variance in forceplate measures and 79% (r=0.89) of the variance in kinematic measures explained by the inertial sensor. Mancini et al1 reported a correlation of 0.74 when comparing a three-axis accelerometer, also affixed around the waist, with forceplate measures of RMS, which is quite comparable with our results (r=0.79) using the inertial sensor. Perhaps the small increase in the correlation is due to the use of the inertial sensor but may also be secondary to variance from another sample of subjects. The strength of these correlations could be interpreted as strong across the range of 0.7–0.9.24 Other studies have reported correlations ranging from 0.36 to 0.80 when using either dual-axis accelerometers or testing only one balance test.14,25 We hypothesized greater correlations with kinematic measures in this study because correlation between forces and moments measured under the foot likely correlate with movement of the COM, but these are inherently different measures.15 This perhaps explains the generally moderate correlations in the 0.70–0.79 range across this and other studies.1,26,27 In addition, comparisons between low-cost Nintendo Wii Boards and laboratory grade forceplates are correlated at 0.99, as reported by Chang et al13 when the construct being measured (forces under the feet) is the same. Our higher correlation (0.89) to kinematic movement is expected with the closer measurement construct of kinematic movement between both systems (motion analysis and inertial sensor). Further, some of the variance not shared is due to simple numerical error from the differentiation of the kinematic movement to acceleration and not due to failure of the inertial sensor to accurately measure the motion.
A general increase in RMS across the eight balance tasks was hypothesized due to the increasing difficulty of the tests as the systems used to control balance are increasingly manipulated (Figure 3). This is consistent with the expectation that as our balance is challenged, the amount of movement would increase (increased postural sway). Experimental evidence supports that healthy humans can maintain balance even under conditions of impaired visual, somatosensory, or vestibular input, but the exact mechanism the central nervous system uses to filter these senses is unclear.28 Speculation on if there is a dominance of one of the senses for an individual, or patient population, has been of particular interest.29 However, it is still unclear if there are patterns to how a person synthesizes input from vision, somatosensory, and vestibular senses under various manipulated conditions. Further, there is evidence that sensorimotor integration and learning may occur over time suggesting that loss of a sense used for balance control may change as an individual adapts to loss.30,31 The conditions that have been manipulated attempt to provide insight into patterns, such as comparing eyes-open to eyes-closed in the presence of a visual disturbance. Additionally, vestibular has been compared by examining tandem stance with two legs and somatosensory by comparing foam-pad with nonfoam-pad conditions. Although it is clear that while vision is easily tested with eyes-open, eyes-closed conditions, the manipulation of conditions for the vestibular and somatosensory systems is much less robust (ie, they are only attempts to challenge these systems). The data from this study suggest, when comparing TLEC with TLEO, there is a 26% increase in RMS (0.046–0.037=0.009) from the baseline TLEO condition (Figure 2). This increase may be attributed to a vision compromised response. When comparing TSEO with TLEO, the data show an 84% increase in RMS and TLEOfp with TLEO, a 100% increase in RMS, as comparisons of vestibular and somatosensory, respectively. These findings suggest effects of limiting our somatosensory senses with the foam pad have the largest effect on postural sway. Moreover, combined challenges to these senses further increase these effects, such as comparing TSEC-TLEO resulting in a 403% increase in RMS when challenging vision and vestibular senses or TLECfp-TLEO resulting in a 378% increase in RMS when challenging vision and somatosensory senses. These comparisons are only explored here as examples while others may suggest they provide insight into the compensation of the remaining systems. It remains a topic of future study if impairments in particular sensory systems are likely to lead to changes in these patterns such as the effect of ankle sprains that may limit the somatosensory input at the ankle or vestibular dysfunction limiting input from the vestibular system.
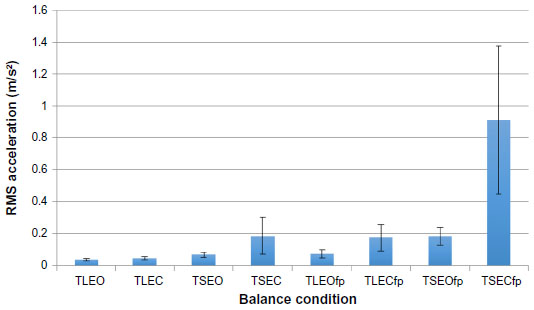 | Figure 3 The magnitude of dispersion (RMS) for the inertial sensor across eight balance tests. |
Overall, the CF varied inversely with the RMS such that as sway increased across progressively harder tasks, the frequency of the movement decreased (Figure 4). A decrease in the frequency of movement as balance input (vision, vestibular, and somatosensory) is removed suggests the loss of input leads to slower responses. In studies where balance has been tested with the eyes-open and eyes-closed, the removal of visual input is associated with a reduced frequency response.2,18,32 Although the decease in frequency across the tasks tested in this study can be compared with other studies, the magnitude of the frequency is quite dependent on the data collection frequency, equipment, signal processing procedures, and tasks tested. For example, in a control group of subjects standing with feet apart and arms crossed, Mancini et al1 reported a mean CF of 0.722 Hz, with data collected at 50 Hz and low-pass filtered at 3.5 Hz. Our most similar task, TLEO, has a mean CF of 57.9 Hz when collected at 250 Hz with no filtering when calculating the CF. Additional differences between the hardware (three-axis accelerometer versus the inertial sensor with three-axis accelerometer, gyroscope, and magnetometer) may also play a role. It is likely that postural stability is modulated at a low frequency (under 5 Hz), but this modulation influences the CF processed in this study at 250 Hz making the CF higher but representative of differences between the balance conditions. The CF showed the same pattern between tasks with the same significant pairwise comparisons as the RMS. In addition, it may be interesting to consider the tasks that do not result in differences such as TSEO and TLEOfp. This would suggest that manipulation of the base of support to challenge the vestibular system can be compared to challenges to the somatosensory system through the use of the foam pad. Clearly, this pattern of balance responses, in both the frequency of movement and amount of movement, is representative of this healthy sample, while patient populations may show different profiles.
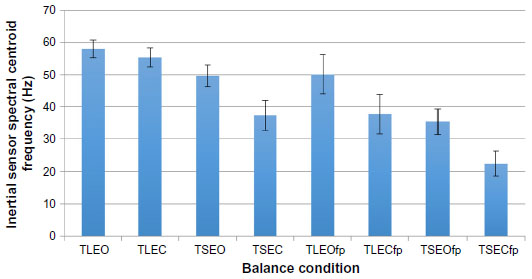 | Figure 4 Centroid frequency of the inertial sensor acceleration across the eight balance tests. |
This study has examined the validity and sensitivity of a new inertial sensor for the assessment of postural stability with strong correlations to other laboratory-based measures and sensitivity to different balance test. These findings should be interpreted with an understanding of the study limitations. The correlations between the inertial sensor and laboratory-based measures are dependent on the balance tasks included and hardware used. In a study using a three-axis accelerometer and comparing single-leg stance only, correlations to a forceplate ranged from 0.36 to 0.75.25 While using a dual-axis accelerometer and testing six different standing conditions, correlations ranged from 0.38 to 0.80.14 We chose to compare TLEO, TSEC, and TSEOfp for correlations between the inertial sensor and forceplate to include tests that are common and challenge each of the control mechanisms used for postural stability. Choosing other tasks may yield different results, especially considering the high sensitivity of correlation coefficients to variance in the measure of interest. Additionally, numerous metrics have been used to describe postural sway including RMS and CF as used in this study. The metrics used, signal processing algorithms, and calculations all may influence the findings in this study and should be considered when comparing results from this study to other studies.
Conclusion
The use of a portable inertial sensor shows promise for providing valid and sensitive metrics of postural sway to that collected using laboratory-based research equipment. Further studies are needed to determine the reliability of this technology and if these metrics are sensitive to other factor such as mTBI or balance disturbances due to aging. However, sensitivity to different balance tasks suggests that the inertial sensor may be an easy-to-use, portable technology, to use in the assessment of postural sway.
Acknowledgments
Research reported in this publication was solely the responsibility of the authors. The inertial sensors used in the study were provided by Motion Intelligence, Inc. (Ithaca, NY), and Upstate Medical University and Motion Intelligence, Inc. provided financial support of the clinical research.
Disclosure
The authors Christopher Neville and Brian Rieger have equity interest in Motion Intelligence, Inc. The authors report no other conflicts of interest in this work.
References
Mancini M, Salarian A, Carlson-Kuhta P, et al. ISway: a sensitive, valid and reliable measure of postural control. J Neuroeng Rehabil. 2012;9:59. | |
Palmerini L, Rocchi L, Mellone S, Valzania F, Chiari L. Feature selection for accelerometer-based posture analysis in Parkinson’s disease. IEEE Trans Inf Technol Biomed. 2011;15(3):481–490. | |
Doheny EP, McGrath D, Greene BR, et al. Displacement of centre of mass during quiet standing assessed using accelerometry in older fallers and non-fallers. Conf Proc IEEE Eng Med Biol Soc. 2012;2012: 3300–3303. | |
Catena RD, van Donkelaar P, Chou LS. Altered balance control following concussion is better detected with an attention test during gait. Gait Posture. 2007;25(3):406–411. | |
Guskiewicz KM. Postural stability assessment following concussion: one piece of the puzzle. Clin J Sport Med. 2001;11(3):182–189. | |
Guskiewicz KM, Weaver NL, Padua DA, Garrett WE Jr. Epidemiology of concussion in collegiate and high school football players. Am J Sports Med. 2000;28(5):643–650. | |
Guskiewicz KM. Assessment of postural stability following sport-related concussion. Curr Sports Med Rep. 2003;2(1):24–30. | |
Kaufman KR, Brey RH, Chou LS, Rabatin A, Brown AW, Basford JR. Comparison of subjective and objective measurements of balance disorders following traumatic brain injury. Med Eng Phys. 2006;28(3):234–239. | |
Piirtola M, Era P. Force platform measurements as predictors of falls among older people – a review. Gerontology. 2006;52(1):1–16. | |
Jorgensen MG. Assessment of postural balance in community-dwelling older adults – methodological aspects and effects of biofeedback-based Nintendo Wii training. Dan Med J. 2014;61(1):B4775. | |
Maki BE, Holliday PJ, Topper AK. A prospective study of postural balance and risk of falling in an ambulatory and independent elderly population. J Gerontol. 1994;49(2):M72–M84. | |
Mancini M, Carlson-Kuhta P, Zampieri C, Nutt JG, Chiari L, Horak FB. Postural sway as a marker of progression in Parkinson’s disease: a pilot longitudinal study. Gait Posture. 2012;36(3):471–476. | |
Chang JO, Levy SS, Seay SW, Goble DJ. An alternative to the balance error scoring system: using a low-cost balance board to improve the validity/reliability of sports-related concussion balance testing. Clin J Sport Med. 2014;24(3):256–262. | |
Whitney SL, Roche JL, Marchetti GF, et al. A comparison of accelerometry and center of pressure measures during computerized dynamic posturography: a measure of balance. Gait Posture. 2011;33(4):594–599. | |
Winter DA, Patla AE, Frank JS. Assessment of balance control in humans. Med Prog Technol. 1995;16(1–2):31–51. | |
Seimetz C, Tan D, Katayama R, Lockhart T. A comparison between methods of measuring postrual stability: force plates versus accelerometers. Biomed Sci Instrum. 2012;48:386–392. | |
Bonfim TR, Grossi DB, Paccola CA, Barela JA. Additional sensory information reduces body sway of individuals with anterior cruciate ligament injury. Neurosci Lett. 2008;441(3):257–260. | |
Moe-Nilssen R, Helbostad JL. Trunk accelerometry as a measure of balance control during quiet standing. Gait Posture. 2002;16(1):60–68. | |
O’Sullivan M, Blake C, Cunningham C, Boyle G, Finucane C. Correlation of accelerometry with clinical balance tests in older fallers and non-fallers. Age Ageing. 2009;38(3):308–313. | |
Furman GR, Lin CC, Bellanca JL, Marchetti GF, Collins MW, Whitney SL. Comparison of the balance accelerometer measure and balance error scoring system in adolescent concussions in sports. Am J Sports Med. 2013;41(6):1404–1410. | |
Chaudhry H, Findley T, Quigley KS, et al. Measures of postural stability. J Rehabil Res Dev. 2004;41(5):713–720. | |
Bell DR, Guskiewicz KM, Clark MA, Padua DA. Systematic review of the balance error scoring system. Sports Health. 2011;3(3):287–295. | |
King LA, Horak FB, Mancini M, et al. Instrumenting the balance error scoring system for use with patients reporting persistent balance problems after mild traumatic brain injury. Arch Phys Med Rehabil. 2014;95(2):353–359. | |
Cicchetti DV. The precision of reliability and validity estimates re-visited: distinguishing between clinical and statistical significance of sample size requirements. J Clin Exp Neuropsychol. 2001;23(5):695–700. | |
Adlerton AK, Moritz U, Moe-Nilssen R. Forceplate and accelerometer measures for evaluating the effect of muscle fatigue on postural control during one-legged stance. Physiother Res Int. 2003;8(4):187–199. | |
Baltich J, von Tscharner V, Zandiyeh P, Nigg BM. Quantification and reliability of center of pressure movement during balance tasks of varying difficulty. Gait Posture. 2014;40(2):327–329. | |
Moe-Nilssen R. Test-retest reliability of trunk accelerometry during standing and walking. Arch Phys Med Rehabil. 1998;79(11):1377–1385. | |
McCollum G, Shupert CL, Nashner LM. Organizing sensory information for postural control in altered sensory environments. J Theor Biol. 1996;180(3):257–270. | |
Nashner LM. A model describing vestibular detection of body sway motion. Acta Otolaryngol. 1971;72(6):429–436. | |
McCall AA, Yates BJ. Compensation following bilateral vestibular damage. Front Neurol. 2011;2:88. | |
Pereira T, Abreu AM, Castro-Caldas A. Understanding task- and expertise-specific motor acquisition and motor memory formation and consolidation. Percept Mot Skills. 2013;117(1):1150–1171. | |
Schumann T, Redfern MS, Furman JM, el-Jaroudi A, Chaparro LF. Time-frequency analysis of postural sway. J Biomech. 1995;28(5):603–607. |
 © 2015 The Author(s). This work is published and licensed by Dove Medical Press Limited. The
full terms of this license are available at https://www.dovepress.com/terms
and incorporate the Creative Commons Attribution
- Non Commercial (unported, 3.0) License.
By accessing the work you hereby accept the Terms. Non-commercial uses of the work are permitted
without any further permission from Dove Medical Press Limited, provided the work is properly
attributed. For permission for commercial use of this work, please see paragraphs 4.2 and 5 of our Terms.
© 2015 The Author(s). This work is published and licensed by Dove Medical Press Limited. The
full terms of this license are available at https://www.dovepress.com/terms
and incorporate the Creative Commons Attribution
- Non Commercial (unported, 3.0) License.
By accessing the work you hereby accept the Terms. Non-commercial uses of the work are permitted
without any further permission from Dove Medical Press Limited, provided the work is properly
attributed. For permission for commercial use of this work, please see paragraphs 4.2 and 5 of our Terms.