Back to Journals » Psychology Research and Behavior Management » Volume 16
Measuring Personality Systems in Older Adults: Age-Neutrality of the Dutch BIS/BAS Questionnaire
Authors Derksen SA ![]() , Brancart X, Rossi G
, Brancart X, Rossi G
Received 22 October 2022
Accepted for publication 28 February 2023
Published 23 March 2023 Volume 2023:16 Pages 949—961
DOI https://doi.org/10.2147/PRBM.S394510
Checked for plagiarism Yes
Review by Single anonymous peer review
Peer reviewer comments 2
Editor who approved publication: Dr Igor Elman
Sophie A Derksen, Xenia Brancart, Gina Rossi
Department of Psychology, Personality and Psychopathology Research Group (PEPS), Vrije Universiteit Brussel (VUB), Brussels, Belgium
Correspondence: Sophie A Derksen, PE-PEPS, Vrije Universiteit Brussel (VUB), Pleinlaan 2, Brussels, 1050, Belgium, Email [email protected]
Introduction: With a rapidly aging population, age-neutrality of psychological instruments is becoming ever more important for accurate assessment of older adults. This study aims to test the age-neutrality of the Dutch Behavioral Inhibition System/Behavioral Approach System (BIS/BAS) scales by means of Differential Item Functioning (DIF) and Differential Test Functioning (DTF) analyses.
Methods: DIF and DTF analyses were conducted using an odds ratio approach. Potential DIF was examined for the two primary scales and three BAS subscales in 390 Dutch-speaking participants divided over three age groups.
Results: Overall, the BIS-BAS scales lacked age-neutrality when comparing older adults to young adults: eight out of 20 items (ie, 40%) displayed DIF according to the adjusted Bonferroni corrected cut-offs, which exceeds the threshold of 25% for large DIF. Thus, for 40% of the test items, items were differently endorsed by young and older adults with the same position on the construct measured by the item. Therefore, the implications of the item-level DIF on the scale level were investigated across age groups. DTF analyses revealed large DTF for all BIS and BAS scales according to the adjusted Bonferroni corrected cut-offs.
Discussion: DIF found in items on the BIS scale and BAS-Drive and BAS-Fun Seeking scale can probably be explained by a difference in degree of expression across age groups. A solution could be the development of age-specific norms. DIF on BAS-Reward Responsiveness subscale could be partly due to measuring a different construct across age groups. Rephrasing or replacing such items with DIF may increase age-neutrality of the BIS/BAS Scales.
Keywords: older adults, BIS/BAS questionnaire, personality, assessment, differential item functioning
Introduction
Relevance of Accurate Assessment in Older Adults
The group of adults aged 65 years or older is rapidly growing in Europe. In 2018, this group made up 19.7% of the total population in the European Union (EU; current EU27 countries plus the United Kingdom).1 In Belgium, 19.18% of the population were over 65 in 2019.2 In the Dutch-speaking part of Belgium, Flanders, whose population will be the main focus of the current study, this was even higher at 20,47%. By 2035, the 65+ group is predicted to make up more than a quarter of the total EU population (25,9%) and 23,3% of the Belgian population.3 This is both caused by increasing life expectancy as well as the so-called baby-boom generation entering this stage of life. Projections towards 2100 show this age group will even grow to be almost one-third of the EU population (31.3%).1 For consistency, people in this age group will be referred to as older adults from this point onwards, as this is the term that is commonly used by psychologists specialized in gerontology and is recommended by the American Psychological Association.4
In psychological research, this group is regularly overlooked, especially when developing personality tests and classification systems. As Rossi et al (p. 937) state,
until now, classification systems typically focused on younger adults as prototypes. For example, the Diagnostic and Statistical Manual of Mental Disorders 4th edition (DSM-IV-TR) and DSM-5 did not give specific attention to older adults when developing their sections on PDs [personality disorders].5–7
The same holds true for the development of psychological questionnaires. These are mostly validated using participants in the age group of 20 to 45, so these instruments possibly ignore the specific later life context of older adults in the manifestation of traits being measured. For example, physical impairments and/or changed social circumstances can make certain behaviors less likely. Consequently, the frequent lack of psychometric evidence of instruments for this age-group often leaves clinicians no choice but to rely on instruments that have been developed for and with younger adults.8 This, combined with the reality that the number of older adults is growing and will soon make up one-fourth of the European population, means we can no longer ignore this group in psychological research and instruments measuring personality need to be validated for their usefulness in this group.
The Behavioral Inhibition and Behavioral Approach System Scales
This study will focus on the Behavioral Inhibition System/Behavioral Approach System (BIS/BAS) Scales.9 This is a regularly used questionnaire to measure personality across age groups. However, the BIS/BAS Scales are yet to be tested for their age-neutrality. The aim of this study is to examine whether the Dutch translation10 of the questionnaire measures the same underlying traits across age groups. The terms BIS and BAS were coined by Gray and are part of his biopsychosocial theory of personality, the Reinforcement Sensitivity Theory. According to Gray,11 two basic mechanisms control human behavior. The first mechanism is the Behavioral Inhibition System (BIS). The BIS is activated by conditioned stimuli associated with punishment or with the omission/termination of reward, and novel stimuli,11 meaning this system can predict someone’s reaction to cues that are anxiety-related. People who score high on BIS are motivated by avoiding punishment and have been shown to experience more negative affect and anxiety.12 The second is the Behavioral Activation System (BAS), also known as Behavioral Approach System. This system is in charge of appetitive motivation. As Gray explains:11
This system represents a positive feedback mechanism that is activated by stimuli associated with reward or omission/termination of punishment in order to guide the organism to appetitive stimuli (p. 25).
In other words, it represents a person’s disposition to pursue and achieve goals. High BAS in people has been linked to experiencing more positive affect.13 Gray’s definitions of BIS and BAS are conceptually similar to the widely used Psychobiological Model of Temperament and Character.14,15 This theory describes that temperament and character together shape personality. Temperament is innate and resistant to change, and character is shaped by experiences. Temperament involves basic emotional reactive patterns where Cloninger et al14 distinguishes 4 dimensions: novelty seeking (NS), harm avoidance (HA), reward dependence (RD) and persistence (P).14 Research by Mardaga and Hansenne16 confirmed the relationship between the two models showing that HA and RD predict BIS and NS and P predict BAS.16 Research has also repeatedly shown that there is a positive association between BIS/BAS and the Big Five personality dimensions Neuroticism and Extraversion.17,18 BIS can predict Neuroticism, which can be explained by the fact that BIS and Neuroticism share the same underlying feature of negative emotional sensitivity. BAS, on the other hand, has proven to predict Extraversion as both BAS and Extraversion have the underlying feature of a tendency to approach and positive affect.
Research on the BIS/BAS scales including older adults is very scarce, and to our knowledge limited to two studies up to date. Jorm et al17 did take the population of older adults into account when testing the psychometric properties of the original English version of the BIS/BAS Scales (age range 18–79) in an Australian community sample. However, they did not specifically focus on psychometric properties of the instrument in older adults, such as factor structure or nomological net. Jorm et al17 did compare mean scores across ages and found that older adults scored lower on both BIS and BAS. The results also showed larger standard deviations for the BAS scale and its subscales. The researchers hypothesize that this could suggest
the emotional systems measured by the BIS/BAS become less responsive with age (p. 56).17
As for the larger standard deviations, these findings are consistent with evidence found by Nelson and Dannefer.19 When conducting a large review of gerontological studies, they found that older age groups show increased diversity. This increased variability emerged across physical, cognitive and personality domains, including personality characteristics.19 However, as Jorm et al17 did not test for age-neutrality of the BIS/BAS scales, these results could also be due to inaccurate assessment in certain age groups instead of reflecting true age group differences. A very recent study by Dierickx et al20 did look into construct validity of the Dutch BIS/BAS Scales specifically for older adults. The results showed that internal consistencies of the scales were generally satisfactory. The study also examined the factor structure and confirmed that the four-factor structure (BIS and three BAS subscales) was a significantly better fit than a two-factor structure (BIS and BAS), suggesting that BAS is indeed a multidimensional construct. One remark regarding the factor structure is that four items in this study did not load as expected. Two items showed cross loadings (B14 “When I see an opportunity for something I like I get excited right away” and B22 ‘I have very few fears compared to my friends’). The authors suggest that these unexpected loadings could be due to a partial overlap in the underlying constructs measured in the subscales, thus do not consider this a specific problem due to the older age context. Yet two items did not load on their designated factor (B5 “I’m always willing to try something new if I think it will be fun” and B7 “When I get something I want, I feel excited and energized”), indicating possible construct differences in older adults compared to the younger adult group of the original validation study.10 Item B7 belongs to the BAS Reward Responsiveness scale but loaded on the BAS Fun Seeking scale. Item B5 belongs to the BAS Fun Seeking scale but loaded to the BAS Reward Responsiveness scale. Dierickx et al20 also examined nomological net and found results that are congruent with the existing literature. Based on these results, Dierickx et al20 conclude that the construct validity of the Dutch BIS/BAS Scales is sufficient and thus deemed a useful instrument for measuring Gray’s theory of personality in older adults. Initial evidence points towards construct validity in older adults, as construct validity over age groups is corroborated by the factor structure (with the exception of two items having unexpected loadings) and results regarding scale correlations with external measures. However, this does not necessarily mean that the instrument is age neutral, because there may still be differences in the extent to which certain age groups identify items as applicable to them, resulting in differential item functioning (DIF). As Debast et al21 argue
items with DIF in these scales are still possibly related to the same underlying constructs over age-groups, yet that younger and older adults do show differences in degree of expression, and thereby result in measurement variance over age-groups (p. 318).
Age-Neutrality versus Differential Item Functioning for the BIS/BAS Scales
A method to test age neutrality is DIF. DIF is present when important subgroups, for example older and younger age groups, with the same amount of the measured trait do not have the same probability of responding in the keyed direction to an item. DIF can occur when age groups are ignored in testing the validity of psychological instruments. DIF can be understood as the risk that certain items might not be measuring the trait adequately in subgroups. This can, for example, be due to lack of construct validity in a subgroup or due to the fact that an item does not adequately capture the degree a trait is present across subgroups. The same underlying trait could thus elicit a different item response for different subgroups. When 25% of the items or more show DIF, the test as a whole is considered biased. Impact of DIF items on scales within the test can be evaluated with Differential Test Functioning (DTF). DTF examines the variance of DIF effect of items within a scale. If a scale shows DTF, scale scores cannot be used to accurately compare subgroups on presence of the measured trait.22
In the case of older adults, DIF/DTF could occur because tests are developed with younger adults in mind. Thus, they ignore later life context, in which, for example, physical health and independence may have declined. This causes older adults, for example, to manifest less spontaneous behavior and consequently influences how certain items are endorsed. When DIF occurs in an instrument due to age differences, the instrument lacks age-neutrality. An instrument is age-neutral when there is little variance on item response across age groups, meaning the instrument is measuring the intended constructs and not age-group-related differences. In summary, age-neutrality is important for the validity of the instrument and for correctly assessing older adults.
Dong and Dumas23 performed a meta-analysis, comparing personality measures for measurement invariance across age, gender and culture. In this analysis, they also looked at DIF for age specifically.23 Of the nine instruments that were tested for DIF regarding age, all nine showed some level of DIF and three instruments showed DIF for more than 20% of their items. In their analysis, Dong and Dumas23 were dependent on the discrete age groups chosen by the original researchers, so it is unclear if older adults were taken as a separate age group for all nine studies, but it does show that age-neutrality of a personality measure is not a given.23
More importantly, differential item functioning can also be found at scale level. In this case, some instruments could be age neutral overall (ie, not surpass the threshold of 25% for DIF), but still include scales that show differential test functioning (DTF). Meaning the instrument is biased and could lead to different interpretations for a specific population.
DIF of the BIS/BAS Scale has been tested previously for children and adolescents compared to adults.13,24,25 Two items on the BIS scale showed DIF for young children: ‘Even if something bad is about to happen to me, I rarely experience fear or nervousness’ (B2) and “I have very few fears compared to my friends” (B22). The authors of these papers suggest that this could be explained by the complex wording of the items, making it difficult for children to interpret these correctly and thus accidentally also measuring verbal capacity of the child instead of behavioral inhibition system.
Age-neutrality of the BIS/BAS Scales for older adults is yet to be tested. It is possible that certain scales of the questionnaire will display DIF. On one hand, Jorm et al17 did find that older adults scored consistently lower on BIS compared to younger adults. It is unclear whether this reflects actual personality change with age or an age bias. Therefore, it is necessary to take a closer look at the BIS scale via DIF to exclude an age bias as possible explanation for the difference. On the other hand, despite the strong relationship between the BIS scale and the personality dimension Neuroticism, Van den Broeck et al,26 who investigated DIF of the NEO-PI-R, did not find significant DIF for the Neuroticism scale. Therefore, DIF is possibly not an issue for the BIS items on the BIS/BAS Scales that are not directly referring to situations in which one needs a certain level of independence and health, but more focused on internalizing behavior such as anxiety or rumination. Behaviors that are not impacted by the changing life context of older adults.
The study of Van den Broeck et al26 on DIF on the NEO-PI-R can also give some insight on possible age bias of the BAS scale, as BAS is strongly associated with the personality dimension Extraversion. The NEO-PI-R results showed large DTF for the Extraversion domain. Several items measuring Extraversion did not take into account later life circumstances (eg, item 172: “I love the excitement of roller coasters”). This could suggest that the BAS scale and subscales could show a similar bias for age. Jorm et al17 also found bigger standard deviations for the BAS scale when tested for older adults. One possible explanation for this finding is that the BAS scale does not take the increased variability in personality characteristics in older adults into account. This variability might be due to possible constraints in physical health, sensory impairments or social relationships. Lack of attention to the gerontological context can bias measurement. In addition, items of the Reward Responsiveness subscale, are all focused on individual rewards. However, what is experienced as rewarding could change with age. The life span theory of Social–emotional selectivity (SST)27 for example, theorizes that the subjective sense of how much lifetime one has left shapes the motivational salience of potential incentives.27 It predicts that with aging, immediate rewards that increase subjective well-being become more valuable. This is especially the case for the positive affect that comes with social contact. Social contact becomes a primary driving force for reward behavior. Research by Rademacher et al28 has also confirmed
age-related changes in motivational preference for different rewards (p. 825) and that social reward might be of particular salience in old age (p. 826).
Comparing this theory on reward behavior with the Reward Responsiveness subscale of the BIS/BAS Scale, it is striking that the items of the subscale are very much focused on individual rewards (eg, “It would excite me to win a contest”). The Fun Seeking subscale includes items that seem to be clearly written for adults with a certain level of independence and no restraints in mobility. For example, the item “I will often act on the spur of the moment” could be answered differently by an older adult for no other reason than being less mobile, thus not measuring an unwillingness to approach rewarding experience, but an inability. The Drive subscale could also potentially be affected by DIF, due to declining physical health and mobility restraint in older adults. One item of this subscale is focused on taking immediate action (“If I see a chance to get something I want I move on it right away”) which could be hindered in old age due to the reasons mentioned above.
Current Study
The aim of this research is to test whether the BIS/BAS Scales are age-neutral and can thus accurately measure BIS/BAS in older adults. This will be examined with differential item functioning analysis (DIFAS29), which is a non-parametric odds ratio approach. The DIFAS program and manual are freely available (ERM - Software - School of Education (uncg.edu)). The reason for choosing a non-parametrical approach is that personality tests measure traits ordinally and for ordinal measurements researchers advise to use nonparametric methods for DIF analyses.30 In parametric Item Response Theory (IRT) models, variables are also assumed to be distributed normally or logistically and test scales are constructed over that distribution. In a non-parametric IRT model, on the other hand, the variable scale is determined first and then Item Characteristic Curve (ICC) is calculated according to this distribution. In this sense, non-parametric IRT is less restricted form of traditional IRT.30 Moreover, the odds ratio approach used by DIFAS can also be used with smaller sample sizes than the parametric IRT approach.29
Based on the literature,17,26–28 it is hypothesized that the BIS/BAS Scales will display DIF. More specifically, it is expected that certain items of the BAS Reward Responsiveness subscale will show DIF, due to the changing salience of reward perception in older age, seeking out more social rewards than individual rewards. Older adults are also theorized to seek out immediate awards that increase subjective wellbeing, due to the sense of having a limited amount of time left. The BAS Drive subscale is also expected to show DIF, as what motivates people seems to change with age. Similarly, to the expectations of the BAS Reward Responsiveness scale, older adults are hypothesized to be motivated more by social and immediate rewards. It is also expected that the BAS Fun Seeking subscale will show DIF due to certain physical and/or health restrictions that could come with old age, making acting in the spur of the moment and similar behaviors more unlikely. Whether the BIS scale will show DIF seems harder to predict, as a result of conflicting findings. As mentioned before, older adults score consistently lower on BIS,17 which could point towards an age bias. However, a study examining the Neuroticism scale of the NEO-PI-R, a scale closely related to BIS, showed no DIF.26 The BIS items focus on internalizing behavior such as anxiety or rumination, which are unlikely to be impacted by the restraints of old age.
Method
Transparency and Openness
We report how we determined our sample size, all data exclusions, all manipulations, and all measures in the study, and we follow JARS.31 The data pertinent to this study can be found here: https://osf.io/rvdgn/?view_only=d7e4031c26144e729ed1d4084a7acae5. Data were analyzed using DIFAS, version 5.029 and IBM SPSS Statistics, version 27. This study’s design and its analysis were not pre-registered.
Procedure and Participants
Six hundred and forty-three Dutch-speaking participants divided over three age groups, 151 younger adults (aged 18 to 34), 170 middle-aged adults (aged 35 to 64) and 322 older adults (aged 65 to 93) participated.
Adults aged 60 years and older were recruited via a research project of the Vrije Universiteit Brussel (VUB) and Ghent University on personality types and individual differences in information processing in older adults between 2017 and 2020. The group of community-dwelling older adults from this project has previously been used to examine the construct validity of the BIS/BAS scales,20 but age-neutrality was not examined earlier. In light of this bigger research project, where these participants were gathered as a control group, 4 exclusion criteria were used: (1) the presence of psychopathology, (2) possible cognitive impairment, (3) diabetes (4) surgery or chemotherapy within the last three months. Exclusion criteria 1 and 2 were used because the participants were compared to a clinical sample with the presence of psychopathology and possible cognitive impairment. Exclusion criteria 3 and 4 were used because the larger project included neuropsychological measures which can be affected by these criteria. All older adults were contacted by e-mail or phone by undergraduate psychology students or a Psychology PhD student in the context of a master thesis or PhD dissertation. After this first contact, participants were met face-to-face to be informed about the study and provided with an informed consent form, which explained that participation was voluntary, unpaid and could be stopped at any time. After signing the informed consent, the Mini-Mental State Examination (MMSE,32 Dutch version by Kok & Verhey33 is available on Mini mental state exam | FOD Volksgezondheid (belgium.be)) was used to screen for cognitive impairment (participants with a score <24 were excluded).32–34 Participants with presence of psychopathology were excluded with the Mini International Neuropsychiatric Interview (MINI).35 Next, participants filled out a biographical questionnaire on paper, including demographic and health data and a test battery, including the BIS/BAS scales used in the current study.
For the current study on age-neutrality, younger adults and the middle-aged adults were recruited between 2020 and 2021 via snowball sampling by e-mail and through online methods, such as social media channels, and asked to fill out an online questionnaire. The switch to online recruiting and data collection was made due to the restrictions of the Covid-19 pandemic. Research has shown that paper-and-pencil data collection and online data collection are generally equivalent.36 Before participants could fill out the online questionnaire, they first had to sign an informed consent. After giving consent, participants would fill out the biographical questionnaire and the BIS/BAS Scales questionnaire. For younger adults and middle-aged adults, in analogy to the older age group, the following exclusion criteria were used: (1) diabetes (2) surgery or chemotherapy within the last three months. Given the online format of data collection we also excluded participants with an inconsistent answering strategy as measured by the inconsistency scale (score ≥1737) of the Personality Inventory for DSM-5 (PID-5).38 This led to the exclusion of six participants.
Research procedures were approved by the internal ethics committee of the hospital and the medical ethical committee of the University Hospital Brussels and Vrije Universiteit Brussel (VUB). Participation was voluntary and the participants were not compensated for their participation. This study complies with the Declaration of Helsinki.
The group of older adults was matched with comparison groups of middle-aged adults and younger groups based on sample size and gender rates to obtain homogenous groups. This resulted in three age-groups with each 130 participants, of which 23.1% was male and 76.9% female. The average age of younger adults was 25.75 (SD = 3.61), that of middle-aged adults was 56.42 (SD = 9.27) and the average age of older adults was 72.97 (SD = 6.97).
Material
The Dutch translation10 of the BIS/BAS Scales9 is a self-report questionnaire consisting of 20 items (and 4 filler items) allocated to two primary scales: the BIS (7 items) and the BAS (13 items) scale. The BAS Scale is comprised of three subscales: Reward Responsiveness (5 items), Drive (4 items) and Fun Seeking (4 items), which all highlight different aspects of incentive sensitivity. The Fun Seeking subscale items
reflect both a desire for new rewards and a willingness to approach a potentially rewarding event on the spur of the moment (p. 322).
The Reward Responsiveness subscale items
focus on positive responses to the occurrence or anticipation of reward (p. 322).9 The Drive subscale pertains to the persistent pursuit of desired goals (p. 322).9
The BIS scale measures
concerns regarding the possible occurrence of negative events and the sensitivity to such events when they do occur17 (p. 50).
and is not comprised of subscales. The responses were collected using a 4-point Likert scale (1 = strongly agree to 4 = strongly disagree). Franken et al10 explain the method used to translate the questionnaire into Dutch:
The BIS/BAS Scales of Carver and White were independently translated into the Dutch language by four researchers who were all well informed with Gray’s BIS/BAS model. Differences between the translations were resolved after extensive discussion among the translators who employed the guideline to bring each item into conformity with its intended BIS/BAS subscale (p. 26).
Previous research has shown that the scales have satisfactory internal reliability and construct validity.10 All three BAS subscales have five items or less, which could impact the Cronbach’s Alpha values. Therefore, additionally, the average inter-item correlation (AIC) was calculated, as this measure of internal consistency is independent of the number of items in a scale. The AIC of the scales is acceptable when it is in the range of 0.15 to 0.50.39 For Cronbach’s Alpha the standards set by George and Mallery40 (Cronbach’s α >0.90—excellent; >0.80—good; >0.70—acceptable; >0.60—questionable; >0.50—poor; and <0.50—unacceptable) were applied.40 The BIS scale, BAS Drive scale and BAS Total scale showed acceptable Cronbach’s Alphas ranging from 0.697 to 0.845 for all three age groups (see Table 1). The BAS Reward Responsiveness and BAS Fun Seeking scales showed questionable to poor Cronbach Alpha’s for all age groups ranging from 0.381 to 0.613 (see Table 1). The BAS Reward Responsiveness scale also does not show a sufficient AIC for the group of middle-aged adults.
 |
Table 1 Descriptive Statistics, Analysis of Variance and Effect Sizes for the BIS/BAS Scales for Younger (n = 130), Middle-Aged (n = 130) and Older (n = 130) Adults |
Statistical Analysis
Basic descriptive statistical analyses were performed. An ANOVA was executed to calculate the between-group differences for the different scales. These results, however, can only be meaningfully interpreted if no DIF is found. Effect size was calculated with Eta-Squared. Cohen41 suggests that η2 = 0.01 indicates a small effect, η2 = 0.06 a medium effect and η2 = 0.14 a large effect.
To test whether BIS/BAS items perform differently for older adults, compared to younger and middle-aged adults, DIF analyses were conducted in a Classical Test Theory framework using an odds ratio approach. To examine DIF across the three age groups, three pairwise DIF analyses were performed using DIFAS 5.0.29 BIS/BAS items use polytomous scoring, so using the DIFAS program, the following statistics were computed:42 Mantel chi-square (Mantel), the Liu-Agresti cumulative common log odds ratio (L-A LOR), and Cox’s estimator of the multivariate hypergeometric noncentrality Parameter (Cox’s B). The Mantel chi-square statistic is based on a group (2) x response option (4) contingency table, distributed as a chi-square with one degree of freedom. The higher the chi-square value, the higher the probability the item displays DIF. L-A LOR considers the log odds ratio of one group endorsing a response option relative to another. Positive values indicate DIF in favor of the reference group (younger and middle-aged adults) and negative values indicate DIF in favor of the focal group (older adults). Cox’s B is similar to the Mantel-Haenszel statistic, but it uses the hypergeometric mean. Cox’s B also assumes positive values indicate DIF in favor of the reference group, and negative values indicate DIF in favor of the focal group. The following cut-off criteria are available to flag items with large DIF: |L-A LOR| > 0.64,43 and |Cox’s B| > 0.40.44
The next step was to assess Differential Test Functioning (DTF) by looking at the impact of DIF at scale level. If 25% of the items of a certain scale show moderate to large DIF, the scale exhibits significant DTF. DIF effect variance can be defined as small for v² < 0.07, medium for 0.07 ≤ v² ≤ 0.14, and large for v² > 0.14.22
Because DIF and DTF analyses were conducted at subscale level, the total subscale scores were used as stratifying variables. The stratum size was set at 1, which is the default option in DIFAS 5.0. To reduce Type I error, the Bonferroni correction was calculated for each subscale of the questionnaire for the DIF analyses. The BIS scale has a Bonferroni corrected critical chi-square value of 9.23 (p < 0.05 corrected to p < 0.0024). The Bonferroni correction was applied across all seven items for BIS scale by three test statistics (0.05/7*3). Stringent Bonferroni cut-offs were also applied to the LA-Lor (>0.90) and Cox’s B (>0.56) statistics. The BAS Total scale, with 13 items, has a Bonferroni corrected critical chi-square value of 10.37 (p < 0.05 corrected to p < 0.0013) and a corrected cut-off for LA-Lor of >0.97 and for Cox’s B of >0.60. For the BAS Reward Responsiveness scale, with 5 items, the following Bonferroni corrected values were calculated: chi-square value of 8.63 (p < 0.05 corrected to p < 0.0033), LA-Lor value of >0.87 and Cox’s B value of >0.54. The BAS Drive scale and the BAS Fun Seeking scale both have four items, so for these scales the following Bonferroni corrected values were calculated: a chi-square value of 8.20 (p < 0.05 corrected to p < 0.0042), LA-Lor of >0.84 and a Cox’s B of 0.53. In analogy to our Bonferroni corrected DIF thresholds, adjustments were made for DTF thresholds (Adjusted weighted v² = 0.14/(.43*adjusted Log Odds Ratio). According to Penfield and Algina22 a weighted v² > 0.14 (p < 0.05) means a large effect of DTF. The Bonferroni corrected DTF thresholds for the BIS/BAS Scales are as follows: BIS scale will show a large effect if weighted v² ≥ 0.36, the BAS Total scale will show a large effect if weighted v ²≥ 0.34, BAS Reward Responsiveness scale if weighted v² ≥ 0.37, BAS Drive scale if weighted v² ≥ 0.39 and BAS Fun Seeking scale if weighted v² ≥ 0.39.
The DIF analyses were first conducted on the BIS scale and the three BAS subscales to calculate the impact of DIF on the test as a whole. Subsequently, DTF analyses were conducted for the BIS scale and BAS subscales to investigate the magnitude of DIF effect variance on a scale level. Thereafter, the same analyses were conducted for the BAS Total scale. The analyses compare on a closer range of sum scores, so this could give different results in terms of items displaying DIF, compared to the analyses done on the subscales.
Results
Descriptive Statistics
A comparison of the three groups shows that the mean scores on the BAS Reward Responsiveness (F(2, 389)=6.349, p=0.002), BAS Drive (F(2, 389)=5.95, p=0.003), BAS Fun Seeking (F(2, 389)=10.8, p<0.001), and BAS Total (F(2, 389)=12.198, p<0.001) scales differ significantly (p < 0.05). However, only small effects were found (Table 1). These differences may not be meaningful if DIF is identified between the groups.
BIS and BAS Subscales
To investigate whether possible DIF occurs between young adults and older adults, four separate analyses were conducted for the primary BIS and three BAS subscales. As a result of these analyses, eight out of 20 items showed DIF. The Bonferroni-adjusted L-A Lor and Cox’s B for each subscale confirmed that all eight items displayed large DIF. Four of the items showed DIF against the sample of younger adults, indicating that these items were more readily confirmed by older adults (Table 2). So, the underlying personality trait measured by the item is more readily confirmed by older adults. The other four items displayed DIF against the sample of older adults, meaning these items were more readily confirmed by younger adults (Table 2). This is with the exception of B2, because this item was not reverse scored, unlike most other items and all other items displaying DIF. Higher scores on this item indicate disagreement and lower scores indicate agreement, so younger adults were less likely than older adults to endorse this item.
 |
Table 2 Items Meeting Bonferroni Adjusted Criteria for Large DIF When Comparing Young Adults to Older Adults |
To assess the impact of these DIF items when comparing young adults to older adults at scale level, additional DTF analyses have been conducted and both the primary scales and the subscales show DTF. According to the Bonferroni adjusted cut-off (weighted v²≥.36) large DTF is revealed for the BIS scale with a weighted v² of 0.58. The BAS Drive scale has a weighted v² of 0.89 with a Bonferroni adjusted cut-off of weighted v²≥.39, which implies large DTF. The BAS Reward Responsiveness scale shows a weighted v² of 0.72 with a Bonferroni adjusted cut-off of weighted v²≥.37, indicating a large effect. Lastly, the BAS Fun Seeking scale shows a weighted v² of 0.76 with a Bonferroni adjusted cut-off of weighted v²≥.39, which again indicates a large effect.
To determine whether DIF occurs between middle-aged adults and older adults as well, four separate analyses were also conducted comparing these two groups on each of the four BIS/BAS subscales. One item was found to display DIF against older adults (Table 3).
 |
Table 3 Items Meeting Bonferroni Adjusted Criteria for Large DIF When Comparing Middle-Aged Adults to Older Adults |
DTF analyses have also been conducted comparing middle-aged adults to older adults, but no DTF was found.
BAS Total Scale
DIF and DTF have also been calculated for the BAS scale as a whole. When comparing young adults to older adults, four items show large DIF according to the Bonferroni-adjusted L-A Lor and Cox’s B cut-offs. One item displays DIF against younger adults (Table 4), while the other three items display DIF against older adults (Table 4).
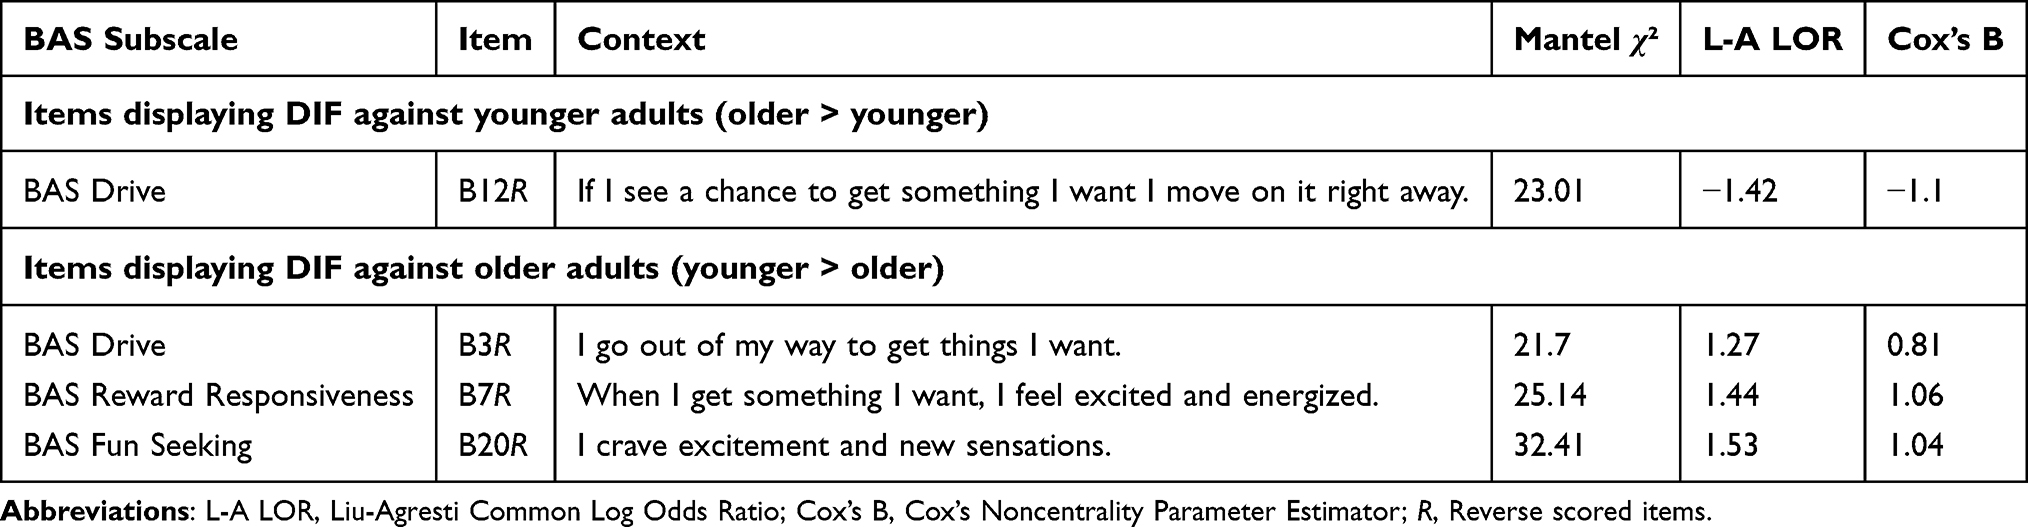 |
Table 4 BAS Items Meeting Bonferroni Adjusted Criteria for Large DIF When Comparing Young Adults to Older Adults |
The BAS scale also shows large DTF at the Bonferroni adjusted cut-off (weighted v²≥.34) with a weighted v² of 0.59. The DIF and DTF analyses were also conducted for the group of middle-aged adults comparing to the group of older adults, but no DIF or DTF was found.
Discussion
Results and Possible Explanations
This study set out to investigate whether the Dutch BIS/BAS Scales are age neutral, and whether the instrument as a whole can be considered an age-neutral instrument to measure BIS and BAS in adults, regardless of their age.10 Differential Item Functioning (DIF) analyses on the BIS scale and three BAS subscales, showed that eight items of the questionnaire cannot be considered age neutral when young adults are compared to older adults. All of these eight items showed large DIF. On scale level, each scale includes two items that display large DIF. One item of the BAS Reward Responsiveness scale was also found to show DIF when older adults were compared to middle-aged adults. With 40% of the items showing DIF when comparing young adults to older adults, the instrument cannot be considered age neutral (25% of items showing DIF is considered large DIF).22 On a scale level, large Differential Test Functioning (DTF) was found for all four scales, indicating that none of the scales measure BIS and BAS equally in young and older adults. For this reason, the descriptive statistics measuring significant differences between these two groups are not discussed further.
Given that some studies also apply the BAS scale as a total score, the DIF analyses were conducted for the BAS Total scale as well. Four items showed large DIF when comparing young adults to older adults and the scale as a whole shows large DTF.
The fact that we found DIF for the BIS scale is consistent with the findings of Jorm et al17 that older adults score consistently lower on BIS compared to younger adults. Item B8 (“Criticism or scolding hurts me quite a bit”) displays DIF against younger adults. This corresponds with Carstensen’s SST theory.27 On the other hand, item B2 (‘Even if something bad is about to happen to me, I rarely experience fear or nervousness) displays DIF against older adults. Notably, item B2 was not reverse scored, meaning a high score on this item by older adults implies adults disagree with the item. Possibly, these items measure a different construct in older adults. However, the study of Dierickx et al20 contradicts this, as they found all BIS items to have the expected factor loadings in an older population. Therefore, a better explanation is that the DIF in BIS items probably reflects a difference in degree of expression for older adults instead of a different construct.
Further, it was hypothesized that the BAS Reward Responsiveness subscale would show DIF, due to the changing salience of reward perception in older age, seeking out more social rewards than individual rewards. Item B4 (“When I’m doing well at something I love to keep at it’) displays DIF against younger adults. This could indeed be explained by Carstensen’s life span theory of SST.27 The DIF against older adults of item B7 (“when I get something I want, I feel excited and energized”) also seems to support the life span theory of SST. However, Dierickx et al20 found in their research on construct validity in older adults that item B7 did not load on the BAS Reward Responsiveness scale as expected, but instead loaded on the BAS Fun Seeking scale. This implies that B7 is measuring a different construct in older adults and could also explain the DIF found. Item B7 is also the only item that shows DIF when comparing middle-aged adults to older adults, underlining the age bias of this item.
The BAS Drive subscale was also expected to show DIF, as what drives people seems to change with age. DIF in item B3 (“I go out of my way to get things I want”) could indicate that for older adults maintaining social relations is more important than attaining material goals. The item is phrased in a way that it probably favors a materialistic interpretation by the respondent. Given the results of Dierickx et al20 on the factor structure, also for items of these scales it is probably in the first place a matter of differences in degree (and not construct differences).
It was also hypothesized that DIF would be found for the BAS Fun Seeking scale, because certain physical and/or health restrictions that could come with old age. The DIF against older adults in item B20 (“I crave excitement and new sensations”) seems to confirm this as older adults could be less prone to seeking out new sensations due to the restrictions of old age. Similar results were found in the research by Van den Broeck et al26 on the NEO-PI-R. However, the DIF against younger adults in item B10 (“I will often do things for no other reason than that they might be fun”) might be better explained by Carstensen’s27 theory on SST. All of these items with DIF showed expected loadings on corresponding scales in the factor structure analysis of Dierickx et al,20 so again it appears to be mainly a matter of differences in degree.
Limitations
Notably, no DTF was found between middle-aged adults and older adults and DIF could only be seen in one item. One possible explanation is that the lack of age-neutrality is most pronounced when comparing young adults to older adults. Another possible explanation for the lack of DIF is that the group may not have differed sufficiently from the group of older adults, because the middle-aged group skewed towards the higher end of the age range (M = 56.42, SD = 9.27, range: 35 to 64). The samples used were convenience samples, which come with several other restrictions. The research samples differ from the age division found in the Flemish population.2 Adults in the ages between 33 and 57 years of age are underrepresented in the research samples. Women were also overrepresented in this sample. 79.6% of the participants were female, compared to 50.5% of the Flemish population. The differences found could thus be due to actual cohort effects instead of age effects. Additionally, the sample of young adults and partially that of middle-aged adults were collected during the Covid-19 pandemic. The data collection method changed from in person to an online questionnaire. These changes in procedure could affect the findings, although generally paper-and-pencil and online data collection are considered to be equivalent.36 Nevertheless, for future research on DIF in the BIS/BAS Scales questionnaire, a more uniform approach to data collection and more representative samples are suggested. Moreover, because of the cross-sectional methodology, it is impossible to say with certainty what the underlying reasons for DIF are. Once more, we cannot rule out that the results reflect cohort effects instead of real age-related differences.
This study tested DIF in polytomous items. The DIF results do not give any information about in which response category the DIF is manifested. Penfield43 suggests using a common log odds ratio approach to further investigate Differential Step Functioning and uncover at which specific score levels the DIF is evident.40
Another limitation of this research is the poor internal consistency of the BAS Reward Responsiveness for which both Cronbach alpha and AIC values were too low. Given that previous studies have found acceptable internal consistency, this could be due to sample quality or the difference in sampling methods between age groups. However, more likely the low internal consistency is a reflection of the lack of age-neutrality. The scale shows large DTF. Consequently, the scale is not internally consistent, because it is not measuring the same construct equally.45 In addition, in the study of Dierickx et al20 item B7 did not load on this scale.
Conclusions, Implications and Take-Aways
The present study set out to research the age-neutrality of the Dutch BIS/BAS Scales questionnaire. Psychological instruments tend to ignore the later life context of older adults, because they are often validated by participants in the age group of 20 to 45. With a growing population of adults over 65, the possible invalidity of items for this group should be investigated. For the BIS/BAS Scales, no such analysis had been done up to now. Our results indicate that the BIS/BAS Scales and the questionnaire as a whole are not age neutral, but in fact show significant DIF when comparing young adults aged 18 to 34 to older adults and show large DTF for all four scales. Even though no DTF was found between middle-aged and older adults, this does not alter the significance of these findings, considering that most instruments are validated using participants in the age group of 20 to 45 and the discipline’s strong reliance on student samples. The main implication of finding large DIF in the BIS/BAS Scales questionnaire is that for the test to be age neutral, eight of the total 20 items have to be considered carefully. The question remains if the DIF is due to the items measuring a different construct across age groups, or if it is a matter of differences in degree of expression across age groups. Taking the findings of Dierickx et al22 into account, it mainly appears to be a matter of differences in degree.20 If indeed the DIF is due to differences in degree of expression, the development of age-specific norms could be a solution. Yet, the approach of DIF testing used in this study does not shed light on which specific score levels are manifesting DIF. In that case further research is needed to detect the manifestation of DIF at any particular score level, using for example a common log odds ratio approach to test for differential step functioning.43 If certain items showing DIF are truly measuring different constructs across age-groups, replacing or rephrasing these items should be considered, like in the case of item B7 of the BAS Reward Responsiveness scale. Another finding that should be taken into consideration for future development is the questionable to poor internal consistency of the BAS Reward Responsiveness scale. Further research into improving the internal consistency of the BAS Reward Responsiveness scale across different age groups is warranted. Older adults should be considered in the development of new instruments from the start and included in validation research. This would prevent items having to be replaced at a later stage and ensure practitioners can rely on instruments to provide reliable and valid results regardless of age.
Ethics Statement
The data used in this study were collected in a manner consistent with ethical standards for the treatment of human subjects. This study was approved by the Medical ethical committee of the University Hospital Brussels and Vrije Universiteit Brussel (VUB).
Disclosure
The authors report no conflicts of interest in this work.
References
1. European Commissio. Population structure & ageing; 2009. Available from: https://ec.europa.eu/eurostat/statistics-explained/index.php/Population_structure_and_ageing#The_share_of_elderly_people_continues_to_increase.
2. Statbel (algemene directie statistiek - statistics Belgium). 2020; Available from: https://statbel.fgov.be/nl/themas/bevolking/structuur-van-de-bevolking.
3. European Commission. The 2018 ageing report: economic and budgetary projections for the EU member states (2016–2070); 2018. Available from: https://ec.europa.eu/info/publications/economy-finance/2018-ageing-report-economic-and-budgetary-projections-eu-member-states-2016-2070_en.
4. American Psychological Association. Publication Manual of the American Psychological Association.
5. Rossi G, Van den Broeck J, Dierckx E, Segal DL, van Alphen SP. Personality assessment among older adults: the value of personality questionnaires unraveled. Aging Ment Health. 2014;18(8):936–940. doi:10.1080/13607863.2014.924089
6. American Psychiatric Association. Diagnostic and Statistical Manual of Mental Disorders.
7. American Psychiatric Association. Diagnostic and Statistical Manual of Mental Disorders.
8. American Psychological Association. Guidelines for psychological practice with older adults. Am Psychol. 2014;69(1):34. doi:10.1037/a0035063
9. Carver CS, White TL. Behavioral inhibition, behavioral activation, and affective responses to impending reward and punishment: the BIS/BAS scales. J Pers Soc Psychol. 1994;67(2):319. doi:10.1037/0022-3514.67.2.319
10. Franken IH, Muris P, Rassin E. Psychometric properties of the Dutch BIS/BAS scales. J Psychopathol Behav Assess. 2005;27(1):25–30. doi:10.1007/s10862-005-3262-2
11. Gray JA. Framework for a taxonomy of psychiatric disorder. In: van Gozen S, van de Poll N, Sergeant JA, editors. Emotions: Essays on Emotion Theory. Lawrence Erlbaum; 1993:29–59.
12. Arnett PA, Newman JP. Gray’s three-arousal model: an empirical investigation. Pers Individ Dif. 2000;28(6):1171–1189. doi:10.1016/S0191-8869(99)00169-5
13. Pagliaccio D, Luking KR, Anokhin AP, et al. Revising the BIS/BAS Scale to study development: measurement invariance and normative effects of age and sex from childhood through adulthood. Psychol Assess. 2016;28(4):429. doi:10.1037/pas0000186
14. Cloninger CR, Svrakic DM, Przybeck TR. A psychobiological model of temperament and character. Arch Gen Psychiatry. 1993;50:975–990. doi:10.1001/archpsyc.1993.01820240059008
15. Walker BR, Jackson CJ, Frost R. A comparison of revised reinforcement sensitivity theory with other contemporary personality models. Pers Individ Dif. 2017;109:232–236. doi:10.1016/j.paid.2016.12.053
16. Mardaga S, Hansenne M. Relationships between Cloninger’s biosocial model of personality and the behavioral inhibition/approach systems (BIS/BAS). Pers Individ Dif. 2007;42(4):715–722. doi:10.1016/j.paid.2006.08.013
17. Jorm AF, Christensen H, Henderson AS, Jacomb PA, Korten AE, Rodgers B. Using the BIS/BAS scales to measure behavioural inhibition and behavioural activation: factor structure, validity and norms in a large community sample. Pers Individ Dif. 1999;26(1):49–58. doi:10.1016/S0191-8869(98)00143-3
18. Smits DJ, Boeck PD. From BIS/BAS to the big five. Eur J Pers. 2006;20(4):255–270. doi:10.1002/per.583
19. Nelson EA, Dannefer D. Aged heterogeneity: fact or fiction? The fate of diversity in gerontological research. Gerontologist. 1992;32(1):17–23. doi:10.1093/geront/32.1.17
20. Dierickx S, Dierckx E, Claes L, Rossi G. Measuring behavioral inhibition and behavioral activation in older adults: construct validity of the Dutch BIS/BAS scales. Assessment. 2021;29(5):1061–1074. doi:10.1177/10731911211000123
21. Debast I, Rossi G, Van Alphen SPJ. Age-neutrality of a brief assessment of the section III alternative model for personality disorders in older adults. Assessment. 2018;25(3):310–323. doi:10.1177/1073191118754706
22. Penfield RD, Algina J. A generalized DIF effect variance estimator for measuring unsigned differential test functioning in mixed format tests. J Educ Meas. 2006;43(4):295–312. doi:10.1111/j.1745-3984.2006.00018.x
23. Dong Y, Dumas D. Are personality measures valid for different populations? A systematic review of measurement invariance across cultures, gender, and age. Pers Individ Dif. 2020;160:109956. doi:10.1016/j.paid.2020.109956
24. Cooper A, Gomez R, Aucote H. The behavioural inhibition system and behavioural approach system (BIS/BAS) scales: measurement and structural invariance across adults and adolescents. Pers Individ Dif. 2007;43(2):295–305. doi:10.1016/j.paid.2006.11.023
25. Cogswell A, Alloy LB, van Dulmen MH, Fresco DM. A psychometric evaluation of behavioral inhibition and approach self-report measures. Pers Individ Dif. 2006;40(8):1649–1658. doi:10.1016/j.paid.2005.12.008
26. Van den Broeck J, Rossi G, Dierckx E, De Clercq B. Age-neutrality of the NEO-PI-R: potential differential item functioning in older versus younger adults. J Psychopathol Behav Assess. 2012;34(3):361–369. doi:10.1007/s10862-012-9287-4
27. Carstensen LL. The influence of a sense of time on human development. Science. 2006;312(5782):1913–1915. doi:10.1126/science.1127488
28. Rademacher L, Salama A, Gründer G, Spreckelmeyer KN. Differential patterns of nucleus accumbens activation during anticipation of monetary and social reward in young and older adults. Soc Cogn Affect Neurosci. 2014;9(6):825–831. doi:10.1093/scan/nst047
29. Penfield RD. DIFAS: differential item functioning analysis system. Appl Psychol Meas. 2005;29(2):150–151. doi:10.1177/0146621603260686
30. Basokcu TO, Ogretmen T. Comparison of parametric and nonparametric item response techniques in determining Differential Item Functioning in polytomous scale. Am J Theor Appl. 2014;3(2):31–38. doi:10.11648/j.ajtas.20140302.11
31. Kazak AE. Editorial: journal article reporting standards. Am Psychol. 2018;73(1):1–2. doi:10.1037/amp0000263
32. Folstein MF, Folstein SE, Mchugh PR. Mini-mental state examination. PsycTESTS Dataset; 1975.
33. Kok R, Verhey F. Dutch translation of the mini mental state examination. GGZ; 2002.
34. Folstein MF, Folstein SE, McHugh PR. “Mini-mental state”: a practical method for grading the cognitive state of patients for the clinician. J Psychiatr Res. 1975;12(3):189–198. doi:10.1016/0022-3956(75)90026-6
35. Sheehan D, Janavs J, Baker R, Harnett-Sheehan K, Knapp E, Sheehan M. Mini International Neuropsychiatric Interview. University of South Florida; 1992.
36. Weigold A, Weigold IK, Russell EJ. Examination of the equivalence of self-report survey-based paper-and-pencil and internet data collection methods. Psychol Methods. 2013;18(1):53. doi:10.1037/a0031607
37. Keeley JW, Webb C, Peterson D, Roussin L, Flanagan EH. Development of a response inconsistency scale for the personality inventory for DSM–5. J Pers Assess. 2016;98(4):351–359. doi:10.1080/00223891.2016.1158719
38. Krueger RF, Derringer J, Markon KE, Watson D, Skodol AE. Initial construction of a maladaptive personality trait model and inventory for DSM-5. Psychol Med. 2012;42:1879–1890. doi:10.1017/S0033291711002674
39. Clark LA, Watson D. Constructing validity: new developments in creating objective measuring instruments. Psychol Assess. 2019;31(12):1412. doi:10.1037/pas0000626
40. George D, Mallery P. SPSS for Windows Step by Step: A Simple Guide and Reference.
41. Cohen J. Statistical Power Analysis for the Behavioral Sciences.
42. Penfield RD. DIFAS 5.0. User’s manual; 2013.
43. Penfield RD. An approach for categorizing DIF in polytomous items. Appl Meas Educ. 2007;20(3):335–355. doi:10.1080/08957340701431435
44. Camilli G, Congdon P. Application of a method of estimating DIF for polytomous test items. J Educ Behav Stat. 1999;24:323–341. doi:10.3102/10769986024004323
45. Balsis S, Segal DL, Donahue C. Revising the personality disorder diagnostic criteria for the diagnostic and statistical manual of mental disorders‐fifth edition (DSM‐V): consider the later life context. Am J Orthopsychiatry. 2009;79(4):452–460. doi:10.1037/a0016508
 © 2023 The Author(s). This work is published and licensed by Dove Medical Press Limited. The
full terms of this license are available at https://www.dovepress.com/terms
and incorporate the Creative Commons Attribution
- Non Commercial (unported, 3.0) License.
By accessing the work you hereby accept the Terms. Non-commercial uses of the work are permitted
without any further permission from Dove Medical Press Limited, provided the work is properly
attributed. For permission for commercial use of this work, please see paragraphs 4.2 and 5 of our Terms.
© 2023 The Author(s). This work is published and licensed by Dove Medical Press Limited. The
full terms of this license are available at https://www.dovepress.com/terms
and incorporate the Creative Commons Attribution
- Non Commercial (unported, 3.0) License.
By accessing the work you hereby accept the Terms. Non-commercial uses of the work are permitted
without any further permission from Dove Medical Press Limited, provided the work is properly
attributed. For permission for commercial use of this work, please see paragraphs 4.2 and 5 of our Terms.
Recommended articles
Oral Frailty and Its Impact on Elderly Quality of Life: A Scoping Review
Wulandari AB, Hidayat W, Zakiawati D
Clinical Interventions in Aging 2026, 21:549826
Published Date: 2 February 2026