")
Back to Journals » International Journal of Nanomedicine » Volume 10 » Special Issue on diverse applications in Nano-Theranostics
Measurement of creatinine in human plasma using a functional porous polymer structure sensing motif
Authors Nanda SS, An SSA , Yi DK
Received 11 May 2015
Accepted for publication 30 June 2015
Published 25 August 2015 Volume 2015:10(Special Issue on diverse applications in Nano-Theranostics) Pages 93—99
DOI https://doi.org/10.2147/IJN.S88378
Checked for plagiarism Yes
Review by Single anonymous peer review
Peer reviewer comments 2
Editor who approved publication: Dr Thomas Webster
Sitansu Sekhar Nanda,1 Seong Soo A An,1 Dong Kee Yi2,3
1Department of Bionanotechnology, Gachon Medical Research Institute, Gachon University, Seongnam, 2Department of Chemistry, 3Department of Environmental Engineering, Myongji University, Yongin, South Korea
Abstract: In this study, a new method for detecting creatinine was developed. This novel sensor comprised of two ionic liquids, poly-lactic-co-glycolic acid (PLGA) and 1-butyl-3-methylimidazolium (BMIM) chloride, in the presence of 2',7'-dichlorofluorescein diacetate (DCFH-DA). PLGA and BMIM chloride formed a functional porous polymer structure (FPPS)-like structure. Creatinine within the FPPS rapidly hydrolyzed and released OH-, which in turn converted DCFH-DA to DCFH, developing an intense green color or green fluorescence. The conversion of DCFH to DCF+ resulted in swelling of FPPS and increased solubility. This DCF+-based sensor could detect creatinine levels with detection limit of 5 µM and also measure the creatinine in blood. This novel method could be used in diagnostic applications for monitoring individuals with renal dysfunction.
Keywords: PLGA, FPPS, creatinine, blood, diagnosis
Introduction
Creatinine is the end product of the metabolic pathway of creatinine catabolism. Creatinine produced in the body is continuously removed from the blood circulation by the kidneys in large volumes daily.1 The level of creatinine in human blood and urine could be used as an indirect indicator of renal, muscular, and thyroid functions. Measuring creatinine levels would be also important for the biomedical diagnosis of acute myocardial infarction and in hemodialysis therapy. The normal level of creatinine in the blood of a healthy individual is 40–150 μM, but it can exceed 1,000 μM in certain extreme circumstances. Patients with severe renal deficiency could have creatinine levels greater than 500 μM and may eventually require dialysis or kidney replacement. At the other extreme, the creatinine level less than 40 μM could be indicative of decreased muscle mass.2 Hence, regular measurement of creatinine in bodily fluids and rapid availability of results could greatly benefit critically ill patients with acute kidney injury, with timely administration of treatment to peritoneal dialysis patients for improving their quality of life.3,4
Presently, colorimetric methods of testing creatinine are the more common techniques for measuring creatinine. These methods are based on using either Jaffe’s reaction5 or the enzymatic colorimetric method.6 However, numerous metabolites and drugs in the sample can also interfere with these methods.7 Also, a long waiting period for the results can be a problem for the efficient treatments.8 Moreover, methods, such as Jaffe’s reaction, are not selective for creatinine and can detect a wide range of biomolecules, such as sugar, urea, uric acid, pyruvate, and dopamine.6 Other available methods, such as ion-sensitive field effect transistor creatinine sensors9–13 and monoenzyme and trienzyme cascade biosensors,14–21 also have limitations in terms of their creatinine-sensing properties, such as low sensitivity and limited reproducibility.
In this study, functional porous polymer structure (FPPS) with 1-butyl-3-methylimidazolium (BMIM) chloride and poly-lactic-co-glycolic acid (PLGA) was prepared in the presence of 2′,7′-dichlorofluorescein diacetate (DCFH-DA) for sensing creatinine. PLGA and BMIM chloride formed the cross-linked FPPS by forming ester bonds. Next, the FPPS converts DCFH-DA to DCFH.22 BMIM revealed many interesting properties such as the fact that BMIM can exist as an ionic liquid at room temperature, which could in turn supports organic synthesis and catalytic reactions.23–25 Here, BMIM could help the catalytic activity of a reaction by producing OH− upon hydrolysis of creatinine. This OH− could convert DCFH to DCF+, which produced a green color in the final step. A series of experiments was performed to measure creatinine in buffer and was then applied to blood plasma samples from patients with diabetes and Alzheimer’s disease.
Materials and methods
Materials and characterization
BMIM chloride, dichloromethane (DCM), PLGA, DCFH-DA, creatinine, urea, glucose, lactose, and sodium phosphate buffer were purchased from Sigma-Aldrich Inc. (St Louis, MO, USA). Diabetes patient blood sample and normal blood sample were obtained from Gachon Gil Hospital, South Korea. Alzheimer’s patient blood sample was obtained from Seoul National University Bundang Hospital, South Korea. A field emission scanning electron microscope JSM 7500F (JEOL, Tokyo, Japan) was used to assess the morphology of FPPS. The photoluminescence measurements were carried out on Varian Spectrofluorometer at 350 nm excitation wavelength. In Varian Spectrofluorometer, a 1×1 cm cuvette and a band pass of 10 nm for both excitation and emission were used. Microplate reader (Perkin Elmer, Waltham, MA, USA) was used to count the fluorescence intensity.
Preparation of FPPS
PLGA slurry was prepared by dissolving 100 mg PLGA (50:50) in 10 mL of DCM, and then homogenized using a magnetic stirrer at 50°C for 12 hours. For preparing microporous-structured PLGA, BMIM chloride was chosen as the counter-phase, and 200 mg was added to the PLGA slurry. The PLGA–BMIM chloride mixture was fabricated into FPPS with macrochannels, using a robotic dispensing method. In this method, the PLGA–BMIM mixture solution was filled into a syringe and placed in an ethanol bath.
Detection of creatinine
To check the viability of the testing method, 100 μL of 100 μM DCFH-DA was added to FPPS in the presence of various concentrations of creatinine (25, 50, 100, 150, 200, and 250 μM). The reaction mixture was incubated in the dark for 2 hours. Green fluorescence that developed was measured at the peak of emission wavelength at 530 nm, with excitation at 350 nm. The green fluorescence is also visible under normal white light.
Preparation of blood sample
Blood plasma samples (five) and normal blood samples (five) from diabetic patients and normal healthy persons were collected, with informed consent, from Gachon Gil Hospital, South Korea. Alzheimer patient blood samples (five) were collected, with informed consent, from Seoul National University Bundang Hospital, South Korea. The blood was collected in ethylenediaminetetraacetic acid (EDTA) or heparin vacutainer tubes and subjected to centrifugal separation for 30 minutes at 850 rpm. Informed consents were obtained prior to the blood sampling, and the protocol was approved by the Institutional Review Board of the Gachon University Gil Hospital and Seoul National University Bundang Hospital. After centrifugal separation, 1 mL of the separated plasma was dispensed into a 1.5 mL polypropylene tube (not mixed with blood cells) and stored at −70°C until use. Prior to determination of creatinine in blood, the samples were centrifuged at 10,000 rpm for 30 minutes. Then, 20 μL of supernatant was diluted with 80 μL of 0.5 mM sodium phosphate buffer solution.
Detection of creatinine in blood
For measuring creatinine in blood plasma, 5 mg of FPPS was added to a diluted blood sample. Next, 100 μL of 100 μM DCFH-DA was added to the blood plasma sample, and the mixture was kept in the dark for 2 hours. After the incubation period, the solution showed green fluorescence. The final product from FPPS, DCFH-DA, and creatinine from blood plasma was measured, with excitation and emission wavelengths at 350, 530 nm, respectively.
Results and discussion
Characterization of PLGA FPPS and measurement of creatinine
Scanning electron microscopy images of slurry mixture of DCM and PLGA revealed the absence of pores in the mixture in Figure 1A. On the other hand, Figure 1B showed that addition of BMIM chloride resulted in the cross-linked structure of BMIM with PLGA and the creation of pores, which were mainly due to the formation of ester linkages. The mechanism of pore formation is outlined in Figure 2. First, the ester linkages converted DCFH-DA to DCFH. Simultaneously, as creatinine entered into the pore, it would go through hydrolysis to produce OH−. Next, OH− ion could convert DCFH to DCF+. Finally, as the concentration of OH− increased, the DCF+ concentrations also increased and produces green color and fluorescence at 530 nm. The average size of the pore is shown in Figure 3, with X- and Y-axis of 18.214 and 17.946 μm, respectively. The estimated diameter of the pore was 25.570 μm. The surface chemistry of the pore and catalytic activity of the ionic liquid plays a vital role in the effectiveness of the creatinine sensor.
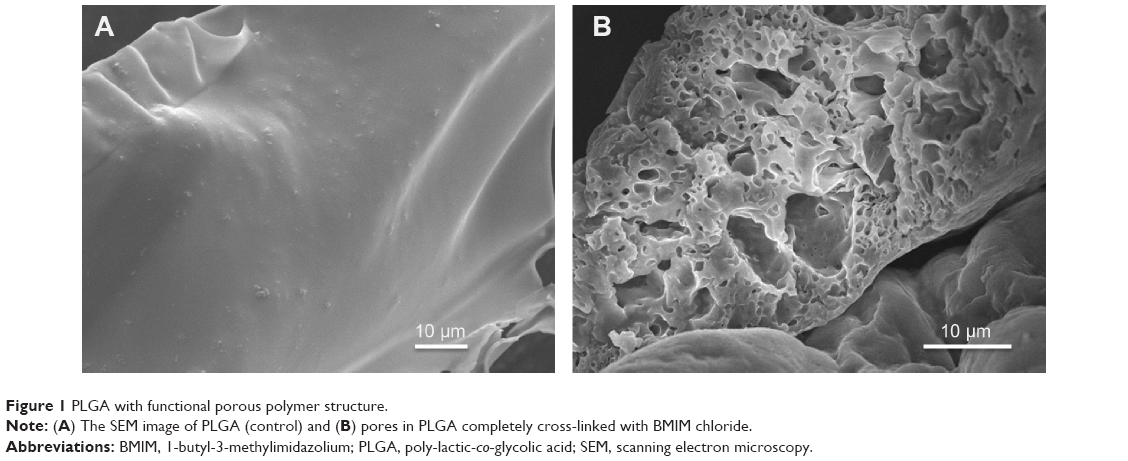 | Figure 1 PLGA with functional porous polymer structure. |
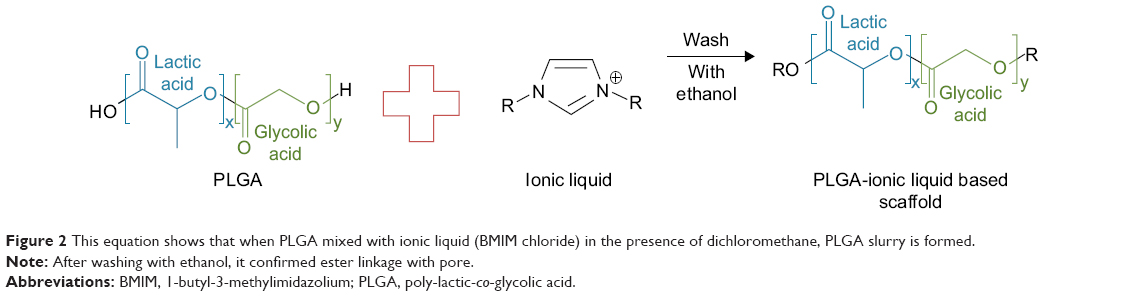 | Figure 2 This equation shows that when PLGA mixed with ionic liquid (BMIM chloride) in the presence of dichloromethane, PLGA slurry is formed. |
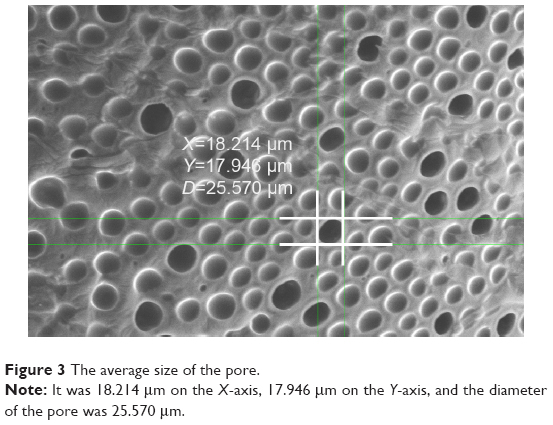 | Figure 3 The average size of the pore. |
Detection of biomolecules under UV light
Several researchers in the past focused on sensing creatinine along with other biomolecules such as glucose, lactose, and urea. In Figure 4, we screened all these biomolecules using the same experimental procedure described earlier. The green color under ultraviolet (UV) light (365 nm excitation) or in normal daylight was not observed. This result suggested that the current method exclusively detects creatinine in blood samples.
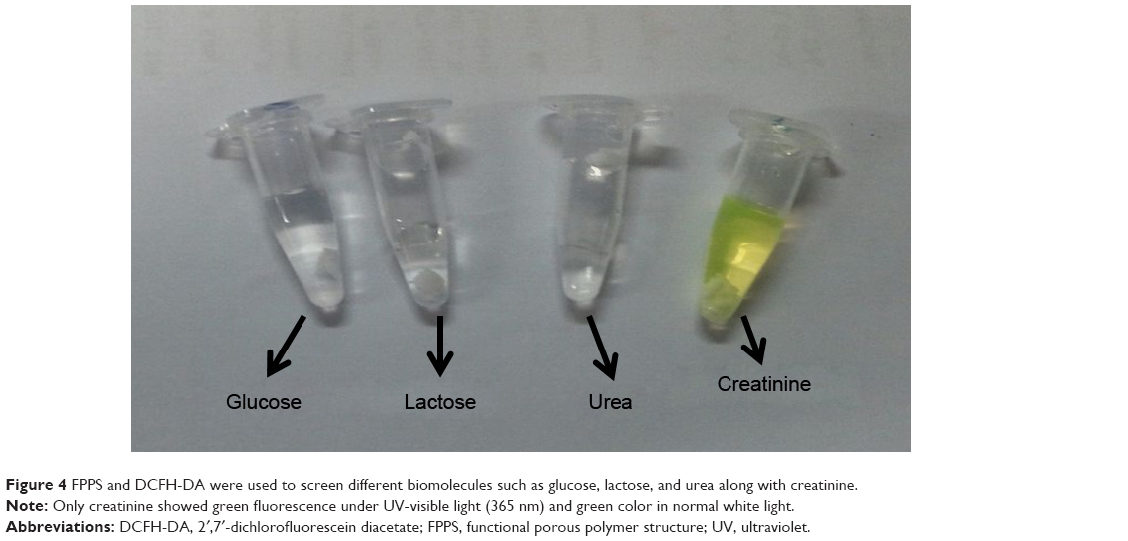 | Figure 4 FPPS and DCFH-DA were used to screen different biomolecules such as glucose, lactose, and urea along with creatinine. |
Concentration of creatinine in blood sample
A series of experiments was done using the same test with PLGA FPPS and DCFH-DA, but without creatinine. Fluorescence peak at 530 nm was not observed, as shown in Figure 5. However, when 50 μm of creatinine was added to this FPPS mixture, a peak at 530 nm was observed.
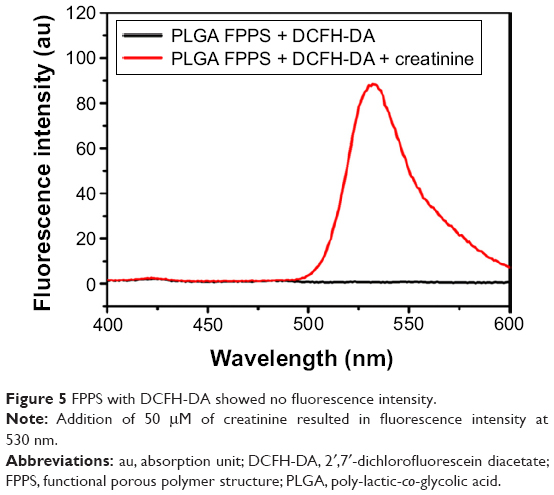 | Figure 5 FPPS with DCFH-DA showed no fluorescence intensity. |
The creatinine level in diabetic patients exceeded the normal range. This would be expected because diabetic patients typically suffer from renal dysfunction. In Figure 6, the creatinine levels in blood from healthy individuals were compared with blood from diabetic patients. The blood from diabetic patients showed greater fluorescence intensity at 530 nm. Figure 7 shows that as the concentration of creatinine increased, the fluorescence intensity at 530 nm also increased. The lower limit for detecting creatinine in blood is 5 μM. We took five samples of blood from healthy individuals, five samples from patients with Alzheimer’s, and five samples from diabetic patients, and checked creatinine levels. All blood samples contained creatinine and produced a green color under UV visible light at 365 nm and in normal white light, as shown in Figure 8. Arvanitakis et al26 showed that creatinine has been significantly associated with Alzheimer’s disease. A series of experiments proved that Alzheimer’s disease was closely associated with Plasma and their result showed that Alzheimer’s can be detected from Plasma.28–31 Another recent study by Yoshida et al27 described that there was a slow increase of creatinine level in case of Alzheimer’s disease as compared with normal blood. Figure 9 shows that creatinine levels in patients with Alzheimer’s and healthy individuals were only slightly different, whereas in diabetic patients, this difference was extremely high (P<0.05). All experiments were done in triplicate. In Figure 10, a detailed description about creatinine sensing is mentioned. In the first step, FPPS was prepared, as mentioned in “Preparation of FPPS” section. FPPS (5 mg), creatinine, and DCFH-DA were added to a 1.5 mL tube. Ester containing pore converted DCFH-DA to DCFH and simultaneously creatinine on hydrolysis produced OH−. This OH− helped to produce DCF+ from DCFH. As the concentration of DCF+ increased, it produced more green color under UV light at 365 nm excitation. This is the basic mechanism, and is mentioned in Figure 10.
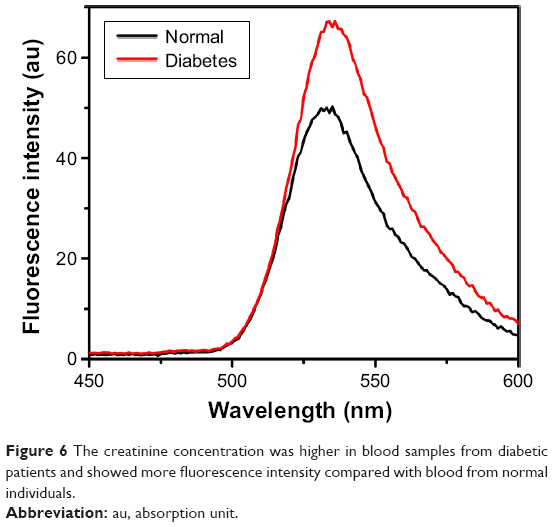 | Figure 6 The creatinine concentration was higher in blood samples from diabetic patients and showed more fluorescence intensity compared with blood from normal individuals. |
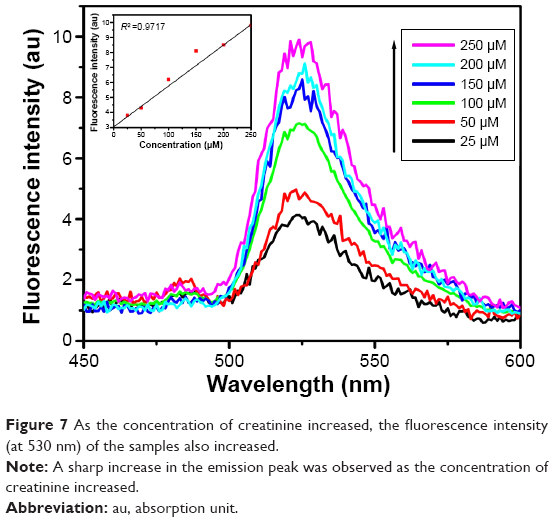 | Figure 7 As the concentration of creatinine increased, the fluorescence intensity (at 530 nm) of the samples also increased. |
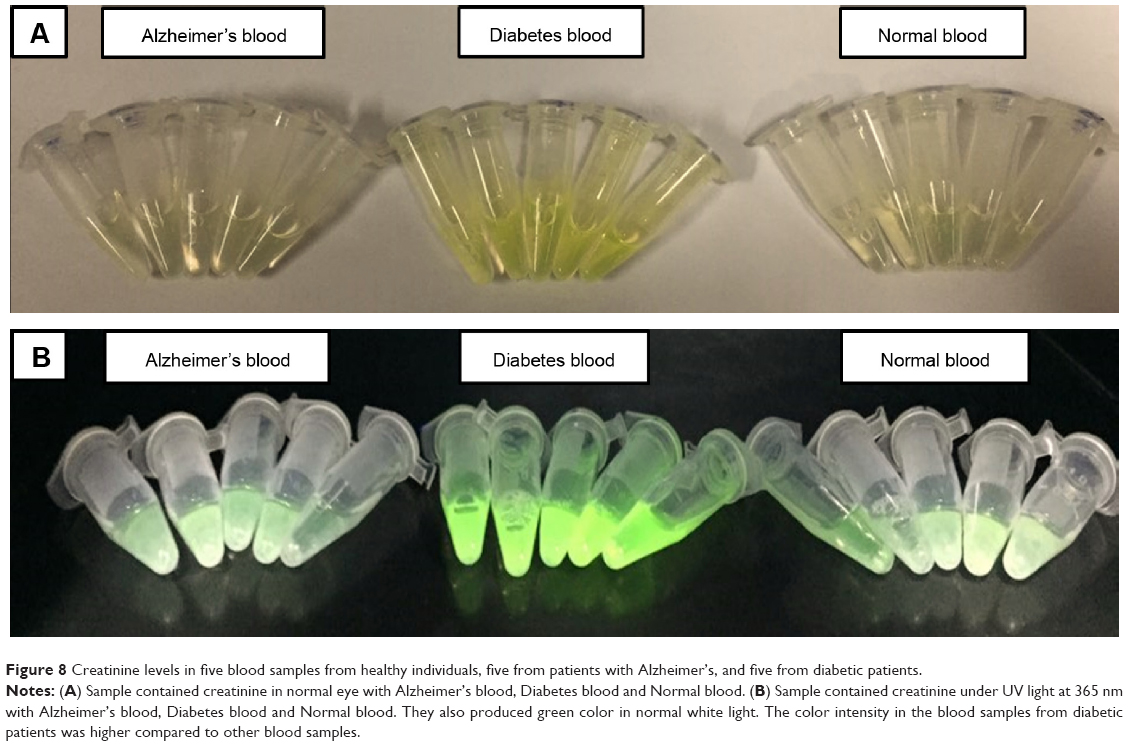 | Figure 8 Creatinine levels in five blood samples from healthy individuals, five from patients with Alzheimer’s, and five from diabetic patients. |
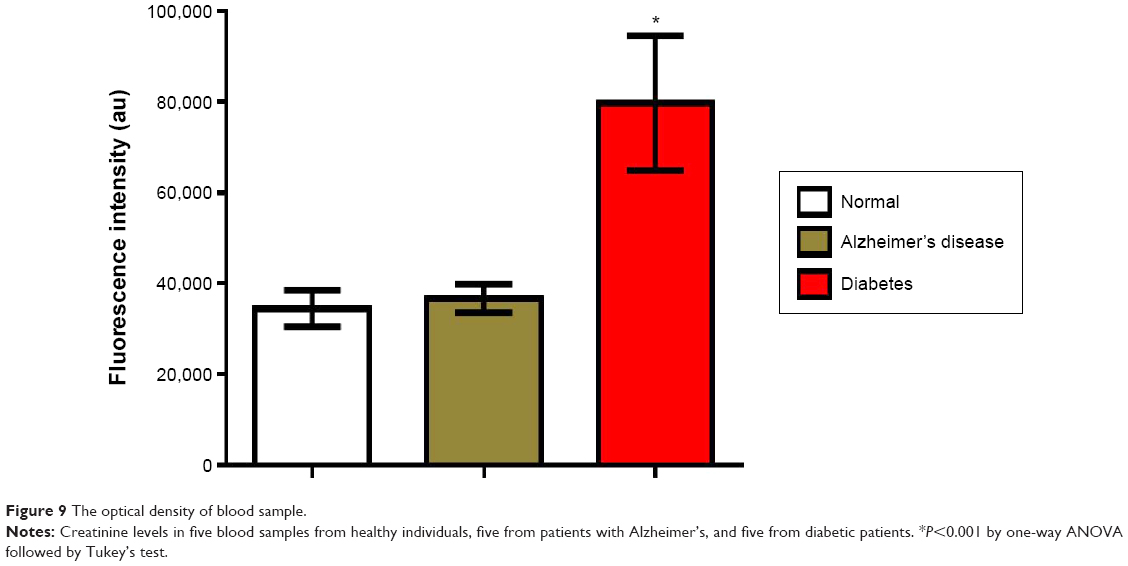 | Figure 9 The optical density of blood sample. |
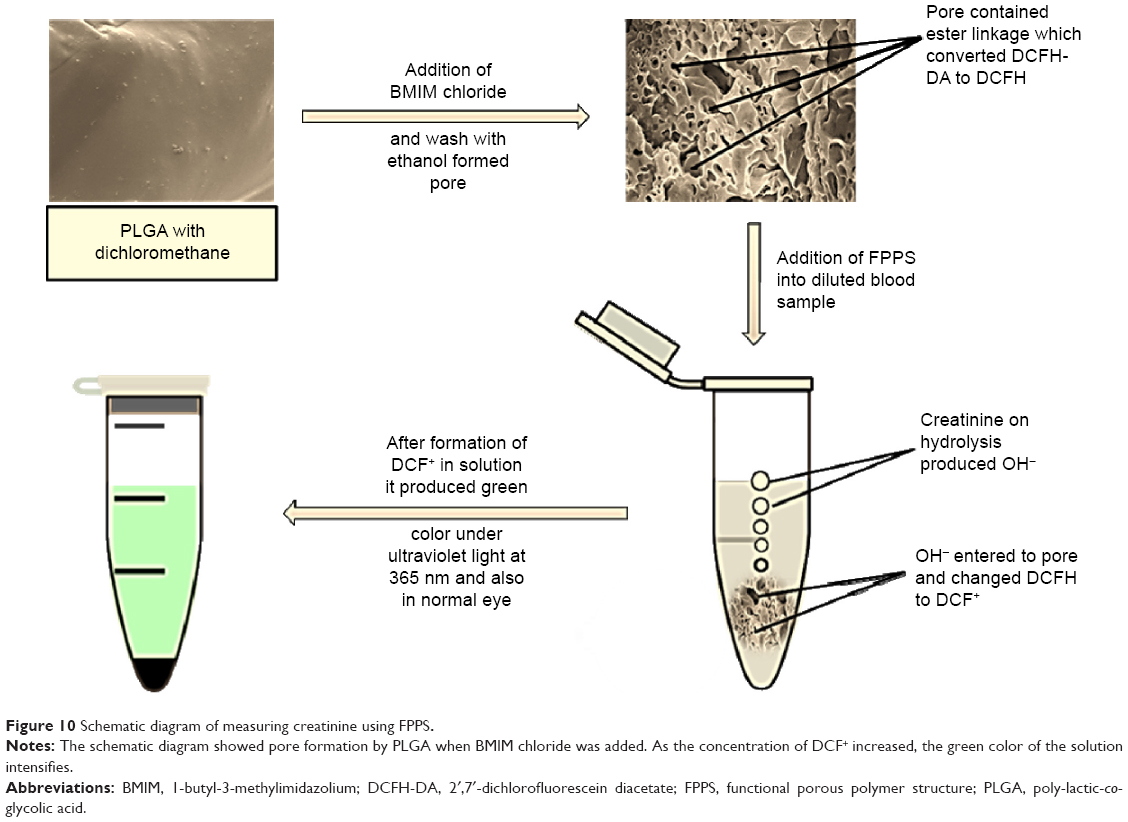 | Figure 10 Schematic diagram of measuring creatinine using FPPS. |
Conclusion
FPPS-based sensor for determining creatinine concentration in human plasma was developed. This method is similar to other conventional clinical methods that are presently used. Current method can detect only creatinine in blood sample. In the near future, more focus on improving the sensor by increasing the fluorescence intensity should be carried out. This will allow the diabetes patient to use this sensor and check their creatinine level. This creatinine sensor can be especially useful for patients with renal disease or patients who have undergone kidney transplantations, as they can use it for home monitoring. This sensor is selective for creatinine only, and other biomolecules are not measured. With the help of nanoparticles, this method can be further improved by altering the morphology and size of the particles, external area of the pore, and adsorption properties and by increasing the transfer of electrons.
Acknowledgment
This work was supported by the grants of National Research Foundation of Korea (NRF), funded by the South Korean government (MEST) (2012R1A2A2A03046819) and (2013R1A1A2005329). The authors wish to thank Prof. Kwnagwon Kim from Gachon University Gil Hospital and SangYun from Seoul National University Bundang Hospital for plasma samples as gifts.
Disclosure
The authors report no conflicts of interest in this work.
References
Kazmlerczak SC, Lente FV, Hodges ED. Diagnostic and prognostic utility of phospholipase: a activity in patients with acute pancreatitis: comparison with amylase and lipase. Clin Chem. 1991;37:356–360. | ||
Tietz NW. Textbook of Clinical Chemistry. 1st ed. Philadelphia, PA: WB Saunders; 1986:1810–1857. | ||
Schenk PW, Cransberg K, Wolff ED, De Rijke YB. Point-of-care creatinine testing in children at risk for sudden deterioration of renal function. Clin Chem Lab Med. 2007;45:1536–1541. | ||
Udy A, O’Donoghue S, D’Intini V, Healy H, Lipman J. Point of care measurement of plasma creatinine in critically ill patients with acute kidney injury. Anaesthesia. 2009;64:403–407. | ||
Jaffe MZ. About generates the precipitation which picric acid in normal urine and a new reaction of creatinine. Z Physiol Chem. 1886;10:391–400. German. | ||
Weber JA, Van Zenten AP. Interferences in current methods for measurements of creatinine. Clin Chem. 1991;37:695–700. | ||
Lo SC, Tsai KS. Glucose interference in Jaffé creatinine method: effect of calcium from peritoneal dialysate. Clin Chem. 1994;40:2326–2327. | ||
Kochansky CJ, Strein TG. Determination of uremic toxins in biofluids: creatinine, creatine, uric acid and xanthenes. J Chromatogr B. 2000;747:217–227. | ||
Kihara K, Yasukawa E. Determination of creatinine with a sensor based on immobilized glutamate dehydrogenase and creatinine deiminase. Anal Chim Acta. 1986;183:75–80. | ||
Battilotti M, Colapicchioni C, Giannini I, et al. Characterization of biosensors based on membranes containing a conducting polymer. Anal Chim Acta. 1989;221:157–161. | ||
Jurkiewicz M, Alegret S, Fabregas E. Comparison of flow injection analytical biosystems based on open-tube and packed-bed enzyme reactors. Anal Chim Acta. 1998;370:47–58. | ||
Jurkiewicz M, Alegret S, Almirall J, Garcia M, Fabregas E. Development of a biparametric bioanalyser for creatinine and urea. Validation of the determination of biochemical parameters associated with hemodialysis. Analyst. 1998;123:1321–1327. | ||
Osaka T, Komaba S, Amano A, Fujino Y, Mori H. Electrochemical molecular sieving of the polyion complex film for designing highly sensitive biosensor for creatinine. Sens Actuators B. 2000;65:58–63. | ||
Kubo I, Karube I. Immobilization of creatinine deiminase on a substituted poly (methylglutamate) membrane and its use in a creatinine sensor. Anal Chim Acta. 1986;187:31–37. | ||
Nguyen VK, Wolff CM, Seris JL, Schwing JP. Immobilized enzyme electrode for creatinine determination in serum. Anal Chem. 1991;63:611–614. | ||
Yamato H, Ohwa M, Wernet WA. Polypyrrole/three-enzyme electrode for creatinine detection. Anal Chem. 1995;67:2776–2780. | ||
Madaras MB, Buck RP. Miniaturized biosensors employing electropolymerized permselective films and their use for creatinine assays in human serum. Anal Chem. 1996;68:3832–3839. | ||
Schneider J, Grundig B, Renneberg R, et al. Hydrogel matrix for three enzyme entrapment in creatine/creatinine amperometric biosensing. Anal Chim Acta. 1996;325:161–167. | ||
Khan GF, Wernet W. A highly sensitive amperometric creatinine sensor. Anal Chim Acta. 1997;351:151–158. | ||
Madaras MB, Popescu IC, Ufer S, Buck RP. Microfabricated amperometric creatine and creatinine biosensors. Anal Chim Acta. 1996;319:335–345. | ||
Shih YT, Huang HJ. A creatinine deiminase modified polyaniline electrode for creatinine analysis. Anal Chim Acta. 1999;392:143–150. | ||
Welton T. Room-temperature ionic liquids. Solvent for synthesis and catalysis. Chem Rev. 1999;99:2071–2083. | ||
Sheldon R. Catalytic reactions in ionic liquids. Chem Commun. 2001;2:399–407. | ||
Song CE. Enantioselective chemo- and bio-catalysis in ionic liquids. Chem Commun. 2004;9:1033–1043. | ||
Gericke M, Fardim P, Heinze T. Ionic liquids – promising but challenging solvents for homogeneous derivatization of cellulose. Molecules. 2012;17:7458–7502. | ||
Arvanitakis Z, Lucas JA, Younkin LH, Younkin SG, Graff-Radford NR. Serum creatinine levels correlate with plasma amyloid Beta protein. Alzheimer Dis Assoc Disord. 2002;16:187–190. | ||
Yoshida M, Higashi K, Kuni K, et al. Distinguishing mild cognitive impairment from Alzheimer’s disease with acrolein metabolites and creatinine in urine. Clin Chim Acta. 2015;441:115–121. | ||
Toledo JB, Shaw LM, Trojanowski JQ. Plasma amyloid beta measurements – a desired but elusive Alzheimer’s disease biomarker. Alzheimers Res Ther. 2013;5:8. | ||
Irizarry MC, Gurol ME, Raju S, et al. Association of homocysteine with plasma amyloid beta protein in aging and neurodegenerative disease. Neurology. 2005;65:1402–1408. | ||
Luchsinger JA, Tang MX, Miller J, Green R, Mehta PD, Mayeux R. Relation of plasma homocysteine to plasma amyloid beta levels. Neurochem Res. 2007;32:775–781. | ||
Rajagopalan P, Refsum H, Hua X, et al. Mapping creatinine- and cystatin C-related white matter brain deficits in the elderly. Neurobiol Aging. 2013;34:1221–1230. |
 © 2015 The Author(s). This work is published and licensed by Dove Medical Press Limited. The
full terms of this license are available at https://www.dovepress.com/terms.php
and incorporate the Creative Commons Attribution
- Non Commercial (unported, v3.0) License.
By accessing the work you hereby accept the Terms. Non-commercial uses of the work are permitted
without any further permission from Dove Medical Press Limited, provided the work is properly
attributed. For permission for commercial use of this work, please see paragraphs 4.2 and 5 of our Terms.
© 2015 The Author(s). This work is published and licensed by Dove Medical Press Limited. The
full terms of this license are available at https://www.dovepress.com/terms.php
and incorporate the Creative Commons Attribution
- Non Commercial (unported, v3.0) License.
By accessing the work you hereby accept the Terms. Non-commercial uses of the work are permitted
without any further permission from Dove Medical Press Limited, provided the work is properly
attributed. For permission for commercial use of this work, please see paragraphs 4.2 and 5 of our Terms.