")
Back to Journals » Psychology Research and Behavior Management » Volume 16
Measurement Invariance and Psychometric Evaluation of the Tendency to Avoid Physical Activity and Sport Scale (TAPAS) Among Mainland Chinese University Students
Authors Saffari M, Chen IH , Huang PC , O’Brien KS, Hsieh YP, Chen JK, Chang YH , Jiang X, Bevan N, Chang YL, Chen JS, Tsai CC, Griffiths MD , Lin CY
Received 13 June 2023
Accepted for publication 29 August 2023
Published 13 September 2023 Volume 2023:16 Pages 3821—3836
DOI https://doi.org/10.2147/PRBM.S425804
Checked for plagiarism Yes
Review by Single anonymous peer review
Peer reviewer comments 2
Editor who approved publication: Dr Igor Elman
Mohsen Saffari,1,2,* I-Hua Chen,3,* Po-Ching Huang,4 Kerry S O’Brien,5 Yi-Ping Hsieh,6 Ji-Kang Chen,7 Yun-Hsuan Chang,8– 11 Xingyong Jiang,12 Nadia Bevan,5 Yen-Ling Chang,13 Jung-Sheng Chen,14 Ching-Chung Tsai,15,16 Mark D Griffiths,17 Chung-Ying Lin4,18– 20
1Health Research Center, Life Style Institute, Baqiyatallah University of Medical Sciences, Tehran, Iran; 2Health Education Department, Faculty of Health, Baqiyatallah University of Medical Sciences, Tehran, Iran; 3Chinese Academy of Education Big Data, Qufu Normal University, Qufu, People’s Republic of China; 4Institute of Allied Health Sciences, College of Medicine, National Cheng Kung University, Tainan, Taiwan; 5School of Social Sciences, Monash University, Melbourne, Australia; 6Department of Social Work, College of Nursing and Professional Disciplines, University of North Dakota, Grand Forks, ND, USA; 7Department of Social Work, Chinese University of Hong Kong, Shatin, New Territories, Hong Kong; 8Institute of Gerontology, College of Medicine, National Cheng Kung University, Tainan, Taiwan; 9Institute of Behavioral Medicine, College of Medicine, National Cheng Kung University, Tainan, Taiwan; 10Department of Psychology, National Cheng Kung University, Tainan, Taiwan; 11Institute of Genomics and Bioinformatics, College of Life Sciences, National Chung Hsing University, Taichung, Taiwan; 12Yangan Primary School of Qionglai City, Qionglai, People’s Republic of China; 13Department of Family Medicine, Cardinal Tien Hospital, New Taipei, Taiwan; 14Department of Medical Research, E-Da Hospital, I-Shou University, Kaohsiung, Taiwan; 15Department of Pediatrics, E-Da Hospital, I-Shou University, Kaohsiung, Taiwan; 16School of Medicine, I-Shou University, Kaohsiung, Taiwan; 17International Gaming Research Unit, Psychology Department, Nottingham Trent University, Nottingham, UK; 18Department of Occupational Therapy, College of Medicine, National Cheng Kung University, Tainan, Taiwan; 19Department of Public Health, College of Medicine, National Cheng Kung University, Tainan, Taiwan; 20Biostatistics Consulting Center, National Cheng Kung University Hospital, College of Medicine, National Cheng Kung University, Tainan, Taiwan
*These authors contributed equally to this work
Correspondence: Chung-Ying Lin, Institute of Allied Health Sciences, Department of Occupational Therapy, Department of Public Health, Biostatistics Consulting Center, National Cheng Kung University Hospital, College of Medicine, National Cheng Kung University, 1 University Road, Tainan, 701401, Taiwan, Tel +886 6 2353535 ext. 5106, Fax +886 6 2367981, Email [email protected] Ching-Chung Tsai, Department of Pediatrics, E-Da Hospital, School of Medicine, I-Shou University, 1 Yi-Da Road, Kaohsiung, 824005, Taiwan, Email [email protected]
Introduction: Preventative factors in young people’s physical inactivity require further understanding, including related psychosocial factors (eg, body image and weight stigma). The Tendency to Avoid Physical Activity and Sport Scale (TAPAS) is a recently developed instrument to address this issue and the present study examined its psychometric properties among Chinese university students particularly in relation to patterns across sex, physical activity (PA) level, and weight status.
Methods: Using a convenience sample of 3142 students (mean age = 19.8 years; 56% female) in mainland China, data were collected using an online survey between August and October 2022. Psychometric instruments including the Weight Bias Internalization Scale, 21-item Depression, Anxiety and Stress Scale, and International Physical Activity Questionnaire Short Form were administered along with the TAPAS to assess convergent and discriminant validity. Multi-group confirmatory factor analysis (CFA) assessed the measurement invariance across specific groups.
Results: The unidimensional structure of the scale was confirmed through CFA (CFI=0.995; RMSEA=0.046). All configural, metric and scalar models of invariance indicated that the scale was invariant across sex, PA level, and weight status. Acceptable convergent and discriminant validity for the scale were found.
Conclusion: The TAPAS is a suitable instrument to assess body image and weight stigma concerns for avoiding physical activity and sport among Chinese university students.
Keywords: confirmatory factor analysis, factor structure, psychometrics, weight stigma, young adults, China
Introduction
Participation in physical activity (PA) is one of the most important ways to prevent and reduce morbidities and mortality related to chronic diseases, such as type II diabetes, cardiovascular disease, and some types of malignancies.1–3 However, the global prevalence of physical inactivity indicates more than half of the world’s population fails to meet the recommended amount of daily physical activity.4 According to the US Centers for Disease Control & Prevention,5 nearly half of American youths are not vigorously active, and the prevalence of moderate to vigorous PA among Chinese school-going adolescents is less than 30%.5,6
There are significant differences in PA based on developmental stages of life, and several longitudinal studies have shown a decrease in PA in the transition from adolescence to young adulthood, and during the college/university years.7,8 The likely causes of such conditions may be related to lifestyle changes including increasing sedentary behaviors because of increased screen-time activities such as using the internet and/or extensive online study periods.9 Moreover, tertiary educational environments may be accompanied by increasing concerns as a problematic stage in the growth cycle due to its associations with psychological problems such as depression and anxiety.10 Moreover, university students continually adapt themselves to new psychosocial environments that allow them to independently make their own choices.11
In a systematic review, Ferreira Silva et al12 assessed the potential barriers of PA among high school and university students. Studies included in this systematic review had a synthesized sample over 15,000 individuals, and several factors were identified as barriers to PA engagement among students. The most common barriers to engaging in PA among this population were lack of time, lack of interest and motivation, inaccessibility to appropriate environments, and psychological/emotional barriers.12 More specifically, psychological or emotional barriers were the most reported barriers.12 For example, low self-motivation is one of the important barriers, particularly among youth. Indeed, the benefits of exercise such as getting fit and being of normal weight are not usually immediate, therefore such individuals may not be sufficiently motivated to engage in regular PA.13 Moreover, having any unpleasant experiences when exercising such as a history of injury may act as an inhibiting factor because individuals think that such consequences may be repeated.14 Poor self-concept and its likely consequences such as low self-confidence and self-efficacy are other psychological barriers. In fact, when unfit individuals (such as those who are overweight/obese) decide to go to a gym or sports club, they may perceive themselves differently to other people who go there resulting in a lack of respect and trust in their abilities due to their unfitness which may impede their PA.15
Psychological distress may be more prevalent among younger people than other individuals, and this may also increase physical inactivity. An earlier investigation regarding the prevalence of PA among university students reported that more than 40% of the synthesized sample (over 35,000 students) did not engage in sufficient PA.16 More recently, low PA has been reported among university students in a review of five different countries comprising United States, Spain, United Kingdom, China, and Italy.17 Overall, studies indicate university students are likely to have low PA particularly due to psychological barriers.18
As aforementioned, one of the psychological barriers regarding an individual’s self-concept is being overweight/obese. Studies have also shown that population body weight has increased in recent times. For example, studies show that between 50% and 70% of students experience weight gain over the university period.19 A large number of university students are at risk of being overweight/obese due to unhealthy eating and physical inactivity, while at the same time, lower rates of PA among students who are obese/overweight have been reported than in those with normal weight.20–22 Obesity is a worldwide epidemic, particularly among young people, and may be associated with various health conditions conducive to reduced quality of life and multiple morbidities.23,24 Moreover, university students are more prone to weight gain and obesity than those who do not go to university.19,25
One of the psychological disorders regarding weight gain – particularly among the youth and university going students – is distorted body image.18 The image that individuals have regarding their body is a dynamic concept that may change over time. Moreover, the transition from adolescence to emerging adulthood can be the most important period in people’s lives and is when they develop a relatively consistent image of their body.26 A recent systematic review examining the associations between body image and physical activity among people aged 21 years or younger found that there were comparatively different relationships between these two variables across age.27 More specifically, in children younger than 7 years, there is an eagerness to participate in any activities irrespective of the needed and relevant competencies. However, as age increases, there is a more accurate appraisal of the individual competencies. After the age of 12 years, adolescents begin to make individual comparisons. Moreover, teasing and gender identification become determinative variables for participation in PA even more than the adolescent’s actual skills. Consequently, as children become adolescents, body image and anthropometric indices (such as weight and height) may determine PA tendency and even complete avoidance.26,28
Weight-related self-stigma is an issue worthy of consideration among university students. It is broadly defined as personal experiences of negative self-evaluation such as feeling ashamed, humiliated, and discriminated against among individuals who are overweight/obese due to their unfitness.29 It may contribute to physical inactivity, as well as mental health problems such as low self-esteem, impaired self-concept and body image, poor quality of life, depression, and anxiety.30–32 This type of stigmatization is concerned with the social devaluation of individuals with obesity and includes individual experiences of discrimination, shame, and negative self-appraisal. It may also decrease self-confidence or willingness to participate in exercise and sports.30,33
The associations between psychological distress (including depression and anxiety) and physical inactivity among individuals who are overweight/obese have also been investigated. For example, Delgado-Floody et al assessed the association of depression with physical activity, body image dissatisfaction, and body mass index among a group of Chilean teenagers with average age of 12 years. They found an inverse association between PA and both depression and BMI. Additionally, higher dissatisfaction of body image was associated with greater depressive symptoms.34 In another study, anxiety and depression among police officers who were at risk of excess weight, reported there were near to significant associations between increase of anxiety/depressive symptoms and lower level of PA among those with increased BMI.35 These studies appear to show that there are meaningful relationships between psychological distress and weight gain that may negatively impact the level of an individual’s PA.
Several studies have explored the associations between weight-related self-stigma, body image, and PA and have suggested that fear of negative appearance appraisals may be related to the tendency to avoid PA.36,37 This kind of avoidance is called exercise avoidance and is related to active escape from doing any exercise or sport mostly due to insufficient motivation.38 In fact, a high degree of weight-related self-stigma may inhibit individuals from participating in physical activity by reducing the motivation, intention or tendency to exercise. These psychosocial factors, even independent of body mass index (BMI), may act as a barrier to physical activity, especially among young females.39
Understanding the association between personal attitudes/beliefs with exercise engagement will help healthcare professionals find strategies and treatments to prevent problematic concerns related to body image. Consequently, this information may help to increase motivation toward PA, particularly among individuals with obesity.37 Overall, the research has shown factors such as physical appearance, body satisfaction, weight stigma, and weight management may be associated with participation in PA. However, the relationship between the body satisfaction and PA is still not well-understood.40,41 Nevertheless, despite the importance of assessing the associations between body image beliefs and physical activity participation, most public health messaging focuses on individualized weight loss in physical activity behavior, which promotes stigmatizing and discriminating messaging.36,42 However, previous studies have not provided sufficient knowledge on the likely reasons concerning unwillingness to engage in PA among individuals’ who are overweight/obese or the mechanisms involved.
To fill the gap regarding the inadequate understanding of how weight stigma may affect PA, Bevan et al42 developed the Tendency to Avoid Physical Activity and Sport Scale (TAPAS) to assess if weight stigma/appearance concerns relate to individuals tending to avoid PA.42 To develop the TAPAS, Bevan et al42 used the checklist of Consensus-based Standards for the selection of health status Measurement Instruments.43 At first, a mixed-method survey was conducted with 496 students to identify the likely reasons for avoiding participation in the PA and sport. Then, using a thematic analysis, the initial themes for PA avoidance were identified with three of them being focused on weight and physical appearance concerns. These themes were subsequently used to develop an initial pool of 21 items. After several stages of interpretability checking, the face validity of items was assessed among nine university students. A total of 10 questions remained after this process. The developers used the classical test theory approach with a sample of 578 university students (74% females, mean age of 19.8 years) to validate the 10-item scale using methods to assess predictive validity and construct validity, as well as testing the internal consistency and stability of the scale over time. Exploratory factor analysis was also used to identify the scale’s factors. The findings showed that the scale assessing likely psychosocial reasons for avoiding PA had appropriate psychometric properties with a unidimensional structure. The total score was predictive of lower levels of motivation and enjoyment for participation in PA (p<0.001) with excellent internal consistency (Cronbach’s alpha=0.93). Therefore, the instrument may be useful to assess this concept in English-speaking populations. However, because the scale has been newly developed, there is a dearth of information regarding its psychometric properties, especially how it performs in other cultures and languages.
In addition, applying supplemental evaluation of the measurement quality of the scale will help to clarify the scale’s utility among different populations. Measurement invariance is a statistical technique to assess the similarity of a measured concept among different or specific subject categories.44 For example, for individuals from different cultures or across different sexes, measurement invariance can be used to indicate how these groups interpret their reasons for avoiding participation in physical activity and how much their responses are similar. Indeed, appropriate measurement invariance may corroborate the feasibility of the scale for use in different settings as well as the comparability of the assessed data.45 The present study also examined the associations between the psychological status of the participants and their tendency to avoid physical activity to understand how their reasons for non-participation in PA may be consistent with mental health components such as stress, depression, and anxiety, as explored in previous studies.46–48
Given the high prevalence of sedentary behaviors and obesity among university students that may concurrently affect their tendency for participation in PA, this group is an appropriate sample for further psychometric investigation of the scale among the Chinese (Mandarin) population. However, psychometric evidence for the TAPAS has only been reported for an Australian sample. Therefore, it is unclear if the TAPAS is useful and applicable for use in other ethnic populations, such as Chinese university students. Therefore, the present study was designed to examine if the scale assesses the tendency to avoid PA among individuals from both sexes and among those in different levels of PA appropriately, as well as assessing the factor structure and convergent/divergent validity of the scale in term of consistency with mental health status. Therefore, the present study aimed to: (i) assess the psychometric properties of TAPAS Chinese university students; (ii) examine the associations between psychological factors (eg, depression and anxiety) and tendency to avoid PA; and (iii) assess if the factor structure of TAPAS was measurement invariant across sex, PA level, and weight status.
Methods
Procedure and Participants
The study was approved by the Institutional Review Board of the Jiangxi Psychological Consultant Association (IRB ref: JXSXL‐2021‐J99) and the Human Research Ethics Committee of the National Cheng Kung University (Approval No. NCKU HREC-E-110-486-2). Convenience sampling was used to collect the data. First, an invitation was sent to the faculties working in mainland Chinese universities. Subsequently, for those who agreed to help with the data collection, a hyperlink of the survey was provided to them and these faculties disseminated the link or the QR code to potential participants. The data collection period was from 19 August to 14 October, 2022.
The inclusion criteria for participation in the study were (i) being aged 18 years or above; (ii) studying at a university in mainland China; and (iii) providing their electronic informed consent to participate in the study. The participants in the present study were recruited from 19 universities across 13 provinces in mainland China (N = 3142). The participants had a mean age of 19.8 years (SD = 4.14). Slightly more than half of the participants were females (n = 1773; 56.4%), and slightly over two-fifths were overweight (n = 1297; 41.5%).
Measures
Tendency to Avoid Physical Activity and Sport Scale (TAPAS) and Translation Procedure
The TAPAS contains 10 items assessing to what extent an individual avoids participating in physical activity due to weight or appearance concerns. A sample item of the TAPAS is “I avoid physical activity because I don’t like how my body looks when exercising”. All the TAPAS items are rated on a five-point Likert scale from 1 (strongly disagree) to 5 (strongly agree) with a higher score indicating higher levels of tendency to avoid physical activity and sport.42 The English version TAPAS was found to have good psychometric properties (eg, Cronbach’s α = 0.94).49 The TAPAS is a newly developed instrument and was therefore translated from the original English version into Chinese using a standardized translation procedure.50 First, two bilingual translators whose native language is Chinese (Mandarin) were invited to independently conduct forward-translation (ie, from English to Chinese). Then, the corresponding author discussed the translated versions with the two translators to generate a reconciled Chinese version for back-translation. The reconciled Chinese TAPAS was then back-translated into English by a third bilingual translator who was not aware of the original TAPAS. After the reconciled Chinese TAPAS was back-translated into English, the corresponding author called a meeting including the original two forward-translators, the back-translator, and experts with the expertise of pediatrics, public health, psychometrics, physical activity, and weight to review all the TAPAS materials (ie, the two forward-translated Chinese versions of the TAPAS, the back-translated TAPAS, the reconciled TAPAS, and the original TAPAS). A final draft of the Chinese TAPAS was then approved by the expert panel. Finally, several university students were invited to evaluate the wordings and readability of the draft TAPAS. Some minor wordings were revised to improve the readability at this stage.
Weight Bias Internalization Scale (WBIS)
The WBIS contains 11 items assessing to what extent an individual possesses weight-related self-stigma. A sample item of the WBIS is “My weight is a major way that I judge my value as a person”. All the WBIS items are rated on a five-point Likert scale from 1 (strongly disagree) to 5 (strongly agree) with a higher score indicating higher levels of weight-related self-stigma.51 The present study used the Chinese WBIS, which has been found to be psychometrically sound (eg, Cronbach’s α = 0.79).52,53 The internal consistency of the WBIS in the present sample was very good: Cronbach’s α=0.89; McDonald’s ω=0.91.
21-Item Depression, Anxiety, Stress Scale (DASS-21)
The DASS-21 contains 21 items assessing to what extent an individual feels psychologically distressed (ie, depression, stress and anxiety). A sample item of the DASS-21 is “I found it hard to wind down”. All the DASS-21 items are rated on a four-point Likert scale from 0 (did not apply to me at all) to 3 (applied to me very much or most of the time) with a higher score indicating higher levels of psychological distress.51 The present study used the Chinese DASS-21, which has been found to be psychometrically sound (eg, Cronbach’s α = 0.92).54 The internal consistency of the WBIS in the present sample was excellent: Cronbach’s α=0.95; McDonald’s ω=0.95.
International Physical Activity Questionnaire Short Form (IPAQ)
The IPAQ contains seven items assessing to what extent an individual engages in physical activity (the entire IPAQ is provided in the Supplementary Material A). A sample item of the IPAQ is “During the last 7 days, how much time did you spend sitting on a week day?”. Each IPAQ item asks how much time an individual has spent on an activity associated with physical activity or physical inactivity.55 Then, the time spent on each activity is converted into metabolic equivalent of task (MET) and later used to classify the level of physical activity: inactive, minimally active, and health enhancing physical activity according to the IPAQ guideline (International Physical Activity Questionnaire Research Committee 2015). More specifically, MET = 1 for sitting; 3.3 for walking; 4 for moderate physical activities (eg, jogging); and 8 for vigorous physical activities (eg, swimming). Then, the MET for the activity was multiplied by the amount of engagement time to obtain the MET-minutes for further classification for inactive, minimally active, and health enhancing physical activity using an online code.56 The present study used the Chinese IPAQ, which has been found to be psychometrically sound (eg, content validity = 0.99).32,57–61
Demographic Information
Several demographic questions were asked including the participants’ age (in years), height (in cm), weight (in kg), and whether they were an only-child (yes/no). Body mass index (BMI) of the participants was calculated using weight (in kg) divided by squared height (in m).
Data Analysis
Descriptive statistics such as means, standard deviations, and frequencies (percentages) were used to summarize the participants’ characteristics and the TAPAS item score distributions. Moreover, the weight status of the present sample was summarized using frequencies and percentages with a BMI > 23 kg/m2 classified as being overweight (Asian norm proposed by the World Health Organization).62 Moreover, for participants who did not complete all items on the IPAQ, their data were not used for the statistical analyses in the PA-related analyses (eg, measurement invariance across different PA levels). The reason for removing them from PA-related analyses was because the IPAQ scoring needs all items for calculation. However, for other analyses, the entire sample’s data were used.
Regarding psychometric testing, the following statistics were used; internal consistency (together with corrected item-to-total correlation) was assessed using Cronbach’s α and McDonald’s ω (> 0.7 indicates satisfactory).63 Confirmatory factor analysis (CFA) with a diagonally weighted least squares estimator was used to examine if the TAPAS has a unidimensional structure. In the CFA, non-significant χ2 test, comparative fit index (CFI) > 0.9, Tucker-Lewis index (TLI) > 0.9, root mean square error of approximation (RMSEA) < 0.08, and standardized root mean square residual (SRMR) < 0.08 together indicate good data-model fit (ie, the data derived from the present sample fitted well with the proposed unidimensional structure of TAPAS).64–66
Multigroup CFA was used to examine if the supported unidimensional structure of TAPAS was invariant across sex (ie, male and female subgroups), physical activity level (ie, inactive, minimally active, and health-enhanced physical activity subgroups), and weight status (ie, being overweight and not being overweight). Before conducting the multigroup CFA, the TAPAS was first examined to see whether it had a one-factor structure for each subgroup using the aforementioned fit indices (ie, CFI and TLI > 0.9; SRMR and RMSEA < 0.08). In the multigroup CFA, three nested models were used. First, a configural model that did not constrain any factor loadings or item intercepts equal across groups; a metric invariance model that constrained all factor loadings but not item intercepts equal across the group; and a scalar invariance model that constrained all factor loadings and item intercepts equal across the group.67 Metric invariance is supported if ΔCFI and ΔTLI > −0.01 with ΔRMSEA and ΔSRMR < 0.01 when comparing the nested configural and metric invariance models; scalar invariance is supported if ΔCFI and ΔTLI > −0.01 with ΔRMSEA and ΔSRMR < 0.01 when comparing the nested metric invariance and scalar invariance models.68–70
Convergent/discriminant validity of the TAPAS was examined by how the TAPAS total score associated with the WBIS total score, and how the TAPAS total score was associated with the DASS-21 total score. Moreover, the two dependent associations were compared using Steiger’s method.71,72 Lastly, the known-group validity of the TAPAS was examined using sex and physical activity level with independent t-tests or analyses of variance. It was hypothesized that females, when compared with males, would have higher TAPAS scores, and that participants with a lower level of physical activity compared with those with a higher level of physical activity would have higher TAPAS scores. Cohen’s d was used to examine the effect size of the differences: d at 0.2 indicates a small effect size; 0.5 indicates a medium effect size; and 0.8 indicates a large effect size.73
Results
The present sample (N = 3142) was relatively young (mean age = 19.8 years; SD age = 4.14), with slightly more females (n = 1773; 56.4%). On average, the BMI of the present sample was 25.66 (SD = 10.24) with 41.5% (n = 1297) being overweight. For those who completed the IPAQ (n = 2168), over a quarter were physically inactive (n = 817; 26.0%), more than one-tenth were minimally active (n = 407; 13.0%), and nearly one-third were health-enhanced physically active (n = 944; 30.0%). The participants’ total scores were 23.44 for the TAPAS (SD = 8.70), 26.64 for the WBIS (SD = 7.76, and 11.59 for the DASS-21 (SD = 10.29) (Table 1).
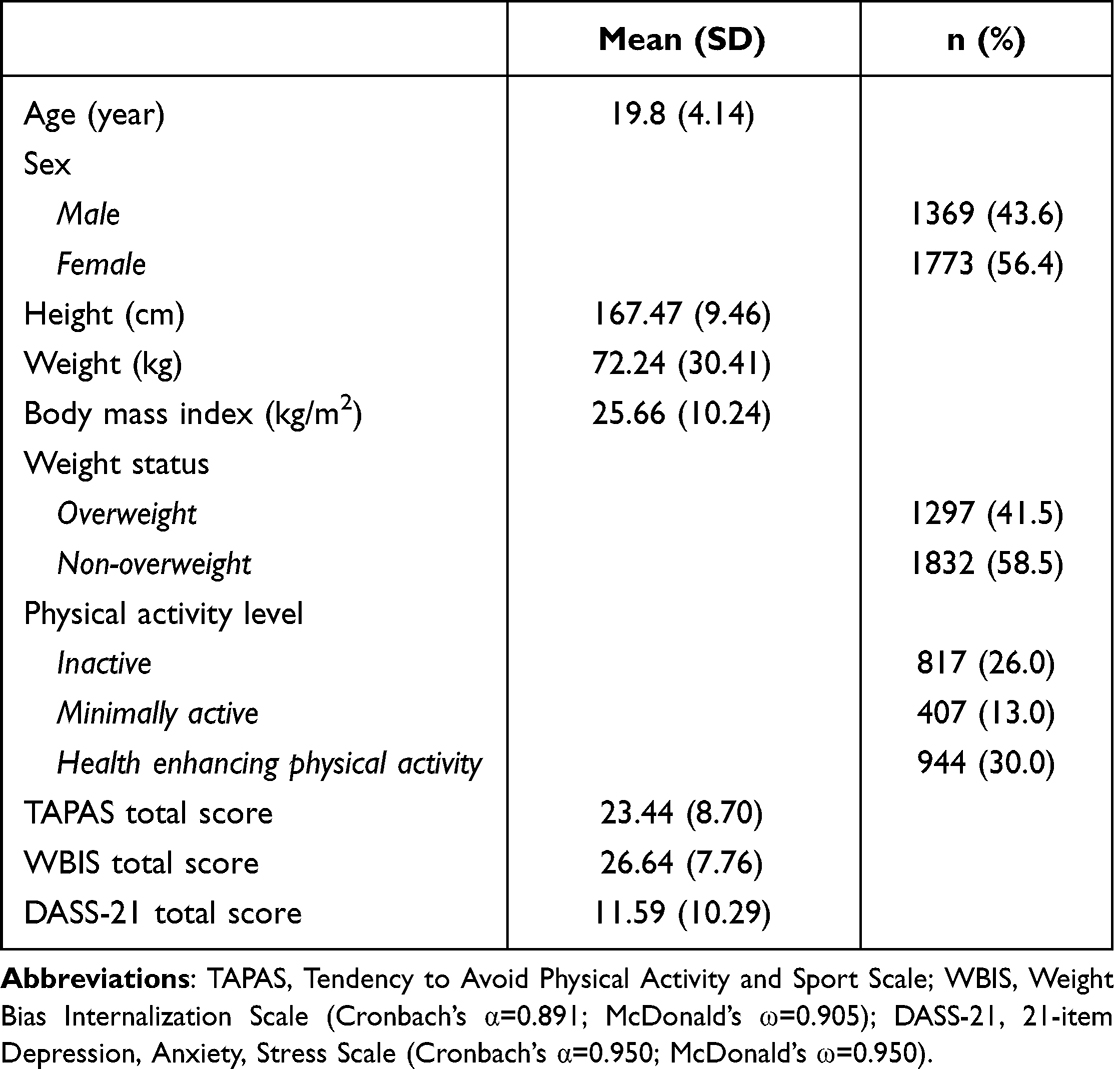 |
Table 1 Participant Characteristics (N=3142) |
The score distributions of each TAPAS item for the entire sample and different subsamples (including male subsample, female subsample, inactive physical activity subsample, minimal physical activity subsample, health enhancement physical activity subsample, being overweight subsample, and not being overweight subsample) are presented in Table 2. For the entire sample, all items were distributed normally with skewness values ranged between 0.05 and 0.56; kurtosis values were between −0.75 and −0.12. The internal consistency of the entire TAPAS was excellent given that both Cronbach’s α (0.96) and McDonald’s ω (0.95) were very high. Moreover, the corrected item-to-total correlations of the TAPAS items ranged from moderate to high (0.66 to 0.88). The unidimensional structure of the TAPAS was supported by the fit indices in the CFA: CFI = 0.995; TLI = 0.993; RMSEA (90% CI) = 0.046 (0.041, 0.052); and SRMR = 0.048, except for the significant χ2 test (χ2 = 272.58; df = 35; p<0.001). Additionally, all factor loadings of the TAPAS items were moderate to high (0.671 to 0.903; Table 2). Similar findings regarding score distribution, factor loading, internal consistency, corrected item-to-total correlation, and CFA fit indices were observed for all the subsamples (Table 2).
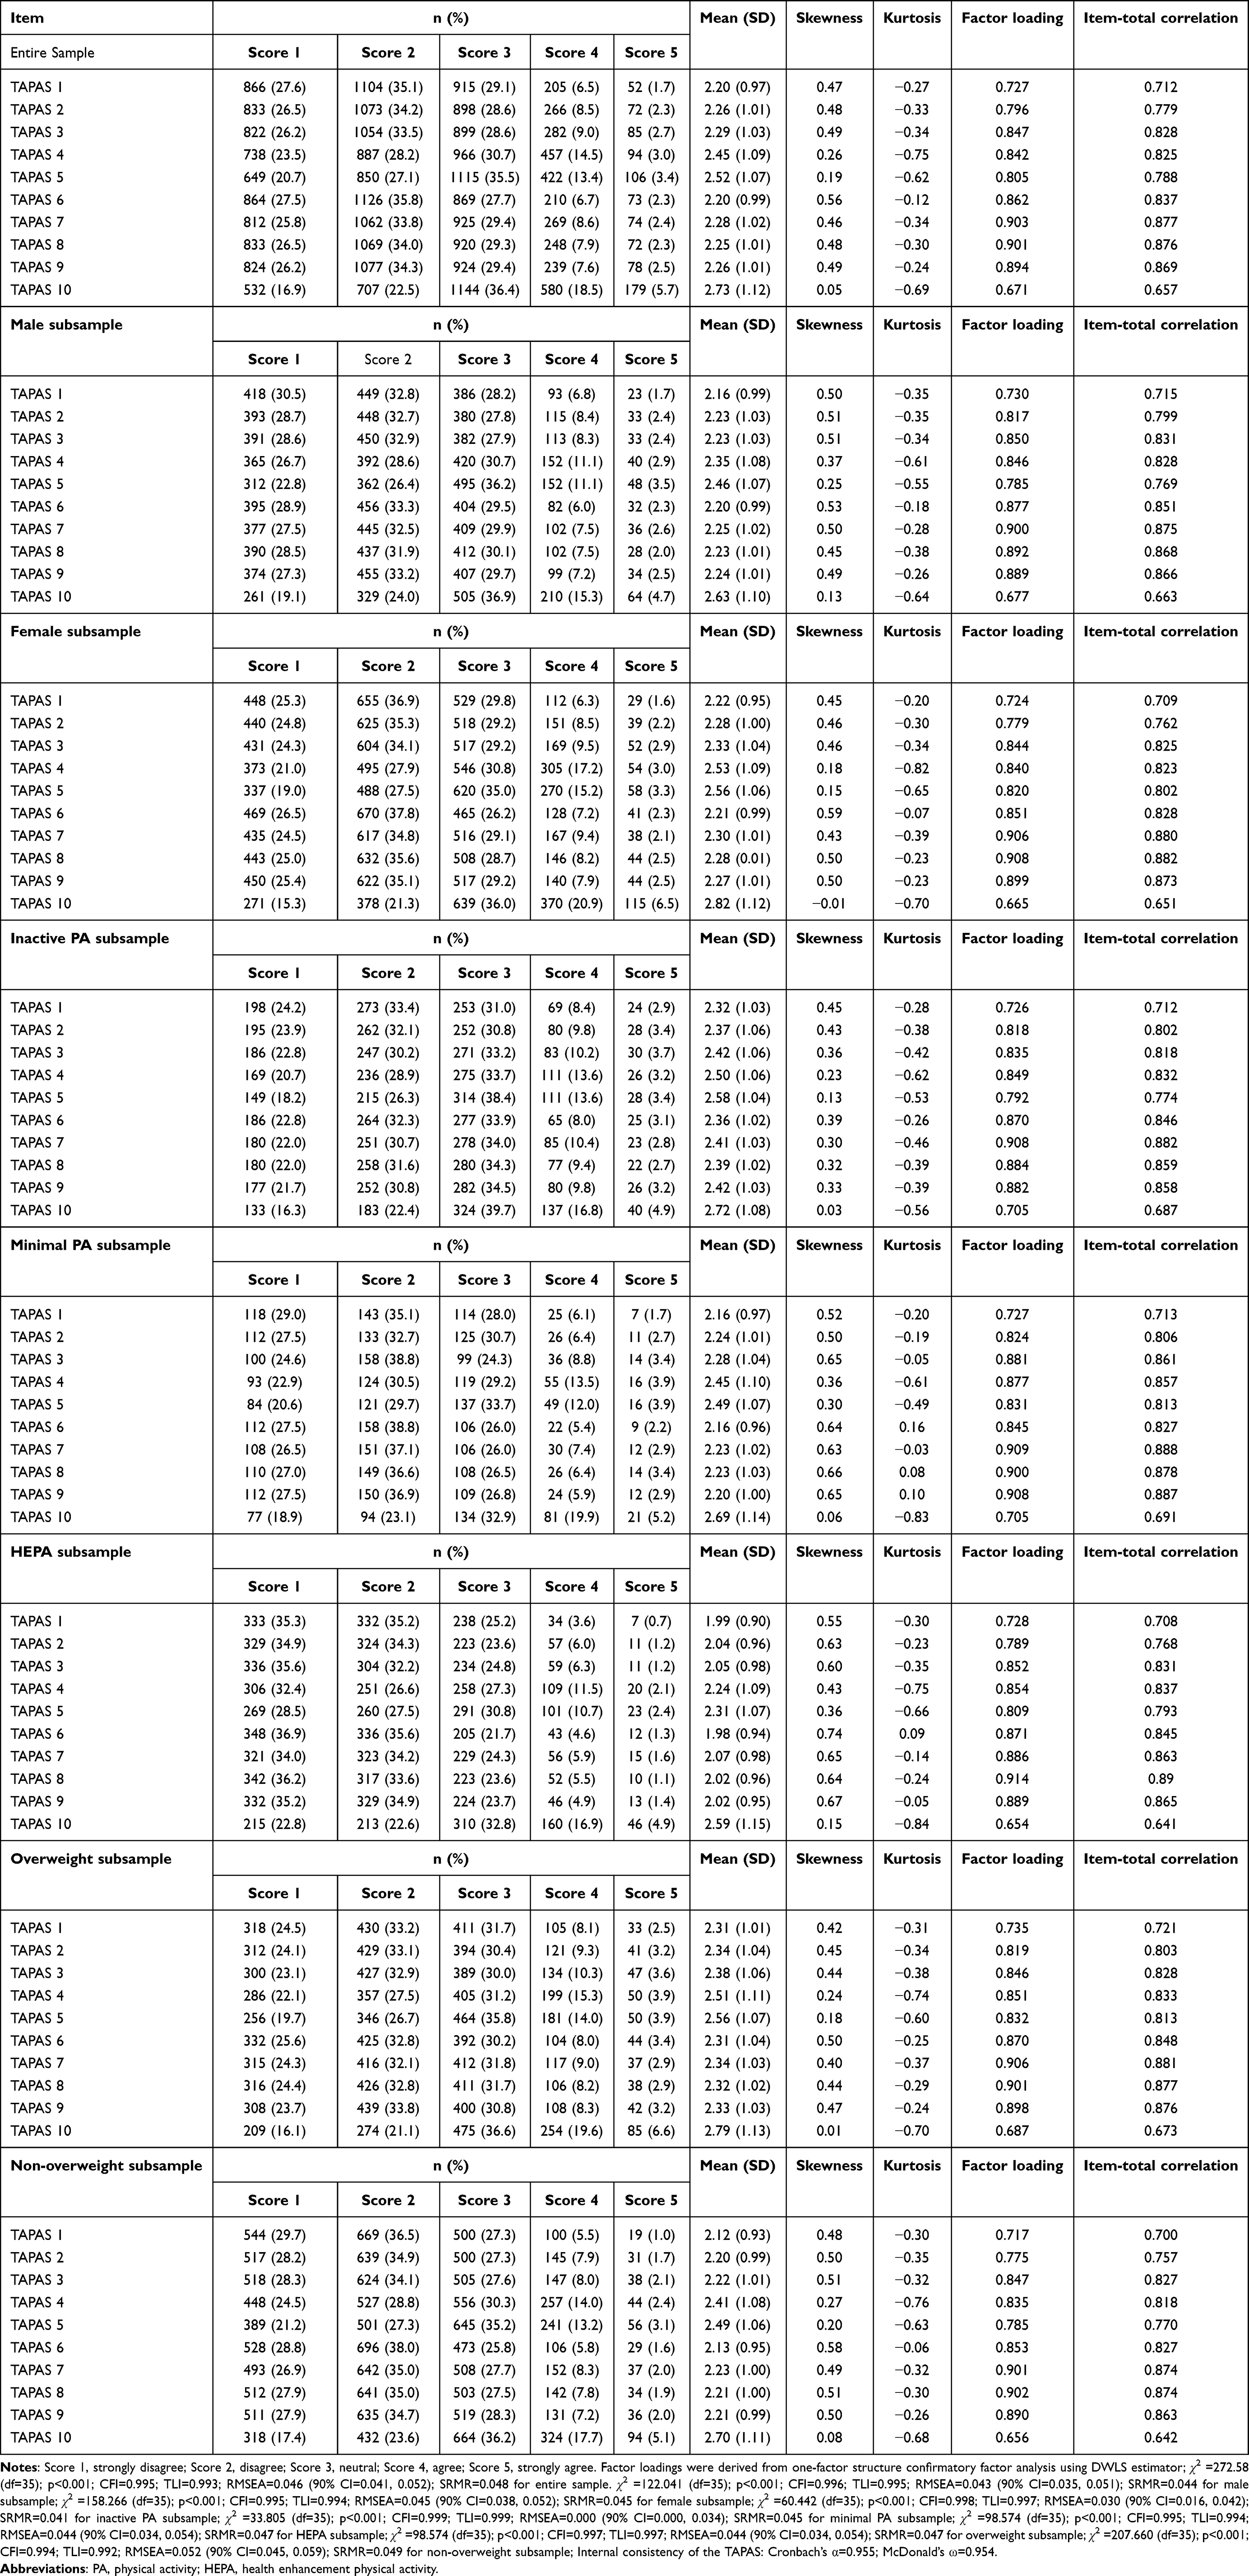 |
Table 2 Score Distributions of the Tendency to Avoid Physical Activity and Sport Scale (TAPAS) |
The unidimensional structure of the TAPAS was found to be invariant across sex and physical activity level. More specifically, the metric invariance models were not substantially worse than the configural models (ΔCFI = 0.000, ΔTLI = 0.001, ΔRMSEA = −0.002, and ΔSRMR = 0.002 for sex; ΔCFI = 0.000, ΔTLI = 0.000, ΔRMSEA = 0.001, and ΔSRMR = 0.005 for physical activity level; ΔCFI = 0.000, ΔTLI = 0.000, ΔRMSEA = −0.002, and ΔSRMR = 0.001 for weight status); the scalar invariance models were not substantially worse than the metric invariance models (ΔCFI = 0.000, ΔTLI = 0.000, ΔRMSEA = 0.000, and ΔSRMR = −0.003 for sex; ΔCFI = −0.001, ΔTLI = 0.001, ΔRMSEA = −0.001, and ΔSRMR = −0.002 for physical activity level; ΔCFI = 0.000, ΔTLI = 0.001, ΔRMSEA = −0.002, and ΔSRMR = 0.001 for weight status; Table 3).
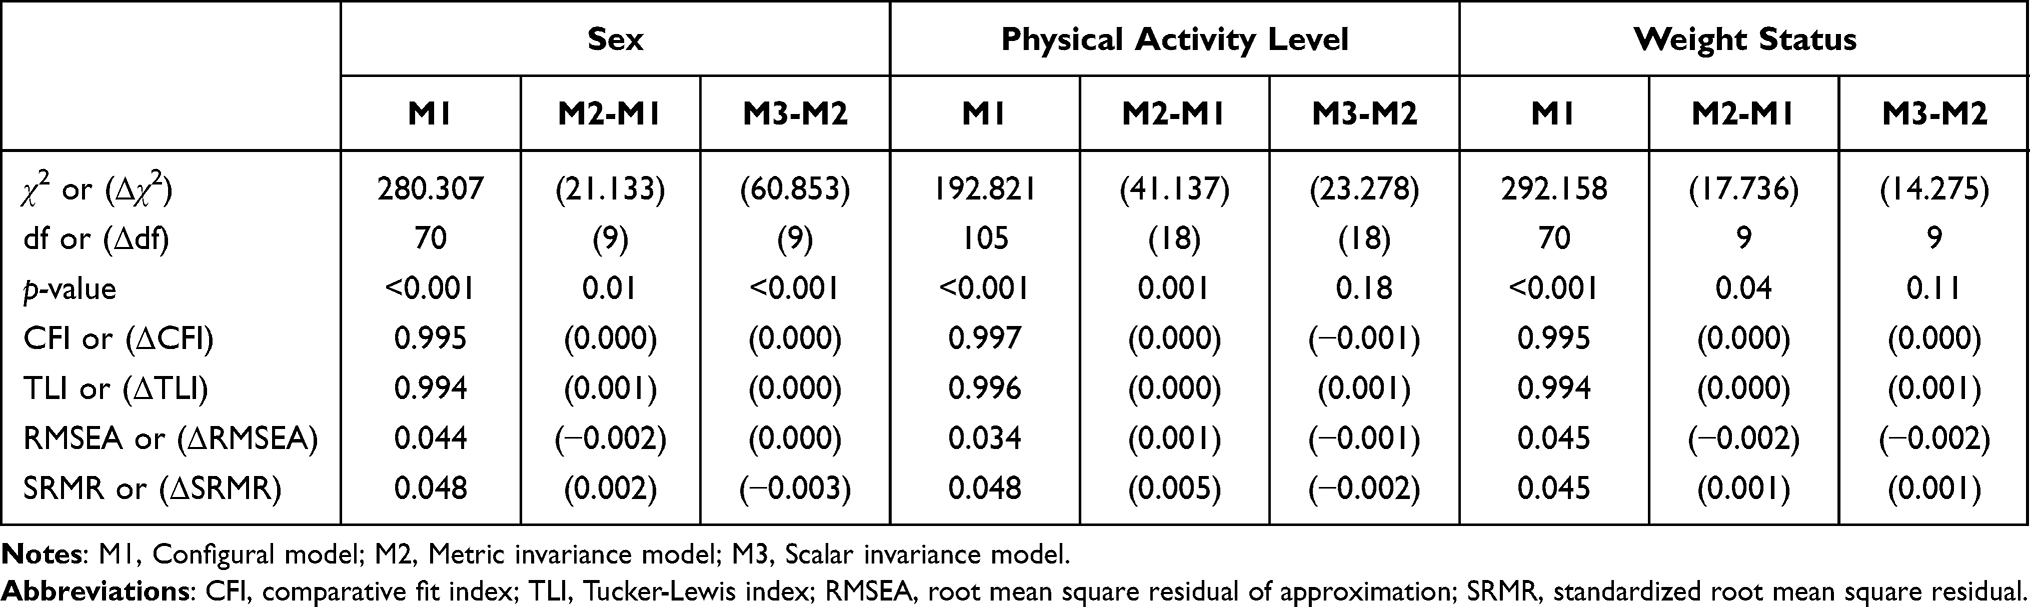 |
Table 3 Multigroup Confirmatory Factor Analysis of the Tendency to Avoid Physical Activity and Sport Scale (TAPAS) |
The convergent/discriminant validity of the TAPAS was supported by the significant correlations between the TAPAS total score and the WBIS total score (r = 0.75; p<0.001) and between the TAPAS total score and the DASS-21 total score (r = 0.41; p<0.001). Moreover, the association between TAPAS total score and WBIS total score was significantly higher than the association between TAPAS total score and DASS-21 total score (z = 24.04; p<0.001). The known-group validity of the TAPAS was supported by the significant differences between physical activity levels and between sex groups. More specifically, participants with inactive PA levels had significantly higher TAPAS scores than those with minimally active levels (d = 0.15; p=0.012), and those with health-enhancing physical activity (d = 0.37; p<0.001). Participants with minimally active levels had significantly higher TAPAS scores than those with health-enhancing physical activity (d = 0.21; p<0.001). Females also had significantly higher TAPAS scores than males (d = 0.09; p=0.009; Table 4).
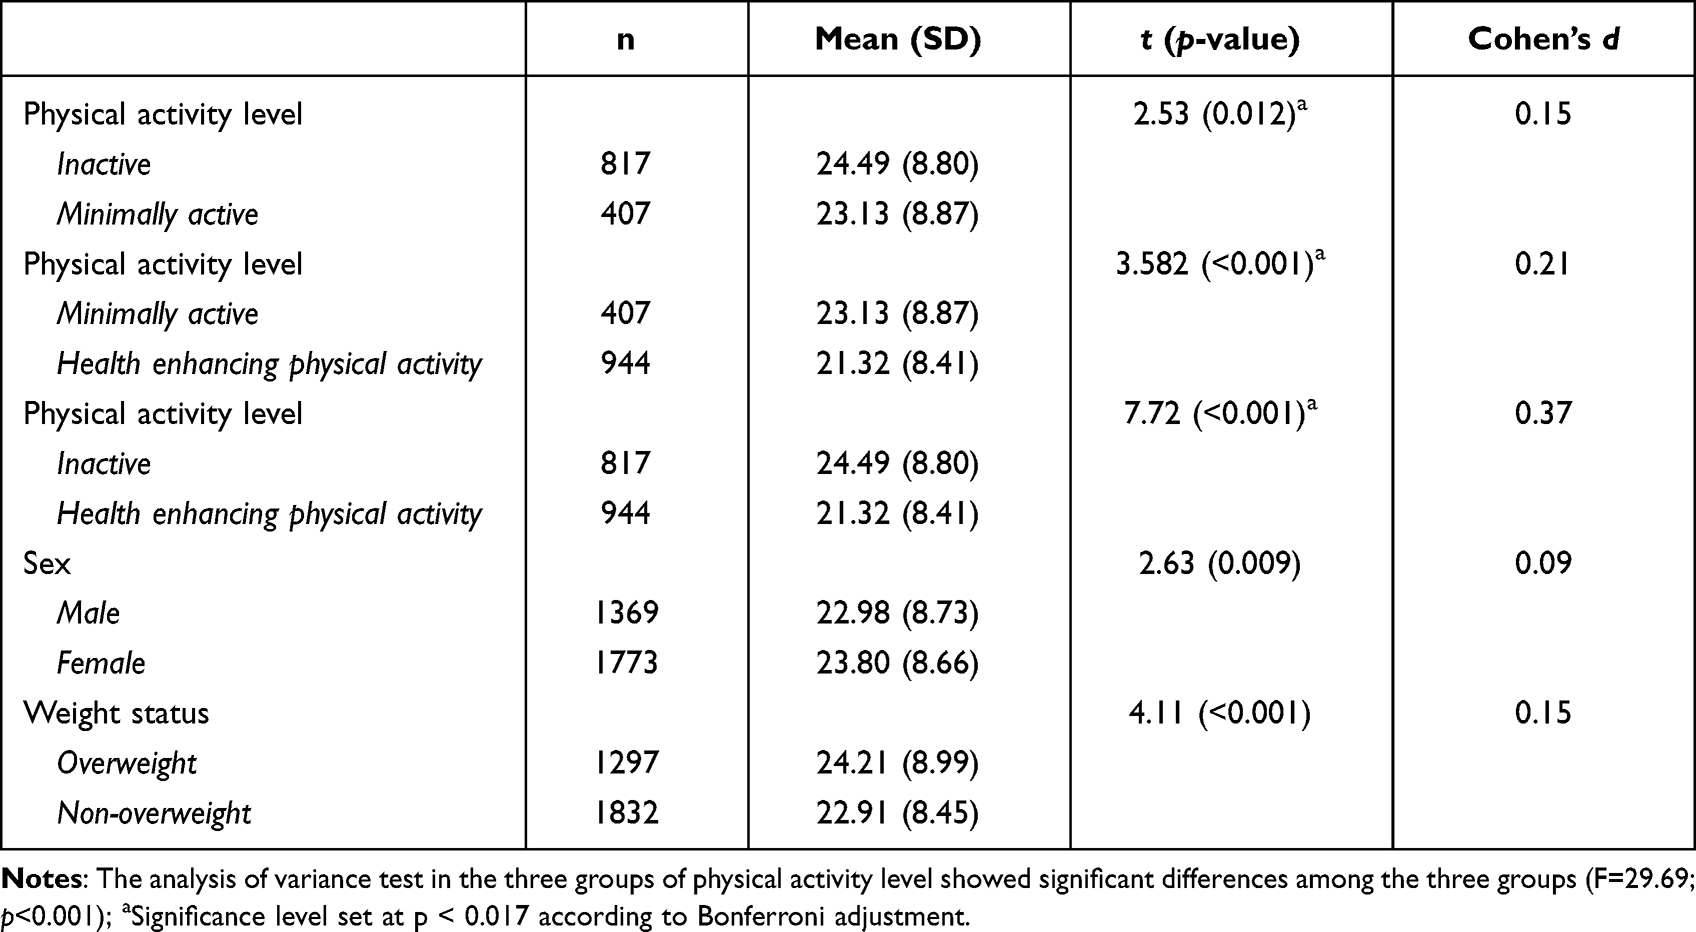 |
Table 4 Known-Group Validity of the Tendency to Avoid Physical Activity and Sport Scale (TAPAS) |
Discussion
In the present study, the psychometric properties of a new scale for assessing the tendency to avoid physical activity (ie, TAPAS) among Chinese university students were examined. The results showed the TAPAS assesses the concept as expected by its construct, but also had good predictive validity based on physical activity participation, and also convergent/discriminative validity based on the correlations with the WBIS and DASS-21. However, the novel feature that differentiates the present study from the original development study was the testing of measurement invariance to indicate how the scale may produce similar results among different groups of individuals based on sex and exercise level. The findings supported scale’s validity for use among both sexes and for individuals who participate in different levels of PA.
Pearl et al39 in a systematic review assessed the relationship between weight stigma and PA, and found in many studies that these two variables were negatively correlated (internalizing weight stigma was significantly associated with decreased physical activity). Similarly, in a cross-sectional study, Ajibewa et al36 investigated the association between physical activity avoidance and weight stigma among undergraduate university students. Their findings also demonstrated that previous experiences with weight stigma were positively correlated with PA avoidance.36 Consistently, the findings in the present study indicated a significant relationship between the TAPAS and IPAQ, which appears to indirectly confirm the predictive validity of the TAPAS.
In the original scale development, predictive validity was assessed through two specific items comprising participation in vigorous physical activity or sport during the past two months.49 However, in the present study, predictive validity was assessed using an international standard scale for PA (ie, the IPAQ) that arguably increases the external validity of the assessment. Nevertheless, both studies showed the TAPAS was significantly associated with the level of PA among participants, indicating any changes in participation in PA due to body image or weight concerns may be appropriately detected, particularly among youth populations. This is also consistent with prior research on associations between physical appearance and interest in participating in PA.41,42
In the present study, assessment of the convergent/discriminant validity of the scale was performed using various variables including weight self-stigma, stress, anxiety, and depression. Indeed, these variables were chosen to examine how the TAPAS may be correlated with such variables that all assess different but associated factors compared to TAPAS. In the initial development of the scale, Bevan et al49 used different psychometric scales than those used in the present study.49 For example, to assess convergent validity, they applied the Perception of Teasing Scale for weight stigma,49 which assesses the frequency and perceived harms related to weight stigma during the past year. Also, instead of the DASS-21 to assess discriminant validity, they chose scales that evaluated physical appearance and fear of negative appearance. However, in both studies, findings showed the TAPAS had acceptable convergent and discriminant validity when compared with a wide range of psychological variables.
The developers of the TAPAS reported a unidimensional structure for the items through exploratory factor analysis indicating that all items assessed a single concept (ie, a tendency to avoid PA and sport).49 The present study examined the scale’s structure using a confirmatory factor analysis and found similar findings indicating a single-factor structure for the scale. The analysis further examined this structure and found invariance across both sex and physical activity using different statistical models. All configural, metric, and scalar invariance models that were used for multi-group factor analysis demonstrated the scale’s invariance across sex and PA indicating the TAPAS may be applied for all the groups with the same factor loadings and similar intercepts.67 In other words, the scale is appropriate to assess the tendency to avoid PA and sports among individuals of different sexes or different levels of physical activity while maintaining its factorial structure across these groups.
Another finding of the present study as replicated in the initial validation study was the acceptable known-group validity when administrating of the scale among individuals with different levels of physical activity and different sex.49 This finding shows that the TAPAS is an efficient instrument helping healthcare providers to differentiate individuals with different features (ie, physical activity level and sex). As hypothesized, individuals who had lower levels of physical activity concurrently reported greater avoidance of engaging in PA and vice versa. This is also is congruent with the consistency in the attitude and value system of the individuals and their behaviors toward PA that have frequently has been addressed in other studies.74,75
Similarly, as found in the known-group validity, male and female university students reported different tendencies to avoid PA and sport. Several studies have already reported that (compared to males) females may less be motivated to engage in PA due to their concerns regarding body image or physical appearance.28,76 Therefore, the findings here are consistent with previous research, suggesting a need to further investigate potential factors to motivate females, given the prevalence of obesity among young females may intensify the psychosocial harms of weight stigma and appearance-related concerns in the tendency to avoid PA.
The findings of the present study have several implications. For example, by assessing the likely reasons underlying physical inactivity among Chinese people who are overweight/obese, researchers and health practitioners can begin to understand how weight stigma contributes to physical inactivity among this population. This would also provide further data for comparing the likely differences between eastern and western populations in term of cultural features that may influence the associations between these conditions. The TAPAS also may be used as a screening tool for early detection of negative attitudes regarding weight stigma among Chinese people that may prevent them from engaging in PA and sports. Moreover, such information would be helpful in designing educational programs and preventive interventions.
The strength and novelty of the present study mostly relate to the rigor in assessing the feasibility of the Chinese TAPAS for use among individuals with different levels of PA, both genders, and various weight ranges. This was confirmed through the rigorous testing of measurement invariance. However, despite the novelty, the large sample size, and the use of robust statistical methods to psychometrically evaluate the TAPAS, the study still has some limitations. First, a convenience sample of university students was used that may not be representatives of all Chinese youths. Therefore, using a probability sampling method could be used to increase the generalizability of the findings in future studies. Second, an online system for data collection was used to improve the accessibility of participants and reduce the costs of paper data collection. However, this kind of data gathering may further expose data to recall and reporting bias than traditional methods.77 Moreover, identity of respondents could not be confirmed when participating in the study. Nevertheless, because of the limitations due to the current COVID-19 pandemic and the need for an adequate sample size, online recruitment was the most appropriate and cost-efficient. Third, usually self-reports scales as used in the present study may increase the risk of self-selection bias due to social desirability and a there was a high proportion of participants in the health enhancing PA group. Similarly, using a convenience sample may increase selection bias because those who chose to respond were more perhaps more likely to be of a healthy weight and physically active, and therefore may not have been the ideal target population to test the psychometrics of the TAPAS, which seems geared towards those who are overweight or obese and who are not active. Finally, the focus of the study’s assessment was based on the classical test theory approach. Using more advanced psychometric assessment such as Rasch analysis would provide more accurate results and is recommended for future research.
Conclusion
The findings of the present study suggest the Chinese version of the TAPAS is a valid and reliable instrument to assess concerns regarding the weight stigma and body image that may impede individuals from participating in PA and exercise, particularly among university students. Because supporting results on measurement invariance of the scale were found across the sexes and PA levels, the scale appears to provide an identical model of conceptualization and similar response patterns with regard to these variables (ie, PA level and sex). However further investigations of the TAPAS across other cultures and examining other socio-demographic factors will help to assess the feasibility of the scale for different populations with various cultural and demographic backgrounds.
Data Sharing Statement
Data and code may be obtained from the corresponding author with reasonable request.
Ethics Approval and Informed Consent
The present study was approved by the Institutional Review Board of the Jiangxi Psychological Consultant Association (IRB ref: JXSXL‐2021‐J99) and the Human Research Ethics Committee of the National Cheng Kung University (Approval No. NCKU HREC-E-110-486-2). Also, the study was conducted in accordance with the guidelines outlined in the Declaration of Helsinki including obtaining e-form informed consent, protection of privacy and confidentiality of personal information.
Acknowledgments
We thank all the participants in the study.
Author Contributions
All authors made a significant contribution to the work reported, whether that is in the conception, study design, execution, acquisition of data, analysis and interpretation, or in all these areas; took part in drafting, revising or critically reviewing the article; gave final approval of the version to be published; have agreed on the journal to which the article has been submitted; and agree to be accountable for all aspects of the work.
Funding
This research was funded by Asia University Hospital, grant number 11151007, the internal fund of E-Da Hospital (EDAHP108049), the Ministry of Science and Technology, Taiwan (MOST 110-2410-H-006-115; MOST 111-2410-H-006-100), and the Higher Education Sprout Project, Ministry of Education to the Headquarters of University Advancement at National Cheng Kung University (NCKU). This project was also supported by the International Research Collaboration Fund granted by the Department of Social Work, The Chinese University of Hong Kong (Grant number: 19231106).
Disclosure
All authors declare no conflicts of interest in this work.
References
1. Eaglehouse YL, Kramer MK, Rockette-Wagner B, Arena VC, Kriska AM. Evaluation of physical activity reporting in community diabetes prevention program lifestyle intervention efforts: a systematic review. Prev Med. 2015;77:191–199. doi:10.1016/j.ypmed.2015.05.023
2. McTiernan A, Friedenreich CM, Katzmarzyk PT, et al. Physical activity in cancer prevention and survival: a systematic review. Med Sci Sports Exerc. 2019;51(6):1252–1261. doi:10.1249/MSS.0000000000001937
3. Vasankari V, Halonen J, Vasankari T, et al. Physical activity and sedentary behaviour in secondary prevention of coronary artery disease: a review. Am J Prevent Cardiol. 2021;5:100146. doi:10.1016/j.ajpc.2021.100146
4. Marques A, Sarmento H, Martins J, Saboga Nunes L. Prevalence of physical activity in European adults - compliance with the World Health Organization’s physical activity guidelines. Prev Med. 2015;81:333–338. doi:10.1016/j.ypmed.2015.09.018
5. CDC. Physical activity and health: a report of the surgeon general. CDC; 2022. Available from: https://www.cdc.gov/nccdphp/sgr/adoles.htm.
6. Zhu Z, Tang Y, Zhuang J, et al. Physical activity, screen viewing time, and overweight/obesity among Chinese children and adolescents: an update from the 2017 physical activity and fitness in China-The youth study. BMC Public Health. 2019;19(1):197. doi:10.1186/s12889-019-6515-9
7. Garriguet D, Colley RC. A comparison of self-reported leisure-time physical activity and measured moderate-to-vigorous physical activity in adolescents and adults. Health Rep. 2014;25(7):3–11.
8. West AB, Bittel KM, Russell MA, Evans MB, Mama SK, Conroy DE. A systematic review of physical activity, sedentary behavior, and substance use in adolescents and emerging adults. Transl Behav Med. 2020;10(5):1155–1167. doi:10.1093/tbm/ibaa008
9. Carballo-Fazanes A, Rico-Díaz J, Barcala-Furelos R, et al. Physical activity habits and determinants, sedentary behaviour and lifestyle in university students. Int J Environ Res Public Health. 2020;17(9):3272. doi:10.3390/ijerph17093272
10. Lun KW, Chan CK, Ip PK, et al. Depression and anxiety among university students in Hong Kong. Hong Kong Med J. 2018;24(5):466–472. doi:10.12809/hkmj176915
11. Huang PC, Lee CH, Griffiths MD, et al. Sequentially mediated effects of weight-related self-stigma and psychological distress in the association between perceived weight stigma and food addiction among Taiwanese university students: a cross-sectional study. J Eat Disord. 2022;10(1):177. doi:10.1186/s40337-022-00701-y
12. Ferreira Silva RM, Mendonca CR, Azevedo VD, Raoof Memon A, Noll P, Noll M. Barriers to high school and university students’ physical activity: a systematic review. PLoS One. 2022;17(4):e0265913. doi:10.1371/journal.pone.0265913
13. Sevil J, Práxedes A, Abarca-Sos A, Del Villar F, García-González L. Levels of physical activity, motivation and barriers to participation in university students. J Sports Med Phys Fitness. 2016;56(10):1239–1248.
14. de Oliveira FCL, Roy JS, Pappas E. ACL injury, physical activity, and overweight/obesity: a vicious cycle? Knee Surg Sports Traumatol Arthrosc. 2020;28(3):667–669. doi:10.1007/s00167-019-05807-6
15. Duarte-Clíments G, Sánchez-Gómez MB, Palenzuela-Luis N, et al. Relationship between the self-concept and physical activity towards the prevention of chronic illnesses. Medicine. 2020;99(28):e20884. doi:10.1097/MD.0000000000020884
16. Irwin JD. Prevalence of university students’ sufficient physical activity: a systematic review. Percept Mot Skills. 2004;98(3 Pt 1):927–943. doi:10.2466/pms.98.3.927-943
17. Rivera PA, Nys BL, Fiestas F. Impact of COVID-19 induced lockdown on physical activity and sedentary behavior among university students: a systematic review. Medwave. 2021;21(8):e8456. doi:10.5867/medwave.2021.08.8456
18. Babic MJ, Morgan PJ, Plotnikoff RC, Lonsdale C, White RL, Lubans DR. Physical activity and physical self-concept in youth: systematic review and meta-analysis. Sports Med. 2014;44(11):1589–1601. doi:10.1007/s40279-014-0229-z
19. Haidar SA, de Vries NK, Karavetian M, El-Rassi R. Stress, anxiety, and weight gain among university and college students: a systematic review. J Acad Nutr Diet. 2018;118(2):261–274. doi:10.1016/j.jand.2017.10.015
20. Finlayson G, Cecil J, Higgs S, Hill A, Hetherington M. Susceptibility to weight gain. Eating behaviour traits and physical activity as predictors of weight gain during the first year of university. Appetite. 2012;58(3):1091–1098. doi:10.1016/j.appet.2012.03.003
21. León E, Tabares M, Baile JI, Salazar JG, Zepeda AP. Eating behaviors associated with weight gain among university students worldwide and treatment interventions: a systematic review. J Am Coll Health. 2022;1–8. doi:10.1080/07448481.2022.2089841
22. Navarro-Cruz AR, Kammar-García A, Mancilla-Galindo J, et al. Association of differences in dietary behaviours and lifestyle with self-reported weight gain during the COVID-19 lockdown in a university community from Chile: a cross-sectional study. Nutrients. 2021;13(9):3213. doi:10.3390/nu13093213
23. Taylor VH, Forhan M, Vigod SN, McIntyre RS, Morrison KM. The impact of obesity on quality of life. Best Pract Res Clin Endocrinol Metab. 2013;27(2):139–146. doi:10.1016/j.beem.2013.04.004
24. Van Gaal LF, Mertens IL, De Block CE. Mechanisms linking obesity with cardiovascular disease. Nature. 2006;444(7121):875–880. doi:10.1038/nature05487
25. Barcones-Molero MF, Sánchez-Villegas A, Martínez-González MA, et al. The influence of obesity and weight gain on quality of life according to the SF-36 for individuals of the dynamic follow-up cohort of the University of Navarra. Rev Clin Esp. 2018;218(8):408–416. doi:10.1016/j.rce.2018.05.005
26. Gualdi-Russo E, Rinaldo N, Zaccagni L. Physical activity and body image perception in adolescents: a systematic review. Int J Environ Res Public Health. 2022;19(20):13190. doi:10.3390/ijerph192013190
27. Foley Davelaar CM. Body image and its role in physical activity: a systematic review. Cureus. 2021;13(2):e13379. doi:10.7759/cureus.13379
28. Miranda VPN, Morais NS, Faria ER, et al. Body dissatisfaction, physical activity, and sedentary behavior in female adolescents. Rev Paul Pediatr. 2018;36(4):482–490. doi:10.1590/1984-0462/;2018;36;4;00005
29. Meadows A, Higgs S. The multifaceted nature of weight-related self-stigma: validation of the Two-Factor Weight Bias Internalization Scale (WBIS-2F). Front Psychol. 2019;10:808. doi:10.3389/fpsyg.2019.00808
30. Chan KL, Lee CSC, Cheng CM, et al. Investigating the relationship between weight-related self-stigma and mental health for overweight/obese children in Hong Kong. J Nerv Ment Dis. 2019;207(8):637–641. doi:10.1097/NMD.0000000000001021
31. Khodari BH, Shami MO, Shajry RM, et al. The relationship between weight self-stigma and quality of life among youth in the Jazan region, Saudi Arabia. Cureus. 2021;13(9):e18158. doi:10.7759/cureus.18158
32. Saffari M, Chen JS, Wu HC, et al. Effects of weight-related self-stigma and smartphone addiction on female university students’ physical activity levels. Int J Environ Res Public Health. 2022;19(5):2631. doi:10.3390/ijerph19052631
33. Zhang BG, Qian XF. Weight self-stigma and engagement among obese students in a physical education class. Front Psychol. 2022;13:1035827. doi:10.3389/fpsyg.2022.1035827
34. Delgado-Floody P, Guzmán-Guzmán IP, Caamaño-Navarrete F, Jerez-Mayorga D, Zulic-Agramunt C, Cofré-Lizama A. Depression is associated with lower levels of physical activity, body image dissatisfaction, and obesity in Chilean preadolescents. Psychol Health Med. 2021;26(4):518–531. doi:10.1080/13548506.2020.1817958
35. Vancini RL, de Lira CA, Anceschi SA, et al. Anxiety, depression symptoms, and physical activity levels of eutrophic and excess-weight Brazilian elite police officers: a preliminary study. Psychol Res Behav Manag. 2018;11:589–595. doi:10.2147/PRBM.S186128
36. Ajibewa TA, Sonneville KR, Miller AL, Toledo-Corral CM, Robinson LE, Hasson RE. Weight stigma and physical activity avoidance among college-aged students. J Am Coll Health. 2022;1–5. doi:10.1080/07448481.2022.2123708
37. Thiel A, John JM, Carl J, Thedinga HK. Weight stigma experiences and physical (In)activity: a biographical analysis. Obes Facts. 2020;13(3):386–402. doi:10.1159/000507936
38. More KR, Phillips LA, Eisenberg Colman MH. Evaluating the potential roles of body dissatisfaction in exercise avoidance. Body Image. 2019;28:110–114. doi:10.1016/j.bodyim.2019.01.003
39. Pearl RL, Wadden TA, Jakicic JM. Is weight stigma associated with physical activity? A systematic review. Obesity. 2021;29(12):1994–2012. doi:10.1002/oby.23274
40. Jáuregui-Lobera I, Iglesias Conde A, Sánchez Rodríguez J, et al. Self-perception of weight and physical fitness, body image perception, control weight behaviors and eating behaviors in adolescents. Nutr Hosp. 2018;35(5):1115–1123. doi:10.20960/nh.1726
41. Wilson RE, Latner JD, Hayashi K. More than just body weight: the role of body image in psychological and physical functioning. Body Image. 2013;10(4):644–647. doi:10.1016/j.bodyim.2013.04.007
42. Bevan N, O’Brien KS, Lin CY, et al. The relationship between weight stigma, physical appearance concerns, and enjoyment and tendency to avoid physical activity and sport. Int J Environ Res Public Health. 2021;18(19):9957. doi:10.3390/ijerph18199957
43. Mokkink LB, Terwee CB, Knol DL, et al. Protocol of the COSMIN study: cOnsensus-based Standards for the selection of health Measurement INstruments. BMC Med Res Methodol. 2006;6:2. doi:10.1186/1471-2288-6-2
44. Han K, Colarelli SM, Weed NC. Methodological and statistical advances in the consideration of cultural diversity in assessment: a critical review of group classification and measurement invariance testing. Psychol Assess. 2019;31(12):1481–1496. doi:10.1037/pas0000731
45. Wang T, Merkle EC, Zeileis A. Score-based tests of measurement invariance: use in practice. Front Psychol. 2014;5:438. doi:10.3389/fpsyg.2014.00438
46. Kandola A, Ashdown-Franks G, Hendrikse J, Sabiston CM, Stubbs B. Physical activity and depression: towards understanding the antidepressant mechanisms of physical activity. Neurosci Biobehav Rev. 2019;107:525–539. doi:10.1016/j.neubiorev.2019.09.040
47. Kandola A, Vancampfort D, Herring M, et al. Moving to beat anxiety: epidemiology and therapeutic issues with physical activity for anxiety. Curr Psychiatry Rep. 2018;20(8):63. doi:10.1007/s11920-018-0923-x
48. Vankim NA, Nelson TF. Vigorous physical activity, mental health, perceived stress, and socializing among college students. Am J Health Promot. 2013;28(1):7–15. doi:10.4278/ajhp.111101-QUAN-395
49. Bevan N, O’Brien KS, Latner JD, et al. Weight stigma and avoidance of physical activity and sport: development of a scale and establishment of correlates. Int J Environ Res Public Health. 2022;19(23):16370. doi:10.3390/ijerph192316370
50. Maneesriwongul W, Dixon JK. Instrument translation process: a methods review. J Adv Nurs. 2004;48(2):175–186. doi:10.1111/j.1365-2648.2004.03185.x
51. Durso LE, Latner JD. Understanding self-directed stigma: development of the weight bias internalization scale. Obesity. 2008;16:S80–86. doi:10.1038/oby.2008.448
52. Chen H, Ye YD. Validation of the weight bias internalization scale for Mainland Chinese children and adolescents. Front Psychol. 2020;11:594949. doi:10.3389/fpsyg.2020.594949
53. Pakpour AH, Tsai MC, Lin YC, et al. Psychometric properties and measurement invariance of the weight self-stigma questionnaire and weight bias internalization scale in children and adolescents. Int J Clin Health Psychol. 2019;19(2):150–159. doi:10.1016/j.ijchp.2019.03.001
54. Wang K, Shi HS, Geng FL, et al. Cross-cultural validation of the depression anxiety stress scale-21 in China. Psychol Assess. 2016;28(5):e88–e100. doi:10.1037/pas0000207
55. Huang PC, Chen JS, Potenza MN, et al. Temporal associations between physical activity and three types of problematic use of the internet: a six-month longitudinal study. J Behav Addict. 2022;11(5):1055–1067. doi:10.1556/2006.2022.00084
56. Cheng H. A simple, easy-to-use spreadsheet for automatic scoring of the International Physical Activity Questionnaire (IPAQ) short form. ResearchGate. 2016. doi:10.13140/RG.2.2.21067.80165
57. Cheng OY, Yam CLY, Cheung NS, Lee PLP, Ngai MC, Lin CY. Extended theory of planned behavior on eating and physical activity. Am J Health Behav. 2019;43(3):569–581. doi:10.5993/AJHB.43.3.11
58. Fung XCC, Pakpour AH, Wu YK, Fan CW, Lin CY, Tsang HWH. Psychosocial variables related to weight-related self-stigma in physical activity among young adults across weight status. Int J Environ Res Public Health. 2019;17(1):64. doi:10.3390/ijerph17010064
59. Liou YM, Jwo CJ, Yao KG, Chiang LC, Huang LH. Selection of appropriate Chinese terms to represent intensity and types of physical activity terms for use in the Taiwan version of IPAQ. J Nurs Res. 2008;16(4):252–263. doi:10.1097/01.JNR.0000387313.20386.0a
60. Macfarlane DJ, Lee CC, Ho EY, Chan KL, Chan DT. Reliability and validity of the Chinese version of IPAQ (short, last 7 days). J Sci Med Sport. 2007;10(1):45–51. doi:10.1016/j.jsams.2006.05.003
61. Xu P, Chen JS, Chang YL, et al. Gender differences in the associations between physical activity, smartphone use, and weight stigma. Front Public Health. 2022;10:862829. doi:10.3389/fpubh.2022.862829
62. World Health Organization. Appropriate body-mass index for Asian populations and its implications for policy and intervention strategies. Lancet. 2004;363(9403):157–163. doi:10.1016/S0140-6736(03)15268-3
63. Nunnally JC. Psychometric Theory.
64. Lin CY, Broström A, Griffiths MD, Pakpour AH. Psychometric evaluation of the Persian eHealth Literacy Scale (eHEALS) among elder Iranians with heart failure. Eval Health Prof. 2020;43(4):222–229. doi:10.1177/0163278719827997
65. Nadhiroh S, Nurmala I, Pramukti I, et al. Weight stigma in Indonesian young adults: validating the Indonesian versions of the weight self-stigma questionnaire and perceived weight stigma scale. Asian J Soc Health Behav. 2022;5(4):169–179. doi:10.4103/shb.shb_189_22
66. Nejati B, Fan CW, Boone WJ, Griffiths MD, Lin CY, Pakpour AH. Validating the Persian intuitive eating scale-2 among breast cancer survivors who are overweight/obese. Eval Health Prof. 2021;44(4):385–394. doi:10.1177/0163278720965688
67. Cheung GW, Rensvold RB. Evaluating goodness-of-fit Indexes for testing measurement invariance. Struct Equ Modeling. 2002;9(2):233–255. doi:10.1207/S15328007SEM0902_5
68. Chen IH, Huang PC, Lin YC, et al. The Yale food addiction scale 2.0 and the modified Yale food addiction scale 2.0 in Taiwan: factor structure and concurrent validity. Front Psychiatry. 2022;13:1014447. doi:10.3389/fpsyt.2022.1014447
69. Chirawat P, Kamolthip R, Rattaprach R, et al. Weight stigma among young adults in Thailand: reliability, validation, and measurement invariance of the Thai-translated weight self-stigma questionnaire and perceived weight stigma scale. Int J Environ Res Public Health. 2022;19(23):15868. doi:10.3390/ijerph192315868
70. Rutkowski L, Svetina D. Assessing the hypothesis of measurement invariance in the context of large-scale international surveys. Educ Psychol Meas. 2013;74(1):31–57. doi:10.1177/0013164413498257
71. Lee IA, Preacher KJ. Calculation for the test of the difference between two dependent correlations with one variable in common; 2013.
72. Steiger JH. Tests for comparing elements of a correlation matrix. Psychol Bull. 1980;87:245–251. doi:10.1037/0033-2909.87.2.245
73. Cohen J. Statistical Power Analysis for the Behavioral Sciences.
74. Habib MA, Dey M, Chowdhury AI, Rahman T, Kundu RK. Current knowledge, attitude, and practice (KAP) towards physical activity (PA) and its impact on obesity management in Bangladesh: a cross-sectional study. Health Sci Rep. 2022;5(6):e960. doi:10.1002/hsr2.960
75. Sone T, Kawachi Y, Abe C, Otomo Y, Sung YW, Ogawa S. Attitude and practice of physical activity and social problem-solving ability among university students. Environ Health Prev Med. 2017;22(1):18. doi:10.1186/s12199-017-0625-8
76. Nogueira JA, Macedo da Costa TH. Gender differences in physical activity, sedentary behavior, and their relation to body composition in active Brazilian adolescents. J Phys Act Health. 2009;6(1):93–98. doi:10.1123/jpah.6.1.93
77. Andrade C. The limitations of online surveys. Indian J Psychol Med. 2020;42(6):575–576. doi:10.1177/0253717620957496
 © 2023 The Author(s). This work is published and licensed by Dove Medical Press Limited. The full terms of this license are available at https://www.dovepress.com/terms.php and incorporate the Creative Commons Attribution - Non Commercial (unported, v3.0) License.
By accessing the work you hereby accept the Terms. Non-commercial uses of the work are permitted without any further permission from Dove Medical Press Limited, provided the work is properly attributed. For permission for commercial use of this work, please see paragraphs 4.2 and 5 of our Terms.
© 2023 The Author(s). This work is published and licensed by Dove Medical Press Limited. The full terms of this license are available at https://www.dovepress.com/terms.php and incorporate the Creative Commons Attribution - Non Commercial (unported, v3.0) License.
By accessing the work you hereby accept the Terms. Non-commercial uses of the work are permitted without any further permission from Dove Medical Press Limited, provided the work is properly attributed. For permission for commercial use of this work, please see paragraphs 4.2 and 5 of our Terms.