Back to Journals » Cancer Management and Research » Volume 13
MDCT-Based Radiomics Features for the Differentiation of Serous Borderline Ovarian Tumors and Serous Malignant Ovarian Tumors
Authors Yu X, Wang L, Yu H, Zou Y, Wang C, Jiao J, Hong H ![]() , Zhang S
, Zhang S ![]()
Received 27 September 2020
Accepted for publication 16 December 2020
Published 12 January 2021 Volume 2021:13 Pages 329—336
DOI https://doi.org/10.2147/CMAR.S284220
Checked for plagiarism Yes
Review by Single anonymous peer review
Peer reviewer comments 2
Editor who approved publication: Dr Antonella D'Anneo
Xin-ping Yu,1 Lei Wang,1 Hai-yang Yu,2 Yu-wei Zou,3 Chang Wang,1 Jin-wen Jiao,1 Hao Hong,4 Shuai Zhang2
1Department of Gynecology, The Affiliated Hospital of Qingdao University, Qingdao, Shandong Province, People’s Republic of China; 2Department of Radiology, The Affiliated Hospital of Qingdao University, Qingdao, Shandong Province, People’s Republic of China; 3Department of Pathology, The Affiliated Hospital of Qingdao University, Qingdao, Shandong Province, People’s Republic of China; 4Department of Biotechnology, Beijing Institute of Radiation Medicine, Beijing, People’s Republic of China
Correspondence: Shuai Zhang
Department of Radiology, The Affiliated Hospital of Qingdao University, NO. 1677 Wutaishan Road, Huangdao District, Shandong Province 266000, People’s Republic of China
Tel +86 18661804638
Email [email protected]
Objective: To investigate whether multidetector computed tomography (MDCT)-based radiomics features can discriminate between serous borderline ovarian tumors (SBOTs) and serous malignant ovarian tumors (SMOTs).
Patients and Methods: Eighty patients with SBOTs and 102 patients with SMOTs, confirmed by pathology (training set: n = 127; validation set: n = 55) from December 2017 to June 2020, were enrolled in this study. The interclass correlation coefficient (ICC) and least absolute shrinkage and selection operator (LASSO) regression were applied to select radiomics parameters derived from MDCT images on the arterial phase (AP), venous phase (VP), and equilibrium phase (EP). Receiver operating characteristic (ROC) analysis of each selected parameter was carried out. Heat maps were created to illustrate the distribution of the radiomics parameters. Three models incorporating selected radiomics parameters generated by support vector machine (SVM) classifiers in each phase were analyzed by ROC and compared using the DeLong test.
Results: The most predictive features selected by ICC and LASSO regression between SBOTs and SMOTs included 9 radiomics parameters on AP, VP, and EP each. Three models on AP, VP, and EP incorporating the selected features generated by SVM classifiers produced AUCs of 0.80 (accuracy, 0.75; sensitivity, 0.74; specificity, 0.75), 0.86 (accuracy, 0.78; sensitivity, 0.80; specificity, 0.75), and 0.73 (accuracy, 0.69; sensitivity, 0.71; specificity, 0.67), respectively. There were no significant differences in the AUCs among the three models (AP vs. VP, P = 0.199; AP vs. EP, P = 0.260; VP vs. EP, P = 0.793).
Conclusion: MDCT-based radiomics features could be used as biomarkers for the differentiation of SBOTs and SMOTs.
Keywords: ovarian tumors, multidetector computed tomography; MDCT, radiomics
Introduction
Epithelial ovarian tumors account for approximately 60% of all ovarian tumors. According to their histological characteristics and clinical manifestations, they can be divided into benign, borderline, and malignant.1 Compared with malignant ovarian tumors, borderline ovarian tumors usually appear at a younger age, and the prognosis is much better than that of malignant ovarian tumors.1–3 Evaluation of malignancy can aid in clinical management decisions.
Many medical imaging methods, such as ultrasound, multidetector computed tomography (MDCT), and magnetic resonance imaging (MRI), can provide important information for the assessment, diagnosis, staging, and follow-up of ovarian tumors.4 Imaging is one of the most important steps in predicting the prognosis of patients and in distinguishing malignant tumors from borderline lesions so that the most appropriate treatment plan can be implemented. MDCT, the recommended imaging modality for staging ovarian cancer, and MRI, which is excellent for tissue differentiation, are the most used methods in clinical work.4,5
Previous studies have shown that MDCT and MRI features can differentiate borderline ovarian tumors from malignant tumors, according to analyses of the location, shape, size, internal structure, and signal intensity of ovarian tumors.6–8 Denewar et al reported that the minimum apparent diffusion coefficient value of whole lesions and the maximum diameter of solid components in MRI were useful for differentiating borderline ovarian tumors from malignant epithelial ovarian tumors.9 By analyzing MDCT features, Stephanie Nougaret et al reported that the solid components are smaller, and the septations are thinner in serous borderline tumors than in serous malignant tumors.10 However, there are many similarities and overlaps between ovarian borderline tumors and malignant tumors. Hence, it is difficult to distinguish between the two types of tumors by MDCT or MRI.
Radiomics provides important information for understanding the tumor phenotype and tumor microenvironment by high-throughput mining and the quantification of routine radiologic images.11 Quantitative parameters retrieved from MDCT and MRI images have improved the accuracy of diagnosis and prognosis in a variety of tumors, including kidney,12 liver,13 and lung cancers.14 However, to our knowledge, no study has evaluated MDCT-based radiomics features for their ability to differentiate ovarian borderline tumors and malignant tumors. Since epithelial ovarian tumors are of different subtypes, different subtypes have different imaging manifestations, and serous epithelial ovarian tumors are the most common. This study aimed to investigate whether MDCT-based radiomics features can discriminate serous borderline ovarian tumors (SBOTs) and serous malignant ovarian tumors (SMOTs) by establishing an MDCT radiomics model to plan preoperative treatment and predict prognosis of the patients.
Patients and Methods
Patients
Our study was conducted in strict compliance with the Declaration of Helsinki and was approved by the Ethics Committee of the Affiliated Hospital of Qingdao University. Informed consent was waived for this study due to its retrospective design, and all data were kept confidential. By searching our institution’s database, 206 patients with SBOT and 323 patients with SMOT were initially enrolled from December 2017 to June 2020. The inclusion criteria were as follows: 1) SBOTs and SMOTs were diagnosed by postoperative pathology; 2) SBOTs and SMOTs were in an early stage (I and II) according to the guideline of the International Federation of Gynecology and Obstetrics (FIGO); and 3) the images were of sufficient quality for radiomics analysis. The exclusion criteria included: 1) SBOTs and SMOTs which were in a late stage (III and IV) according to the FIGO guideline; and 2) patients who received any treatment before CT examination or were on treatment at the time of CT examination were also excluded to eliminate the effect of treatment on imaging features. Finally, 80 SBOT patients (54 stage I and 26 stage II) and 102 SMOTs (63 stage I and 39 stage II) were enrolled in this study.
MDCT Imaging Protocol
Contrast-enhanced pelvic CT scans were performed using 5 different CT scanners: Aquilion ONE (Canon Medical Systems) in 42 patients, Discovery CT750 HD (GE medical systems) in 31 patients, Optima CT670 (GE medical systems) in 36 patients, iCT 256 (PHILIPS) in 34 patients, and SOMATOM Definition Flash (SIEMENS) in 39 patients. In 3-phase contrast-enhanced examinations, the contrast agent was injected though antecubital vein at the rate of 2.0–3.0 mL/s (85–100 mL bolus of iohexol, 300 mg iodine/mL). Similar protocols were used as follows: 120 kV; 100–300 mA; rotation time of 0.42–0.6 s; pitch of 0.599–0.984; thickness of 1–1.2 mm. The arterial phase (AP) was performed at a delay time of 13–17 s after abdominal aorta attenuation reached 100 Hounsfield units using the tracking technique. The venous phase (VP) and equilibrium phase (EP) were performed 30 s and 210 s after the AP, respectively.
MDCT Radiomics Analysis
The workflow of the radiomics analysis was as follows: tumor segmentation, feature extraction, feature selection, model construction, and evaluation (Figure 1). In this study, the open-source 3D-slicer software (www.slicer.org) was used to extract radiomics features. The editor tools in the 3D-slicer were used to manually segment the tumors in MDCT images. The regions of interest (ROIs) were drawn manually on AP, VP, and EP, covering the whole tumor by two radiologists in abdominal diagnosis with 8 and 9 years of experience who were blinded to the pathology results. When patients had bilateral ovarian tumors, the larger one was analyzed. The lesion with the larger maximum diameter on the axial image was defined as the larger lesion. Then, a 3D model of the tumor was built using the model generation module of the 3D slicer. After tumor segmentation and 3D model generation, 1,167 radiomics features were extracted by the “radiomics” package in the software. Radiomics parameters were selected using 3D-slicer software, including seven categories: 14 shape features, 216 first-order features, 289 gray-level cooccurrence matrix features, 192 gray-level run-length matrix features, 192 gray-level size zone matrix features, 60 neighboring gray tone difference matrix features, and 204 gray-level dependence matrix features. Detailed information can be found in previous studies.15
 |
Figure 1 Workflow of radiomics analysis. Abbreviations: ICC, intraclass correlation coefficient; LASSO, least absolute shrinkage, and selection operator; ROC, receiver operating characteristic. |
Statistical Analysis
The age and maximum diameter of the tumor on the axial images of SBOTs and SMOTs were compared using a two independent samples t-test. All extracted radiomics features from MDCT images on AP, VP, and EP were converted into normalized values. Interclass correlation coefficient (ICC) and least absolute shrinkage and selection operator (LASSO) regression were used to select radiomics parameters in all patients. The selected parameters and their regression coefficients were recorded. Receiver operating characteristic (ROC) curves and the area under the ROC curves (AUCs) were calculated for the selected radiomics parameter. Heat maps were generated to depict the distribution of the selected radiomics parameters of the three phases. According to the date of MDCT imaging, the cohort was divided into a training set (n = 127) and validation set (n = 55). Then selected radiomics parameters were used to train the support vector machine (SVM) classifier in the training set on AP, VP, and EP, respectively. Lastly, the predictive performance was assessed in the validation set using the same thresholds determined in the training set, and ROC curves and AUCs of the validation set were computed. The AUCs of AP, VP, and EP between SBOTs and SMOTs were compared using the DeLong test. Statistical analysis was performed using SPSS 23.0 (Chicago, IL, USA). The LASSO regression and SVM classifier were performed using the scikit-learn package of Python (https://www.python.org). P < 0.05 was considered statistically significant.
Results
Clinical Characteristics
A total of 182 patients were included in this study, of which 80 (43.96%) were SBOTs, and 102 (56.04%) were SMOTs. The general characteristics of the training and validation sets are shown in Table 1. The mean ages between the SBOTs and SMOTs were significantly different in the training set (41.2 ± 11.2 years vs. 52.5 ± 9.0 years, P < 0.001) and validation set (40.2 ± 15.2 years vs. 54.5 ± 10.0 years, P < 0.001). However, there was no significant difference in the tumor maximum diameter of the SBOTs and SMOTs in the training and validation sets.
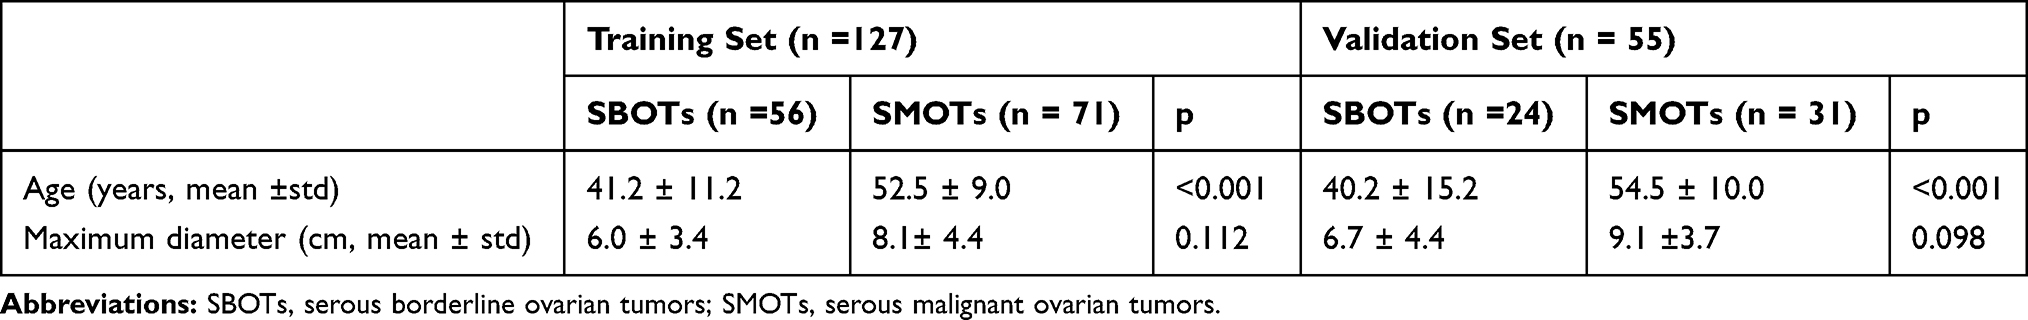 |
Table 1 The Patient Characteristics of SBOTs and SMOTs |
Selection of Radiomics Features
There were 7 categories and 1167 radiomics parameters in total for every ROI. Radiomic features with ICCs lower than 0.80 were excluded. There were 756, 812, and 786 radiomics features with good interreader agreement in the three phases, respectively, and the ICCs ranged from 0.802 to 0.904.
After the LASSO method, each phase selected 9 radiomics features with higher AUC values in Table 2. The ROC curves and AUC values are shown in Figure 2. The radiomics parameters with the top two AUC values were Run Length Non-Uniformity Normalized (RLNN) (AUC =0.72) and IMC2 (AUC = 0.74) in AP, RLNN (AUC = 0.71) and IMC2 (AUC = 0.69) in VP, and RLNN (AUC = 0.70), median (AUC = 0.69), and Gray Level Non-Uniformity Normalized (GLNN) (AUC = 0.69) in EP. The radiomics parameter distributions of AP, VP, and EP between SBOTs and SMOTs is demonstrated with heat maps in Figure 3.
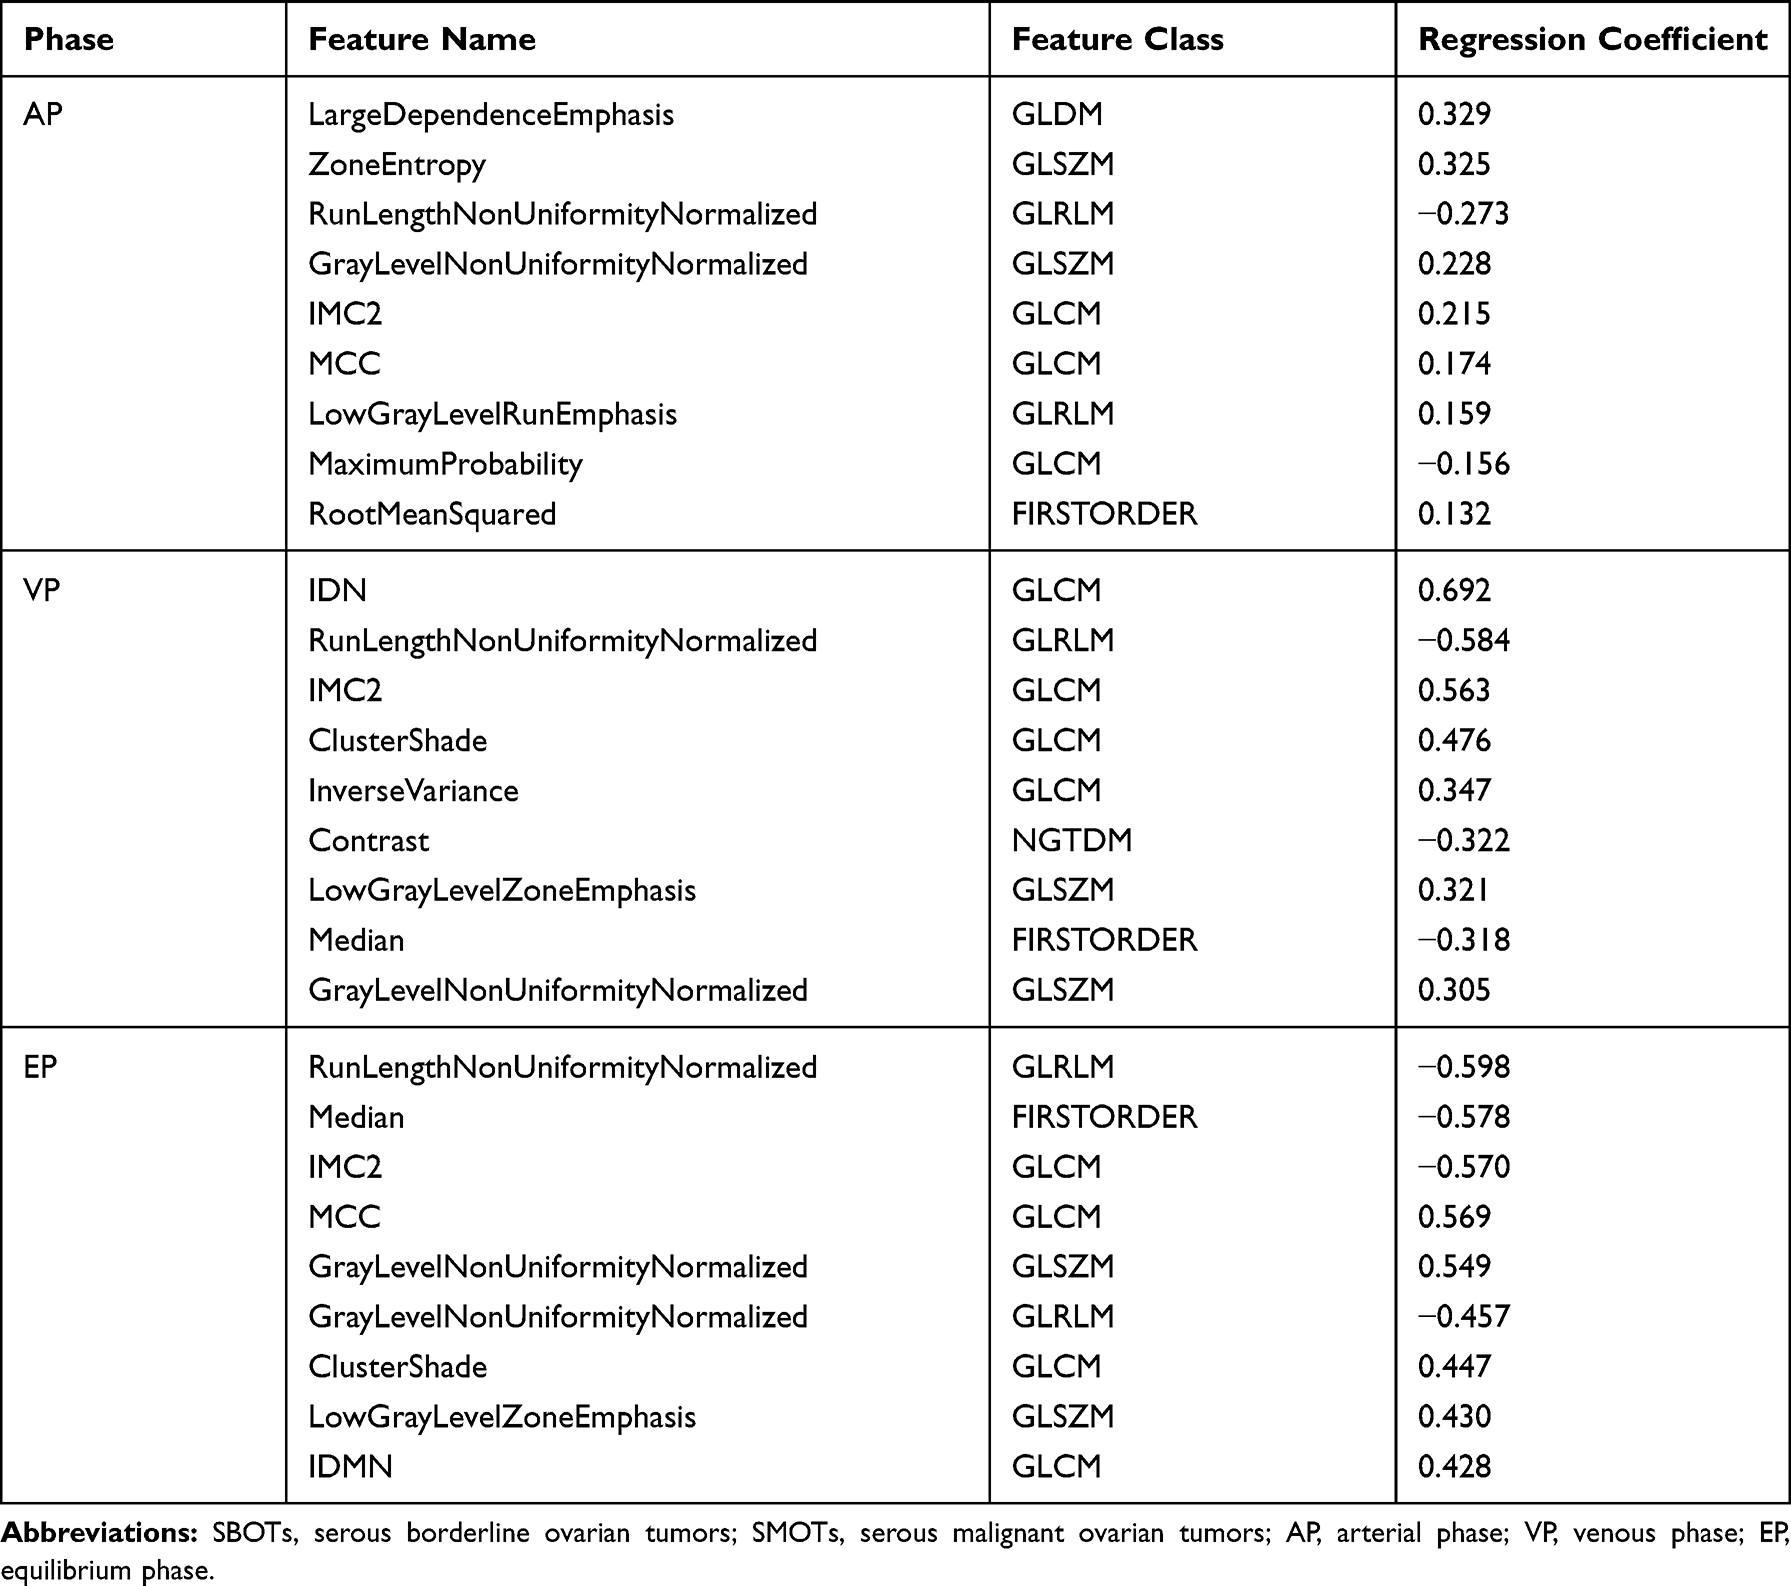 |
Table 2 The Most Predictive Features Between SBOTs and SMOTs Selected by LASSO Regression |
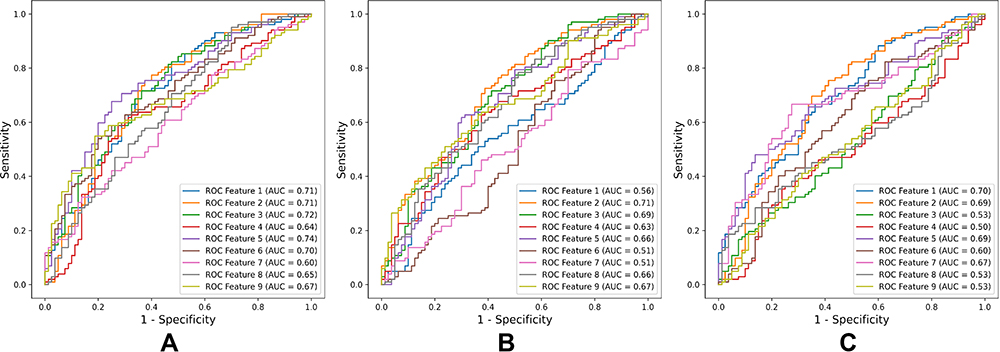 |
Figure 2 The ROC curves and AUC values of the most predictive features between SBOTs and SMOTs with LASSO regression in AP (A), VP (B), and EP (C). The numbers in each figure mean the radiomics parameters in.Table 2 Abbreviations: ROC, receiver operating characteristic; AUC, area under curve; SBOTs, serous borderline ovarian tumors; SMOTs, serous malignant ovarian tumors; LASSO, least absolute shrinkage, and selection operator; AP, arterial phase; VP, venous phase; EP, equilibrium phase. |
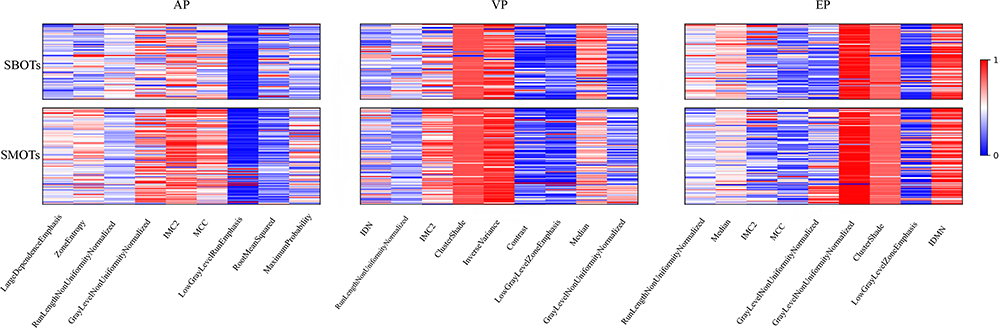 |
Figure 3 The heat maps of radiomics parameter distribution of the AP, VP and EP between SBOTs and SMOTs. Difference in colors means different value of radiomics parameter. Abbreviations: AP, arterial phase; VP, venous phase; EP, equilibrium phase; SBOTs, serous borderline ovarian tumors; SMOTs, serous malignant ovarian tumors. |
Predictive Performance of the SVM Classifier
The predictive performances of the AP, VP, and EP models in the validation set are shown in Table 3, which is based on the same thresholds of the SVM classifier in the training set. The AP, VP, and EP radiomics models showed AUCs of 0.8, 0.86, and 0.73, respectively. The VP model showed a good predictive performance with a relatively higher AUC, accuracy, and sensitivity. The ROC curves of the three models are shown in Figure 4. However, according to the DeLong test, there were no significant differences in ROCs among the AP, VP, and EP radiomics models (AP-VP, P = 0.199; AP-EP, P = 0.260; VP-EP, P = 0.793) (Table 4).
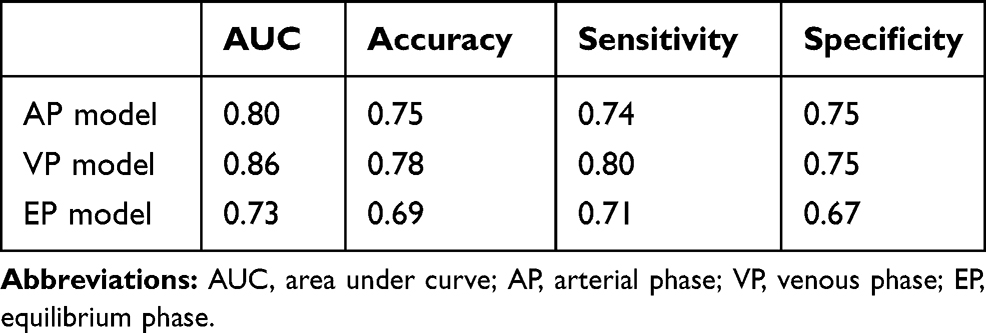 |
Table 3 The Predictive Performance of AP, VP, and EP Model |
 |
Table 4 The Results of Multiple Comparisons of the AUCs by the Delong Test |
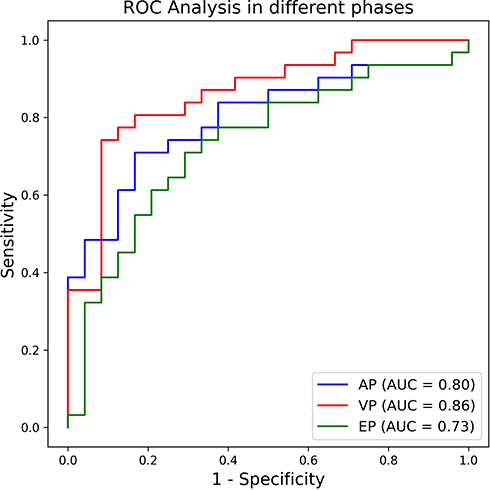 |
Figure 4 The ROC curves and AUC values of the AP, VP, and EP to differentiate SBOTs and SMOTs. Abbreviations: ROC, receiver operating characteristic; AUC, area under curve; AP, arterial phase; VP, venous phase; EP, equilibrium phase; SBOTs, serous borderline ovarian tumors; SMOTs, serous malignant ovarian tumors. |
Discussion
Previous studies have demonstrated that MDCT and MRI are useful diagnostic methods to discriminate ovarian borderline tumors and carcinomas with high sensitivity and specificity.7,16–18 Additionally, several risk prediction models have been proposed to distinguish benign, borderline, and malignant ovarian tumors.19,20 The MDCT diagnosis of ovarian malignant tumors is related to various findings, such as the presence of bilateral and cystic-solid masses, a large soft-tissue component with necrosis, a tumor with thick and irregular septa, and large papillary components.21 These results can be explained by underlying pathophysiological differences between borderline and malignant tumors. The data in MDCT images may still conceal many underlying, invisible, and histological differences, while visual assessment by humans could not allow for detecting subtle differences in radiomic information. Therefore, SBOTs and SMOTs may not be distinguishable from each other based on visual inspection of conventional medical images. Probably, the application of machine learning methods may further improve the diagnostic and predictive value of imaging. In this study, we used radiomics to extract data from MDCT images to detect differences between early stage SBOTs and SMOTs because early stage tumors grow locally and do not disseminate, as they can form a unified standard for tumor segmentation in 3D-slicer software.
Radiomics is a variety of mathematical methods to provide tumor heterogeneity data by extracting and analyzing the gray intensity and position of pixels in the image.22 Tumors are heterogeneous, with spatial variations in the number of tumor cells, angiogenesis, extracellular matrix, and necrotic areas. Studies have shown a significant correlation between radiomics features and underlying pathological changes.23–25 Imaging plays an important role in assessing the heterogeneity within a tumor in a noninvasive manner, as random sampling or biopsy does not represent the entire phenotype within the tumor. Epithelial ovarian tumors are heterogeneous neoplasms primarily subdivided into benign, borderline, and malignant types. Microscopically, the hallmark of SBOTs is the presence of epithelial hyperplasia forming stromal polyps, glands, and papillae with generally abundant eosinophilic cytoplasm and mild to moderate nuclear atypia. This type differs from serous carcinoma in that it lacks destructive stroma invasion. SMOTs vary from glandular to papillary to solid and often contain psammoma bodies. Tumor cells are generally of medium size, and the stroma may be scanty or desmoplastic.1,26 These microscopic differences are related to radiomics features, which means that imaging can reveal general pathological manifestations. Our results indicate that the radiomics features of SBOTs and SMOTs were different, and the radiomics parameters with the nine AUC values in each phase were selected for different SBOTs and SMOTs.
In our study, the radiomics features of RLNN, GLNN, and IMC2 showed higher predictive values for the differentiation of SBOTs and SMOTs because three of them were found in all phases. RLNN measures the similarity of run length in the whole image, and a smaller value indicates that the run length in the image is more homogeneous. GLNN measures the variability of gray intensity values in images, and smaller values indicate greater similarity in the intensity values. IMC2 quantifies the complexity of texture. In addition, the radiomics features of RLNN had a higher AUC in all three phases, and RLNN may be regarded the most meaningful feature for differentiating these two types of tumors. Our results show that radiomics can detect these microscopic differences in SBOTs and SMOTs, and a radiomics-based machine-learning classifier has achieved satisfactory results in distinguishing SBOTs and SMOTs. This information is important at the time of initial diagnosis and aids in clinical management decisions.
It has been reported that radiomics features are always affected by the acquisition parameters to different degrees.27 Although this study was a single-center retrospective study without other external data validation, the patients enrolled in our study were evaluated using five different CT scanners. Given that different CT scanners are used, our results indicate that radiomics may be widely performed in multiple centers. Although there was no significant difference in the AUC of the AP, VP, and EP radiomics models according to the Delong test, there was higher accuracy, sensitivity, and specificity in the VP model. Thus, the diagnostic performance of the VP model should be better than that of the other two models in comprehensive consideration.
This study has several limitations. First, our study was a single-center retrospective study. Second, we did not evaluate subjective findings and related laboratory examinations, which combined with the radiomics features model, may yield some exciting results. Third, since the boundary of the tumor is drawn manually, the interference of the volume effect cannot be avoided completely. With the rapid development of computer science, semiautomatic image recognition software will be developed in the future.
In summary, MDCT-based radiomics features could be used as biomarkers for the differentiation of SBOTs and SMOTs. The diagnostic performance of the VP model may be better than that of the AP and EP models in comprehensive consideration.
Disclosure
The authors report no conflicts of interest in this work.
References
1. Prat J. Pathology of borderline and invasive cancers. Best Pract Res Clin Obstet Gynaecol. 2017;41:15–30. doi:10.1016/j.bpobgyn.2016.08.007
2. Damak T, Ben Hassouna J, Chargui R, et al. Borderline tumors of the ovary. Tunis Med. 2014;92(6):411–416.
3. Lheureux S, Gourley C, Vergote I, et al. Epithelial ovarian cancer. Lancet. 2019;393(10177):1240–1253. doi:10.1016/S0140-6736(18)32552-2
4. Javadi S, Ganeshan DM, Qayyum A, et al. Ovarian cancer, the revised FIGO staging system, and the role of imaging. Am J Roentgenol. 2016;206(6):1351–1360. doi:10.2214/AJR.15.15199
5. Forstner R. Radiological staging of ovarian cancer: imaging findings and contribution of CT and MRI. Eur Radiol. 2007;17(12):3223–3235. doi:10.1007/s00330-007-0736-5
6. Zhao SH, Qiang JW, Zhang GF, et al. Diffusion-weighted MR imaging for differentiating borderline from malignant epithelial tumours of the ovary: pathological correlation. Eur Radiol. 2014;24(9):2292–2299. doi:10.1007/s00330-014-3236-4
7. Yu X, Liu Y, Jiao J, et al. Evaluation of ovarian tumors with multidetector computed tomography and tumor markers: differentiation of Stage I serous borderline tumors and Stage I serous malignant tumors presenting as solid-cystic mass. Med Sci Monit. 2020;26. doi:10.12659/MSM.924497
8. Grabowska-Derlatka L, Derlatka P, Palczewski P, et al. Differentiation of ovarian cancers from borderline ovarian tumors on the basis of evaluation of tumor vascularity in multi–row detector computed tomography—comparison with histopathology. Int J Gynecol Cancer. 2013;23(9):1597–1602. doi:10.1097/IGC.0b013e3182a80a41
9. Denewar FA, Takeuchi M, Urano M, et al. Multiparametric MRI for differentiation of borderline ovarian tumors from stage I malignant epithelial ovarian tumors using multivariate logistic regression analysis. Eur J Radiol. 2017;91:116–123. doi:10.1016/j.ejrad.2017.04.001
10. Nougaret S, Lakhman Y, Molinari N, et al. CT features of ovarian tumors: defining key differences between serous borderline tumors and low-grade serous carcinomas. Am J Roentgenol. 2018;210(4):918–926. doi:10.2214/AJR.17.18254
11. Lambin P, Leijenaar RTH, Deist TM, et al. Radiomics: the bridge between medical imaging and personalized medicine. Nat Rev Clin Oncol. 2017;14(12):749–762. doi:10.1038/nrclinonc.2017.141
12. He X, Zhang H, Zhang T, et al. Predictive models composed by radiomic features extracted from multi-detector computed tomography images for predicting low- and high- grade clear cell renal cell carcinoma: A STARD-compliant article. Medicine. 2019;98(2):e13957. doi:10.1097/MD.0000000000013957
13. Peng J, Zhang J, Zhang Q, et al. A radiomics nomogram for preoperative prediction of microvascular invasion risk in hepatitis B virus-related hepatocellular carcinoma. Diagn Interv Radiol. 2018:121–127. doi:10.5152/dir.2018.17467
14. Huang Y, Liu Z, He L, et al. Radiomics signature: a potential biomarker for the prediction of disease-free survival in early-Stage (I or II) non-small cell lung cancer. Radiology. 2016;281(3):947–957. doi:10.1148/radiol.2016152234
15. van Griethuysen JJM, Fedorov A, Parmar C, et al. Computational radiomics system to decode the radiographic phenotype. Cancer Res. 2017;77(21):e104–e107. doi:10.1158/0008-5472.CAN-17-0339
16. Park SY, Oh YT, Jung DC. Differentiation between borderline and benign ovarian tumors: combined analysis of MRI with tumor markers for large cystic masses (≥5 cm). Acta Radiol. 2015;57(5):633–639. doi:10.1177/0284185115597266
17. Thomassin-Naggara I, Daraï E, Cuenod CA, et al. Dynamic contrast-enhanced magnetic resonance imaging: A useful tool for characterizing ovarian epithelial tumors. J Magn Reson Imaging. 2008;28(1):111–120. doi:10.1002/jmri.21377
18. Li YA, Qiang JW, Ma FH, et al. MRI features and score for differentiating borderline from malignant epithelial ovarian tumors. Eur J Radiol. 2018;98:136–142. doi:10.1016/j.ejrad.2017.11.014
19. Thomassin-Naggara I, Aubert E, Rockall A, et al. Adnexal masses: development and preliminary validation of an MR imaging scoring system. Radiology. 2013;267(2):432–443. doi:10.1148/radiol.13121161
20. Van Calster B, Van Hoorde K, Valentin L, et al. Evaluating the risk of ovarian cancer before surgery using the ADNEX model to differentiate between benign, borderline, early and advanced stage invasive, and secondary metastatic tumours: prospective multicentre diagnostic study. BMJ. 2014;349:g5920. doi:10.1136/bmj.g5920
21. Tsili AC, Argyropoulou MI. Adnexal incidentalomas on multidetector CT: how to manage and characterise. J Obstet Gynaecol. 2019:1–8.
22. Nougaret S, Tardieu M, Vargas HA, et al. Ovarian cancer: an update on imaging in the era of radiomics. Diagn Interv Imaging. 2019;100(10):647–655. doi:10.1016/j.diii.2018.11.007
23. Horvat N, Bates DDB, Petkovska I. Novel imaging techniques of rectal cancer: what do radiomics and radiogenomics have to offer? A literature review. Abdom Radiol. 2019;44(11):3764–3774. doi:10.1007/s00261-019-02042-y
24. Davnall F, Yip CS, Ljungqvist G, et al. Assessment of tumor heterogeneity: an emerging imaging tool for clinical practice? Insights Imaging. 2012;3(6):573–589. doi:10.1007/s13244-012-0196-6
25. Bektas CT, Kocak B, Yardimci AH, et al. Clear cell renal cell carcinoma: machine learning-based quantitative computed tomography texture analysis for prediction of fuhrman nuclear grade. Eur Radiol. 2019;29(3):1153–1163. doi:10.1007/s00330-018-5698-2
26. Kurman RJ, Carcangiu ML, Herrington CS, Young RH, eds. WHO Classification of Tumours of Female Reproductive Organs.
27. Berenguer R, Pastor-Juan MDR, Canales-Vázquez J, et al. Radiomics of CT features may be nonreproducible and redundant: influence of CT acquisition parameters. Radiology. 2018;288(2):407–415. doi:10.1148/radiol.2018172361
 © 2021 The Author(s). This work is published and licensed by Dove Medical Press Limited. The
full terms of this license are available at https://www.dovepress.com/terms
and incorporate the Creative Commons Attribution
- Non Commercial (unported, 3.0) License.
By accessing the work you hereby accept the Terms. Non-commercial uses of the work are permitted
without any further permission from Dove Medical Press Limited, provided the work is properly
attributed. For permission for commercial use of this work, please see paragraphs 4.2 and 5 of our Terms.
© 2021 The Author(s). This work is published and licensed by Dove Medical Press Limited. The
full terms of this license are available at https://www.dovepress.com/terms
and incorporate the Creative Commons Attribution
- Non Commercial (unported, 3.0) License.
By accessing the work you hereby accept the Terms. Non-commercial uses of the work are permitted
without any further permission from Dove Medical Press Limited, provided the work is properly
attributed. For permission for commercial use of this work, please see paragraphs 4.2 and 5 of our Terms.