Back to Journals » Clinical Ophthalmology » Volume 20
Mapping Multiscale Brain Changes in Primary Angle-Closure Glaucoma Using Regional Radiomics Similarity Networks
Authors Hu D, Hu RY, Zhang YY, Cheng YY, Yu FL, Huang X
Received 26 March 2026
Accepted for publication 21 May 2026
Published 3 July 2026 Volume 2026:20 527088
DOI https://doi.org/10.2147/OPTH.S527088
Checked for plagiarism Yes
Review by Single anonymous peer review
Peer reviewer comments 3
Editor who approved publication: Dr Sotiria Palioura
Die Hu1-5,*, Rui-Yang Hu5,*, Yan-Yan Zhang6,*, Yu-Yue Cheng1-5, Fang-Liang Yu1-5, Xin Huang1-5
The Affiliated Eye Hospital, Jiangxi Medical College, Nanchang University, Nanchang, Jiangxi, People’s Republic of China; 2Jiangxi Province Key Laboratory of Ophthalmology and Vision Sciences, Nanchang, Jiangxi, People’s Republic of China; 3Jiangxi Clinical Research Center for Ophthalmic Disease, Nanchang, Jiangxi, People’s Republic of China; 4Jiangxi Provincial Key Laboratory of Vitreoretinal Diseases for Health, Nanchang, Jiangxi, People’s Republic of China; 5School of Ophthalmology and Optometry, Jiangxi Medical College, Nanchang University, Nanchang, Jiangxi, People’s Republic of China; 6Department of Ophthalmology, Jiangxi Provincial People’s Hospital, the First Affiliated Hospital of Nanchang Medical College, Nanchang, Jiangxi, People’s Republic of China
*These authors contributed equally to this work
Correspondence: Fang-Liang Yu, The Affiliated Eye Hospital, Jiangxi Medical College, Nanchang University, 463 Bayi Avenue, Nanchang, Jiangxi, 330006, People’s Republic of China, Email [email protected]
Xin Huang, The Affiliated Eye Hospital, Jiangxi Medical College, Nanchang University, 463 Bayi Avenue, Nanchang, Jiangxi, 330006, People’s Republic of China, Email [email protected]
Purpose: To investigate large-scale structural brain network reorganization in primary angle-closure glaucoma (PACG) using regional radiomics similarity networks (R2SNs) and to characterize their associated molecular and neurobiological substrates.
Design: Case–control study.
Methods: Structural magnetic resonance imaging data were acquired from 44 patients with PACG and 44 age- and sex-matched healthy controls. Individualized R2SNs were constructed to identify PACG-related structural network alterations. Partial least squares regression was used to link R2SN alterations with brain-wide transcriptomic profiles, followed by enrichment, cell-type, neurochemical, and epicenter analyses. Supervised machine learning was used to evaluate the discriminative value of R2SN-derived features.
Results: Compared with controls, patients with PACG demonstrated widespread R2SN alterations extending beyond the visual pathway, involving frontal, temporal, limbic, and subcortical regions. Network-level analyses revealed disrupted structural covariance across intrinsic functional systems, particularly within limbic, default mode, attentional, and frontoparietal control networks. Imaging–transcriptomic analyses showed spatial coupling between PACG-related network alterations and gene expression profiles enriched in synaptic, cytoskeletal, and immune-related processes. Epicenter analysis identified highly connected hub regions within default mode and attentional systems. Machine learning classifiers based on R2SN features achieved robust discrimination between groups.
Conclusion: PACG is associated with widespread structural brain network reorganization beyond the visual system.R2SN-derived network features may provide sensitive imaging markers of central structural reorganization and offer a multiscale framework for understanding the neural mechanisms of PACG.
Keywords: primary angle-closure glaucoma, regional radiomics similarity network, structural brain network, Imaging transcriptomics, neurochemical mapping, machine learning
Introduction
Glaucoma is one of the leading causes of irreversible blindness worldwide. Among individuals aged 40–80 years, the global prevalence of glaucoma was estimated at approximately 76.0 million in 2020 and is projected to reach 111.8 million by 2040, largely due to population aging.1,2 Glaucoma contributes substantially to global visual disability, accounting for a significant proportion of moderate-to-severe visual impairment and blindness.3,4 Elevated intraocular pressure (IOP) is the most important and modifiable risk factor for glaucoma and has been consistently associated with visual field loss and retinal nerve fiber layer (RNFL) thinning.5–7 However, the existence of normal-tension glaucoma indicates that mechanisms beyond IOP may also contribute to disease progression, including immune dysregulation, neuroinflammation, metabolic disturbance, epigenetic alterations, and other potential pathogenic processes.8,9 Acute or marked elevations in IOP, such as those occurring during acute angle-closure attacks, may induce ischemia–reperfusion injury in the retina and optic nerve, thereby accelerating retinal ganglion cell degeneration.10–12 Clinically, primary glaucoma is commonly classified into primary open-angle glaucoma (POAG) and primary angle-closure glaucoma (PACG) based on the configuration of the anterior chamber angle, in addition to secondary and congenital forms.13 PACG is frequently associated with episodic or sustained IOP elevation and often presents with more severe visual dysfunction.Although glaucoma has long been regarded as an ocular disease, accumulating neuroimaging evidence suggests that its pathological effects extend beyond the eye. Structural and functional MRI studies have demonstrated alterations along the central visual pathway, including the optic nerve, lateral geniculate nucleus, optic radiations, and primary visual cortex, with PACG patients also exhibiting changes in higher-order cortical regions.14–18 Collectively, these findings support an emerging view of glaucoma as a neurodegenerative disorder characterized by visual impairment accompanied by widespread central nervous system alterations. This perspective underlies the concept of the “brain–eye axis,” which emphasizes close interactions between ocular pathology and large-scale brain network organization, while acknowledging that the underlying causal mechanisms remain to be fully clarified.19–21
Contemporary neuroscience conceptualizes the brain as an integrated network in which distributed regions interact to support vision, attention, memory, and executive control.22–27 Advances in neuroimaging have enabled the reconstruction of individual-level brain connectomes using fMRI and dMRI,28–31 and recent studies have revealed abnormal functional and structural connectivity patterns in PACG.32–34 These findings suggest that connectome-based analyses may provide an integrative framework for elucidating central nervous system involvement in glaucoma.
R2SN characterizes intrinsic structural connectivity by quantifying interregional similarity based on high-dimensional radiomic features, including tissue signal intensity and texture patterns.35–37 Unlike conventional morphometric approaches that primarily focus on localized macroscopic properties, R2SN captures coordinated structural relationships across the whole brain and enables individualized network construction.35 By incorporating texture-based radiomic information, R2SN may capture subtle imaging phenotypes that are not readily reflected by conventional volumetric or macroscopic morphometric measures.36–39 Its applications in Alzheimer’s disease, mild cognitive impairment, and developmental neuroscience further support its utility as a biologically grounded framework for investigating structural brain network reorganization.40–42
While genetic studies have identified multiple risk variants associated with glaucoma,43,44 the molecular and cellular substrates underlying PACG-related central brain alterations remain poorly understood. Previous imaging–transcriptomic work in PACG has linked functional MRI abnormalities to gene-specific transcriptional signatures,45 but whether structural network disruptions identified by R2SN show spatial correspondence with regional gene expression profiles remains unclear. This gap limits our understanding of the cellular substrates and molecular pathways underlying PACG-related brain remodeling, highlighting the need to integrate structural MRI–based connectomics with transcriptomic decoding. Beyond transcriptional regulation, brain structure and microarchitecture are also shaped by neuromodulatory systems. Neurotransmitter receptors and transporters play important roles in regulating synaptic transmission, neuronal excitability, and large-scale network organization.46,47 Therefore, mapping PACG-related R2SN alterations onto normative neurotransmitter receptor and transporter distributions may provide complementary insights into the neurochemical architecture associated with central nervous system involvement in PACG.
Network hubs play a central role in integrating information across distributed brain systems and may show heightened vulnerability to disease-related perturbations.48 Epicenter analysis provides a network-based approach to identify putative hub regions whose connectivity profiles are closely aligned with the spatial pattern of disease-related abnormalities.49–51 Applying this framework to PACG may help clarify whether widespread R2SN alterations are organized around specific network-level anchor regions, thereby offering insight into the spatial organization of PACG-associated brain reorganization.
Beyond mechanistic interpretation, supervised machine learning provides a multivariate framework for evaluating whether high-dimensional neuroimaging features contain discriminative information for individual-level disease characterization.52–54 In this study, we used machine learning to assess the potential clinical relevance of R2SN-derived features in differentiating patients with PACG from healthy controls.
To address these gaps, we aimed to systematically characterize large-scale structural brain network alterations in PACG using an individualized R2SN-based framework. We further integrated imaging–transcriptomic analysis, cell-type enrichment, neurochemical mapping, epicenter analysis, and supervised machine learning to examine the multiscale biological signatures and potential discriminative value of PACG-related R2SN alterations. This integrative framework may help clarify how PACG-related brain changes are organized across structural, molecular, cellular, neurochemical, and network levels, thereby providing new insights into central nervous system involvement in PACG.
Methods and Materials
Participants
A total of 44 patients with primary angle-closure glaucoma (PACG) and 44 healthy controls (HCs) were recruited from the Affiliated Eye Hospital of Nanchang University. The HC group was matched to the PACG group in terms of age, sex, and handedness.
Inclusion Criteria The inclusion criteria for PACG patients were as follows: (1) intraocular pressure (IOP) > 21 mmHg and primary angle-closure validated by gonioscopy; (2) evidence of glaucomatous optic nerve damage, such as a vertical cup-to-disc (C/D) ratio > 0.6; (3) characteristic glaucomatous visual field defects (eg., paracentral scotoma, arcuate scotoma, or nasal step); (4) naive to anti-glaucoma medications and surgical interventions; and (5) absence of other ocular comorbidities affecting visual function.
Healthy controls were required to meet the following criteria: (1) no abnormalities on structural brain MRI; (2) absence of ocular diseases and normal visual acuity (uncorrected or corrected visual acuity > 1.0); and (3) no history of psychiatric illnesses.
Exclusion Criteria The exclusion criteria for all participants (both PACG patients and HCs) included: (1) severe myopia or hyperopia (eg., spherical equivalent exceeding ±6.00 D); (2) major neurological or psychiatric disorders, including epilepsy, stroke, depression, or long-term use of neuroactive medications; and (3) contraindications to MRI scanning, such as metallic implants, pacemakers, or severe claustrophobia.
Statement of Ethics
The procedures followed in this study were in accordance with the Declaration of Helsinki and approved by the Research Ethics Committee of the Affiliated Eye Hospital of Nanchang University (Ethics number: YLP20260045). Prior to participation, all subjects received a brief explanation of the objectives, methods, and potential risks of the study and provided written informed consent.
Data Acquisition
Magnetic resonance imaging (MRI) data were collected using a 3.0-Tesla system (Discovery MR750W; GE Healthcare, Milwaukee, WI, USA) equipped with an eight-channel head coil. High-resolution T1-weighted anatomical images were obtained using a three-dimensional spoiled gradient-recalled echo (SPGR) acquisition sequence in the sagittal plane. The structural scan included approximately 176 slices and was performed with the following parameters: repetition time of 8–10 ms, echo time of approximately 3 ms, slice thickness of 1.0 mm without an interslice gap, an acquisition matrix of 256 × 256, a field of view of 240×240 mm2, and a flip angle of 10–12°. This protocol enabled the acquisition of whole-brain, isotropic, high-quality structural images suitable for subsequent preprocessing and analysis.
Data Processing
All T1-weighted structural MRI data were preprocessed prior to R2SN construction. For each participant, the three-dimensional T1-weighted image was spatially normalized to the Montreal Neurological Institute (MNI) standard space using Advanced Normalization Tools (ANTs; https://github.com/ANTsX/ANTs). Subsequently, the brain was parcellated into 246 cortical and subcortical regions of interest (ROIs) according to the Brainnetome Atlas, a connectivity-based parcellation comprising 210 cortical and 36 subcortical regions.55
For each Brainnetome-defined ROI, radiomic features were extracted from the spatially normalized T1-weighted images. An initial set of 47 radiomic descriptors was computed for each region, including first-order intensity features and higher-order texture features that characterize both global intensity distributions and spatial gray-level relationships within each ROI. Following the original R2SN protocol, features exhibiting high collinearity (Pearson correlation coefficient r > 0.9) were removed, resulting in a final subset of 25 robust radiomic features retained for subsequent analyses.35,56
Individualized R2SN Construction and PACG - Control Comparisons
To ensure comparability across brain regions within each individual, min–max normalization was applied to the selected radiomic features across all ROIs on a subject-by-subject basis. Individualized R2SNs were then constructed by computing pairwise Pearson correlation coefficients between the normalized radiomic feature vectors of all ROI pairs.
This procedure generated a 246×246 morphological similarity matrix for each participant, in which nodes correspond to Brainnetome atlas regions and edges represent the degree of structural similarity between regional radiomic signatures. These individualized R2SNs were used for all subsequent network-level and statistical analyses. After R2SN construction, region-wise network features were extracted for each Brainnetome atlas region. Between-group differences between patients with PACG and healthy controls were assessed using two-sample t-tests at the regional level. The resulting t-statistics were used to characterize spatial patterns of R2SN alterations across the brain. Brain regions exhibiting significant group differences were subsequently subjected to downstream analyses (Figure 1).
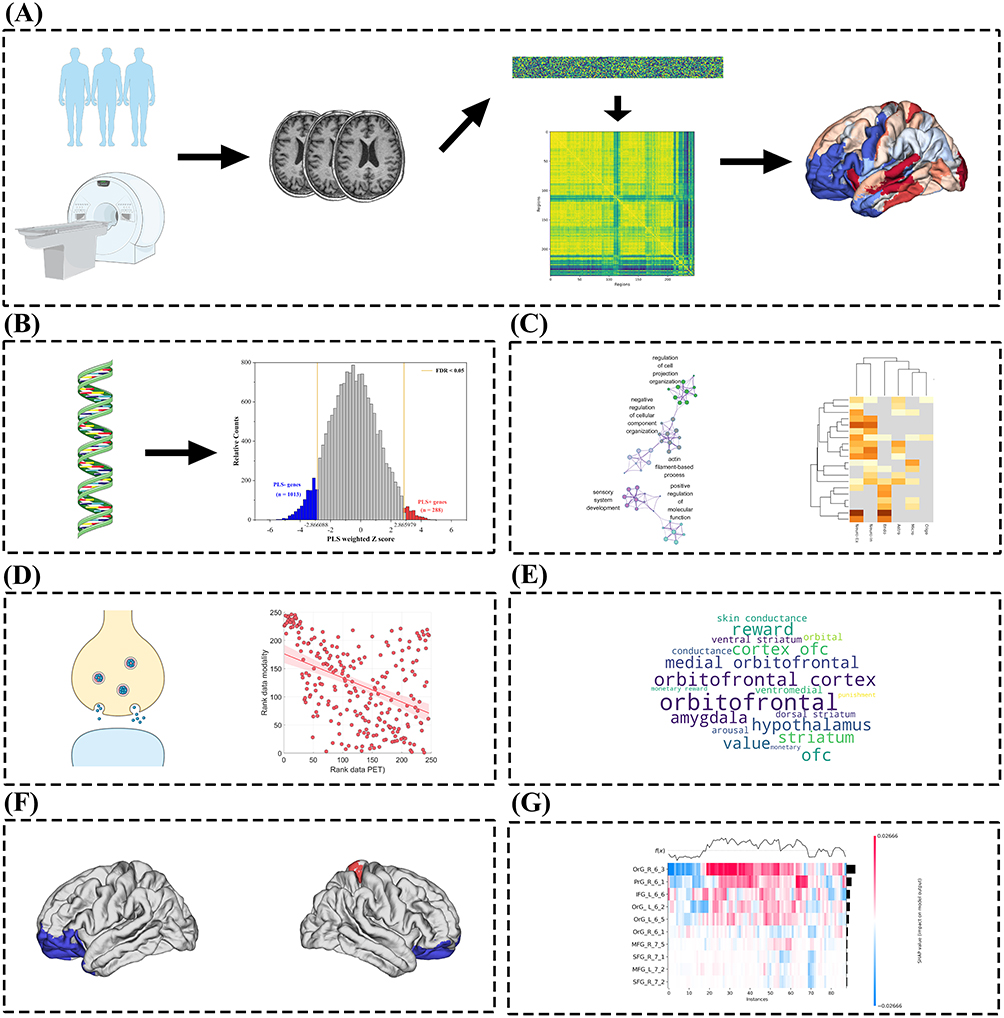 |
Figure 1 An overview of the analytical process in this study. (A) After data preprocessing, regional intensity- and texture-based radiomic features were extracted according to the Brainnetome atlas. Pairwise inter-regional associations were then estimated using Pearson correlation coefficients to construct the regional radiomics similarity network. Subsequently, differences in network connectivity and clinical characteristics were systematically compared between patients with PACG and HCs. (B) PLS analysis linking R2SN alterations to gene expression profiles. (C) Functional enrichment and cell-type specificity of genes associated with R2SN alterations. (D) Associations between R2SN-related genes and neurotransmitter systems. (E) Word cloud visualization of functional network involvement of R2SN-altered regions. (F) Epicenter analysis of R2SN-derived brain network alterations in PACG. (G) Machine learning classification based on R2SN-derived features. |
Systems-Level Summary of R2SN Abnormalities Using Word Cloud Visualization
To provide a high-level and intuitive overview of large-scale network patterns underlying PACG-related R2SN alterations, a word cloud visualization was generated based on group-level R2SN analyses. Group-averaged R2SN matrices were first computed separately for PACG patients and healthy controls by averaging individual R2SN matrices within each group. Edge-wise statistical comparisons between groups were then performed to derive a case–control R2SN t-statistic map, from which statistically significant abnormal connections and regions were identified and visualized in three-dimensional brain space.
To characterize the distribution of R2SN abnormalities across large-scale functional systems, abnormal R2SN values and regional residuals were summarized at the network level using the Yeo 7-network functional parcellation, and additional projections were performed onto the Brain Reward System.57 Functional network labels and system-level descriptors associated with abnormal R2SN patterns were then compiled, and a word cloud was generated in which word size reflected the relative frequency or prominence of network-level involvement. This visualization served as a descriptive and exploratory tool to summarize dominant functional systems associated with R2SN abnormalities, rather than as a quantitative inferential analysis.
Calculation of Regional Gene Expression
Regional transcriptomic data were obtained from the Allen Human Brain Atlas (AHBA), a publicly available postmortem atlas of adult human brain gene expression.58 The AHBA includes 3,702 postmortem tissue samples collected from six neurologically healthy adult donors. Gene expression data were processed and mapped using the abagen toolbox, resulting in regional expression profiles for 15,633 genes aligned with Brainnetome atlas regions corresponding to the R2SN t-statistic map.59 The preprocessing workflow involved updating probe annotations, filtering low-quality probes based on expression intensity, selecting a representative probe for each gene, assigning tissue samples to atlas-defined brain regions, imputing missing regional data, normalizing expression data, aggregating expression values at the regional level, and retaining genes with stable expression patterns across donors. Because the AHBA provides normative brain transcriptomic data rather than glaucoma-specific samples, the present analysis was designed to assess spatial correspondence between PACG-related R2SN alterations and normative gene expression gradients, rather than disease-induced transcriptional changes in glaucoma tissue.
Transcriptomic Associations of Altered R2SN Structural Similarity Patterns in PACG
PLS regression was employed to examine the association between regional transcriptional profiles and R2SN-derived structural network alterations. The case–control R2SN t-statistic map of left-hemisphere Brainnetome regions was used as the imaging phenotype (Y), representing the spatial distribution of PACG-related structural similarity differences, while regional gene expression profiles obtained from the Allen Human Brain Atlas served as predictor variables (X). Prior to PLS analysis, both imaging and gene expression data were standardized.PLS decomposition was performed to identify latent components that maximized the covariance between gene expression patterns and R2SN alterations. The proportion of variance in the R2SN t-statistic map explained by successive PLS components was quantified, with particular focus on the first PLS component (PLS1), which accounted for the largest proportion of variance in Y.
Spatial correspondence between R2SN alterations and transcriptional patterns was assessed by comparing the regional R2SN t-statistic map with the weighted gene expression map derived from PLS1 gene scores. To evaluate the contribution of individual genes to the PLS components, gene weights were transformed into Z-scores and compared against null distributions generated using 1,000 spatial permutation (spin) tests, which preserved the spatial autocorrelation structure of cortical maps.The spatial association between regional PLS1 scores and R2SN t values was quantified using Pearson correlation analysis, with statistical significance assessed based on the spin-based null model. To visualize the spatial correspondence between transcriptional patterns and PACG-related R2SN alterations, representative genes with strong positive and negative loadings on PLS1 were selected. Gene expression values for each selected gene were Z-score normalized across regions and projected onto the cortical surface to generate regional gene expression maps.
For each representative gene, Z-scored gene expression maps were displayed alongside the corresponding left-hemisphere case–control t-statistic map of R2SN alterations. These paired visualizations were used to qualitatively illustrate the spatial alignment between gene-specific expression gradients and disease-related structural network differences. No additional statistical testing was performed for these illustrative maps.
Enrichment Analyses
To characterize the biological functions of genes associated with R2SN alterations in PACG, pathway enrichment analyses were performed using Metascape, an integrative functional annotation platform that incorporates multiple resources, including Gene Ontology (GO), KEGG, and Reactome databases.60 Genes were filtered using a false discovery rate (FDR) threshold of 1%, and significantly enriched pathways were identified based on statistical significance and functional clustering.
Enrichment analyses were conducted separately for positively and negatively weighted gene sets derived from PLS1, which represented the dominant transcriptional component associated with R2SN abnormalities. To further contextualize these transcriptional signatures, overlap analyses were performed between PLS1-associated gene sets and susceptibility genes reported in large-scale genome-wide association studies (GWAS) related to neurological and psychiatric disorders. Compared with subsequent PLS components, PLS1 exhibited a more stable gene-weight distribution and was therefore selected for downstream functional analyses.
Assigning PACG-Related Genes to Specific Cell Types
Genes showing significant associations with R2SN alterations in PACG were assigned to specific brain cell types according to the framework proposed by Seidlitz et al, which categorizes genes into seven major cellular populations, including astrocytes, endothelial cells, microglia, excitatory neurons, inhibitory neurons, oligodendrocytes, and oligodendrocyte precursor cells (OPCs).
To evaluate whether the observed gene–cell type associations exceeded what would be expected by chance, permutation testing was performed, and statistical significance was determined using false discovery rate (FDR)-corrected p-values (< 0.05). Cell-type specificity analyses were conducted separately for genes positively and negatively weighted on the first PLS component (PLS1), enabling assessment of potential differences in cellular expression patterns between transcriptional profiles that were spatially aligned with (positive weights) or inversely related to (negative weights) PACG-related R2SN alterations. This bidirectional analysis was designed to provide a more comprehensive characterization of the cellular contexts underlying the transcription–neuroimaging associations.
Spatial Correlation Between R2SN Alteration and Receptor/Transporter Density
To examine the neurochemical substrates associated with R2SN alterations in PACG, we assessed their spatial correspondence with normative maps of neurotransmitter receptor and transporter densities using the JuSpace toolbox, which integrates PET and SPECT data.61 Regional R2SN alteration maps derived from the PACG–control comparison served as the imaging phenotype for this analysis. A total of thirteen neurotransmitter-related maps were included, covering multiple neuromodulatory systems, such as cerebral blood flow (CBF), kappa opioid receptor (KOR), kappa opioid receptor–selective ligand (KappaOp), mu opioid receptor (MOR), mu opioid receptor–selective ligand (MU), and metabotropic glutamate receptor 5 (mGluR5), among others.
Spatial associations between R2SN alterations and neurotransmitter distributions were quantified using Spearman’s rank correlation coefficients.62 To mitigate potential biases introduced by spatial autocorrelation, statistical significance was evaluated using spatial permutation procedures implemented in JuSpace. All resulting p values were further adjusted for multiple comparisons using Bonferroni correction.63
Epicenter Analysis of R2SN Network Alterations
Epicenter analysis was conducted to identify brain regions whose intrinsic morphological connectivity profiles best recapitulated the spatial distribution of PACG-related R2SN abnormalities. Normative connectivity profiles were derived from the group-averaged R2SN of healthy controls (see R2SN construction above). For each region, its normative R2SN connectivity profile was defined as the vector of structural similarity values to all other regions.
PACG-related abnormalities were represented by patient-specific R2SN alteration maps derived for each PACG patient relative to the healthy-control reference pattern. For each PACG patient and each region, a Spearman spatial correlation was computed between the region’s normative R2SN connectivity profile and the corresponding patient-specific abnormality map. Correlation coefficients were transformed using Fisher’s r-to-z transformation, yielding patient-level regional goodness-of-fit (GOF) scores. Group-level epicenter strength was assessed using one-sample t tests on GOF scores across patients, with multiple comparisons controlled using false discovery rate (FDR) correction (q < 0.05).The single region exhibiting the highest GOF-derived t value was defined as the top-ranked (top-1) structural-network epicenter and selected for subsequent analyses.
To contextualize the functional embedding of the top-ranked epicenter, we examined its normative whole-brain functional connectivity (FC) profile using a standard FC template from healthy individuals. FC values were summarized within the Yeo 17-network parcellation by averaging FC strength across parcels belonging to each network, and networks were ranked according to their mean FC with the epicenter. This functional network projection was performed for interpretative purposes only and did not contribute to epicenter identification. Across the above analyses, Pearson and Spearman correlations were used according to the analytical context: Pearson correlation was applied when linear associations between continuous variables were expected, whereas Spearman rank correlation was used for spatial map-based analyses to provide robustness to non-normality and outliers.
Machine Learning-Based Classification Using R2SN Features
To identify the most discriminative brain regions associated with PACG, feature selection was performed using support vector machine–recursive feature elimination (SVM-RFE). Regional R2SN features were extracted based on the Brainnetome atlas, yielding a 246-dimensional feature vector for each subject. All features were standardized using z-score normalization prior to analysis.
SVM-RFE was implemented using a linear support vector machine, in which features were ranked according to the squared magnitude of their weight coefficients and recursively eliminated until a predefined number of features remained. To avoid information leakage, feature selection was conducted within a nested cross-validation framework,64 with SVM-RFE applied exclusively to the training data in each outer fold. The final discriminative features were determined based on selection stability across folds, and the top 10 brain regions were retained for subsequent analyses.
The selected features were then used as inputs for five machine learning classifiers, including SVM, RF, LR, XGBoost, and LightGBM. All models were trained and evaluated within the same nested cross-validation framework, with hyperparameters optimized using grid search on the training data only. Classification performance was assessed using accuracy, sensitivity, specificity, and the area under the receiver operating characteristic curve (AUC).
Results
Demographics and Clinical Characteristics
No significant differences were found between the PACG group and the healthy controls in terms of gender (P = 0.67). In contrast, significant group differences were observed in BCVA-OD, BCVA-OS, IOP-OD, and IOP-OS, with all P < 0.001. Detailed information is presented in Table 1.
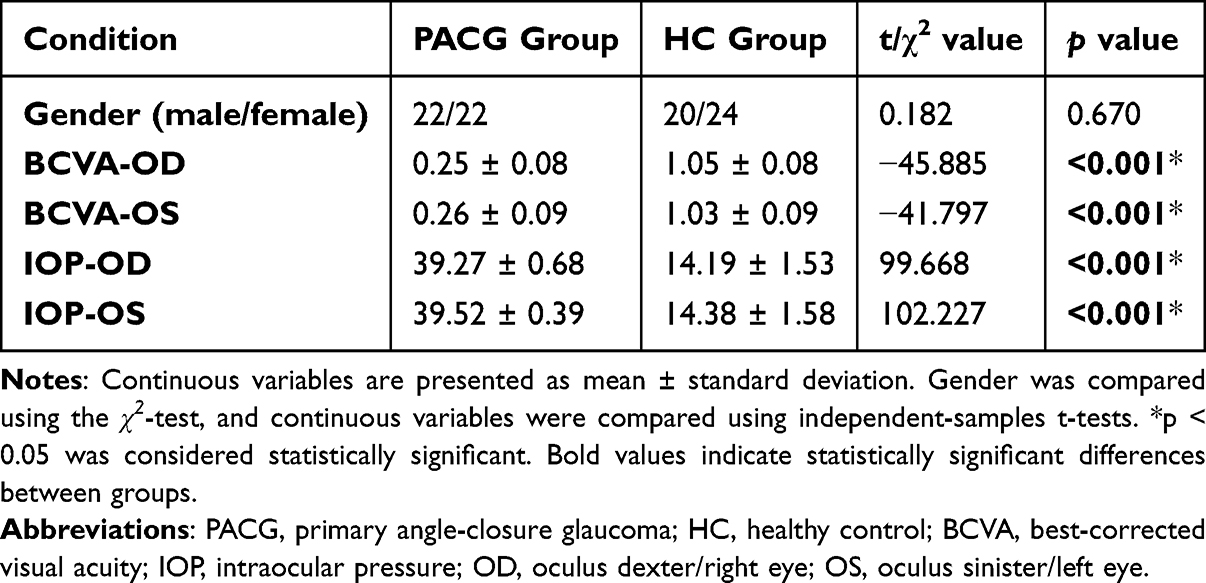 |
Table 1 Demographics and Visual Measurements Between Two Groups |
Regional R2SN Alterations in PACG
Region-wise two-sample t-test analysis, corrected for multiple comparisons using the false discovery rate (FDR < 0.05) and thresholded at P ≤ 0.001, revealed significant R2SN alterations in patients with PACG compared with healthy controls. A total of multiple cortical and subcortical regions exhibited significant group differences, indicating widespread structural similarity disruptions at the regional level.
The altered regions were predominantly distributed across frontal, temporal, parietal, and limbic cortices. Within the frontal lobe, abnormalities were mainly observed in the middle frontal gyrus (MFG), inferior frontal gyrus (IFG), and orbital gyrus (OrG). Temporal lobe involvement primarily included the superior temporal gyrus (STG), inferior temporal gyrus (ITG), fusiform gyrus (FuG), and posterior superior temporal sulcus (pSTS). Parietal alterations were detected in the precentral gyrus (PrG) and postcentral gyrus (PoG).
In addition, several limbic-related regions, including the parahippocampal gyrus (PHG), insula (INS), and cingulate gyrus (CG), also showed significant R2SN alterations. Notably, extensive subcortical abnormalities were identified in the basal ganglia and thalamus. The spatial distribution of these PACG-related R2SN alterations will be illustrated in Table 2.
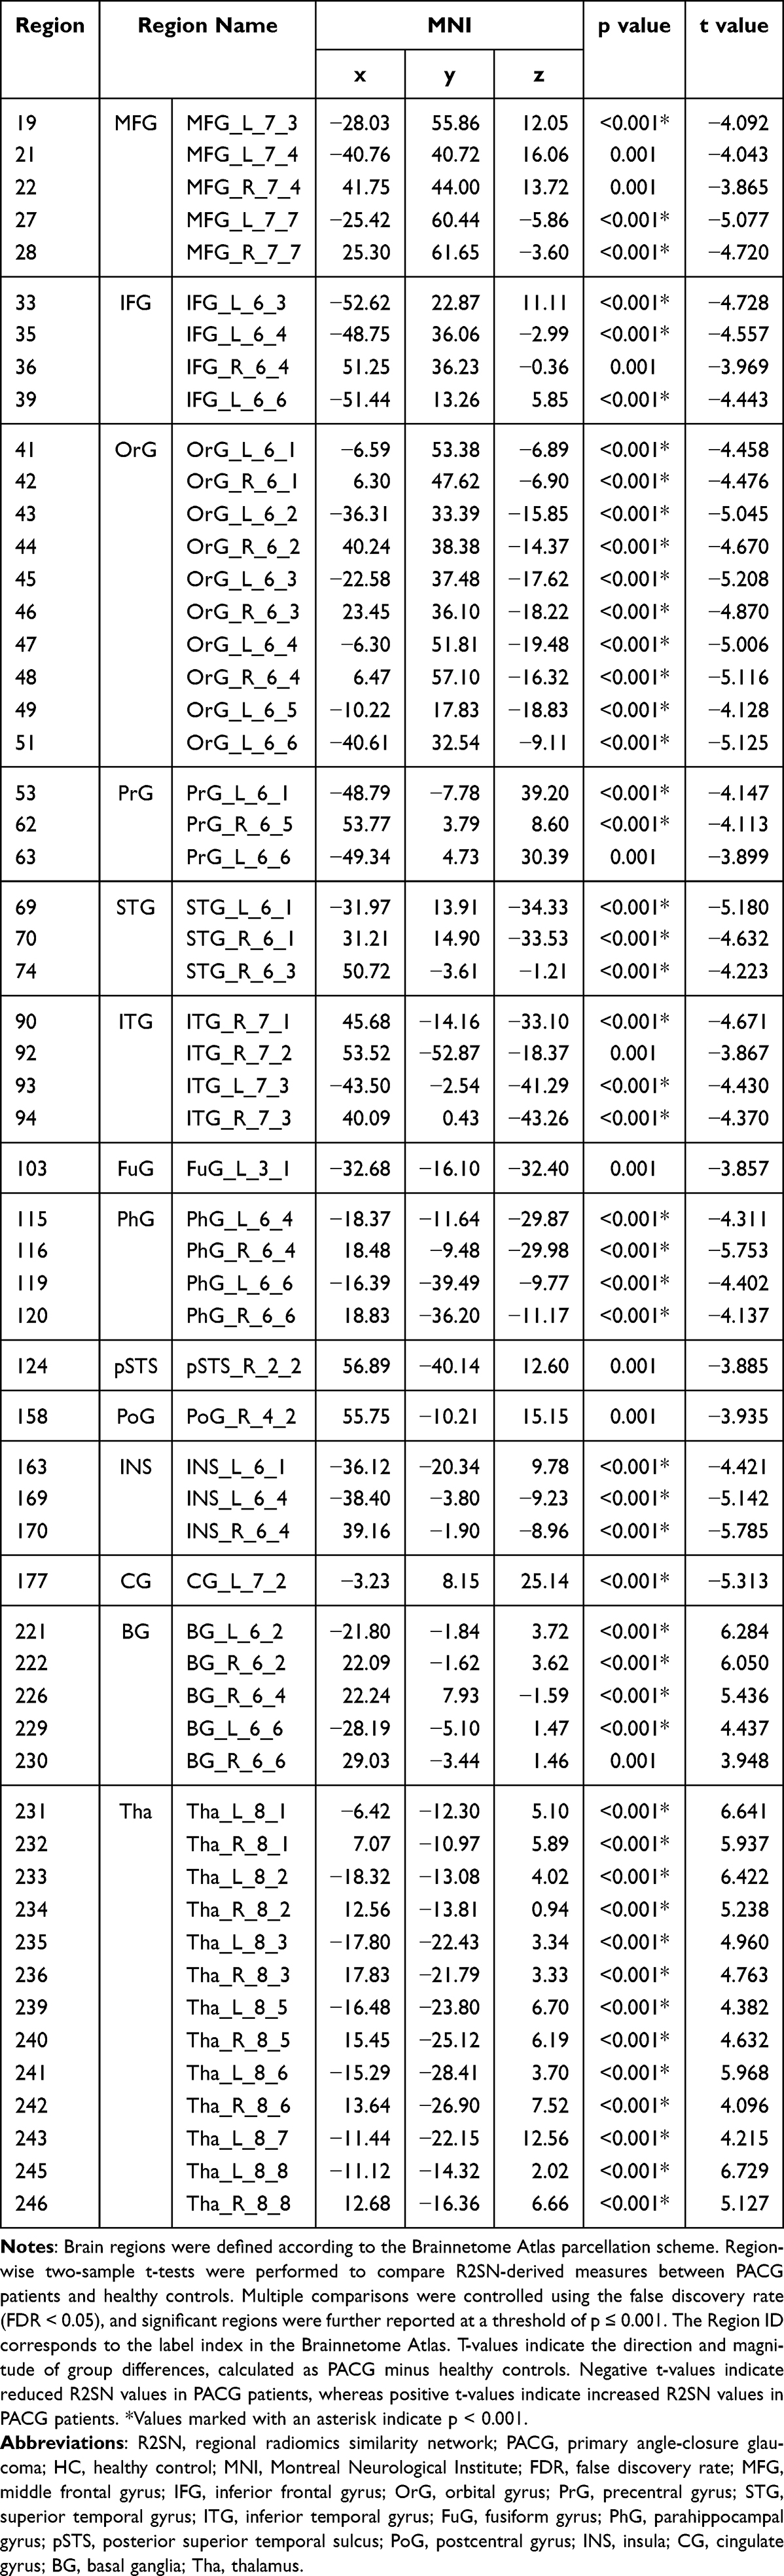 |
Table 2 Brain Regions Showing Significant R2SN Alterations Between PACG Patients and Healthy Controls |
Systems-Level Summary of R2SN Abnormalities Using Word Cloud Visualization
Group-averaged R2SN matrices were first visualized to provide an overview of structural similarity patterns in each group. As shown in Figure 2A and B, cortical surface projections derived from group-averaged R2SNs revealed distinct spatial patterns between patients with PACG and healthy controls.To quantitatively assess group differences at the whole-brain level, a case–control comparison was performed, yielding a case–control t-statistic map that characterized the magnitude and direction of R2SN alterations across Brainnetome-defined brain regions (Figure 2C).
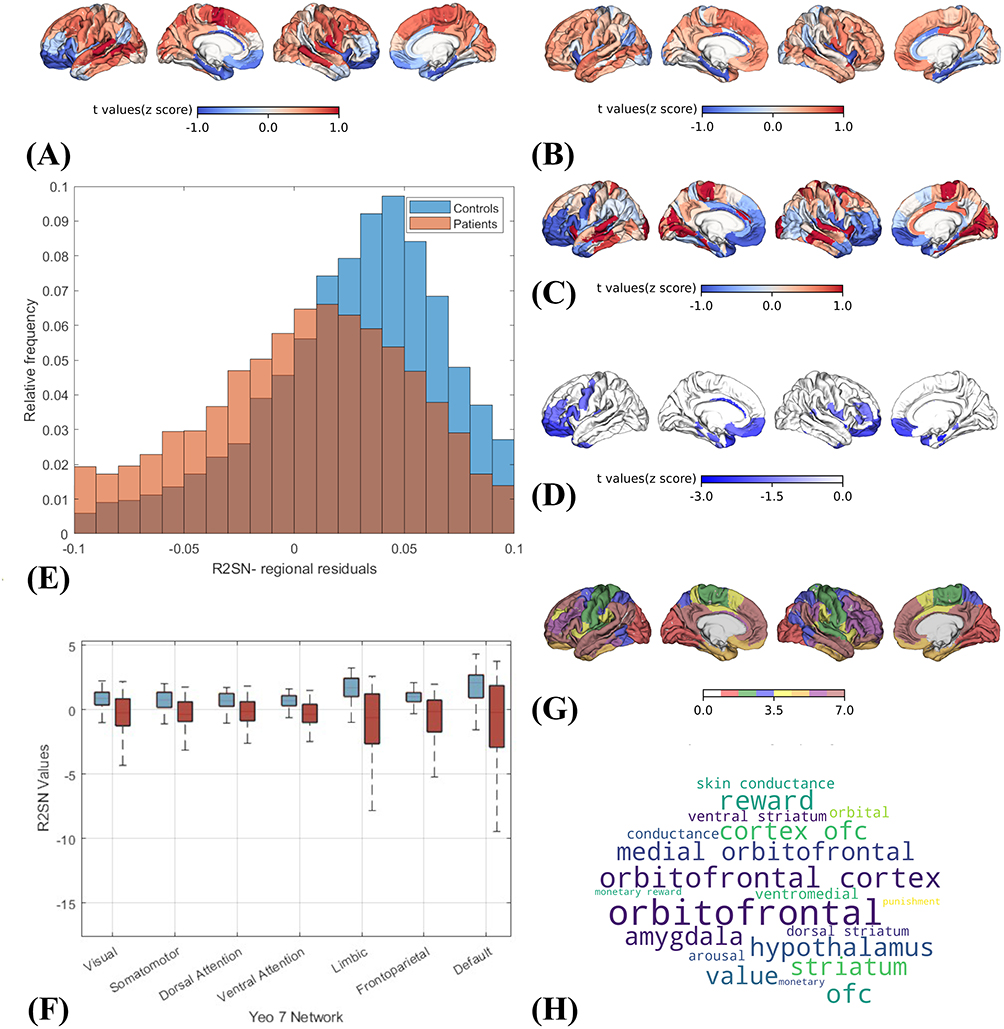 |
Figure 2 Regional- and systems-level characterization of PACG-related R2SN alterations. (A and B) Cortical surface projections of regional measures derived from group-averaged R2SNs in patients with PACG and healthy controls. (C) Case–control t-statistic map showing the spatial distribution of PACG-related R2SN alterations. (D) Three-dimensional visualization of brain regions with significant R2SN alterations. (E) Distribution of regional R2SN residuals across Brainnetome atlas regions. (F) Group differences in mean R2SN values across Yeo 7 functional networks. (G) Projection of significant R2SN-altered regions onto the Yeo 7-network atlas. (H) Word cloud visualization summarizing anatomical and functional-system terms prominently represented among R2SN-altered regions. |
Based on the region-wise statistical results, brain regions showing significant R2SN alterations (P ≤ 0.001) were identified and visualized in Figure 2D, with detailed regional information summarized in Table 2. These regions were determined using two-sample t-tests comparing regional R2SN-derived measures between PACG patients and healthy controls. To further characterize the magnitude of alteration at the regional level, summary measures reflecting the extent of R2SN deviation were computed for each Brainnetome parcel. The resulting distribution of regional alteration strength (Figure 2E) exhibited marked heterogeneity across brain regions, indicating that PACG-related R2SN abnormalities vary spatially in their regional impact.
At the systems level, region-wise R2SN measures were aggregated within the Yeo 7 functional network framework, and group differences were assessed using two-sample t-tests (Figure 2F). Significant group effects were observed across all seven functional networks, with PACG patients consistently exhibiting reduced R2SN values relative to healthy controls. The corresponding t values and p values for each Yeo network are reported in Table 3, providing quantitative support for the network-level differences observed. To facilitate anatomical interpretation, all significant Brainnetome regions were subsequently projected onto the Yeo 7-network cortical template (Figure 2G), illustrating the distribution of R2SN alterations across multiple large-scale functional systems.
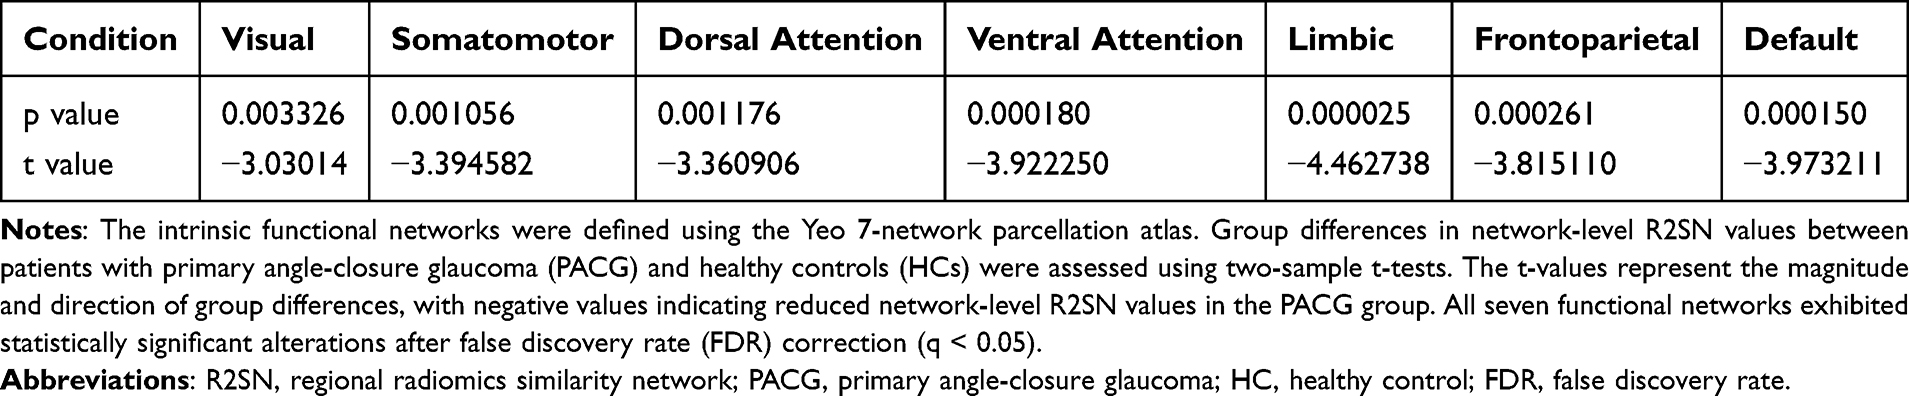 |
Table 3 Network-Level Group Differences in R2SN Values Across the Yeo 7 Functional Networks |
Finally, to further contextualize these findings at the systems level, functional network labels and anatomical descriptors associated with significant R2SN-altered regions were summarized using a word cloud visualization (Figure 2H). This visualization highlighted prominently represented anatomical and functional-system terms among altered regions.
Transcriptomic Associations of PACG-Related R2SN Alterations
Building on the region-wise R2SN alterations identified between PACG patients and healthy controls, the PLS analysis revealed that these structural network changes are tightly constrained by the brain’s intrinsic transcriptional architecture. PLS1 was selected as the dominant transcriptional component for downstream analyses. The distribution of Z-scored PLS1 gene weights revealed a broad transcriptional loading pattern associated with the R2SN case–control t-statistic map, with significantly negatively and positively weighted genes highlighted after FDR correction (Figure 3A).
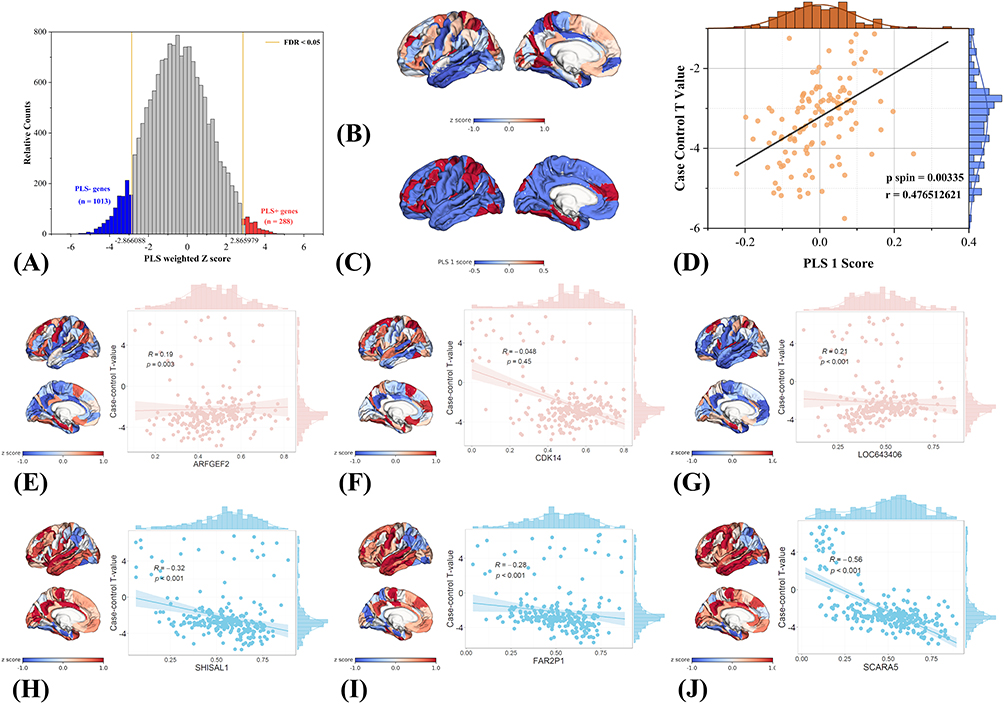 |
Figure 3 Transcriptomic associations of PACG-related R2SN structural network alterations revealed by PLS analysis. (A) Distribution of Z-scored PLS1 gene weights, with significantly negatively and positively weighted genes highlighted. (B) Spatial correspondence between the left-hemisphere R2SN case–control t-statistic map and the PLS1-derived weighted gene expression map. (C) Empirical and spin-test-based null distributions of PLS1 gene weights. (D) Spatial correlation between regional PLS1 scores and left-hemisphere R2SN t values (Pearson’s r = 0.476, spin-test-corrected p = 0.00335). (E–J) Representative genes showing spatial correspondence between regional gene expression patterns and R2SN alterations. |
The strong spatial correspondence between the R2SN alteration map and the PLS1-derived gene expression pattern (Figure 3B), together with the significant deviation of PLS1-weighted gene Z scores from spin-based null distributions (Figure 3C, FDR < 0.05), demonstrates that the observed imaging–transcriptomic association is highly unlikely to arise from random spatial organization. This finding provides robust evidence that PACG-related structural similarity disruptions are biologically constrained rather than spatially diffuse.
Using an FDR-corrected threshold (q < 0.05), 1,013 negatively weighted genes (PLS− genes) and 288 positively weighted genes (PLS+ genes) were identified. This asymmetric distribution suggested a predominant negatively weighted transcriptional program, accompanied by a smaller but distinct set of positively weighted genes.
Consistent with this interpretation, regional PLS1 scores exhibited a significant positive correlation with R2SN case–control t values (Pearson’s r = 0.476, spin-test-corrected p = 0.00335; Figure 3D), indicating that the magnitude of structural network alteration scales with the strength of the underlying transcriptional pattern. Together, these results establish a robust molecular framework linking macroscale R2SN alterations to regional gene expression organization in PACG, thereby providing a biologically grounded basis for subsequent functional enrichment and cellular specificity analyses. Gene-level contributions to PLS1 were further examined by ranking genes according to their Z-scored loadings. Representative positively weighted genes included ARFGEF2, CDK14, and LOC643406, whereas representative negatively weighted genes included SHISAL1, FAR2P1, and SCARA5, indicating opposing transcriptional contributions to the PACG-related R2SN pattern.
To further illustrate the spatial correspondence between transcriptional patterns and R2SN alterations, representative genes with strong positive and negative PLS1 loadings were visualized (Figure 3E–J). Cortical maps of Z-scored gene expression for positively weighted genes, including ARFGEF2, CDK14, and LOC643406 (Figure 3E–J), exhibited spatial patterns that closely overlapped with regions showing pronounced PACG-related R2SN differences. In contrast, genes with strong negative loadings, such as SHISAL1, FAR2P1, and SCARA5 (Figure 3H–J), displayed complementary spatial distributions relative to the R2SN case–control t-statistic map. Together, these representative examples provide qualitative visualization of the spatial coupling between gene expression gradients and PACG-related structural network alterations.
Functional Enrichment of PLS1-Associated Genes
For the negatively weighted gene set (Figure 4A), enriched terms were predominantly related to neuronal structural organization, cytoskeletal dynamics, and synaptic regulation. Specifically, significant enrichment was observed in processes such as regulation of cell projection organization, actin filament-based process, microtubule-based movement, and negative regulation of cellular component organization, indicating alterations in the maintenance and organization of neuronal morphology. In parallel, multiple synapse-related and signaling terms, including synapse organization, modulation of chemical synaptic transmission, and adenylate cyclase–inhibiting G protein–coupled receptor signaling pathway, were identified. In addition, pathways associated with protein synthesis and turnover—such as cytoplasmic translation, translational initiation, ribosomal large subunit biogenesis, protein–RNA complex assembly, and regulation of ubiquitin-dependent protein catabolic process—were significantly enriched. Cell cycle–related terms (eg. mitotic cell cycle) and stress-related responses, including regulation of cellular response to stress and response to radiation, were also represented.
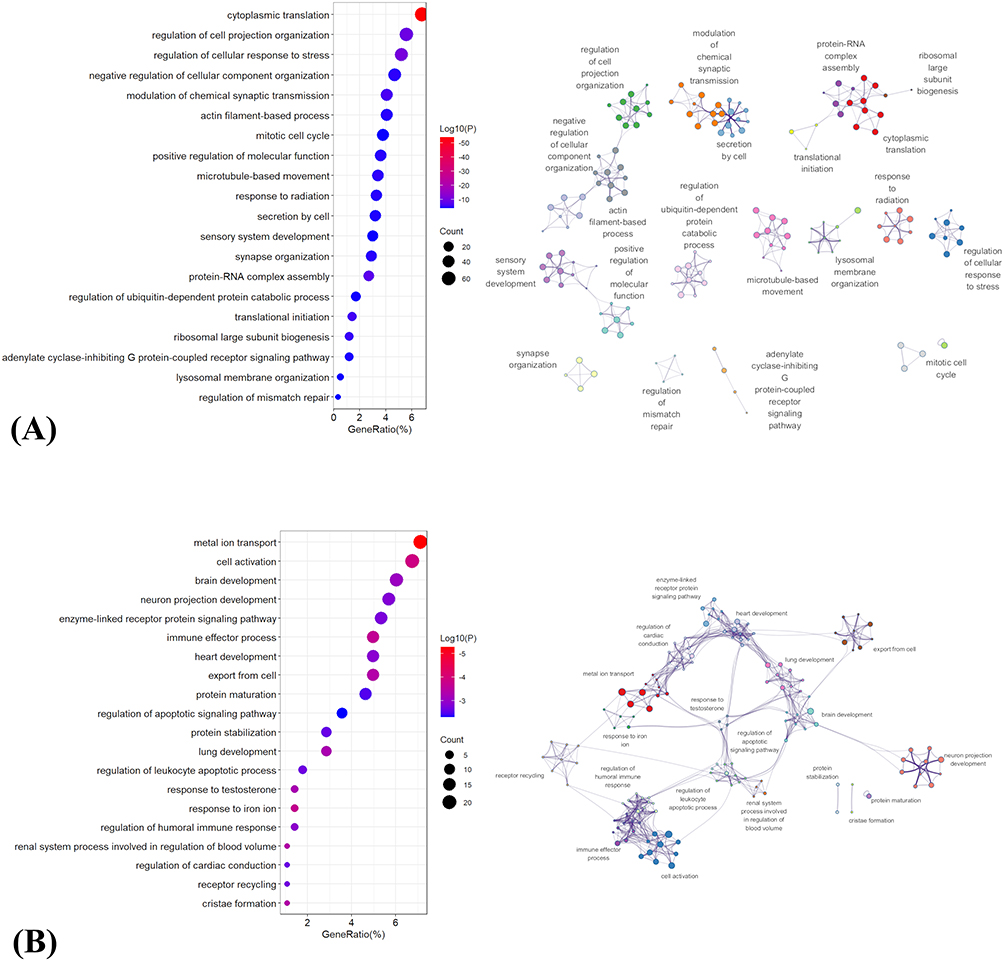 |
Figure 4 Functional enrichment analysis of PLS1-associated genes linked to PACG-related R2SN alterations. (A) Negatively weighted PLS1 genes.(B) Positively weighted PLS1 genes. For both panels, the left subpanel displays the top 20 significantly enriched GO terms and KEGG pathways, with bubble color indicating enrichment significance and bubble size indicating the number of contributing genes. The right subpanel shows a network visualization of enriched functional terms, in which related terms are grouped into functional clusters to highlight the major biological modules associated with PACG-related R2SN alterations. |
In contrast, the positively weighted gene set (Figure 4B) showed enrichment in pathways associated with cellular activation, developmental processes, and immune-related functions. Prominent terms included brain development, neuron projection development, and cell activation, alongside multiple signaling pathways such as enzyme-linked receptor protein signaling pathway and receptor recycling. Notably, several immune and inflammatory processes were enriched, including immune effector process, regulation of humoral immune response, and regulation of leukocyte apoptotic process. Additionally, pathways related to ion homeostasis and metabolism—such as metal ion transport and response to iron ion—were identified. Enrichment was also observed in processes involved in apoptosis regulation (regulation of apoptotic signaling pathway), protein homeostasis (protein maturation and protein stabilization), and mitochondrial structure (cristae formation), as well as organ system development terms including heart development, lung development, and renal system process involved in regulation of blood volume.
Together, these results indicate that PACG-related R2SN alterations are associated with two distinct but complementary transcriptional programs, involving disrupted neuronal structural and synaptic maintenance on the one hand, and enhanced cellular activation, developmental, and immune-related processes on the other.
Cell-Type–Specific Transcriptional Signatures Underlying R2SN Alterations
To characterize the cellular context underlying transcriptional patterns associated with R2SN alterations in PACG, genes positively and negatively weighted on the first PLS component (PLS1) were mapped onto transcriptomic profiles of seven major cortical cell types. As shown in Figure 5A, spatial projection revealed marked regional heterogeneity across cell-type–specific expression patterns, indicating that transcriptional signals associated with R2SN alterations were not uniformly distributed across the cortex.
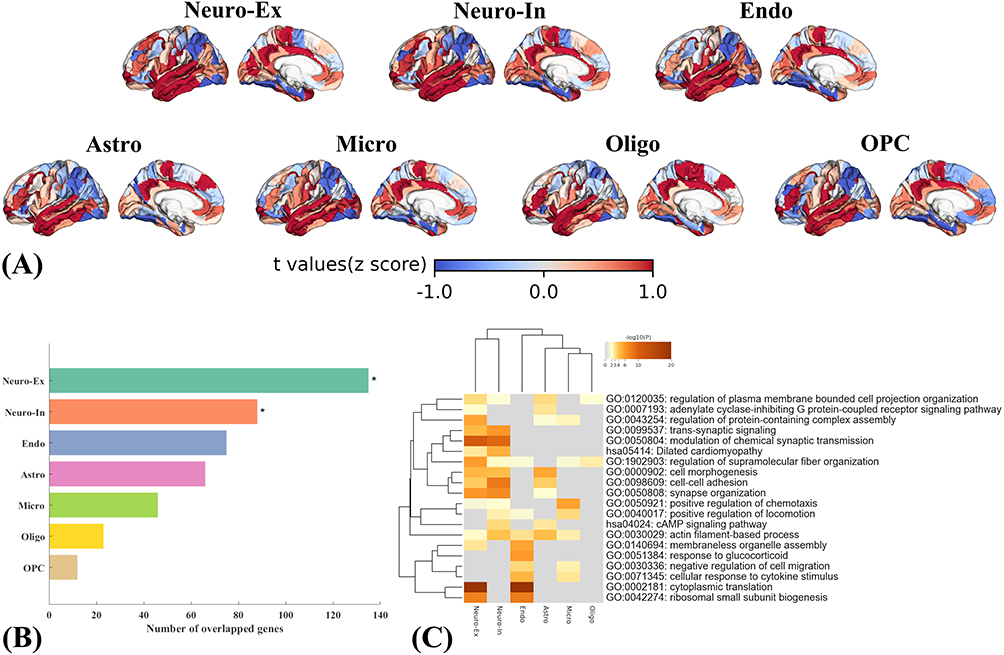 |
Figure 5 Cell-type–specific transcriptional signatures associated with PACG-related R2SN alterations. (A) Cortical maps of cell-type–specific expression patterns for negatively weighted PLS1 genes across seven major brain cell types, including excitatory neurons, inhibitory neurons, endothelial cells, astrocytes, microglia, oligodendrocytes, and oligodendrocyte precursor cells. (B) Overlap between negatively weighted PLS1 genes and cell-type–specific gene sets; significant enrichments after FDR correction are marked with asterisks. (C) GO biological process enrichment of negatively weighted PLS1 genes across different cell types. |
Cell-type enrichment analysis of positively weighted PLS1 genes did not reveal significant enrichment for any cortical cell class after false discovery rate (FDR) correction (p < 0.05). In contrast, genes negatively weighted on PLS1 exhibited significant overrepresentation in excitatory (Neuro-Ex) and inhibitory neurons (Neuro-In), surviving FDR correction (Figure 5B). No significant enrichment was observed for other cortical cell classes at the same statistical threshold.
Gene Ontology–based functional enrichment analysis of negatively weighted genes further revealed distinct biological process profiles across different cell types (Figure 5C). In both excitatory and inhibitory neurons, negatively weighted genes were primarily enriched in pathways related to synaptic organization, trans-synaptic signaling, regulation of neurotransmission, membrane excitability, axonal remodeling, cytoskeletal organization, and local protein translation. In endothelial cells, enriched biological processes were predominantly associated with cytoskeletal remodeling, mechanosensory responses, regulation of vascular permeability, inflammatory signaling, and protein synthesis. In astrocytes, negatively weighted genes were enriched in pathways involving GPCR and cAMP signaling, cytoskeletal dynamics, synaptic organization, and cell–cell adhesion, whereas in microglia, enriched terms were mainly related to immune surveillance, cytokine responsiveness, chemotactic regulation, cytoskeletal remodeling, and synaptic protein complex regulation.
Spatial Correspondence Between R2SN Alterations in PACG and Neurotransmitter Systems
Spatial correspondence analysis revealed significant associations between PACG-related R2SN alterations and multiple neuromodulatory systems (Figure 6). Whole-brain spatial correlation analysis demonstrated that ten neurotransmitter receptor, transporter, or physiological density maps—including 5HT1A, 5HT2A, mGluR5, GABAA5, cerebral blood flow (CBF), DAT, SERT, NAT, VAChT, and D2—exhibited significant spatial associations with R2SN alteration maps, with both uncorrected and spin-test–adjusted p values below 0.05 (Figure 6A-J).
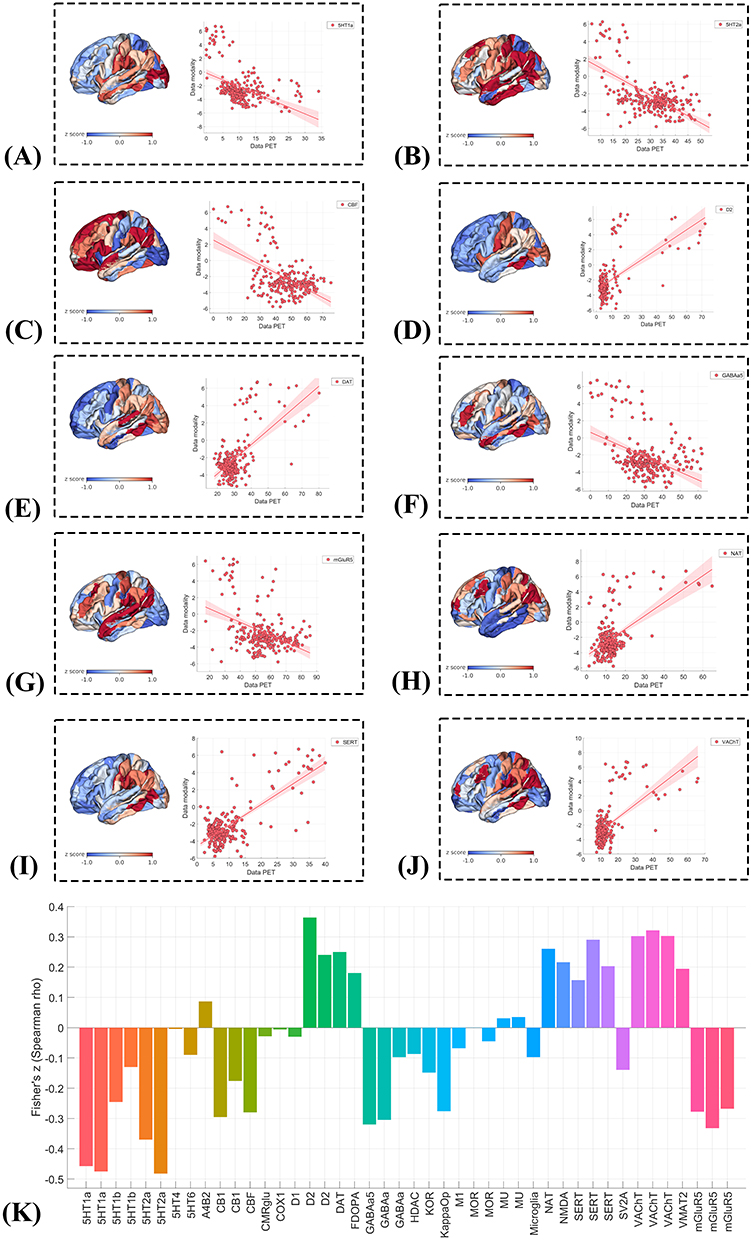 |
Figure 6 Spatial correspondence between PACG-related R2SN alterations and neurotransmitter receptor/transporter distributions. (A–J) Spatial correlations between regional PACG-related R2SN alteration maps and PET/SPECT-derived neurotransmitter receptor/transporter or physiological density maps: (A) 5-HT1A, (B) 5-HT2A, (C) cerebral blood flow (CBF), (D) D2, (E) dopamine transporter (DAT), (F) GABAA5, (G) mGluR5, (H) noradrenaline transporter (NAT), (I) serotonin transporter (SERT), and (J) vesicular acetylcholine transporter (VAChT). Each panel shows the spatial distribution of PACG-related R2SN alterations and the corresponding scatterplot with the PET/SPECT-derived map. (K) Fisher Z-transformed Spearman correlation coefficients summarizing the direction and magnitude of spatial associations across neurotransmitter receptor/transporter and physiological maps. |
Inspection of correlation directionality indicated a bidirectional pattern across neurotransmitter systems. Specifically, negative spatial correlations were observed for 5HT1A, 5HT2A, mGluR5, GABAA5, and CBF, indicating that brain regions with higher receptor or physiological density tended to show greater R2SN alterations. In contrast, positive spatial correlations were identified for DAT, SERT, NAT, VAChT, and D2, suggesting that regions enriched in these monoaminergic or cholinergic markers exhibited relatively attenuated R2SN alterations (Figure 6K). Together, these results demonstrate heterogeneous neurochemical associations with PACG-related R2SN alterations, highlighting distinct spatial relationships across neurotransmitter systems.
R2SN-Based Network Alterations and Epicenter Organization in PACG
Epicenter analysis revealed marked regional heterogeneity in the correspondence between normative R2SN connectivity profiles and PACG-related R2SN abnormalities across the whole brain (Figure 7A). Group-level statistical testing identified several regions exhibiting significant epicenter effects after false discovery rate (FDR) correction (q < 0.05; Figure 7B). Among these, the left middle frontal gyrus (MFG-L-77) showed the highest goodness-of-fit (GOF)–derived t value and was therefore identified as the top-ranked (top-1) structural-network epicenter (Figure 7C).
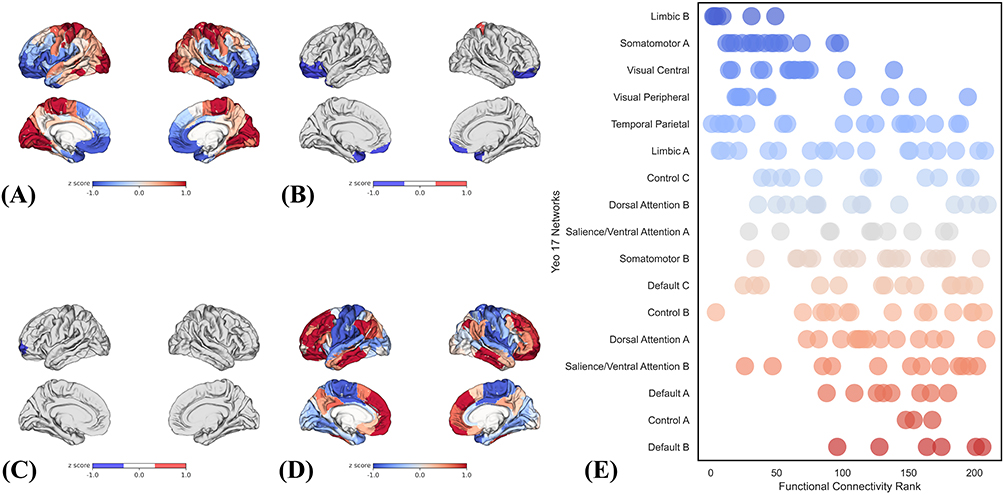 |
Figure 7 Epicenter distribution and association with signatures of brain structure. (A) Whole-brain distribution of epicenter goodness-of-fit (GOF) values.(B) Brain regions identified as significant epicenters.(C) The top-ranked structural-network epicenter.(D) Normative whole-brain functional connectivity pattern of the top-ranked epicenter.(E) Functional network affiliation of the R2SN-defined epicenter across the Yeo 17-network parcellation. |
Subsequent analyses examined the functional context of this epicenter. The normative whole-brain functional connectivity profile of MFG-L-77 demonstrated widespread connectivity with distributed cortical regions (Figure 7D). Projection of epicenter-related connectivity profiles onto the Yeo 17-network parcellation revealed a preferential embedding within higher-order association systems. The top five ranked networks were Default B, Control A, Default A, Salience/Attention B, and Dorsal Attention A, indicating that epicenter effects were predominantly concentrated within default mode, frontoparietal control, and attentional networks (Figure 7E).
Classification Performance Based on R2SN-Derived Brain Region Features
Using the ten brain-region features identified by SVM-RFE, five machine learning classifiers, including SVM, Random Forest, Logistic Regression, LightGBM, and XGBoost, were applied to evaluate the discriminative performance of R2SN-derived features for distinguishing PACG patients from healthy controls. All models were trained and evaluated within a nested cross-validation framework, and classification performance was assessed using accuracy, AUC, sensitivity, specificity, precision, and F1-score.
Overall, the selected R2SN-derived features showed moderate discriminative performance across classifiers. Logistic Regression achieved the highest AUC (0.78 ± 0.04), followed by LightGBM (0.76 ± 0.04), SVM (0.75 ± 0.04), XGBoost (0.75 ± 0.05), and Random Forest (0.73 ± 0.06). Classification accuracy ranged from 0.67 ± 0.07 to 0.73 ± 0.04 across the five models, with SVM and Logistic Regression showing the highest accuracy. Detailed performance metrics are summarized in Table 4.
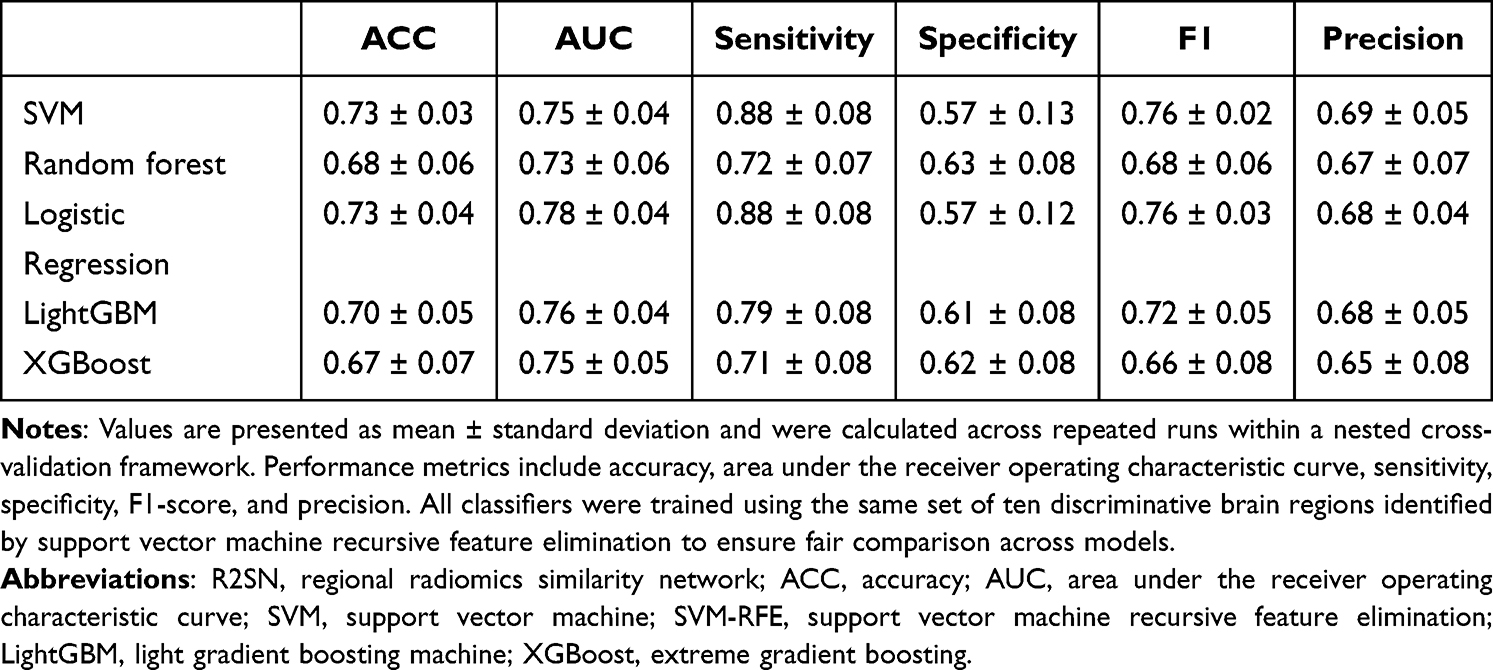 |
Table 4 Classification Performance of Machine Learning Models Based on R2SN-Derived Brain Region Features |
To further interpret the contribution of selected brain-region features to model predictions, SHAP-based analyses were performed for each classifier (Figure 8). Across the five models, SHAP decision plots, heatmaps, mean absolute SHAP value plots, and beeswarm plots were used to visualize both individual-level and global feature contributions. Regions within the orbital gyrus, superior frontal gyrus, middle frontal gyrus, inferior frontal gyrus, and precentral gyrus showed notable contributions across models, suggesting that frontal and orbitofrontal R2SN-derived features were important contributors to PACG classification.
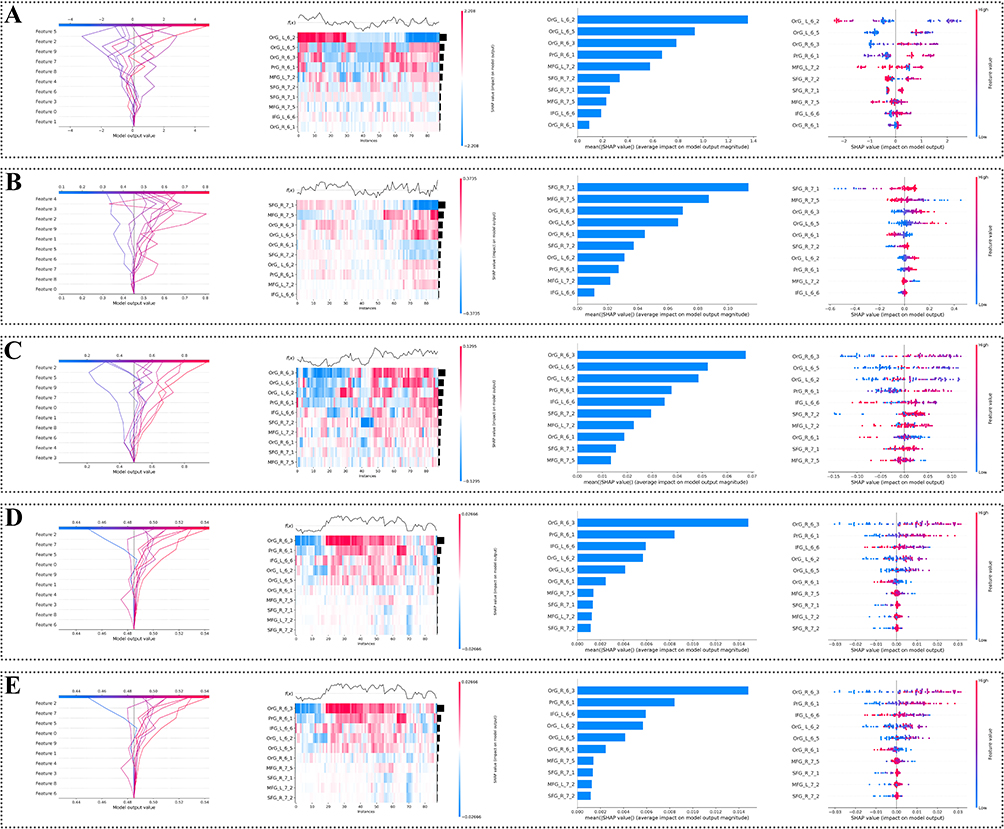 |
Figure 8 SHAP-based interpretation of machine learning models using R2SN-derived features. Five machine learning models were used to distinguish patients with PACG from healthy controls: (A) LightGBM, (B) Logistic Regression, (C) Random Forest, (D) Support Vector Machine, and (E) XGBoost. For each model, four SHAP-based visualizations are shown from left to right: decision plot, heatmap, mean absolute SHAP value plot, and beeswarm plot. These plots illustrate individual- and group-level feature contributions of selected R2SN-derived brain-region features to model prediction. |
Discussion
In this study, we characterized large-scale structural brain network alterations in PACG using individualized R2SN analysis. We identified widespread R2SN abnormalities across cortical and subcortical regions and further linked these alterations to functional systems, transcriptomic profiles, neurochemical architecture, epicenter organization, and machine learning classification. These findings suggest that PACG-related brain changes extend beyond conventional region-based morphometric abnormalities and provide a multiscale framework for understanding central nervous system involvement in PACG.
PACG has traditionally been associated with trans-synaptic degeneration along the visual pathway, and R2SN alterations within visual regions were also observed in the present study. However, our findings further revealed a broader pattern of structural network involvement extending from primary sensory systems to higher-order functional networks. When regional alterations were summarized within the Yeo 7-network framework, R2SN reductions were observed across multiple large-scale systems, suggesting widespread disruption of morphological coordination rather than changes confined to the visual system. Notably, the limbic network showed the most pronounced alteration, which may be related to affective symptoms and cognitive impairment reported in patients with glaucoma.65,66 Alterations within the default mode and attentional networks further suggest that PACG may affect higher-order systems involved in internal cognition, external sensory processing, and attentional control, consistent with previous glaucoma connectome studies.67–69
Alterations in the frontoparietal control network may reflect the involvement of top-down cognitive control systems in response to declining sensory input.70,71 Together, these findings suggest distributed structural network reorganization involving emotional, attentional, and cognitive control systems in PACG.
Epicenter analysis provided a network-level perspective on the spatial organization of PACG-related R2SN alterations.49–51Rather than identifying regions with the largest local abnormalities, this approach highlights regions whose normative structural similarity profiles best match the distributed pattern of disease-related changes. The left middle frontal gyrus (MFG-L-77) emerged as the top-ranked structural-network epicenter, with its connectivity profile preferentially embedded within default mode, attentional, and frontoparietal systems. Previous neuroimaging studies have reported visual and higher-order network abnormalities in PACG and other glaucoma subtypes,72 but the present findings further suggest that these distributed alterations may be organized around integrative control systems within the large-scale brain network.
Imaging–transcriptomic analysis revealed that PACG-related R2SN alterations were spatially associated with the dominant PLS1 transcriptional pattern. Positively weighted genes were mainly enriched in immune activation, inflammatory signaling, cytoskeletal remodeling, and cellular stress responses, whereas negatively weighted genes were enriched in synaptic organization, neurodevelopmental regulation, axon-related processes, and metabolic pathways. This pattern suggests that PACG-related structural network reorganization may be linked to a combination of immune-related activation and altered neuronal structural maintenance.73–76 Cell-type analysis further showed significant enrichment of negatively weighted genes in excitatory and inhibitory neurons, indicating that neuronal transcriptional programs may be closely related to the spatial organization of R2SN alterations. Although glial cell types did not show dominant enrichment, immune- and glia-related functional terms suggest that glial or immune-related processes may still play modulatory roles in PACG-related brain reorganization.75,77,78 Importantly, these findings should be interpreted as spatial correspondences with normative transcriptomic architecture rather than direct evidence of disease-induced gene expression changes in PACG.
Neurochemical mapping further showed that PACG-related R2SN spatial patterns were associated with the distribution of multiple neurotransmitter receptor/transporter systems and cerebral blood flow. Negative associations with mGluR5, GABAA5, serotonergic receptors, and CBF may reflect greater vulnerability of regions with high excitatory, inhibitory, serotonergic, or metabolic demands, consistent with the involvement of glutamatergic and neurochemical mechanisms in glaucoma-related neurodegeneration.79,80 In contrast, positive associations with dopaminergic and cholinergic markers may indicate relatively distinct neurochemical profiles of less affected regions. These findings suggest that PACG-related structural network alterations may be spatially constrained by intrinsic neurochemical architecture. However, as these analyses were based on normative PET/SPECT-derived maps, the results should be interpreted as neurochemical spatial associations rather than direct evidence of receptor-level alterations in PACG. These multiscale associations do not establish causal mechanisms, but they help identify biological axes along which PACG-related structural network alterations may be organized. This interpretation is particularly important because R2SN alterations reflect macroscale imaging phenotypes, whereas transcriptomic and neurochemical maps provide normative biological context. Therefore, the present findings should be viewed as hypothesis-generating evidence for future mechanistic studies.
Machine learning analyses indicated that R2SN-derived brain-region features contain discriminative information for distinguishing patients with PACG from healthy controls, supporting their potential clinical relevance for characterizing central brain involvement in PACG. By capturing interregional structural relationships rather than isolated regional properties, R2SN may reflect distributed network alterations not fully represented by conventional morphometric measures. The notable contribution of orbital and frontal cortical regions further suggests that higher-order association areas may be involved in PACG-related central reorganization.
Taken together, these findings suggest that PACG-related brain alterations reflect coordinated structural network reorganization beyond the visual pathway. By integrating network-level, molecular, cellular, neurochemical, epicenter, and machine learning analyses, this study provides a multiscale framework for understanding central nervous system involvement in PACG.
Limitations and Future Directions
Several limitations should be acknowledged. First, the relatively modest sample size may limit statistical power and the generalizability of the findings. Although we applied appropriate statistical controls, including multiple-comparison correction, spatial permutation testing, and nested cross-validation for machine learning, larger independent cohorts are needed to validate the robustness and reproducibility of PACG-related R2SN alterations and classification performance. Second, the cross-sectional design limits causal inference. Longitudinal studies will be necessary to determine whether R2SN changes precede, accompany, or follow clinical visual impairment, and to clarify their temporal relationship with disease progression and intervention- or exposure-related factors. Such longitudinal designs have been increasingly used in ophthalmic research to evaluate temporal associations between environmental or clinical factors and visual outcomes.81 Third, although the PACG and HC groups were matched for age, sex, handedness, and BMI, potential confounders related to clinical heterogeneity within the PACG group, such as disease duration, IOP fluctuation, severity of visual field defects, retinal structural damage, and systemic vascular, metabolic, or inflammatory factors, were not fully modeled. Future studies with more comprehensive clinical phenotyping are needed to determine how these factors influence R2SN alterations. Fourth, although the AHBA provides a valuable normative framework for imaging–transcriptomic analysis, it is based on postmortem tissue from six neurologically healthy adult donors rather than glaucoma-specific samples. Therefore, the observed imaging–transcriptomic associations should be interpreted as spatial correspondences with normative molecular architecture rather than direct evidence of disease-induced gene expression changes in PACG. Future studies integrating patient-specific transcriptomic, proteomic, or postmortem glaucoma brain data are needed to validate and extend these findings. Finally, the present study lacked an independent external validation cohort. Although internal validation procedures were used, multicenter studies with larger sample sizes, harmonized imaging protocols, and external validation datasets are required to assess the reproducibility, generalizability, and translational value of PACG-related R2SN features.
Conclusion
In conclusion, this study demonstrates that PACG is associated with widespread disruption of brain morphological similarity networks extending beyond the visual pathway. By integrating individualized R2SN analysis with transcriptomic, cell-type, neurochemical, epicenter, and machine learning approaches, we provide exploratory multiscale evidence that PACG-related brain alterations may reflect coordinated network-level vulnerability rather than isolated regional damage. Together with molecular and neurochemical spatial associations involving synaptic, cytoskeletal, and immune-related processes, these findings support a systems-level reorganization of the central nervous system in PACG and highlight R2SN-derived network features as a promising imaging approach for characterizing brain involvement in glaucoma.
Funding
This research did not receive any specific grant from funding agencies in the public, commercial, or not-for-profit sectors.
Disclosure
The authors declare that they have no conflicts of interest in this work.
References
1. Tham YC, Li X, Wong TY, Quigley HA, Aung T, Cheng CY. Global prevalence of glaucoma and projections of glaucoma burden through 2040: a systematic review and meta-analysis. Ophthalmology. 2014;121(11):2081–23. doi:10.1016/j.ophtha.2014.05.013
2. Quigley HA, Broman AT. The number of people with glaucoma worldwide in 2010 and 2020. Br J Ophthalmol. 2006;90(3):262–267. doi:10.1136/bjo.2005.081224
3. Vision Loss Expert Group of the Global Burden of Disease Study; GBD 2019 Blindness and Vision Impairment Collaborators. Global estimates on the number of people blind or visually impaired by glaucoma: a meta-analysis from 2000 to 2020. Eye. 2024;38(11):2036–2046.
4. Shan S, Wu J, Cao J, et al. Global incidence and risk factors for glaucoma: a systematic review and meta-analysis of prospective studies. J Glob Health. 2024;14:04252. doi:10.7189/jogh.14.04252
5. Gedde SJ, Vinod K, Wright MM, et al. American academy of ophthalmology preferred practice pattern glaucoma panel. primary open-angle glaucoma preferred practice pattern®. Ophthalmology. 2021;128(1):P71–P150.
6. Heijl A, Leske MC, Bengtsson B, Hyman L, Bengtsson B, Hussein M. Reduction of intraocular pressure and glaucoma progression: results from the Early Manifest Glaucoma Trial. Arch Ophthalmol. 2002;120(10):1268–1279.
7. Nishida T, Moghimi S, Chang AC, et al. Association of intraocular pressure with retinal nerve fiber layer thinning in patients with glaucoma. JAMA Ophthalmol. 2022;140(12):1209–1216. doi:10.1001/jamaophthalmol.2022.4462
8. Flammer J, Orgül S, Costa VP, et al. The impact of ocular blood flow in glaucoma. Prog Retin Eye Res. 2002;21(4):359–393.
9. Wang D, Gao X, Peng Y, et al. Integrated single-cell RNA and ATAC sequencing of B-cell lymphoma-3(Bcl3) and endothelin-2(Edn2) proteins as targets to prevent glaucoma progression. Int J Biol Macromol. 2025;319(Pt 2):145455. doi:10.1016/j.ijbiomac.2025.145455
10. Osborne NN, Casson RJ, Wood JP, Chidlow G, Graham M, Melena J. Retinal ischemia: mechanisms of damage and potential therapeutic strategies. Prog Retin Eye Res. 2004;23(1):91–147. doi:10.1016/j.preteyeres.2003.12.001
11. He M, Wang J, Zhang J, et al. Impact of acute ocular hypertension on retinal ganglion cell loss in mice. Transl Vis Sci Technol. 2024;13(2):15.
12. Quigley HA, Addicks EM, Green WR. Optic nerve damage in human glaucoma. II. The site of injury and susceptibility to damage. Arch Ophthalmol. 1981;99(4):635–649. doi:10.1001/archopht.1981.03930010635009
13. Spaeth GL. European glaucoma society terminology and guidelines for glaucoma, 5th edition. Br J Ophthalmol. 2021;105(1):1–169. doi: 10.1136/bjophthalmol-2021-egsguidelines
14. Gupta N, Greenberg G, de Tilly LN, Gray B, Polemidiotis M, Yücel YH. Atrophy of the lateral geniculate nucleus in human glaucoma detected by magnetic resonance imaging. Br J Ophthalmol. 2009;93(1):56–60. doi:10.1136/bjo.2008.138172
15. Ang LP, Aung T, Chua WH, Yip LW, Chew PT. Visual field loss from primary angle-closure glaucoma: a comparative study of symptomatic and asymptomatic disease. Ophthalmology. 2004;111(9):1636–1640. doi:10.1016/j.ophtha.2004.01.032
16. Chen W, Zhang L, Xu YG, Zhu K, Luo M. Primary angle-closure glaucomas disturb regional spontaneous brain activity in the visual pathway: an fMRI study. Neuropsychiatr Dis Treat. 2017;13:1409–1417. doi:10.2147/NDT.S134258
17. Huang X, Zhong YL, Zeng XJ, et al. Disturbed spontaneous brain activity pattern in patients with primary angle-closure glaucoma using amplitude of low-frequency fluctuation: a fMRI study. Neuropsychiatr Dis Treat. 2015;11:1877–1883. doi:10.2147/NDT.S87596
18. Jiang F, Yu C, Zuo MJ, et al. Frequency-dependent neural activity in primary angle-closure glaucoma. Neuropsychiatr Dis Treat. 2019;15:271–282. doi:10.2147/NDT.S187367
19. Gupta N, Yücel YH. Glaucoma as a neurodegenerative disease. Curr Opin Ophthalmol. 2007;18(2):110–114. doi:10.1097/ICU.0b013e3280895aea
20. Guidoboni G, Sacco R, Szopos M, et al. Neurodegenerative disorders of the eye and of the brain: a perspective on their fluid-dynamical connections and the potential of mechanism-driven modeling. Front Neurosci. 2020;14:566428. doi:10.3389/fnins.2020.566428
21. Shu L, Chen X, Sun X. Glaucoma and brain functional networks: a bidirectional Mendelian randomisation study. BMJ Open Ophthalmol. 2025;10(1):e001902. doi:10.1136/bmjophth-2024-001902
22. Bullmore E, Sporns O. Complex brain networks: graph theoretical analysis of structural and functional systems. Nat Rev Neurosci. 2009;10(3):186–198. doi:10.1038/nrn2575
23. Bassett DS, Sporns O. Network neuroscience. Nat Neurosci. 2017;20(3):353–364. doi:10.1038/nn.4502
24. Park HJ, Friston K. Structural and functional brain networks: from connections to cognition. Science. 2013;342(6158):1238411. doi:10.1126/science.1238411
25. Sporns O, Tononi G, Kötter R. The human connectome: a structural description of the human brain. PLoS Comput Biol. 2005;1(4):e42. doi:10.1371/journal.pcbi.0010042
26. Bressler SL, Menon V. Large-scale brain networks in cognition: emerging methods and principles. Trends Cognit Sci. 2010;14(6):277–290. doi:10.1016/j.tics.2010.04.004
27. Mesulam MM. From sensation to cognition. Brain. 1998;121(Pt 6):1013–1052. doi:10.1093/brain/121.6.1013
28. Van Essen DC, Smith SM, Barch DM, et al. The WU-Minn human connectome project: an overview. Neuroimage. 2013;80:62–79. doi:10.1016/j.neuroimage.2013.05.041
29. Finn ES, Shen X, Scheinost D, et al. Functional connectome fingerprinting: identifying individuals using patterns of brain connectivity. Nat Neurosci. 2015;18(11):1664–1671. doi:10.1038/nn.4135
30. Glasser MF, Coalson TS, Robinson EC, et al. A multi-modal parcellation of human cerebral cortex. Nature. 2016;536(7615):171–178. doi:10.1038/nature18933
31. Gong G, He Y, Concha L, et al. Mapping anatomical connectivity patterns of human cerebral cortex using in vivo diffusion tensor imaging tractography. Cereb Cortex. 2009;19(3):524–536. doi:10.1093/cercor/bhn102
32. Cai F, Gao L, Gong H, et al. Network centrality of resting-state fMRI in primary angle-closure glaucoma before and after surgery. PLoS One. 2015;10(10):e0141389. doi:10.1371/journal.pone.0141389
33. Wang Y, Zhang X, Li S, et al. Abnormal topological properties and functional-structural coupling of large-scale brain networks in primary angle-closure glaucoma. Quant Imaging Med Surg. 2025;15(7):6053–6067. doi:10.21037/qims-24-1947
34. Liu D, Lv H, Wang Z, et al. Brain functional network analysis of patients with primary angle-closure glaucoma. Comput Math Methods Med. 2022;2022:2731007.
35. Zhao K, Zheng Q, Che T, et al. Regional radiomics similarity networks (R2SNs) in the human brain: reproducibility, small-world properties and a biological basis. Netw Neurosci. 2021;5(3):783–797. doi:10.1162/netn_a_00200
36. Kassner A, Thornhill RE. Texture analysis: a review of neurologic MR imaging applications. AJNR Am J Neuroradiol. 2010;31(5):809–816. doi:10.3174/ajnr.A2061
37. Ghalati MK, Nunes A, Ferreira H, Serranho P, Bernardes R. Texture analysis and its applications in biomedical imaging: a survey.
38. Xie N, Fan X, Chen D, et al. Peritumoral and intratumoral texture features based on multiparametric MRI and multiple machine learning methods to preoperatively evaluate the pathological outcomes of pancreatic cancer. J Magn Reson Imaging. 2023;58(2):379–391. doi:10.1002/jmri.28538
39. Fan H, Luo Y, Gu F, et al. Artificial intelligence-based MRI radiomics and radiogenomics in glioma. Cancer Imaging. 2024;24(1):36. doi:10.1186/s40644-024-00682-y
40. Zhao K, Wang D, Wang D, et al. Macroscale connectome topographical structure reveals the biomechanisms of brain dysfunction in Alzheimer’s disease. Sci Adv. 2024;10(41):eado8837. doi:10.1126/sciadv.ado8837
41. Zhao K, Zheng Q, Dyrba M, et al. Regional radiomics similarity networks reveal distinct subtypes and abnormality patterns in mild cognitive impairment. Adv Sci. 2022;9(12):e2104538. doi:10.1002/advs.202104538
42. Chu L, Zeng D, He Y, et al. Segregation of the regional radiomics similarity network exhibited an increase from late childhood to early adolescence: a developmental investigation. Neuroimage. 2024;302:120893. doi:10.1016/j.neuroimage.2024.120893
43. Khor CC, Do T, Jia H, et al. Genome-wide association study identifies five new susceptibility loci for primary angle closure glaucoma. Nat Genet. 2016;48(5):556–562. doi:10.1038/ng.3540
44. Gharahkhani P, Jorgenson E, Hysi P, et al. Genome-wide meta-analysis identifies 127 open-angle glaucoma loci with consistent effect across ancestries. Nat Genet. 2021;53(3):306–316.
45. Li XT, Chen L, Wang XM, Zheng CC, Huang X. Differences in cerebral spontaneous neural activity correlate with gene-specific transcriptional signatures in primary angle-closure glaucoma. Neuroscience. 2025;565:399–419. doi:10.1016/j.neuroscience.2024.12.012
46. Hansen JY, Shafiei G, Markello RD, et al. Mapping neurotransmitter systems to the structural and functional organization of the human neocortex. Nat Neurosci. 2022;25(11):1569–1581. doi:10.1038/s41593-022-01186-3
47. Shine JM, Aburn MJ, Breakspear M, Poldrack RA. The modulation of neural gain facilitates a transition between functional segregation and integration in the brain. Elife. 2018;7:e31130. doi:10.7554/eLife.31130
48. Van den Heuvel MP, Sporns O. Network hubs in the human brain. Trends Cognit Sci. 2013;17(12):683–696. doi:10.1016/j.tics.2013.09.012
49. Zhou J, Gennatas ED, Kramer JH, Miller BL, Seeley WW. Predicting regional neurodegeneration from the healthy brain functional connectome. Neuron. 2012;73(6):1216–1227. doi:10.1016/j.neuron.2012.03.004
50. Duanmu X, Zhu Z, Wen J, et al. MRI Epicenters differentiate spatiotemporal patterns of neurodegeneration in parkinson’s disease. Adv Sci. 2025;12(45):e11289. doi:10.1002/advs.202511289
51. Jiang Y, Palaniyappan L, Luo C, et al. Neuroimaging epicenters as potential sites of onset of the neuroanatomical pathology in schizophrenia. Sci Adv. 2024;10(24):eadk6063. doi:10.1126/sciadv.adk6063
52. Arbabshirani MR, Plis S, Sui J, Calhoun VD. Single subject prediction of brain disorders in neuroimaging: promises and pitfalls. Neuroimage. 2017;145(Pt B):137–165. doi:10.1016/j.neuroimage.2016.02.079
53. Bzdok D, Altman N, Krzywinski M. Statistics versus machine learning. Nat Methods. 2018;15(4):233–234. doi:10.1038/nmeth.4642
54. Davatzikos C. Machine learning in neuroimaging: progress and challenges. Neuroimage. 2019;197:652–656. doi:10.1016/j.neuroimage.2018.10.003
55. Fan L, Li H, Zhuo J, et al. The human brainnetome atlas: a new brain atlas based on connectional architecture. Cereb. Cortex. 2016;26:3508–3526. doi:10.1093/cercor/bhw157
56. Aerts HJWL, Velazquez ER, Leijenaar RTH, et al. Decoding tumour phenotype by noninvasive imaging using a quantitative radiomics approach. Nat Commun. 2014;5:4006. doi:10.1038/ncomms5006
57. Yeo BT, Krienen FM, Sepulcre J, et al. The organization of the human cerebral cortex estimated by intrinsic functional connectivity. J Neurophysiol. 2011;106(3):1125–1165. doi:10.1152/jn.00338.2011
58. Hawrylycz MJ, Lein ES, Guillozet-Bongaarts AL, et al. An anatomically comprehensive atlas of the adult human brain transcriptome. Nature. 2012;489(7416):391–399. doi:10.1038/nature11405
59. Arnatkeviciute A, Fulcher BD, Fornito A. A practical guide to linking brainwide gene expression and neuroimaging data. Neuroimage. 2019;189:353–367. doi:10.1016/j.neuroimage.2019.01.011
60. Kanehisa M, Goto S. KEGG: kyoto encyclopedia of genes and genomes. Nucleic Acids Res. 2000;28(1):27–30. doi:10.1093/nar/28.1.27
61. Dukart J, Holiga S, Rullmann M, et al. JuSpace: a tool for spatial correlation analyses of magnetic resonance imaging data with nuclear imaging derived neurotransmitter maps. Hum Brain Mapp. 2021;42(3):555–566. doi:10.1002/hbm.25244
62. Bi S, Chen Z, Li Y, et al. Glucose metabolism alterations and Aβ deposition in AD and FTD are related to the distribution of neurotransmitter systems. Eur J Nucl Med Mol Imaging. 2026;53(2):1169–1182. doi:10.1007/s00259-025-07485-8
63. Zhu W, Liu F, Fu J, et al. Genes associated with spontaneous brain activity changes in clinically different patients with major depressive disorder: a transcription-neuroimaging association study. CNS Neurosci Ther. 2023;29(12):3913–3924. doi:10.1111/cns.14311
64. Varma S, Simon R. Bias in error estimation when using cross-validation for model selection. BMC Bioinf. 2006;7:91. doi:10.1186/1471-2105-7-91
65. Yin J, Li H, Guo N. Prevalence of depression and anxiety disorders in patients with glaucoma: a systematic review and meta-analysis based on cross-sectional surveys. Actas Esp Psiquiatr. 2024;52(3):325–333. doi:10.62641/aep.v52i3.1561
66. Wang X, Chen W, Zhao W, Miao M. Risk of glaucoma to subsequent dementia or cognitive impairment: a systematic review and meta-analysis. Aging Clin Exp Res. 2024;36(1):172. doi:10.1007/s40520-024-02811-w
67. Buckner RL, Andrews-Hanna JR, Schacter DL. The brain’s default network: anatomy, function, and relevance to disease. Ann N Y Acad Sci. 2008;1124(1):1–38. doi:10.1196/annals.1440.011
68. Buckner RL, Snyder AZ, Shannon BJ, et al. Molecular, structural, and functional characterization of Alzheimer’s disease: evidence for a relationship between default activity, amyloid, and memory. J Neurosci. 2005;25(34):7709–7717. doi:10.1523/JNEUROSCI.2177-05.2005
69. Li D, Zhou H, Chen J, et al. Altered dynamic functional network connectivity in primary angle-closure glaucoma. Front Neurosci. 2023;17:1189452.
70. Cole MW, Repovš G, Anticevic A. The frontoparietal control system: a central role in mental health. Neuroscientist. 2014;20(6):652–664. doi:10.1177/1073858414525995
71. Vincent JL, Kahn I, Snyder AZ, Raichle ME, Buckner RL. Evidence for a frontoparietal control system revealed by intrinsic functional connectivity. J Neurophysiol. 2008;100(6):3328–3342. doi:10.1152/jn.90355.2008
72. Wang Y, Shu Y, Cai G, et al. Altered static and dynamic functional network connectivity in primary angle-closure glaucoma patients. Sci Rep. 2024;14:11682. doi:10.1038/s41598-024-62635-6
73. Zeppieri M, Visalli F, Musa M, et al. Beyond the eye: glaucoma and the brain. Brain Sci. 2025;15(9):934. doi:10.3390/brainsci15090934
74. Hoppe C, Gregory-Ksander M. The role of complement dysregulation in glaucoma. Int J Mol Sci. 2024;25(4):2307. doi:10.3390/ijms25042307
75. Ishikawa M, Izumi Y, Sato K, et al. Glaucoma and microglia-induced neuroinflammation. Front Ophthalmol. 2023;3:1132011. doi:10.3389/fopht.2023.1132011
76. Calkins DJ. Adaptive responses to neurodegenerative stress in glaucoma. Prog Retin Eye Res. 2021;84:100953. doi:10.1016/j.preteyeres.2021.100953
77. Ramirez AI, de Hoz R, Salobrar-Garcia E, et al. The role of microglia in retinal neurodegeneration: Alzheimer’s disease, Parkinson, and glaucoma. Front Aging Neurosci. 2017;9:214.
78. Tezel G. The immune response in glaucoma: a perspective on the role of oxidative stress. Exp Eye Res. 2011;93(2):178–186.
79. Almasieh M, Wilson AM, Morquette B, Cueva Vargas JL, Di Polo A. The molecular basis of retinal ganglion cell death in glaucoma. Prog Retin Eye Res. 2012;31(2):152–181.
80. Saxena S, Caroni P. Selective neuronal vulnerability in neurodegenerative diseases: from stressor thresholds to degeneration. Neuron. 2011;71(1):35–48.
81. Wang D, Pu Y, Zhu H, et al. Sunlight’s hidden hazard: unveiling the link between solar radiation and suspected presbyopia risk. Cutan Ocul Toxicol. 2026:1–15. doi:10.1080/15569527.2026.2626685
 © 2026 The Author(s). This work is published and licensed by Dove Medical Press Limited. The
full terms of this license are available at https://www.dovepress.com/terms
and incorporate the Creative Commons Attribution
- Non Commercial (unported, 4.0) License.
By accessing the work you hereby accept the Terms. Non-commercial uses of the work are permitted
without any further permission from Dove Medical Press Limited, provided the work is properly
attributed. For permission for commercial use of this work, please see paragraphs 4.2 and 5 of our Terms.
© 2026 The Author(s). This work is published and licensed by Dove Medical Press Limited. The
full terms of this license are available at https://www.dovepress.com/terms
and incorporate the Creative Commons Attribution
- Non Commercial (unported, 4.0) License.
By accessing the work you hereby accept the Terms. Non-commercial uses of the work are permitted
without any further permission from Dove Medical Press Limited, provided the work is properly
attributed. For permission for commercial use of this work, please see paragraphs 4.2 and 5 of our Terms.