Back to Journals » International Journal of Nanomedicine » Volume 11
Manganese dioxide nanosheets-based redox/pH-responsive drug delivery system for cancer theranostic application
Authors Hao Y, Wang L, Zhang B, Li D, Meng D, Shi J, Zhang H, Zhang Z, Zhang Y
Received 21 October 2015
Accepted for publication 27 January 2016
Published 29 April 2016 Volume 2016:11 Pages 1759—1778
DOI https://doi.org/10.2147/IJN.S98832
Checked for plagiarism Yes
Review by Single anonymous peer review
Peer reviewer comments 2
Editor who approved publication: Professor Lei Yang
Yongwei Hao,1,* Lei Wang,1,2,* Bingxiang Zhang,1 Dong Li,1 Dehui Meng,1 Jinjin Shi,1 Hongling Zhang,1 Zhenzhong Zhang,1 Yun Zhang1
1School of Pharmaceutical Sciences, 2School of Chemistry and Molecular Engineering, Zhengzhou University, Zhengzhou, People’s Republic of China
*These authors contributed equally to this work
Abstract: The aim of this study was to construct redox- and pH-responsive degradable manganese dioxide (MnO2) nanosheets for cancer theranostic application. The small MnO2 nanosheets were synthesized, and then functionalized by hyaluronic acid (HA), demonstrating excellent stability and tumor-targeting ability. Cisplatin (cis-diamminedichloroplatinum [CDDP]) was absorbed by the nanosheets through a physical action, which was designed as MnO2/HA/CDDP. The prepared MnO2/HA/CDDP formulation was able to efficiently deliver CDDP to tumor cells in vitro and in vivo, resulting in improved therapeutic efficiency. Subsequently, they were triggered by lower pH and higher level of reduced glutathione to generate Mn2+, enabling magnetic resonance imaging. The smart multifunctional system combining efficient magnetic resonance imaging and chemotherapy has the potential to be used as a tumor-targeting theranostic nanomedicine.
Keywords: manganese dioxide nanosheets, hyaluronic acid, magnetic resonance imaging, theranostic application
Introduction
In recent years, the multifunctional nanomaterials have been widely investigated for cancer treatment and diagnosis.1 The traditional definition of theranostic means that therapeutic and diagnostic agents are in the same formulation.2 Although multiple functions could be achieved simultaneously, it is very challenging to design and efficiently load therapeutic and imaging agents into a single carrier due to the inconstant hydrophobic/hydrophilic properties and complicated drug–drug interactions. Moreover, both agents should be compatible with the formulation process. Therefore, nanoscale materials with therapeutic function or imaging potential as well as the ability to deliver another therapeutic/imaging agent hold great promise for combined therapy or theranostic application in cancer treatment and diagnosis.
Magnetic resonance imaging (MRI), an important imaging approach in clinic, could offer images with abundant anatomical information relying on soft-tissue contrast and functional details.3 Currently, MRI contrast agents are mainly paramagnetic complexes or magnetic nanoparticles. Nevertheless, the use of paramagnetic chelates for T1-weighted MRI is greatly limited due to its toxicity.4 Therefore, creating enhanced MRI at the desired site may be a strategy.
As it is well known, tumor tissue exhibited special features in comparison to the normal tissue. For one thing, endosome has an acidic environment, in which the pH value ranges from 4.5 to 5.0.5 For another, reduced glutathione (GSH) in cytoplasm was elevated to 2–10 mM.6,7 Consequently, a tumor-microenvironment-responsive nanoparticle, especially well-designed pH/redox-sensitive ones for therapy or diagnosis, is a new direction for constructing smart drug delivery systems, in which chemotherapeutics or diagnostic agents could be selectively delivered to the tumor site instead of normal tissues, resulting in less side effect induced by administered agents. The sheets-like nanomaterial MnO2 is one kind of inorganic material, which is currently under extensive investigation for its capacitance properties.4 Recently, its use for drug delivery system is reported for its relatively high drug-loading capacity and stimuli-responsive MRI property. Chen et al8 found that the MnO2 nanosheets with an average lateral size of ~200 nm are superior nanocarriers for loading doxorubicin. Fan et al9 suggested that DNAzyme could be efficiently transferred into cells by MnO2 nanosheets. Besides, MnO2 materials have potential MRI ability triggered by the tumor microenvironment.10–12 The manganese ions in MnO2 nanosheets are spatially shielded from water molecules because of their strong coordination with oxygen atoms. Therefore, they are unable to promote the spin–lattice or spin–spin relaxation of protons.13 However, when they met the tumor redox/acid microenvironment, Mn2+ could be released smartly, which is a high T1-weighted contrast agent.14,15 Although the functions of them are understood partially, it is a practical requirement to address the problem that the MnO2 nanosheets are inclined to aggregate in physiological environment. In this regard, the exploitation of favorable tumor-targeted MnO2-based theranostic systems with excellent stability in physiological condition may be promising.
Cisplatin (cis-diamminedichloroplatinum [CDDP]) is a well-known chemotherapeutic agent, which is recommended as the medication for non-small-cell lung cancer due to its strong anticancer effects as well as synergism with other anticancer agents.16,17 Despite the great success in treating non-small-cell lung cancer, cisplatin has severe renal toxicity. Previous studies reported that the cisplatin-loaded liposome showed enhanced in vivo anticancer efficiency without a significant loss of body weight of mice.18 Therefore, to develop MnO2 nanosheets loaded with CDDP for cancer theranostic application is an interesting field to explore. For this purpose, we believe that surface modification of MnO2 nanosheets with tumor-targeting groups should make them to be enriched in tumor region. Particularly, the overexpression of the hyaluronic acid (HA) receptors CD44 and CD168 (receptor of hyaluronic acid mediated motility) on a series of tumors opens our mind for tumor targeting.19,20
In this study, the MnO2 nanosheets were first synthesized and functionalized by HA, and then CDDP was absorbed onto them through a physical interaction (Figure 1A). As shown in Figure 1B, the drug-controlled release could be achieved with tumor-microenvironment-responsive degradation of MnO2 nanosheets. Meanwhile, the released manganese ions could be applied to MRI. Herein, a tumor-targeted theranostic delivery system was developed and characterized by transmission electron microscopy (TEM), dynamic laser scattering, in vitro release profiles, and MRI in reductive and weak-acid environment, respectively. The antitumor therapy was investigated in A549 cells and tumor-bearing mice model. Moreover, the in vivo MRI of tumor-bearing mice by using MnO2/HA/CDDP was also evaluated. Therefore, the MnO2/HA/CDDP nanosheets developed in this study may be a promising multifunctional nanoplatform for targeted cancer MRI and therapeutic application (Figure 1C).
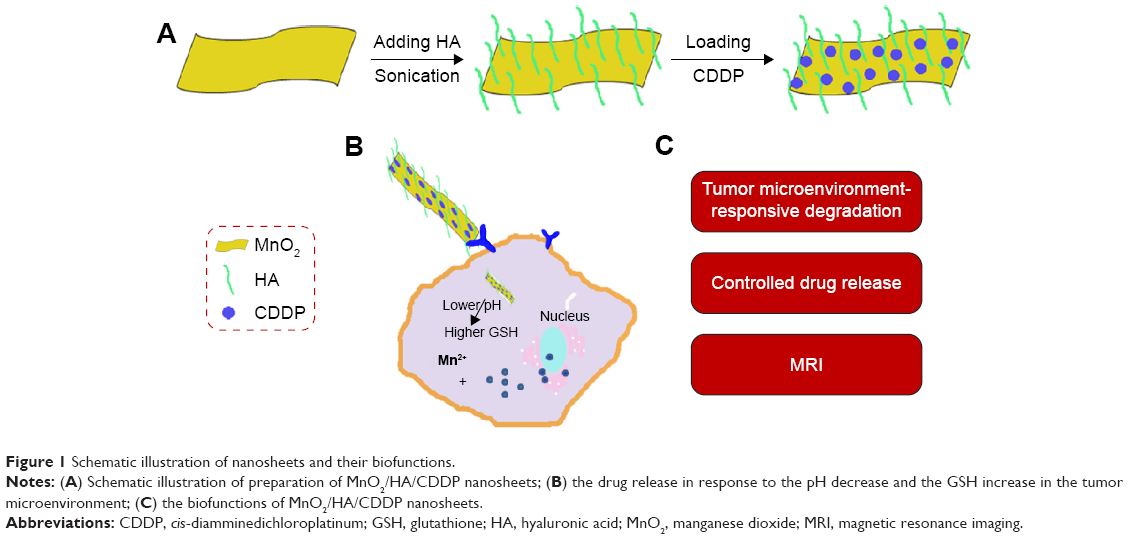 | Figure 1 Schematic illustration of nanosheets and their biofunctions. |
Materials and methods
Materials
Manganese chloride tetrahydrate (MnCl2·4H2O) was obtained from Sigma-Aldrich Co. (St Louis, MO, USA). Tetramethylammonium hydroxide (50 wt%) was obtained from Xiya Reagent Research Center (Shandong, People’s Republic of China). CDDP was produced by Hubei Shengtian Hengchuang Biotech. Co., Ltd. (Changsha, People’s Republic of China). Reduced GSH (purity >98%) was purchased from Genview Co., Ltd. (Beijing, People’s Republic of China). HA (10 kDa) was obtained from Huaxi Freda Biomedical Inc. (Jinan, People’s Republic of China). Thirty percent (w/v) hydrogen peroxide (H2O2) and other analytical reagents were produced by Ruijinte Chemical Reagent Co., Ltd. (Tianjin, People’s Republic of China). Cell culture plates were purchased from Corning Costar Co. (Corning, NY, USA). Water was prepared by a Milli-Q Water Purification System (EMD Millipore, Billerica, MA, USA). Experimental mice and rats were supplied by the Henan Laboratory Animal Center (Zhengzhou, People’s Republic of China). The Ethical Committee of Zhengzhou University approved all animal experiments in this study. All animals were cared for according to the protocols established by the ethics committee.
Synthesis of MnO2 nanosheets
The manganese dioxide (MnO2) nanosheets were synthesized as reported by a prior research with slight changes.21 First, a solution containing 0.6 M tetramethylammonium hydroxide and 3% H2O2 (w/v) was mixed. Then, 0.3 M manganese chloride was added to the aforementioned solution immediately (1:2, v/v). The color of the solution changed into dark brown after mixing both solutions, indicating that Mn2+ was oxidized to Mn4+. The reaction was subjected to agitating vigorously at 25°C for 1 day. The obtained dark brown suspension was concentrated by centrifugation at 15,000× g for 10 minutes. After discarding the supernatant, the pellet was rinsed with ultrapure water for several times. Following the washing with methanol for three times, the bulk MnO2 was put into an oven for dryness at 60°C and grinded for future use. For preparing the MnO2 nanosheets, MnO2 was added to water with a concentration of 2 mg/mL, followed by overnight ultrasonic processing. Then, the solution was centrifuged (2,500× g, 10 minutes). The suspension was further centrifuged at 15,000× g for 10 minutes to obtain the pellet.
Zeta potential of the nanosheets was measured by the Zetasizer Nano ZS-90 (Malvern Instruments, Malvern, UK). The morphologies of nanosheets were imaged by employing a TEM (Tecnai G20; FEI Company, Hillsboro, OR, USA). The energy-dispersive X-ray spectroscopy (EDS) was also recorded to determine the elements of the nanomaterial. X-ray diffraction measurements were performed by using a Bruker D8 Advance Instrument (Bruker Optik GmbH, Ettlingen, Germany). X-ray photoelectron spectroscopy (XPS) analysis of the MnO2 samples were performed by using the multifunctional imaging electron spectrometer (Thermo ESCALAB 250XI; Thermo Fisher Scientific, Waltham, MA, USA). XPS data were curve fitted with a Gaussian/Lorentzian mixed function after subtracting Shirley background by adopting the XPSPEAK 4.0 software developed by Raymund WM Kwok (University of Hong Kong, Hong Kong, People’s Republic of China).
Preparation of MnO2/HA nanosheets and characterization
Mostly, 2.5 mL of phosphate-buffered saline (PBS) was added with 5 mg HA powder and 5 mg MnO2. This solution was then sonicated at room temperature for 0.5 hour, and then ultrasonicated with an Ultrasonic Cell Disruption System (Ningbo Scientz Biotechnology Co., Ltd., Zhejiang, People’s Republic of China) for 5 minutes (200 W, work 6 seconds, rest 3 seconds), followed by sonication for >12 hours at room temperature. The nanosuspension was centrifuged (1,800× g, 5 minutes) to remove the big and small particles. Finally, the suspension was centrifuged at 15,000× g for 30 minutes. The collected pellet was dispersed in PBS for future use.
The MnO2, HA, and MnO2/HA samples crushed into the KBr pellets were scanned by a Fourier-transform infrared (FTIR) apparatus (Nicolet IS10 Spectrometer; Thermo Fisher Scientific) with a range of 400–4,000 cm−1, respectively. Thermogravimetric analysis was performed by a Shimadzu instrument “Thermogravimetric Analyzer” (Shimadzu, Kyoto, Japan). The temperature was increased by 10°C/min. The temperature range was set from 25°C to 600°C under atmospheric condition.
Preparation of MnO2/HA/CDDP nanosheets and characterization
CDDP (2.5 mg) was dissolved in the solution of HA/MnO2 nanosheets, followed by sonication for 4 hours in the dark. The product was dispersed in 1 mL of PBS following centrifugation in order to remove the free CDDP. The obtained MnO2/HA/CDDP nanosheets were put in the dark at 4°C for future use.
The morphologies of nanosheets were obtained by TEM (Tecnai G20; FEI Company). The existing elements in the nanosheets were demonstrated by the corresponding EDS. Zetasizer Nano ZS-90 (Malvern Instruments) was exploited for determining the size distribution and zeta potential of nanosheets. The amount of MnO2 was determined by inductively coupled plasma-mass spectrometry (Agilent 750CX, Agilent Technologies Co., Ltd., Santa Clara, CA, USA).
Determination of loading efficiency and in vitro release profiles
In order to evaluate the amount of CDDP loaded on the nanosheets, CDDP standards (0.5–10 μg/mL of CDDP in saline solution) were freshly prepared by dispersing CDDP in saline, and CDDP concentrations were determined by high-performance liquid chromatography (HPLC). An HPLC (Agilent 1200, Agilent Technologies Co., Ltd., Santa Clara, CA, USA) equipped with a reverse-phase Intertex C18 column (Scienhome Scientific Instrument Co. Ltd., Tian Jin, People’s Republic of China, 5 μm, 4.6×250 mm) and an ultraviolet–visible (UV–vis) detector was used. The mobile phase was 0.9% saline, which contains 0.003 mM sodium heptane-1-sulfonate. The eluent was monitored at 220 nm at a flow rate of 1 mL/min. A calibration curve was created between various CDDP concentrations and their corresponding absorption intensities at 220 nm. It was then applied to calculate the amount of CDDP present in the supernatant. The loading efficiency of CDDP was measured indirectly by measuring the amount of CDDP in the supernatant, as shown in the following equation:
|
|
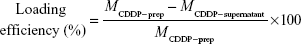
where MCDDP–prep is the total CDDP used in the preparation process and MCDDP–supernatant is the unloaded CDDP in the supernatant.
In vitro release characteristic of CDDP from nanosheets was investigated by a dialysis bag diffusion technique in PBS (pH 7.4), PBS (pH 5.0), PBS (pH 7.4) supplemented with 2 mM GSH, PBS (pH 7.4) supplemented with 10 μM GSH and PBS (pH 5.0) supplemented with 2 mM GSH, respectively. Briefly, triple 1.5 mL of the suspension of nanosheets was sealed into three dialysis bags (Molecular weight cutoff 12 kDa), and the bags tied at both ends were then completely immersed into 35 mL of different solutions as described earlier, and they were put into a shaker at 37°C with a speed of 100 rpm. At scheduled time points, 1 mL of sample was drawn off and the equal fresh medium was added instantly. The concentration of CDDP in the samples was determined by an HPLC.
Determination of in vitro MRI and relaxivities
Different concentrations of MnO2/HA/CDDP nanosheets in PBS (pH 7.4), PBS (pH 5.0), PBS (pH 7.4) supplemented with 2 mM GSH, and PBS (pH 5.0) supplemented with 2 mM GSH were prepared. These solutions were transferred into the 24-well cell culture plate. Each well has a volume of 2 mL of samples. In vitro MRI trial was carried out with a 3.0 T magnetic resonance (MR) instrument following a 4-hour incubation.
A MicroMR instrument (0.5 T; Shanghai Niumag Electronic Technology Co., Ltd., Shanghai, People’s Republic of China) was used for the analysis of the longitudinal (T1) relaxivity values at 32°C. T1 values of MnO2/HA/CDDP in PBS with a pH of 7.4 and in PBS supplemented with 2 mM GSH with a pH of 5.0 were determined as a function of concentrations.
Determination of cell viability
A549 cells were cultivated in Roswell Park Memorial Institute (RPMI)-1640 medium containing 10% fetal bovine serum, 100 U/mL penicillin G, and 100 μg/mL streptomycin and were placed in the incubator at 37°C.
The trypsinized A549 cells were seeded into 96-well dishes at a density of 5×10³ cells/well in 100 μL of complete RPMI-1640 medium. Prior to incubation with formulations, the culture medium was aspirated after overnight incubation. Stock solutions of MnO2/HA, CDDP, and MnO2/HA/CDDP were diluted with fresh culture medium for preparing a series of formulations. After incubation for scheduled period, the sulforhodamine B assay was adopted to assess the effect on A549 cell viability. Approval was obtained from the Ethical Committee of Zhengzhou University.
Intracellular uptake study
In order to investigate the cellular internalization behavior of different formulations, probe Cy 5.5 was loaded onto MnO2/HA nanosheets through van der Waals interaction following ultrasonic mixing Cy 5.5 solution and MnO2/HA nanosheets for 4 hours at room temperature.
Cells were cultured in a six-well dish overnight at a density of 3×10⁵ cells/well in 2 mL of culture medium. The cells were then exposed to Cy 5.5 solution and Cy 5.5- labeled MnO2/HA/CDDP. The Cy 5.5 concentration was set at 5 μg/mL. At the preset times, the treated cells were trypsinized and gathered for subsequent test by flow cytometry (FCM; BD Accuri C6, San Jose, CA, USA).
A549 cells were cultured in six-well plates and incubated for adherence on the glass slides, and then added with 5 μg/mL of equivalent free Cy 5.5 and Cy 5.5-labeled MnO2/HA/CDDP. When incubated for planned periods, the drug-containing medium was discarded and the cells were washed with PBS twice. The cells were then frozen in 75% ethanol for 15 minutes. Finally, the residual ethanol in the wells was washed with PBS twice prior to the staining of cell nucleus by 1 μg/mL 4′,6-diamidino-2-phenylindole (DAPI) for a quarter of an hour. As soon as the samples were rinsed with PBS for several times, confocal laser scanning microscopy (CLSM; Zeiss LSM780; Carl Zeiss Meditec AG, Jena, Germany) was used to detect the fluorescence in each sample. The red and blue fluorescence intensity was identified from the regions of interest of each image by ZEN2011 1.0.1.0 (Carl Zeiss Microscopy GmbH, Jena, Germany).
Cell cycle and cell apoptosis analysis
A549 cells were cultured in six-well plates at a density of 2.5×10⁵ cells/well in 2 mL culture medium. After being cultured overnight, freshly prepared formulations diluted with culture medium were added. The concentration of CDDP was adjusted to 12 μg/mL. After incubation for 4 hours, the drug-containing medium in the plate was replaced with 2 mL of serum-containing RPMI-1640 medium for further incubation for 24 hours. The cells were collected and fixed in chilled 75% ethanol (V:V) for 12 hours. The cells were then incubated with staining solution, which contained propidium iodide (50 μg/mL) and RNase (100 μg/mL). After incubation for 30 minutes, the collected cell samples were analyzed by FCM (BD FACSCalibur).
Cell apoptosis induced by each formulation was observed after the DAPI staining assay based on the probable occurrence of nucleus condensation.22 A549 cells were plated in six-well culture plates at a density of 2.5×10⁵ cells/well in 2 mL culture medium for subsequent incubation for 1 day. They were treated with various formulations diluted in complete culture medium. The concentration of CDDP was kept at 12 μg/mL. After 4-hour incubation, the treatment was terminated and 2 mL of serum-containing RPMI-1640 medium was added to each well. After incubation for 24 hours, the cell samples in each cell were rinsed with PBS for several times. Cell staining continued for 15 minutes with DAPI at a concentration of 1 μg/mL in darkness. After DAPI solution in each well was got rid of, 2 mL of PBS was added to each well in order to wash the residual staining solution. The washing process was repeated for three times before each sample was captured by an inverted fluorescence microscope (Olympus IX81, Olympus America Inc., Center Valley, PA, USA).
In vivo imaging
The near-infrared (NIR) fluorescence imaging is able to provide intuitive understanding with respect to the distribution of drug delivery system in tumor-bearing mice. In this study, a Bruker in vivo imaging system (FXPro; Carestream Health, Rochester, NY, USA) was used. The excitation wavelength was set at 670 nm and the emission at 700 nm. Prior to imaging experiments, the mice with S180 tumors ranging from 180 mm3 to 220 mm3 were intravenously administrated with MnO2/HA/Cy 5.5 and free Cy 5.5 formulation, which was prepared in Cremophor polyoxyl 35 castor oil/ethanol/5% of glucose (v/v/v, 1:1:9). The administrated dose of the probe was set at 4.8 μg/kg. At the scheduled time, the anesthetized animals were laid on a removable tray equipped with the imaging cabinet. The NIR fluorescence images and X-ray images were recorded by applying the custom capture settings. The captured images were processed with the Bruker MI software.
Three tumor-bearing mice were involved in the MRI. Two of them were administrated with MnO2/HA/CDDP and the other was the control.
Pharmacokinetics study
Sprague Dawley male rats weighing 180–200 g were divided into three groups (n=3). CDDP solution and MnO2/HA/CDDP nanosheets were administered via tail vein. At different time intervals, blood samples were collected from mice’s eyes via retro-orbital bleeding, and then centrifuged to obtain plasma. The plasma samples were then decomposed by heating in 35% nitric acid, and the amount of platinum was analyzed with an inductively coupled plasma-atomic emission spectrometer. The CDDP concentration in plasma was calculated based on the determined metal Pt. PK Solver Software Version 2.0 (China Pharmaceutical University, Nanjing, People’s Republic of China) was used for the evaluation of different pharmacokinetics parameters by using non-compartmental model.23
In vivo antitumor effect
Therapeutic experiments of CDDP-loaded MnO2 nanosheets were performed on the subcutaneous tumors. When the tumors grew to ~100 mm3, the mice were randomly arranged into four groups and administrated with saline, CDDP solution, MnO2/HA nanosheets, and MnO2/HA/CDDP nanosheets via tail vein. The administrated dose of the nanosheets was 4.2 mg/kg in the MnO2/HA group and MnO2/HA/CDDP group, which was calculated by MnO2. The administrated CDDP dose was 3 mg/kg in the CDDP group and MnO2/HA/CDDP group. The tumor size was recorded on the basis of the following formula: tumor volume (mm3) =0.5× A × B2. In this formula, A and B refer to the length and breadth of the tumor, respectively. The body weight of the mouse was also measured.
All the animals treated a total of four times were sacrificed at the study endpoint. The dissected tissues such as tumors and other major organs were immersed into paraffin for hematoxylin and eosin (H&E) staining. Finally, the H&E-treated slices were captured under a bright field microscope (Nikon Eclipse 50, Nikon Corporation, Tokyo, Japan).
Statistical analysis
An F-test with subsequent Student’s t-test (equal variance) was used for the evaluation of the results of two different groups. Analysis of variance (ANOVA) was carried out followed by Dunnett’s posttest for multiple groups. Experimental results were considered statistically significant when the P-value was <0.05. All the data listed are mean ± SD, unless otherwise noted.
Results and discussion
Synthesis and characterization of MnO2 nanosheets
In order to develop an outstanding nanoplatform with both therapeutic and imaging features, the MnO2 nanosheets were adopted in this study. MnO2 nanosheets were prepared mainly by ultrasonicating bulk MnO2, which was first synthesized by using H2O2 to oxidize MnCl2 in the presence of tetramethylammonium hydroxide. Unlike the exfoliation of layered host compounds into single layers step by step,24 synthesis and primary exfoliation were completed simultaneously with tetramethylammonium hydroxide as exfoliation agent in this study. Thereafter, ultrasonication for as long as 12 hours or more is necessary to further exfoliate the bulk nanomaterial. As shown in Figure 2A, sheet-like morphology has been constructed successfully with a size of 20–60 nm. The selected area electron diffraction pattern image at the bottom right of Figure 2A indicates the crystalline property of MnO2. The lattice fringe spacing observed under a higher magnification (Figure 2B) is ~0.23 nm, which can be attributed to the (100) plane of MnO2. The crystal phase of the prepared MnO2 was further characterized by power X-ray diffraction. As shown in Figure S1, the peaks at 2θ =37.0°, 42.2°, and 66.1° can be easily identified for the (100), (101), and (110) planes, respectively, of MnO2 crystalline structure (Akhtenskite, syn MnO2, JCPDS [Joint Committee on Powder Diffraction Standards] file no: 30-0820). The EDS of MnO2 in Figure 2C gave a direct evidence of the Mn and O elements. Figure 2D indicates that the zeta potential of nanosheets is ~22.3 mV. Moreover, XPS technique was employed to explore the surface chemistry of the nanomaterial. Figure 2E shows that the XPS signal of the O element centered ~529.64 eV. Figure 2F shows the binding energy of the Mn 2p3/2 and 2p1/2 centered at 641.95 eV and 653.65 eV, respectively, suggesting that the primary oxidation state of Mn is +4. They were similar to the binding energy of 642.0 eV and 653.9 eV in a previous study.25
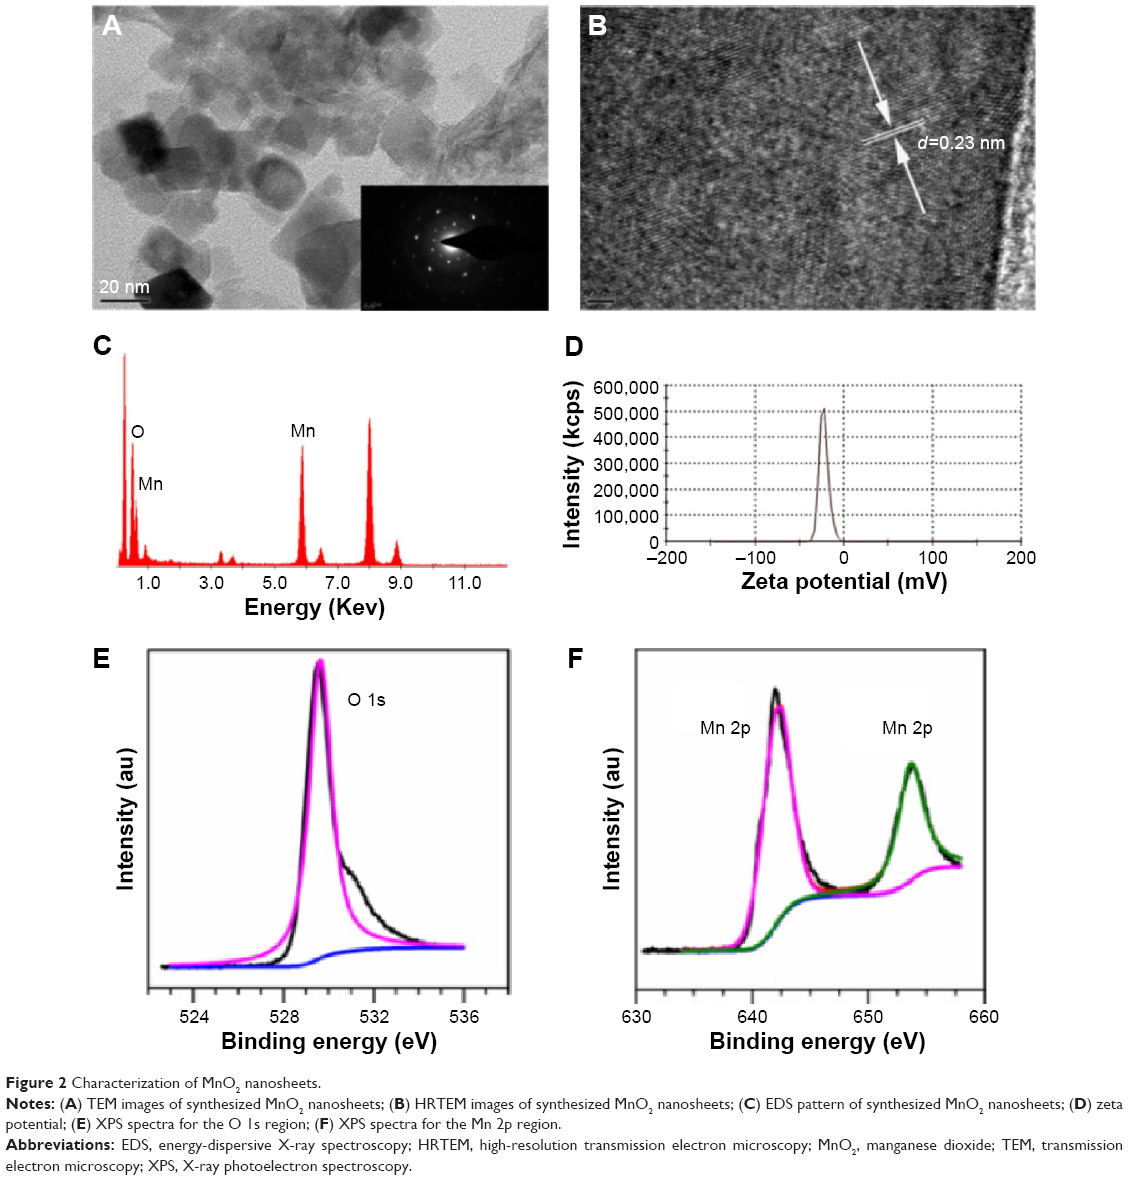 | Figure 2 Characterization of MnO2 nanosheets. |
Preparation and physical characterization of MnO2/HA/CDDP
Based on a recent study, MnO2 nanosheets have large surface area, which provides a large number of anchoring points for drug molecules.8 However, its unstable property in saline and lack of tumor targeting limited its use for cancer drug delivery. HA, a polyanionic polysaccharide which consists of N-acetyl-D-glucosamine and β-glucuronic acid, has been widely used for tumor-targeting delivery, because it has high affinity toward CD44 (involved in cell–cell interactions, cell adhesion, and migration), which is overexpressed in many cancers.26,27 In addition, HA could also increase the physical stability of nanoparticles.19 Given the possible chelation and electrostatic interactions between HA and MnO2, HA with good biocompatibility and tumor-targeting property was introduced to the surface of MnO2.
In order to understand the property of the obtained MnO2/HA, FTIR spectra of MnO2, MnO2/HA, and HA were investigated in detail. As shown in Figure 3A, after the MnO2 nanosheets were modified with HA, the asymmetric and symmetric stretching vibration of methylene (–CH2) of HA appeared at ~2,900 cm−1 and 2,800 cm−1, respectively. In addition, the peak at ~1,058 cm−1 was assigned to the stretching vibration of N–C of HA molecules. These results suggested that HA was successfully attached to the surface of MnO2 nanosheets. Figure 3B shows the thermogravimetric analysis of synthesized MnO2 nanosheets and MnO2/HA in air. At 600°C, MnO2 and MnO2/HA showed ~8.2% and 10.3% weight losses, respectively. Therefore, the difference between the two weight loss percentages is the relative amount of HA grafted onto MnO2 nanosheets, which is ~2.1%. Thus, this modification could significantly improve the dispersibility of MnO2 in saline.
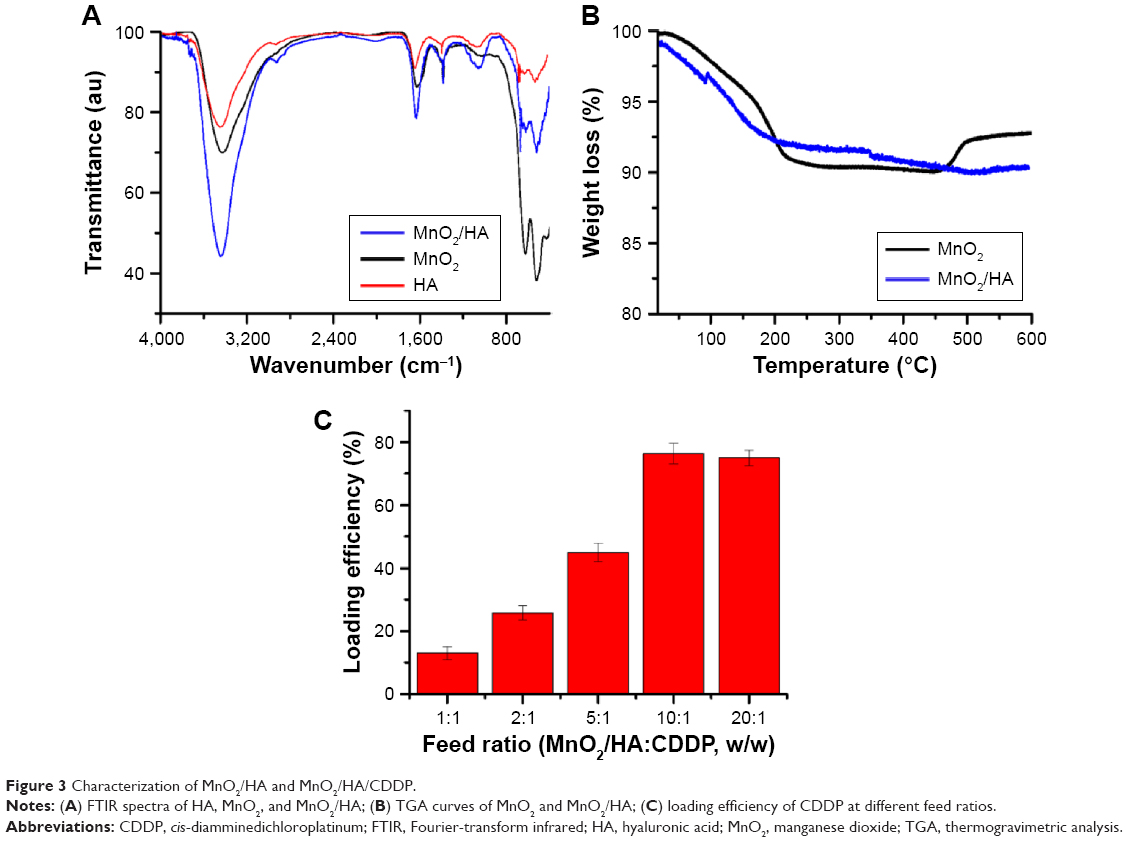 | Figure 3 Characterization of MnO2/HA and MnO2/HA/CDDP. |
The advantage of MnO2/HA was its applications for drug delivery due to the two-dimensional nature. Accordingly, a widely used chemotherapeutic agent, CDDP, was transported by the MnO2/HA nanosheets to obtain the MnO2/HA/CDDP. CDDP is noncovalently loaded onto the MnO2/HA by simple mixing under sonication. The hydrogen-bond interaction among HA molecules reported by the earlier study may mask some paratope regions of HA in the process of loading of drug.28 In order to increase the loading efficiency of CDDP, the loading efficiency was investigated at different feed ratios. As shown in Figure 3C, it was found that with the increase in the MnO2/HA, the loading efficiency increased and reached the maximum of ~75.0% when the ratio of MnO2 to CDDP was 10:1. This high loading capacity was attributed to the electrostatic and van der Waals effects as reported by other researchers,29 while Pt metal of CDDP could also form a strong conjugation with carboxyl groups of the HA in MnO2/HA. Considering the hydrogen-bond interaction among HA molecules forming a barrier for chelating with cisplatin, destroying the hydrogen-bond interaction through treatments with urea, acid, base, or high temperature may be a potential solution to increase the drug loading efficiency.30–33
The morphology of MnO2/HA/CDDP was recorded by TEM. As shown in Figure 4A, MnO2/HA/CDDP was sheet-like structure with aggregation. We inferred that the aggregation was due to the Pt metal of CDDP, which may form a strong conjugation with carboxyl group in HA from adjacent nanosheets, as shown in Figure S2A. EDS spectrum (Figure 4B) further indicated the existence of metal Pt in the theranostic nanoplatform. Figure 4C and D shows that the size and zeta potential of MnO2/HA/CDDP were ~190.5 nm and −26.2 mV, respectively. As shown in Figure 4E and F, the stability of MnO2/HA/CDDP in pure water and saline was observed from their appearance, indicating that the as-prepared MnO2/HA/CDDP has good stability in physiological environment compared to free MnO2 nanosheets.
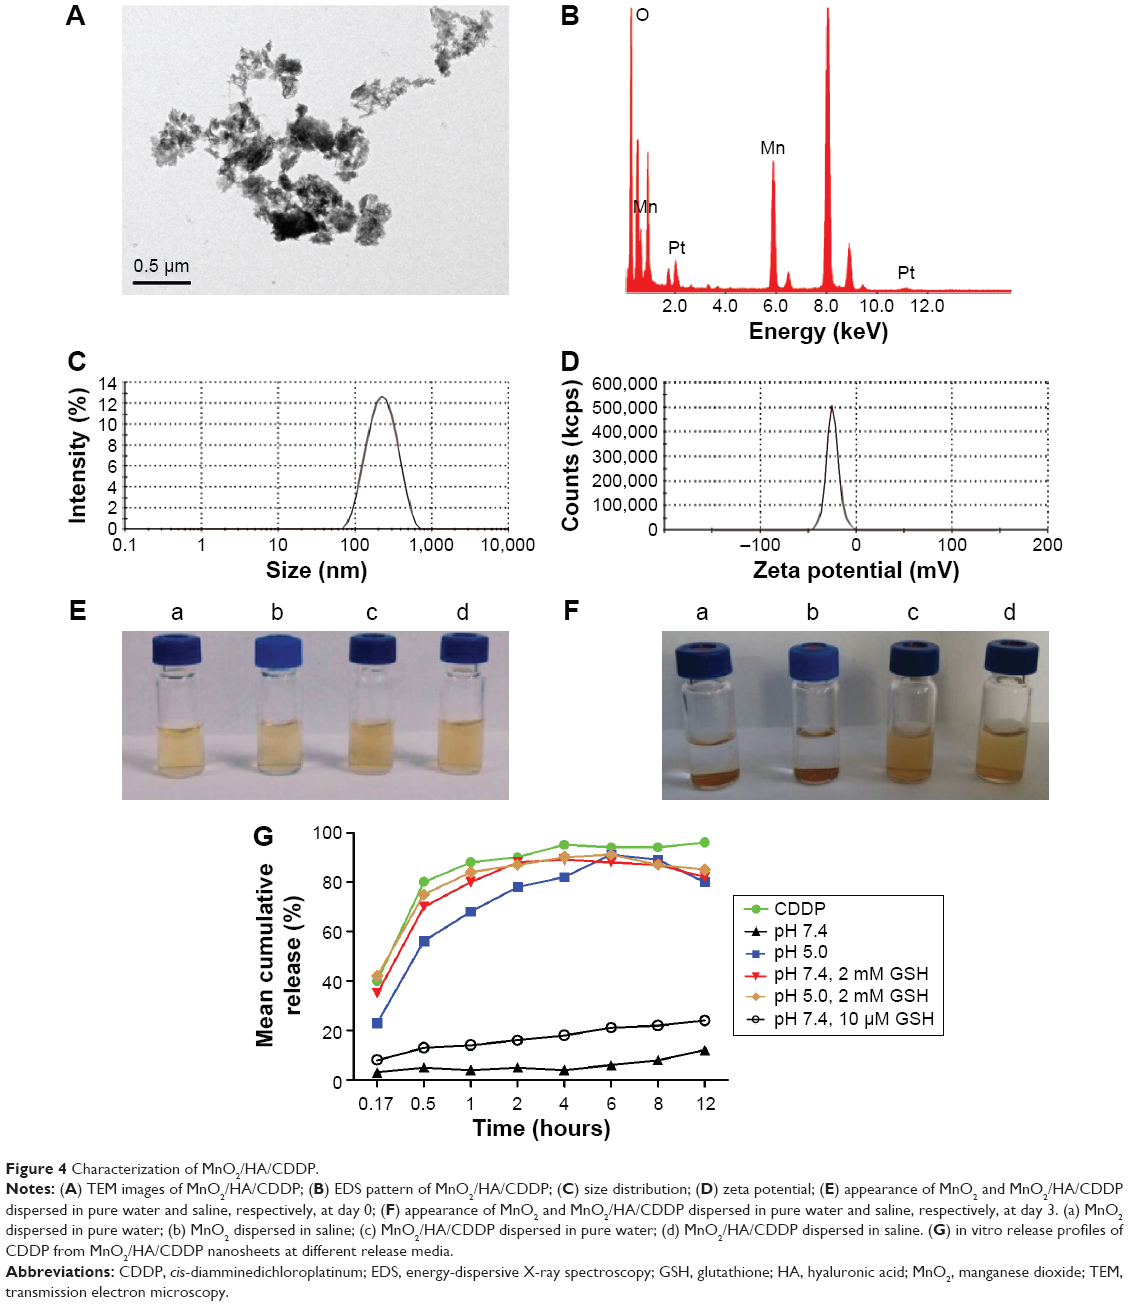 | Figure 4 Characterization of MnO2/HA/CDDP. |
In vitro release
As mentioned earlier, tumor site exhibited special features in comparison to the normal tissue, such as weak-acid environment and elevated GSH level. Consequently, in vitro drug release studies were carried out at 37°C under different conditions. As shown in Figure 4G, the release of CDDP from MnO2/HA/CDDP nanosheets was largely controlled at pH 7.4. In this case, the released drug percentage was below 30% in the initial 12 hours, indicating a slower and sustained release characteristic. This could be attributed to robust conjugation of platinum with carboxylate anion of the HA molecules on the MnO2 surface as well as absorption by the MnO2 nanosheets through van der Waals interactions apart from electrostatic effects. Interestingly, the release of CDDP from MnO2/HA/CDDP was apparently accelerated at pH 5.0 in comparison to that at pH 7.4 probably as a result of the weakening of the metal–carboxylate bond via protonation of the carboxylic groups of the HA unit (Figure S2B) and the dissolution of MnO2 in acid condition.8,34 As expected, promoted drug release with a released percentage of 84.0% in the first 12 hours was obtained for MnO2/HA/CDDP nanosheets when they were placed in a reductive release medium supplemented with 2 mM GSH. The drug system could be decomposed due to the reduction in MnO2 nanosheets by GSH, generating a great number of Mn2+ ions. In comparison, less CDDP release percentage was observed in PBS containing 10 μM GSH. Therefore, when drug-loaded MnO2 nanosheets accumulate at tumor tissues, the reductive environment of tumors may substantially promote the breakup of the nanosheets and rapid release of the loaded therapeutic agents. As shown in Figure S3, the breakup of MnO2/HA nanosheets in a redox environment that promotes the drug release could be obviously demonstrated by the color evolution from brown to colorlessness. However, no obvious color change was observed under the physiological environment. In contrast, the color change of them in acid environment is less obvious, further indicating that the undermining of the metal–carboxylate bond via protonation of the carboxylic groups of the HA unit under acid condition contributed largely to the promoted drug release. As expected, the in vitro release was enhanced compared to the condition either in pH 5.0 medium or in pH 7.4 medium with 2 mM GSH. Hence, this drug release profile triggered by elevated GSH level and weak-acid medium indicates that it can be used as a smart agent in cancer management.
Determination of in vitro MRI and relaxivities
Mangafodipir trisodium, which refers to manganese(II) N, N′-dipyridoxyl-ethylenediamine-N, N′-diacetate-5,5-bis (phosphate), is a commercial agent. Its application for hepatocellular carcinoma diagnosis relying on the imaging quality of Mn2+ has been approved by the US Food and Drug Administration.12,35 In order to explore that whether the tumor microenvironment could trigger the dissolution of MnO2 into enough Mn2+ for T1-weighted imaging, MRI of MnO2/HA/CDDP in acid or redox condition was further assessed.
After incubation for 4 hours, MnO2/HA/CDDP nanosheets prepared at different solutions were captured on a 3.0 T MR instrument. Meanwhile, MnCl2 aqueous solutions with different concentrations were selected as the positive control.36 Figure 5A and B shows that there is no obvious difference between different concentrations of MnO2/HA/CDDP at pH 7.4, indicating that MnO2/HA/CDDP nanosheets failed to display the satisfactory imaging effect. However, the MR signal intensities of MnO2/HA/CDDP in redox environment increased significantly with the increase in [Mn] concentration, thus manifesting their potential applications as a strong T1 contrast agent in response to redox environment. The bright signal of MnCl2 further demonstrated the production of manganese ions from MnO2/HA/CDDP under redox environment. It should be noted that the MRI of MnO2/HA/CDDP under acid environment was obviously weaker than that under redox environment, which was not consistent with the in vitro release profile because the CDDP was rapidly released from MnO2/HA/CDDP, no matter whether it is in acid medium or in redox medium. This phenomenon may be explained by the different promoted release mechanism under different medium conditions. As stated earlier, the weakening of the metal–carboxylate bond via protonation of the carboxylic groups of the HA unit under acid condition contributed largely to the promoted drug release. However, the dissolution of MnO2 triggered by higher GSH is the main factor for the rapid drug release as well as manganese ions. When our system was under the condition of pH 5.0 supplemented with 2 mM GSH medium, it was not surprised that the significant whitening effect was detected. However, the whitening effect is even stronger than that of the corresponding MnCl2 group at the same [Mn] concentration. The enhanced whiting phenomenon may be due to the different medium, which was also reported by Rohrer et al.37 The r1 value of the Teslascan®, which is a commercial Mn-based MRI contrast agent used clinically, is ~1.9 mM−1 s−1 at 0.47 T.37 As shown in Figure 5C, the r1 value of our system at pH 7.4 without GSH is 0.4 mM−1 s−1. In contrast, the r1 value of our MnO2/HA/CDDP system at pH 5.0 supplemented with 2 mM GSH is ~1.3 mM−1 s−1, which is comparable to that of Teslascan®, indicating that our materials have a stronger T1 shortening effect and are feasible to be used as positive MRI contrast agents. Therefore, our system under in vitro mimic microenvironment still showed the potential for positive MRI due to its higher r1 value (r1>1) as well as demonstrated whitening effect in a concentration-dependent manner in vitro.
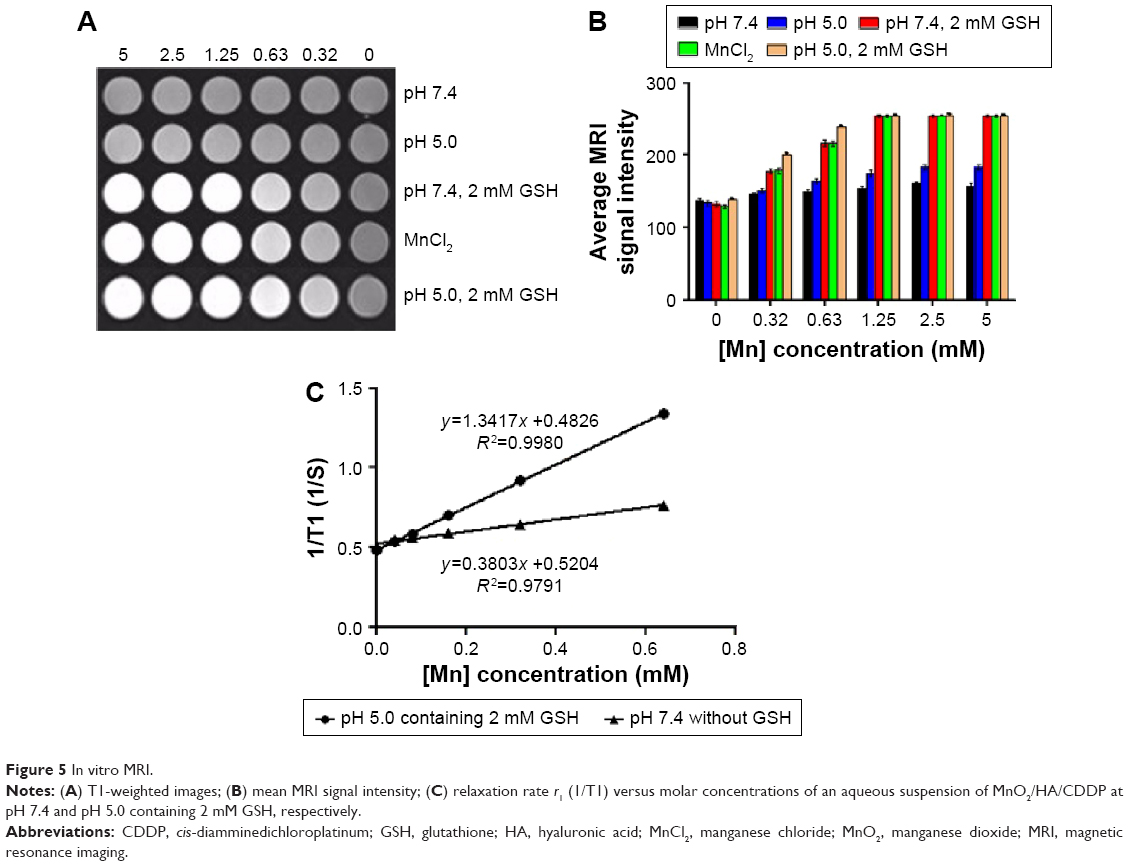 | Figure 5 In vitro MRI. |
Therefore, because the dissolution of MnO2 in tumor environment, ie, under redox environment, was able to generate adequate manganese ions for T1-weighted imaging, the developed theranostic system based on MnO2 nanosheets could afford pH/redox dual-triggered MRI. Therefore, it was worth a try to apply it for detecting tumor because of the acidic/redox microenvironment of the tumor tissue.
Intracellular uptake study
The theranostic nanoplatform was labeled by Cy 5.5 for tracking its distribution in cells or mice bodies. The comparison of cellular uptake of Cy 5.5 between free Cy 5.5 and MnO2/HA/Cy 5.5 in A549 cells was first performed by flow cytometric analysis. As shown in Figure 6A, the internalization of both Cy 5.5 and MnO2/HA/Cy 5.5 demonstrated a time-dependent manner. The uptake ratios of Cy 5.5 at 2 hours, 4 hours, and 6 hours were 20.2%, 26.3%, and 43.0%, respectively. However, those ratios at 2 hours, 4 hours, and 6 hours were 63.0%, 64.9%, and 66.9% for MnO2/HA/Cy 5.5 nanosheets, respectively, indicating that the drug in MnO2/HA-based drug delivery was more easily accumulated in cancer cells than free drug.
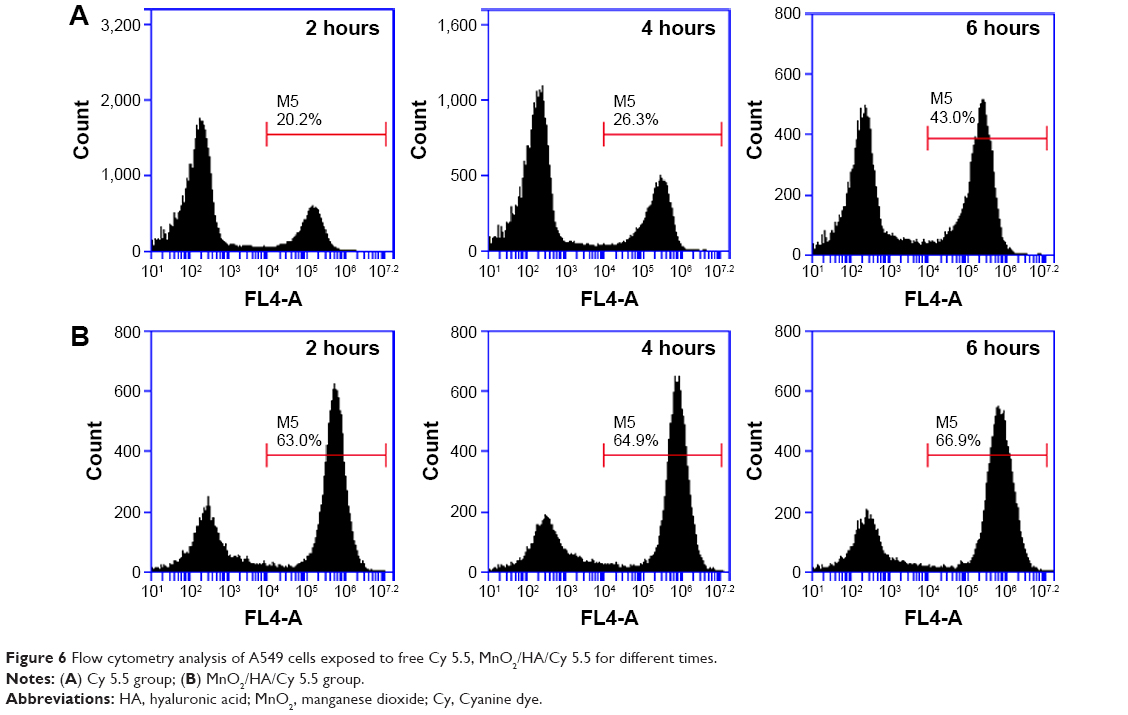 | Figure 6 Flow cytometry analysis of A549 cells exposed to free Cy 5.5, MnO2/HA/Cy 5.5 for different times. |
The uptake of MnO2/HA theranostic system and its intracellular behavior according to the red fluorescence of Cy 5.5 was further observed with the help of CLSM. As shown in Figure 7, the cell nuclei stained by DAPI were shown in blue, while Cy 5.5 and Cy 5.5-labeled system are all displayed in red. It should be noted that free Cy 5.5 exhibited much stronger fluorescence intensity in the cell cytoplasm. By taking advantage of the “optical sectioning” function of CLSM, fluorescence images of A549 cells treated with either MnO2/HA/Cy 5.5 or free Cy 5.5 were reconstructed in 2.5-dimensions by ZN 2011 software. Compared to the free Cy 5.5, MnO2/HA/Cy 5.5 entered the cells obviously, especially more red fluorescence along with blue fluorescence, as evidenced by fluorescence signals appeared along the Z-axis. This result suggested that MnO2/HA is able to deliver considerable drugs into cytoplasm and release the carried agents timely.
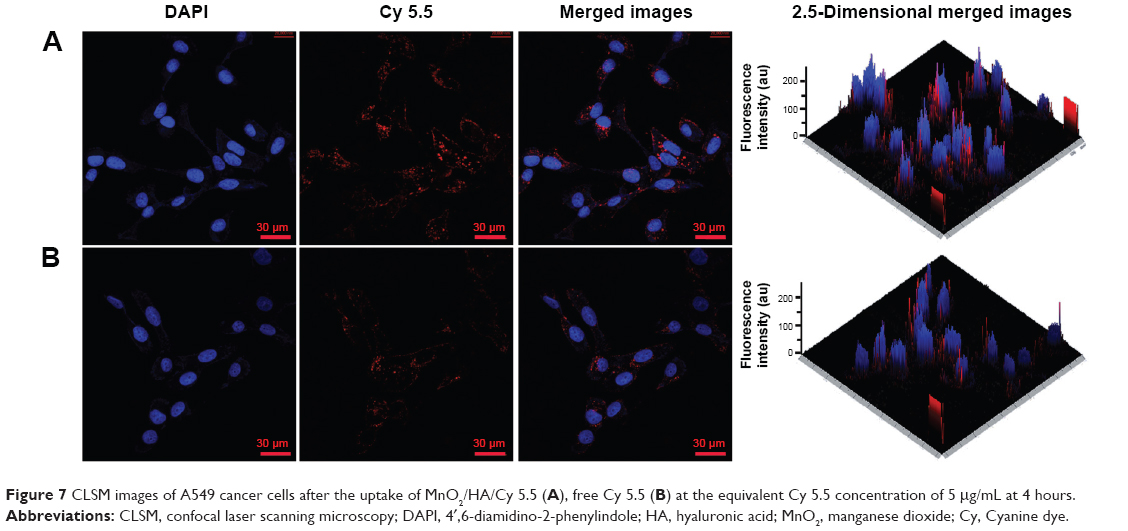 | Figure 7 CLSM images of A549 cancer cells after the uptake of MnO2/HA/Cy 5.5 (A), free Cy 5.5 (B) at the equivalent Cy 5.5 concentration of 5 μg/mL at 4 hours. |
In vitro cytotoxicity
Figure 8A shows that A549 cell viability following the incubation with MnO2/HA for 1 day was >80% in the range of the tested concentrations. However, when the concentration of MnO2/HA was >20 μg/mL, the cell growth was inhibited to some extent at 48 hours, indicating that a higher dose of it also induced the cell growth. Therefore, the administrated dose of vehicles <20 μg/mL was used in the subsequent investigations.
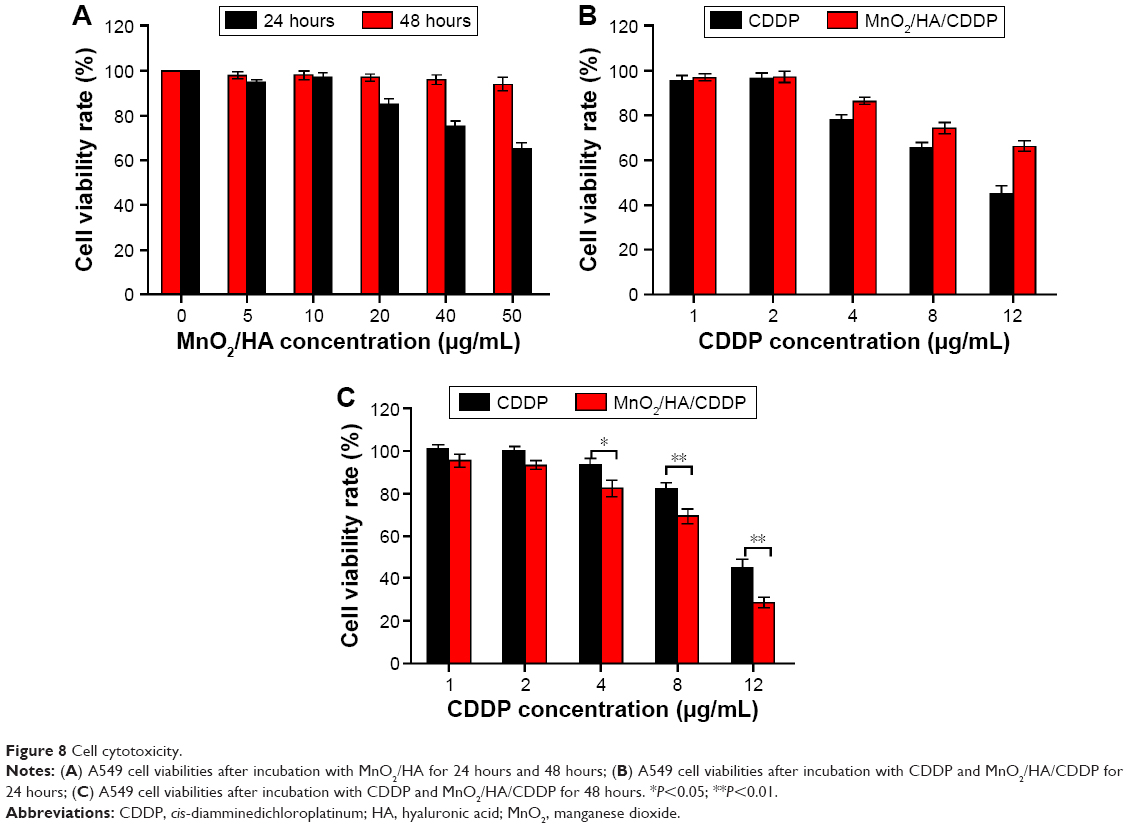 | Figure 8 Cell cytotoxicity. |
In order to determine that whether MnO2/HA/CDDP has inhibitory effect on the proliferation of 549 cells in vitro, cell viability at different times was carried out. Figure 8B and C shows that MnO2/HA/CDDP nanosheets prohibited the growth of A549 cells in a concentration-dependent manner at either 24 hours or 48 hours. Interestingly, although the MnO2/HA/CDDP showed lower inhibition effect in comparison to CDDP at 24 hours, the inhibitory effect of drug-loaded nanosheets was largely strengthened at 48 hours. This phenomenon may be explained by the sustained release feature of CDDP from the system.
Cell cycle analysis
In order to elucidate the mechanism of MnO2/HA/CDDP-induced cytotoxicity, the cell cycle distribution of cells was investigated by FCM after incubation with MnO2/HA nanosheets, CDDP solution, and MnO2/HA/CDDP nanosheets. As shown in Figure 9A, the G0/G1, S, and G2/M phases had no change after the incubation with MnO2/HA, suggesting that MnO2/HA with good biocompatibility influenced less on the cell cycle distribution. Compared to the control group with a percentage of 9.94% cells in G2/M phase, the G2/M phases were arrested markedly in the cases of both free CDDP and MnO2/HA/CDDP with a percentage of 29.70% and 29.92%, respectively, indicating the similar cytotoxicity mechanism.38
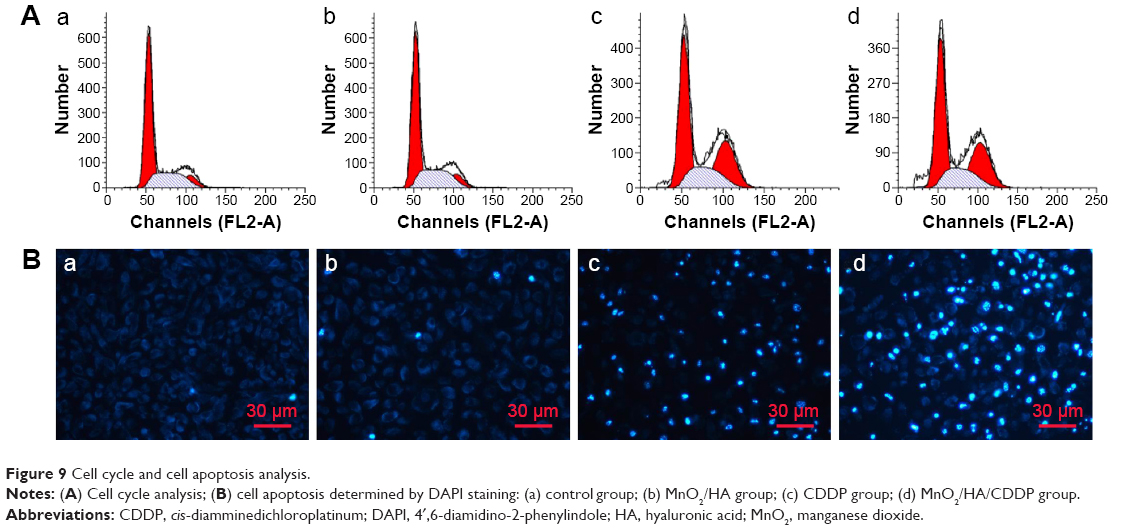 | Figure 9 Cell cycle and cell apoptosis analysis. |
Cell apoptosis
The nuclear destruction along with the appearance of apoptotic bodies was conspicuous markers of variable extent of apoptosis.39 Figure 9B shows the blue color stained by DAPI was faint. Compared to the control group, no obvious difference was observed between the MnO2/HA and control group, indicating the good biocompatibility of MnO2/HA. Interestingly, more cells treated with CDDP and MnO2/HA/CDDP exhibited blue color, indicating that both caused significant apoptosis in A549 cells with an apoptosis rate of 47.0%±1.9% and 55.6%±1.7%, respectively. This demonstrates that MnO2/HA/CDDP enhanced the apoptosis of A549 cells when compared to free CDDP (P<0.05).
In vivo NIR fluorescence imaging
Figure 10 shows the overlay images of fluorescence and X-ray images of tumor-bearing animals receiving Cy 5.5-labeled MnO2/HA nanosheets and Cy 5.5 at planned time. For Cy 5.5 group, there was strong fluorescence intensity around the starting point of the tail. Moreover, the fluorescence signals decreased in a short time and became a tiny spot after 24 hours. This result was possibly induced by the fast clearance of it from kidney. Surprisingly, at either 2 hours or 24 hours, the fluorescence intensity at the tumor site of the animal receiving MnO2/HA/Cy 5.5 was obviously enhanced relative to that of Cy 5.5 group. This outstanding accumulation of MnO2/HA might be explained by the enhanced permeation and retention effect as well as receptor-mediated endocytosis with the help of HA. These results indicated that MnO2/HA/CDDP was able to effectively target tumors.
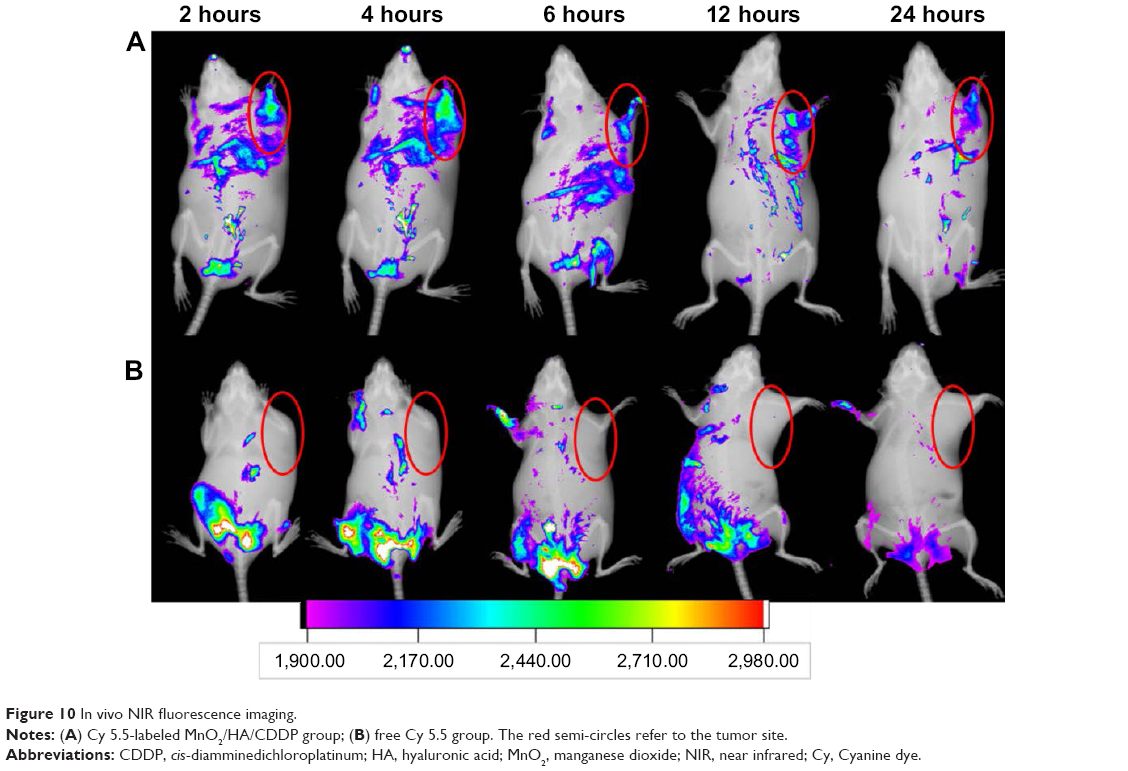 | Figure 10 In vivo NIR fluorescence imaging. |
MRI evaluation in vivo
The anesthetized tumor-bearing mice following the injection of MnO2/HA/CDDP were placed on a clinical 3.0 T MRI scanner for obtaining the T1-weighted MRI. As shown in Figure 11A(b), apparent whitening phenomenon appeared at the injection site in the tumor compared to the control mouse, suggesting that MnO2/HA may be a potential T1-weighted imaging agent for the diagnosis of tumor site. According to the in vivo NIR fluorescence imaging outcome, it is easy to conclude that the system accumulated at the tumor location abundantly at 4 hours. It motivates us to understand the T1-weighted image of the tumor animal administrated with MnO2/HA/CDDP via tail vein at the same time. HA has been proposed as an alternative to polyethylene glycol to improve the pharmacokinetic properties of therapeutic agents.40–42 Therefore, the drug delivery system could partially evade accumulation in the liver through the decoration of HA on the nanosheets. As shown in Figure 11A(c) and B, distinct whitening at the tumor locations according to the T1-weighted MRI following the 4-hour administration was detected. Meanwhile, considerable whitening phenomenon was also clear at the liver location, indicating that the clearance of Mn2+ may be from the liver prior to excretion into the intestines. While the application of HA may help the vehicles to evade accumulation in the liver to some extent, it should be remembered that mononuclear phagocytic system uptake usually leads to the accumulation of nanoparticles in the liver inevitably. Therefore, it is not surprising to find that enhanced whiting effect in the liver site was observed despite the possibility of clearance of degraded Mn2+ in vivo. Consequently, these results suggested that MnO2/HA nanosheets could be employed as a dominant T1 MRI contrast agent.
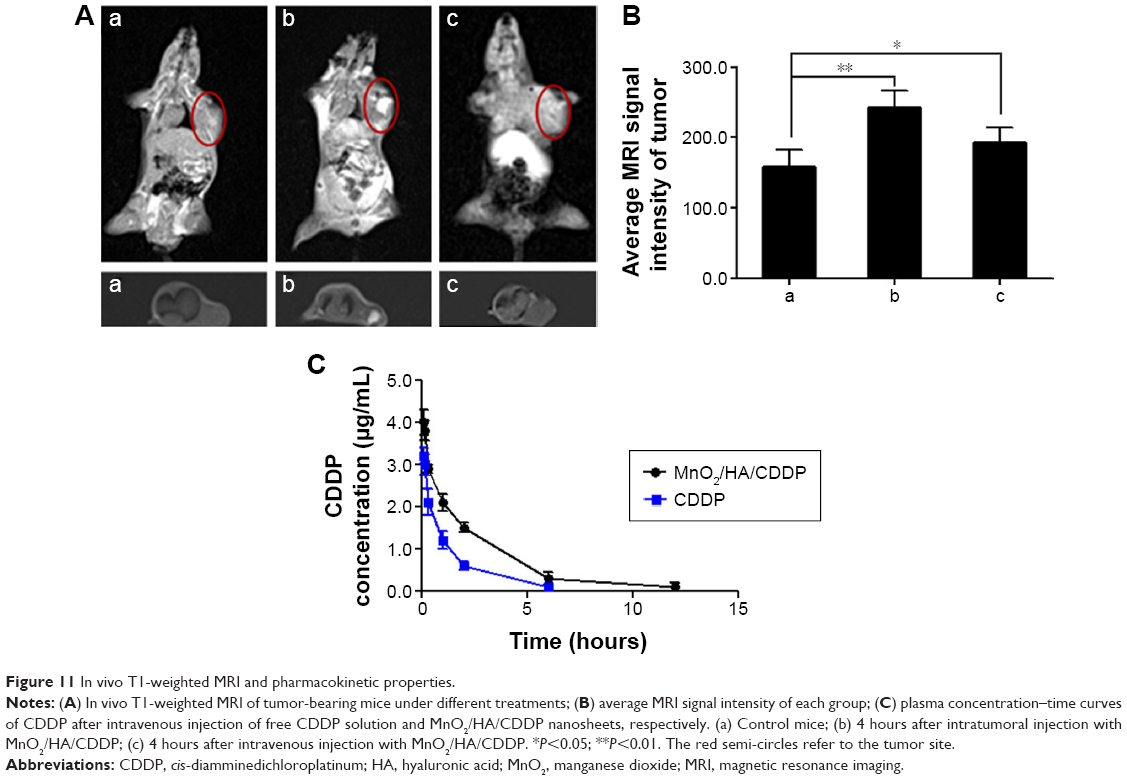 | Figure 11 In vivo T1-weighted MRI and pharmacokinetic properties. |
Pharmacokinetics study
The plasma concentrations of CDDP after the administration of CDDP solution and MnO2/HA/CDDP nanosheets at different times are shown in Figure 11C. What should be noted is that free CDDP was cleared quickly from the blood. In comparison, MnO2/HA/CDDP displayed a delayed blood clearance. Moreover, the concentration of CDDP released from the delivery system was kept higher within 12 hours than that of free CDDP solution.
Table 1 summarizes the relevant pharmacokinetic parameters of each group. The area under the curve, t1/2 of the MnO2/HA/CDDP nanosheets, was 1.65 times, and 2.19 times of that of free CDDP. The prolonged circulation characteristic may be related to the application of HA, because it has been proposed as an alternative to polyethylene glycol to improve the pharmacokinetic properties of therapeutic agents. Penetration from blood to tumor by active and passive tumor-targeting ways requires adequate blood residence time and circulating levels before tumor accumulation, and receptor-mediated uptake can take place. These in vivo pharmacokinetic properties of CDDP delivered by nanosheets seem to match well with its in vitro sustained CDDP release profile. Therefore, the prolonged circulation and stimuli-responsive release profiles may greatly contribute to their in vivo stability before reaching the target tumor site.
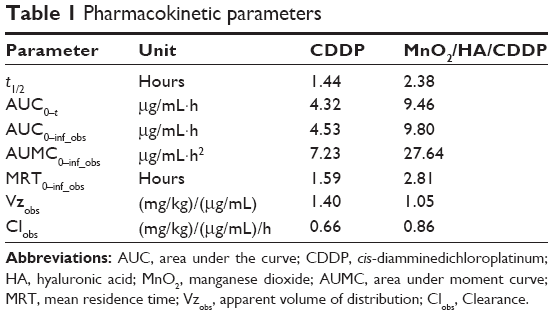 | Table 1 Pharmacokinetic parameters |
In vivo antitumor effect
Drug delivery system with high toxicity usually leads to the loss of body weight. Therefore, body weight of all the tumor-bearing animals was weighed during the treatment period. Figure 12A indicates that the body weight of mice in CDDP group decreased quickly with an average decrease of 21.78% at the study endpoint relative to the starting point. However, no obvious body weight loss was observed for MnO2/HA and MnO2/HA/CDDP nanosheets, indicating that these two treatments were well tolerated by mice.
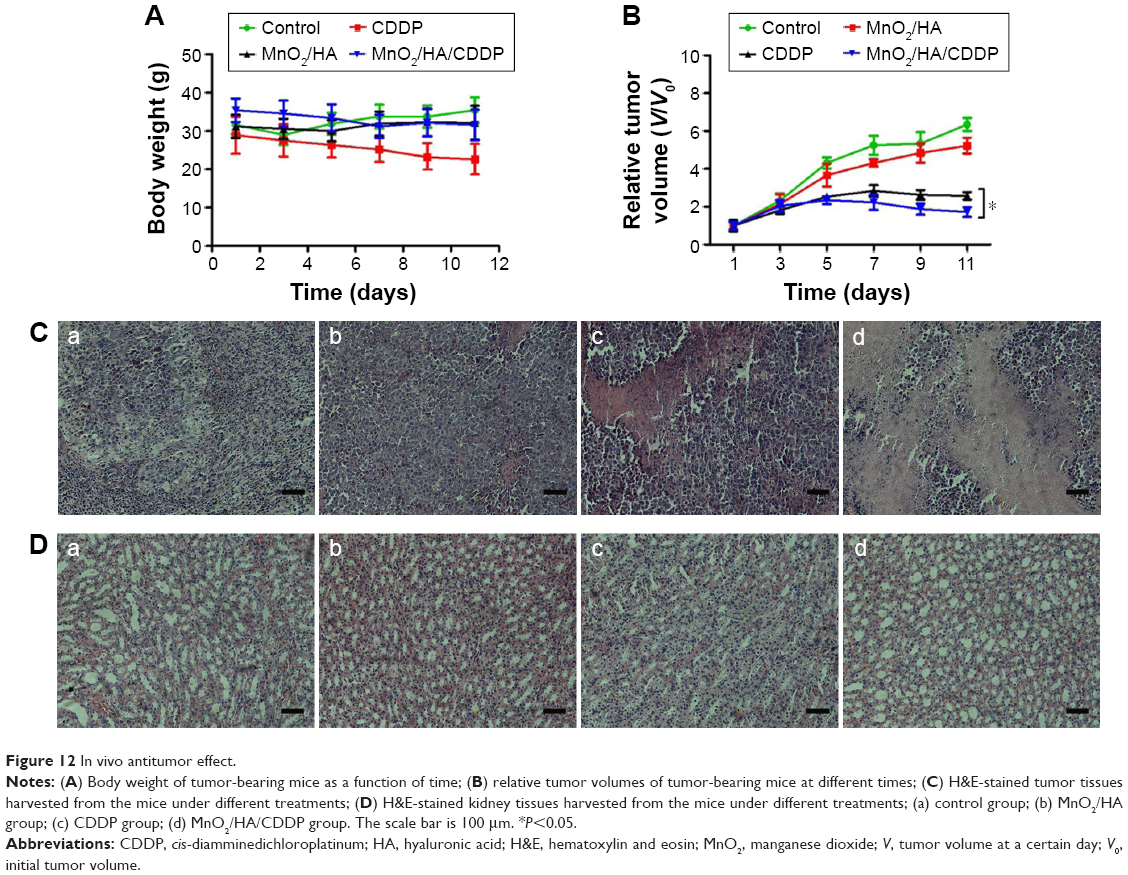 | Figure 12 In vivo antitumor effect. |
In order to understand the therapeutic efficiency of MnO2/HA/CDDP, antitumor efficacy was performed in the S180 tumor-bearing mice. After four times of treatments, the relative tumor volumes of saline group and MnO2/HA group were 6.34±0.35, 5.23±0.42 (Figure 12B), respectively, suggesting that the MnO2/HA prevented the tumor progression slightly. Previous research showed that MnO2 material was capable of enhancing the effect of radiation treatment, which involved in mediation of tumor progression-related factors, such as hypoxia-inducible factor-1 alpha and vascular endothelial growth factor in the tumor.43 These findings may explain partly for the observed inhibition action of MnO2/HA in this study. Interestingly, compared to the CDDP group, MnO2/HA/CDDP nanosheets exhibited an obviously strengthened antitumor efficiency (P<0.05) because the relative tumor volume was only 1.72±0.25, indicating that this is a successful application in which MnO2 nanosheet was used as a theranostic system. The representative tumor H&E staining samples were arranged in Figure 12C, indicating that the MnO2/HA/CDDP group showed evident tumor cell necrosis as well as shrinkage compared to the remaining groups. As a result, remarkably enhanced therapeutic effect was further demonstrated for tumor-bearing mice receiving MnO2/HA/CDDP in comparison to those treated with CDDP or MnO2/HA at the same CDDP and MnO2/HA doses. The improved antitumor effect for MnO2/HA/CDDP could be explained from the following two aspects: 1) the tumor-targeting property and extended circulation time of CDDP with the help of HA led to the accumulation in tumor and 2) the efficient cellular internalization by tumor cells would result in enhanced cell growth inhibition because of the combination of the inherent role of CDDP and the downregulation of tumor progression-related factors derived from MnO2 nanosheets.43
A major drawback of CDDP is its side effects in normal cells and tissues, prominently toxicity in the kidneys.44 As shown in Figure 12D, collapse of tubules was found in the kidney of free CDDP group. Compared to free CDDP group, tubules in the kidney was arranged in order and no pathological changes and necrosis were observed in the kidney from MnO2/HA/CDDP group, indicating that the MnO2/HA/CDDP alleviated the toxicity of CDDP to the kidney. All other major organs including heart, liver, spleen, and lungs displayed no obvious difference in either MnO2/HA or MnO2/HA/CDDP groups compared to the saline group. As shown in Figure S4, no different dissolution, atrophy, and necrosis of cardiac cells were observed in the heart, and no different degeneration and necrosis were detected in both hepatic cell and splenocytes. Meanwhile, no different inflammatory cells appeared and no structural changes occurred in the lungs. These results confirmed the safety of MnO2/HA/CDDP nanosheets and their outstanding therapeutic efficiency.
Conclusion
The degradable MnO2 nanosheets modified with HA was successfully constructed for loading CDDP in this study. On the one hand, this redox/pH dual-responsive theranostic platform was able to deliver CDDP to the tumor site, causing enhanced antitumor efficiency without significant toxicity to kidney. On the other hand, this system could be triggered by weak-acid environment and high level of GSH to generate manganese ions for T1-weighted imaging. Therefore, these redox/pH dual-responsive biodegradable nanosheets paved a way for developing smart systems for tumor-targeting theranostic application.
Acknowledgments
This work was supported by grants from the National Natural Science Foundation of China (nos 81572991, 81272527, and 81302717), the China Postdoctoral Science Foundation (nos 2014M562002 and 2015T80783), and the Youth Teacher Development Foundation of Zhengzhou University (no 1421331073).
Disclosure
The authors report no conflicts of interest in this work.
References
Lammers T, Aime S, Hennink WE, Storm G, Kiessling F. Theranostic nanomedicine. Acc Chem Res. 2011;44(10):1029–1038. | ||
Cole JT, Holland NB. Multifunctional nanoparticles for use in theranostic applications. Drug Deliv Transl Res. 2015;5(3):295–309. | ||
Bulte JW, Kraitchman DL. Iron oxide MR contrast agents for molecular and cellular imaging. NMR Biomed. 2004;17(7):484–499. | ||
Devaraj S, Munichandraiah N. Effect of crystallographic structure of MnO2 on its electrochemical capacitance properties. J Phys Chem C. 2008;112(11):4406–4417. | ||
Gerweck LE, Seetharaman K. Cellular pH gradient in tumor versus normal tissue: potential exploitation for the treatment of cancer. Cancer Res. 1996;56(6):1194–1198. | ||
Gao C, Liu T, Dang Y, et al. pH/redox responsive core cross-linked nanoparticles from thiolated carboxymethyl chitosan for in vitro release study of methotrexate. Carbohydr Polym. 2014;111:964–970. | ||
Schafer FQ, Buettner GR. Redox environment of the cell as viewed through the redox state of the glutathione disulfide/glutathione couple. Free Radic Biol Med. 2001;30(11):1191–1212. | ||
Chen Y, Ye D, Wu M, et al. Break-up of two-dimensional MnO2 nanosheets promotes ultrasensitive pH-triggered theranostics of cancer. Adv Mater. 2014;26(41):7019–7026. | ||
Fan H, Zhao Z, Yan G, et al. A smart DNAzyme-MnO2 nanosystem for efficient gene silencing. Angew Chem Int Ed Engl. 2015;54(16):4801–4805. | ||
Na HB, Lee JH, An KJ, et al. Development of a T-1 contrast agent for magnetic resonance imaging using MnO nanoparticles. Angew Chem Int Ed Engl. 2007;46(28):5397–5401. | ||
Letourneau M, Tremblay M, Faucher L, et al. MnO-labeled cells: positive contrast enhancement in MRI. J Phys Chem B. 2012;116(44):13228–13238. | ||
Zhu W, Liu K, Sun X, et al. Mn-doped Prussian blue nanocubes for bimodal imaging and photothermal therapy with enhanced performance. ACS Appl Mater Interfaces. 2015;21(7):11575–11582. | ||
Meng HM, Lu L, Zhao XH, et al. Multiple functional nanoprobe for contrast-enhanced bimodal cellular imaging and targeted therapy. Anal Chem. 2015;87(8):4448–4454. | ||
Zhao Z, Fan H, Zhou G, et al. Activatable fluorescence/MRI bimodal platform for tumor cell imaging via MnO2 nanosheet-aptamer nanoprobe. J Am Chem Soc. 2014;136(32):11220–11223. | ||
Chen Y, Yin Q, Ji X, et al. Manganese oxide-based multifunctionalized mesoporous silica nanoparticles for pH-responsive MRI, ultrasonography and circumvention of MDR in cancer cells. Biomaterials. 2012;33(29):7126–7137. | ||
Amin A, Buratovich MA. New platinum and ruthenium complexes – the latest class of potential chemotherapeutic drugs – a review of recent developments in the field. Mini Rev Med Chem. 2009;9(13):1489–1503. | ||
Zhang Y, Wang X, Guo M, Yan H, Wang C, Liu K. Cisplatin-loaded polymer/magnetite composite nanoparticles as multifunctional therapeutic nanomedicine. Chin J Polym Sci. 2014;32(10):1329–1337. | ||
Zhou X, Wang J, Wu J, et al. Preparation and evaluation of a novel liposomal formulation of cisplatin. Eur J Pharm Sci. 2014;66C:90–95. | ||
Tran TH, Choi JY, Ramasamy T, et al. Hyaluronic acid-coated solid lipid nanoparticles for targeted delivery of vorinostat to CD44 overexpressing cancer cells. Carbohydr Polym. 2014;114:407–415. | ||
Shi J, Ma R, Wang L, et al. The application of hyaluronic acid-derivatized carbon nanotubes in hematoporphyrin monomethyl ether-based photodynamic therapy for in vivo and in vitro cancer treatment. Int J Nanomedicine. 2013;8:2361–2373. | ||
Yuan Y, Wu S, Shu F, Liu Z. An MnO2 nanosheet as a label-free nanoplatform for homogeneous biosensing. Chem Commun (Camb). 2014;50(9):1095–1097. | ||
Barar J, Kafil V, Majd MH, et al. Multifunctional mitoxantrone-conjugated magnetic nanosystem for targeted therapy of folate receptor-overexpressing malignant cells. J Nanobiotechnology. 2015;13(1):26. | ||
Wang L, Hao Y, Li H, et al. Co-delivery of doxorubicin and siRNA for glioma therapy by a brain targeting system: angiopep-2-modified poly(lactic-co-glycolic acid) nanoparticles. J Drug Target. 2015;23(9):832–846. | ||
Sasaki T. Fabrication of nanostructured functional materials using exfoliated nanosheets as a building block. J Ceram Soc Jpn. 2007;115(1337):9–16. | ||
Selvakumar K, Senthil Kumar SM, Thangamuthu R, Kruthika G, Murugan P. Development of shape-engineered α-MnO2 materials as bi-functional catalysts for oxygen evolution reaction and oxygen reduction reaction in alkaline medium. Int J Hydrogen Energy. 2014;39(36):21024–21036. | ||
Pradhan R, Ramasamy T, Choi JY, et al. Hyaluronic acid-decorated poly(lactic-co-glycolic acid) nanoparticles for combined delivery of docetaxel and tanespimycin. Carbohydr Polym. 2015;123:313–323. | ||
Liao YH, Jones SA, Forbes B, Martin GP, Brown MB. Hyaluronan: pharmaceutical characterization and drug delivery. Drug Deliv. 2005;12(6):327–342. | ||
Scott JE, Heatley F. Biological properties of hyaluronan in aqueous solution are controlled and sequestered by reversible tertiary structures, defined by NMR spectroscopy. Biomacromolecules. 2002;3(3):547–553. | ||
He D, He X, Wang K, et al. Redox-responsive degradable honeycomb manganese oxide nanostructures as effective nanocarriers for intracellular glutathione-triggered drug release. Chem Commun (Camb). 2015;51(4):776–779. | ||
Luo X, Zhang L. New solvents and functional materials prepared from cellulose solutions in alkali/urea aqueous system. Food Res Intern. 2013;52(1):387–400. | ||
McGrane SJ, Mainwaring DE, Cornell HJ, Rix CJ. The role of hydrogen bonding in amylose gelation. Starch-Stärke. 2004;56(3–4):122–131. | ||
Gatej I, Popa M, Rinaudo M. Role of the pH on hyaluronan behavior in aqueous solution. Biomacromolecules. 2005;6(1):61–67. | ||
Lowry KM, Beavers EM. Thermal stability of sodium hyaluronate in aqueous solution. J Biomed Mater Res. 1994;28(10):1239–1244. | ||
Ahmad Z, Tang Z, Shah A, et al. Cisplatin loaded methoxy poly (ethylene glycol)-block-Poly (L-glutamic acid-co-L-phenylalanine) nanoparticles against human breast cancer cell. Macromol Biosci. 2014;14(9):1337–1345. | ||
Murakami T, Baron RL, Peterson MS, et al. Hepatocellular carcinoma: MR imaging with mangafodipir trisodium (Mn-DPDP). Radiology. 1996;200(1):69–77. | ||
Lee JH, Silva AC, Merkle H, Koretsky AP. Manganese-enhanced magnetic resonance imaging of mouse brain after systemic administration of MnCl2: dose-dependent and temporal evolution of T1 contrast. Magn Reson Med. 2005;53(3):640–648. | ||
Rohrer M, Bauer H, Mintorovitch J, Requardt M, Weinmann HJ. Comparison of magnetic properties of MRI contrast media solutions at different magnetic field strengths. Invest Radiol. 2005;40(11):715–724. | ||
Horibe S, Matsuda A, Tanahashi T, et al. Cisplatin resistance in human lung cancer cells is linked with dysregulation of cell cycle associated proteins. Life Sci. 2015;124:31–40. | ||
Zhang W, Qiao L, Wang X, Senthilkumar R, Wang F, Chen B. Inducing cell cycle arrest and apoptosis by dimercaptosuccinic acid modified Fe3O4 magnetic nanoparticles combined with nontoxic concentration of bortezomib and gambogic acid in RPMI-8226 cells. Int J Nanomedicine. 2015;10:3275–3289. | ||
Ferguson EL, Alshame AM, Thomas DW. Evaluation of hyaluronic acid-protein conjugates for polymer masked-unmasked protein therapy. Int J Pharm. 2010;402(1):95–102. | ||
Dosio F, Arpicco S, Stella B, Fattal E. Hyaluronic acid for anticancer drug and nucleic acid delivery. Adv Drug Deliv Rev. 2016;97:204–236. | ||
Mizrahy S, Raz SR, Hasgaard M, et al. Hyaluronan-coated nanoparticles: the influence of the molecular weight on CD44-hyaluronan interactions and on the immune response. J Control Release. 2011;156(2):231–238. | ||
Prasad P, Gordijo CR, Abbasi AZ, et al. Multifunctional albumin-MnO(2) nanoparticles modulate solid tumor microenvironment by attenuating hypoxia, acidosis, vascular endothelial growth factor and enhance radiation response. ACS Nano. 2014;8(4):3202–3212. | ||
Dong Z, Atherton SS. Tumor necrosis factor-alpha in cisplatin nephrotoxicity: a homebred foe? Kidney Int. 2007;72(1):5–7. |
Supplementary materials
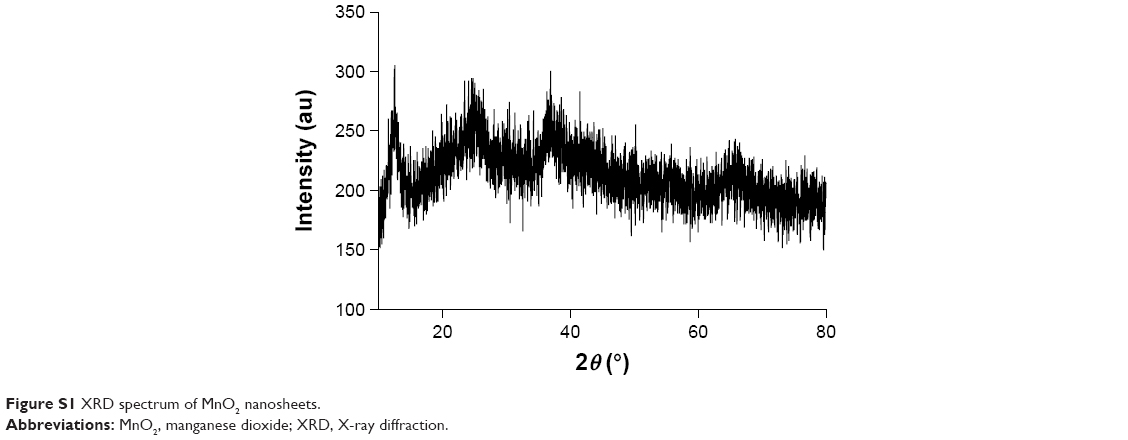 | Figure S1 XRD spectrum of MnO2 nanosheets. |
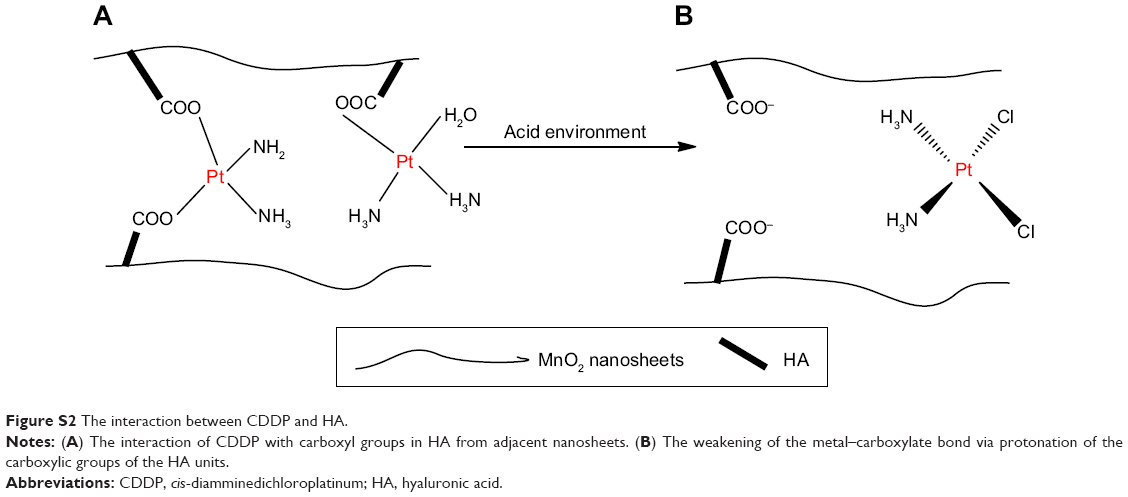 | Figure S2 The interaction between CDDP and HA. |
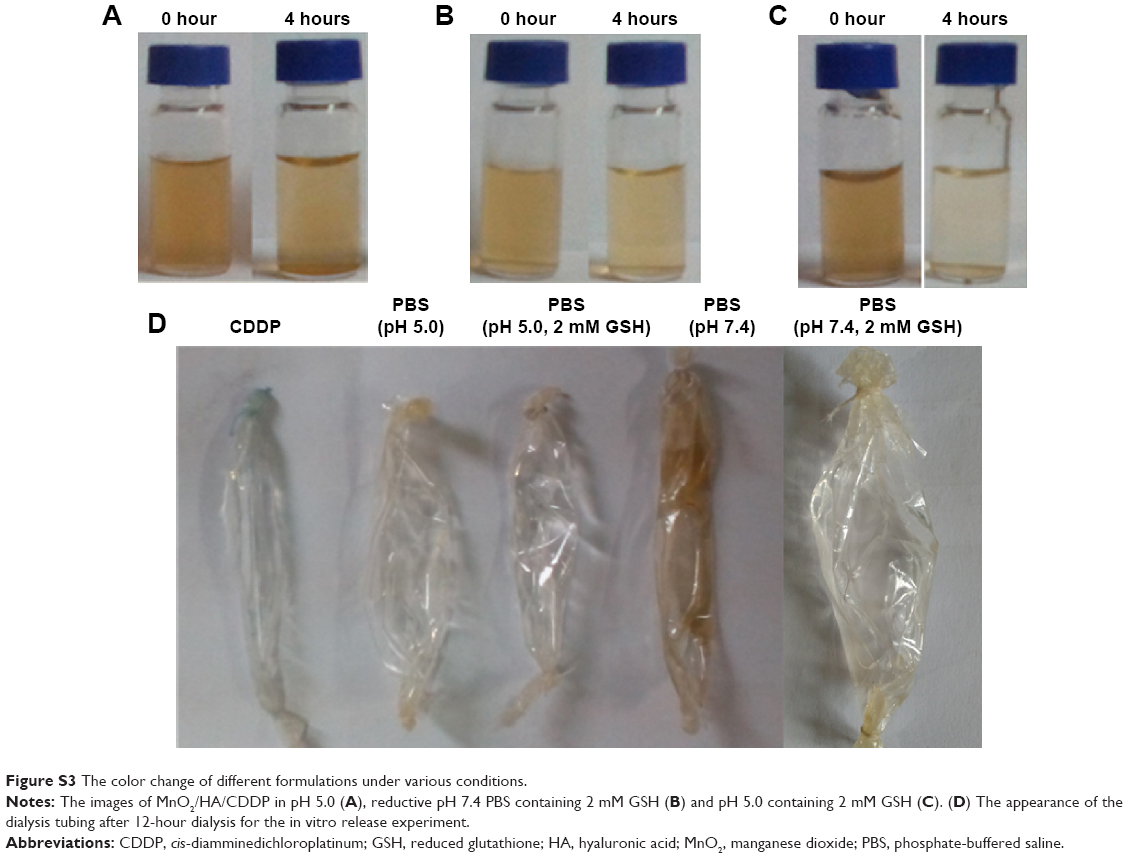 | Figure S3 The color change of different formulations under various conditions. |
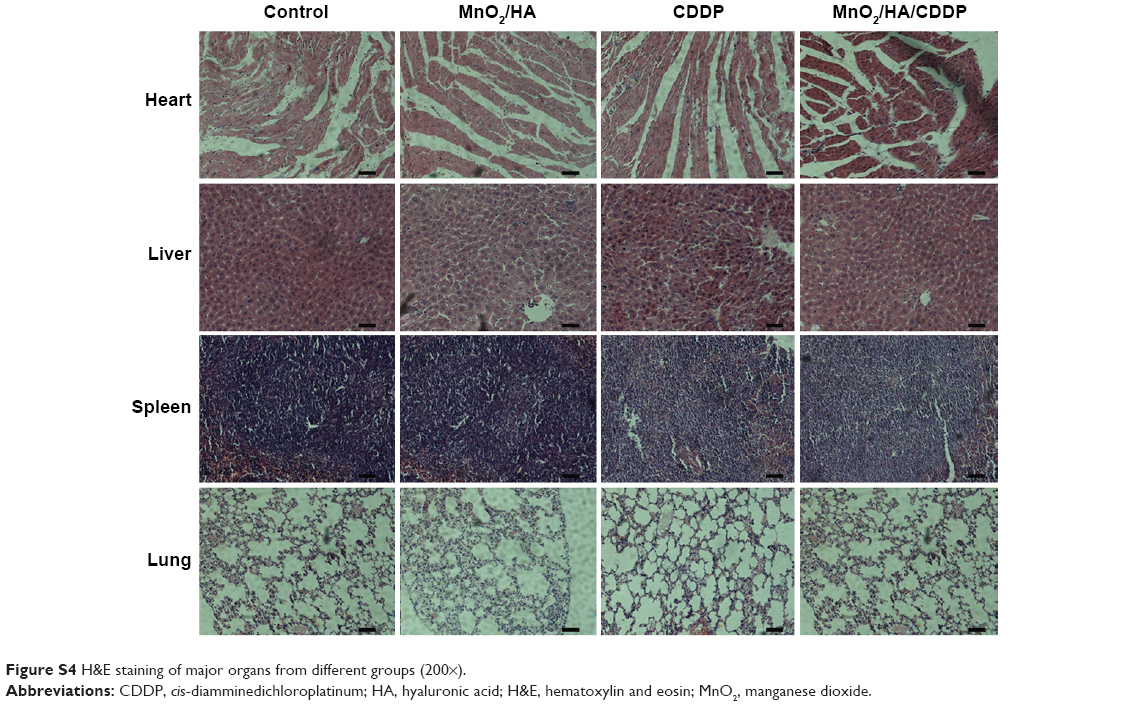 | Figure S4 H&E staining of major organs from different groups (200×). |
 © 2016 The Author(s). This work is published and licensed by Dove Medical Press Limited. The
full terms of this license are available at https://www.dovepress.com/terms
and incorporate the Creative Commons Attribution
- Non Commercial (unported, 3.0) License.
By accessing the work you hereby accept the Terms. Non-commercial uses of the work are permitted
without any further permission from Dove Medical Press Limited, provided the work is properly
attributed. For permission for commercial use of this work, please see paragraphs 4.2 and 5 of our Terms.
© 2016 The Author(s). This work is published and licensed by Dove Medical Press Limited. The
full terms of this license are available at https://www.dovepress.com/terms
and incorporate the Creative Commons Attribution
- Non Commercial (unported, 3.0) License.
By accessing the work you hereby accept the Terms. Non-commercial uses of the work are permitted
without any further permission from Dove Medical Press Limited, provided the work is properly
attributed. For permission for commercial use of this work, please see paragraphs 4.2 and 5 of our Terms.