Back to Journals » ClinicoEconomics and Outcomes Research » Volume 12
Malnutrition Prevalence and Burden on Healthcare Resource Use Among Spanish Community-Living Older Adults: Results of a Longitudinal Analysis
Authors Rodríguez-Sánchez B ![]() , Sulo S
, Sulo S ![]() , Carnicero JA
, Carnicero JA ![]() , Rueda R
, Rueda R ![]() , Rodríguez-Mañas L
, Rodríguez-Mañas L
Received 2 April 2020
Accepted for publication 6 June 2020
Published 13 July 2020 Volume 2020:12 Pages 355—367
DOI https://doi.org/10.2147/CEOR.S256671
Checked for plagiarism Yes
Review by Single anonymous peer review
Peer reviewer comments 2
Editor who approved publication: Professor Giorgio Colombo
Beatriz Rodríguez-Sánchez,1 Suela Sulo,2 José Antonio Carnicero,3 Ricardo Rueda,4 Leocadio Rodríguez-Mañas3,5
1Faculty of Law and Social Sciences, Universidad de Castilla-La Mancha, Toledo, Spain; 2Abbott Nutrition, Chicago, IL, USA; 3Fundación de Investigación Biomédica, Hospital Universitario de Getafe, Getafe, Spain; 4Abbott Nutrition, Granada, Spain; 5Geriatric Department, Hospital Universitario de Getafe, Getafe, Spain
Correspondence: Beatriz Rodríguez-Sánchez
Department of Economic Analysis and Finance; Faculty of Social Sciences and Law, University of Castilla La Mancha, Cobertizo De San Pedro Mártir s/n, 45071 Toledo, Spain
Email [email protected]
Purpose: Little is known about the economic burden that malnutrition or its risk imposes on community-dwelling older adults. Using cross-sectional and longitudinal analyses, we assessed the impact of malnutrition risk on healthcare utilization and costs in a cohort of older adults living in Spanish community.
Patients and Methods: Data from 1660 older (range 66– 98 years), community-living adults participating in the Toledo Study on Healthy Ageing, waves 2 (year 2011– 2013) and 3 (year 2015), were analyzed. Nutritional status categories were defined according to the Global Leadership Initiative on Malnutrition (GLIM) criteria, using a two-step approach. First, screening for malnutrition risk. Once positive, individuals were classified as malnourished according to some phenotypic (body mass index, grip strength, and unintentional weight loss) and etiologic (disease burden/inflammation and reduced food intake or assimilation) criteria. Outcomes assessed included healthcare resources (hospital admissions, number of hospitalizations, length of hospital stay per hospitalization, and number of medications).
Results: Fifteen percent of the population was found to be at risk of malnutrition, while 12.6% was malnourished. Overall, patients from both groups were older, had lower functional status, and had more comorbidities compared to well-nourished counterparts (p< 0.05). Results of our cross-sectional analysis showed that being at-risk/malnourished was associated with greater medication utilization, higher rates of hospital admission and longer stays, and higher hospitalization costs. However, when adjusting for covariates, malnutrition/risk was associated only with higher hospitalization costs (range: 11– 13%). Longitudinal analysis results indicated that malnutrition/risk was significantly associated with more frequent hospitalizations, longer lengths of stay, higher hospitalization costs, and polypharmacy at follow-up.
Conclusion: Malnutrition or its risk, found in over one of four older adults in the Toledo community, was associated with higher healthcare resource use and increased costs. Such findings suggest that malnutrition risk-screening for older adults, and provision of nutrition counseling and care when needed, hold potential to improve their health and to lower costs of care in the Spanish healthcare system.
Keywords: malnutrition prevalence, healthcare resource use, costs, oral nutritional supplements, ONS, older adults, community, Spain
Introduction
With older age, a common challenge is declining nutritional status, which is associated with effects of chronic diseases and their treatment medications on appetite and on nutrient utilization, along with socioeconomic limits such as inadequate food access, preparation abilities, and unaffordability.1 Older adults are a growing segment of the population in most countries,2 so malnutrition risk is likewise a growing concern. Despite guidelines on nutrition screening and care for older people,3 poor nutritional status is too often overlooked or undertreated4,5 and can result in worse health outcomes and higher treatment costs. Healthcare costs of disease-related malnutrition in older people are substantial6 and are expected to rise even higher as the proportion of older people in the population increases.
Malnutrition or its risk, notably undernutrition in this study, refers to a state resulting from lack of uptake or intake of nutrition causing altered body composition (decreased body mass and body cell mass), leading to diminished physical and mental function and impaired outcome from disease.7 Negative consequences of poor nutritional status on older adults in hospitals have long been recognized for clinical,8,9 functional,10 and economic11,13 outcomes. By contrast, data are generally more limited for older adults living in the community.1,4,14-16 While studies of healthcare costs for community-living adults are gradually emerging,17–20 some of these studies included younger populations,17–19 and others were specific to nursing home populations.20 Additionally, such studies generally use cross-sectional study designs, which cannot predict longer-term consequences of poor nutritional status on patient health and economic outcomes.
We therefore sought to increase the knowledge base about the nutritional status of older, community-living adults in Spain. Our research used a longitudinal study design to explore the effect of poor nutritional status on health and economic outcomes. Nutritional status categories were defined according to the Global Leadership Initiative on Malnutrition (GLIM), which aim to standardize the assessment of malnutrition status by adopting global consensus criteria so that malnutrition prevalence, interventions and outcomes may be compared throughout the world.21 We hypothesized that at-risk/malnourished subjects would experience higher healthcare resource use and greater costs than their well-nourished counterparts. We specifically assessed use of healthcare resources (hospital admissions, number of hospitalizations, length of hospital stay per hospitalization, and number of medications).
Patients and Methods
Patient Demographics and Description
Our analysis used data from the Toledo Study on Healthy Ageing (TSHA). TSHA is a population-based longitudinal study containing information on adults ≥ 65 years who were institutionalized (2% of the whole sample) or community-dwelling (approximately 98% of the surveyed subjects) in the province of Toledo, Spain. TSHA study findings have been reported elsewhere.22,23 The study was approved by the Ethical Review Board of the Hospital Virgen del Valle (Toledo) and the Hospital Universitario de Getafe. Participants provided informed consent for the original study by signing a consent form, while a waiver of consent was used for this analysis.
In our present analysis, we used baseline data from individuals participating in TSHA wave 2 (N=2336) and collected between 2011 and 2013. Longitudinal outcomes were taken from the wave 3 data collection (year 2015). Of participants from wave 2 (N=2336), nearly 80% were still alive in wave 3 (N=1844); 264 had died, but only 228 could be followed in wave 3 for other reasons. The mean follow-up time for all eligible participants was 3.18 years (165 weeks).
Nutritional Status, Hospitalization Outcomes, and Other Measures
For this study, nutritional status categories (well-nourished (WN), at malnutritional risk (AMR) or malnourished (MN)) were defined using published criteria,21 and by applying a two-step approach. In the first step, we screened individuals for malnutrition risk using the Mini-Nutritional Assessment-Short Form (MNA-SF),24 and classified individuals as either WN or AMR. Those considered AMR were assessed for malnutrition and diagnosed as MN if they met at least one etiologic and one phenotypic criterion from the list below:
Phenotypic criteria
a) Body mass index (BMI), (weight in kilograms (kg)/square of height in meters (m)), below 20 kg/m2 when the individual is younger than 70 years old or BMI below 22 kg/m2 when the age is equal to or higher than 70 years old.
b) Non-volitional weight loss, defined as unintentional weight loss of, at least, 5% during the previous six months.
c) Reduced handgrip strength, defined as being below 30.4 kg for men or 19.8 kg for women, as a supporting measure of reduced muscle mass.
Etiologic criteria
d) Reduced food intake or assimilation, as assessed by MNA-SF and the questions about protein-intake of the PREDIMED questionnaire.25
e) Disease burden or inflammation, including heart failure, dementia, malignant disease, chronic obstructive pulmonary disease, congestive heart failure, chronic kidney disease, and diabetes.
After applying nutrition status criteria to the original study sample, we only included individuals with complete data for all variables (N=1660, Table 1).
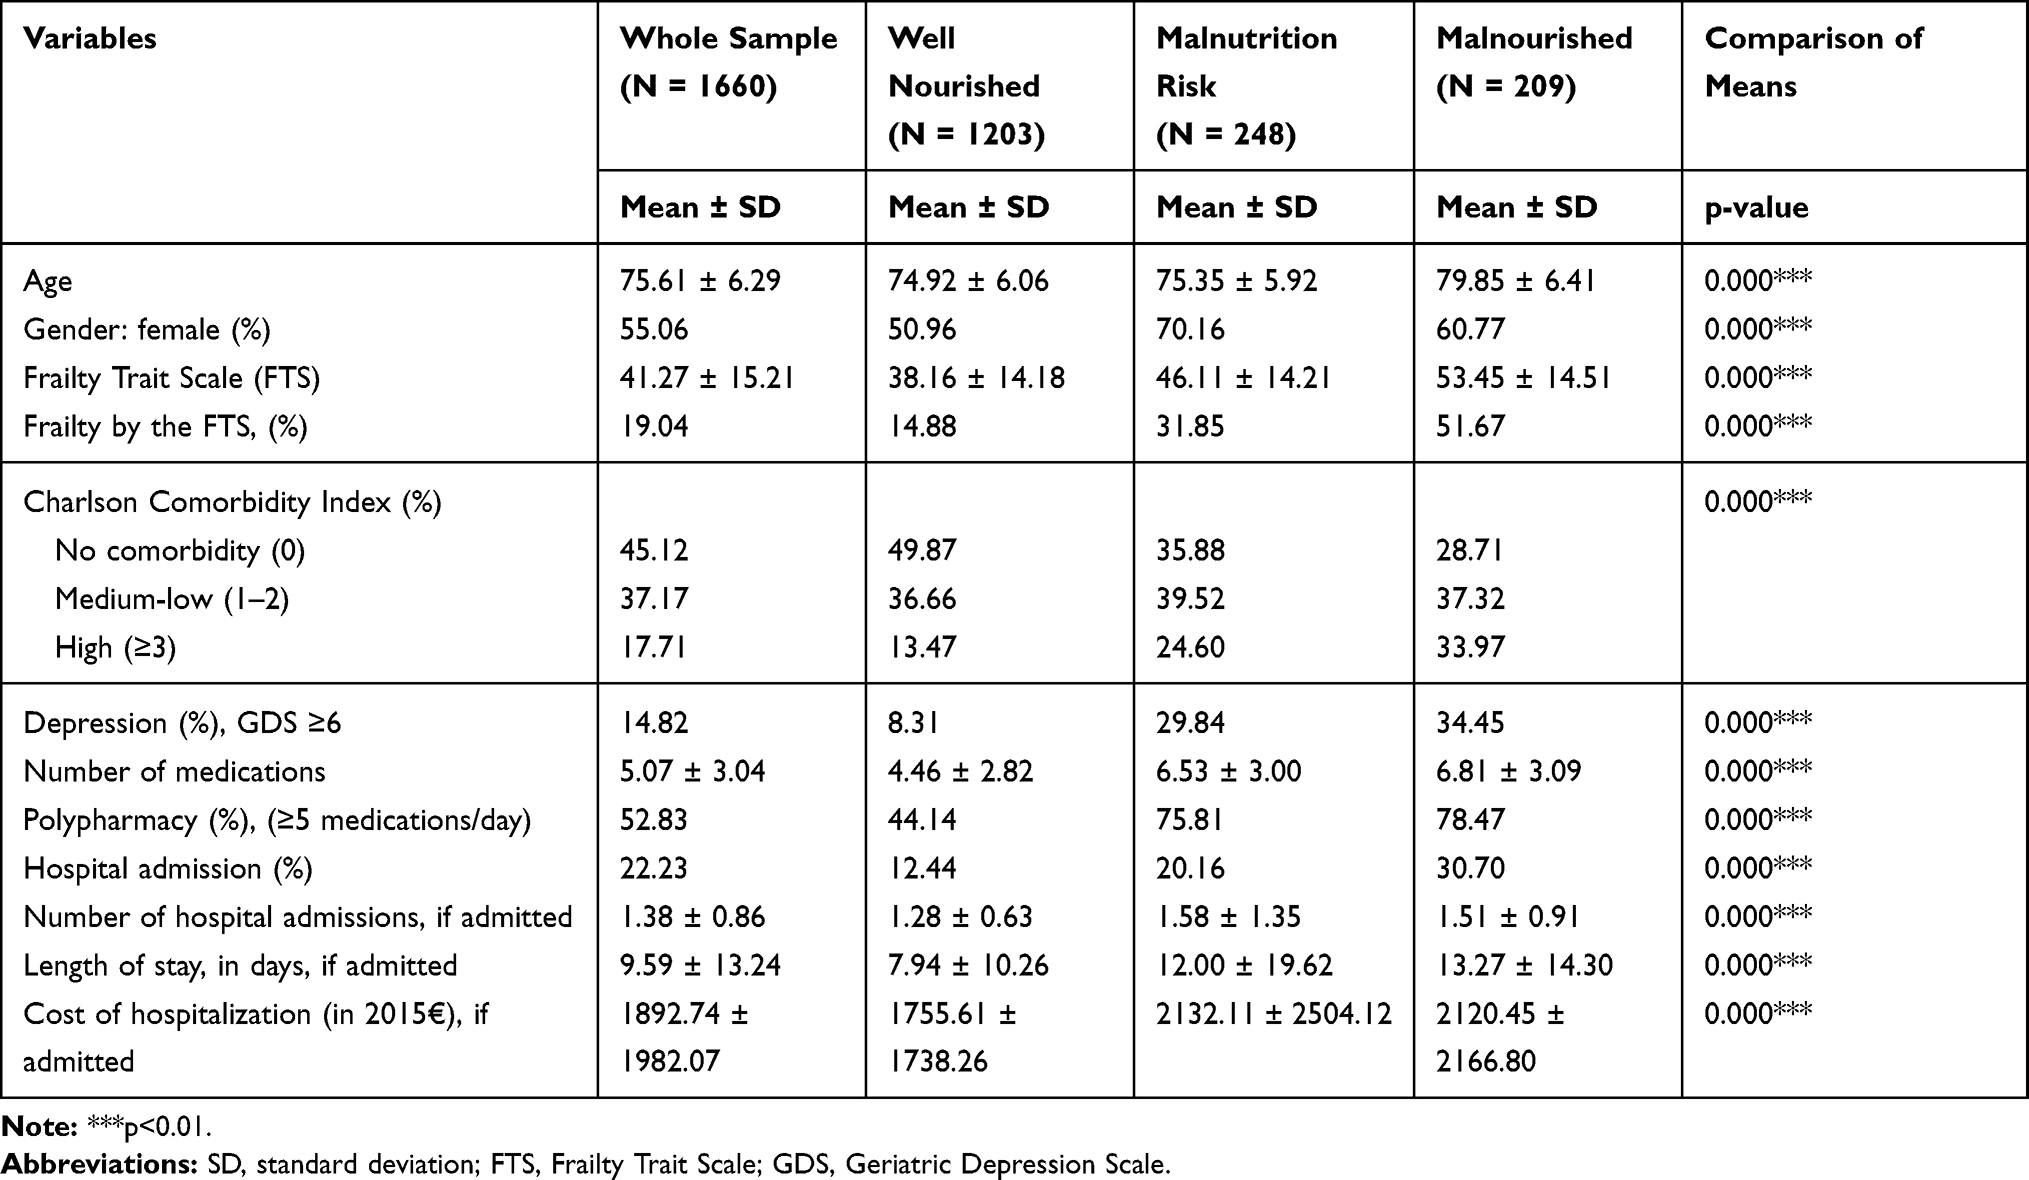 |
Table 1 Summary Statistics for the Total Sample and by Nutritional Status at Baseline (Wave 2) |
For hospitalization outcomes, we used three measures: (i) having been admitted to hospital and stayed overnight; (ii) number of hospitalization episodes during the previous 12 months; and (iii) mean length of stay per hospital admission, in days. In order to estimate hospitalization costs, we used data from each survey respondent during the previous 12 months (for the cross-sectional analyses) and during the follow-up period (for the longitudinal analyses) from hospital clinical records and we subsequently estimated the cost per person and per year in Euros (€). The unit cost for each Diagnostic Related Group (DRG), obtained from a national data source (National Ministry of Health, Consumption and Social Wellbeing),26 was multiplied by the number of times subjects were admitted to hospital for each DRG. All costs were expressed in 2015 Euros. Moreover, the number of medications taken daily, as self-reported and checked with medical records, was also used as an outcome measure in the current analysis. All the aforementioned outcomes were measured at baseline (wave 2) for cross-sectional analysis and at follow-up (wave 3) to accommodate the longitudinal analysis.
Other factors were also included, such as depression status (Geriatric Depression Scale, GDS, score ≥6),27 polypharmacy as daily use of ≥5 medications (considered a hospital-related outcome) and frailty by the Frailty Trait Score (FTS).22 We also used the Charlson Comorbidity Index (CCI), categorized into three different groups:6,28 i) no comorbidity if the score equaled zero; ii) low-medium comorbidity if the Charlson score was 1 or 2; and iii) high comorbidity if the score was ≥3.
Statistical Analyses
Summary statistics were presented as mean (± standard deviation) for continuous variables and as number and percent for binary variables. Differences between groups were tested via Mann–Whitney or Chi-square test, as appropriate depending on data distribution. Given the substantial proportion of zeros within the number of hospital admissions (and number of hospitalizations, length of stay, and hospitalization costs) and number of medications, two-part regression models were run for the aforementioned outcomes. Separate analyses were performed for cross-sectional and longitudinal analysis. The former was used to assess any association between nutritional status and healthcare resource measures within the same time point. The latter was used to evaluate whether nutritional status predicted healthcare use at follow-up (about 3 years), taking the values of the independent variables at baseline (wave 2), and the outcome in the following wave (wave 3).
We used a two-part regression model in which a binary choice model is fit for the probability of observing a positive-versus-zero outcome.29 Then, conditional on a positive outcome, an appropriate regression model is fit for the positive outcome. The two parts were: (1) a logit model for the binary response variable (first stage), where a value of 1 was assigned if the individual was admitted to hospital at least once or used at least one medication daily versus a value of 0 if the patient had no hospitalizations or used no medications, and (2) a model for the outcome variable that depended on the binary response (admitted to hospital/taking any medications).29 After first-stage analysis using logit estimation techniques, the second stage involved a Generalized Linear Model (GLM) with Poisson distribution for number of hospital admissions, length of stay, and number of medications, and a gamma distribution and log-link if costs of hospitalization were assessed.30 In these models, nutritional status was the only explanatory variable included.
In another regression model, age and gender were added, as well as 3 other categories: (1) comorbidity level by CCI; (2) being depressed according to the GDS; and (3) polypharmacy. In a third regression model, frailty by FTS was also incorporated. All analyses were performed using Stata SE version 15.0, and p values ≤ 0.05 were considered statistically significant.
Results
Summary Statistics
Characteristics of the full study population and characteristics by nutritional status at baseline (wave 2 of the TSHA), as well as healthcare resource use, are shown in Table 1. The mean age was 76 years old and 55% were females. With respect to the measurement of frailty, the mean FTS score was 41 points. As many as 45% of participants reported having no comorbidities, and the mean GDS score was 3.5 points, respectively. Of the whole sample, 53% were identified as polypharmacy users, with 5 as the mean number of medications taken on a regular basis.
Per nutritional status classification criteria, 72.5% of the whole sample were classified as WN, whereas 15% were identified as ARM and the remaining 12.6% were categorized as MN. Several differences were detected between the two groups. Of note, ARM and MN subjects were older than their WN counterparts (79.85 and 75.35 vs 74.92 years, p<0.001). Also, AMR and MN subjects had worse frailty status and were more likely to be depressed, while the WN group was more likely to include females and have no comorbidities.
In the overall sample, 22% of the individuals had been admitted to the hospital in the previous 12 months. Among admitted individuals, the mean length of stay was higher than 9 days and the mean hospitalization cost was nearly €1900. The proportion of patients who used more than 5 medications on a daily basis was higher in the AMR and MN groups compared to their WN counterparts (75.81% and 78.47% vs 44%, p<0.001). The AMR and MN patients were also more likely to have been admitted to the hospital than WN patients (20.16% and 30.70%, respectively, vs 12.44%, p<0.001), had longer lengths of stays (4 and 5 more days, on average per year, respectively, p<0.001), and higher annual hospitalization costs by approximately €400 (p<0.001).
Regression results for Cross-Sectional and Longitudinal Analyses
Cross-Sectional Analysis
Regression results on the cross-sectional analysis between nutritional status and other independent variables and hospital admission, number of hospitalizations, average length of stay per admission, costs, and number of medications taken during the same wave are reported in Tables 2 and 3.
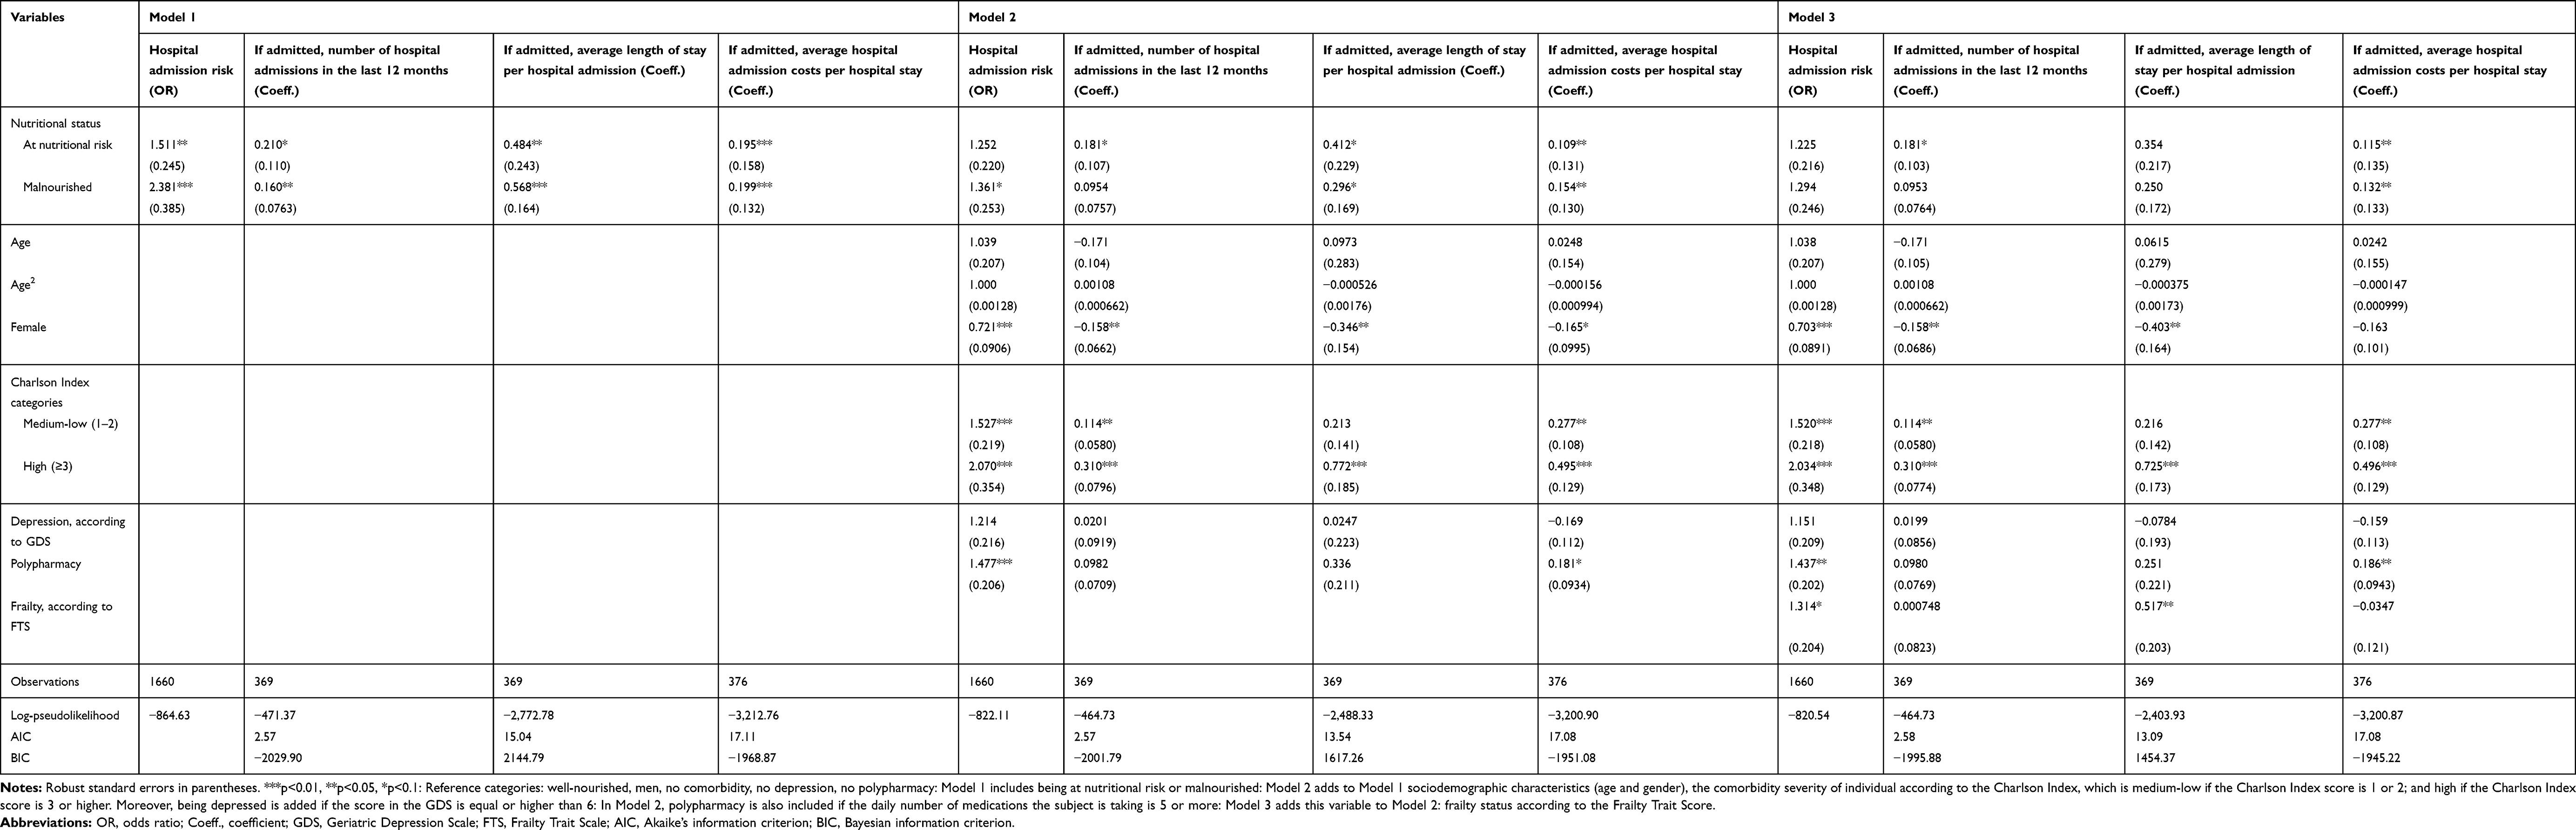 |
Table 2 Regression Results for the Cross-Sectional Analysis: Hospital Admission Outcomes |
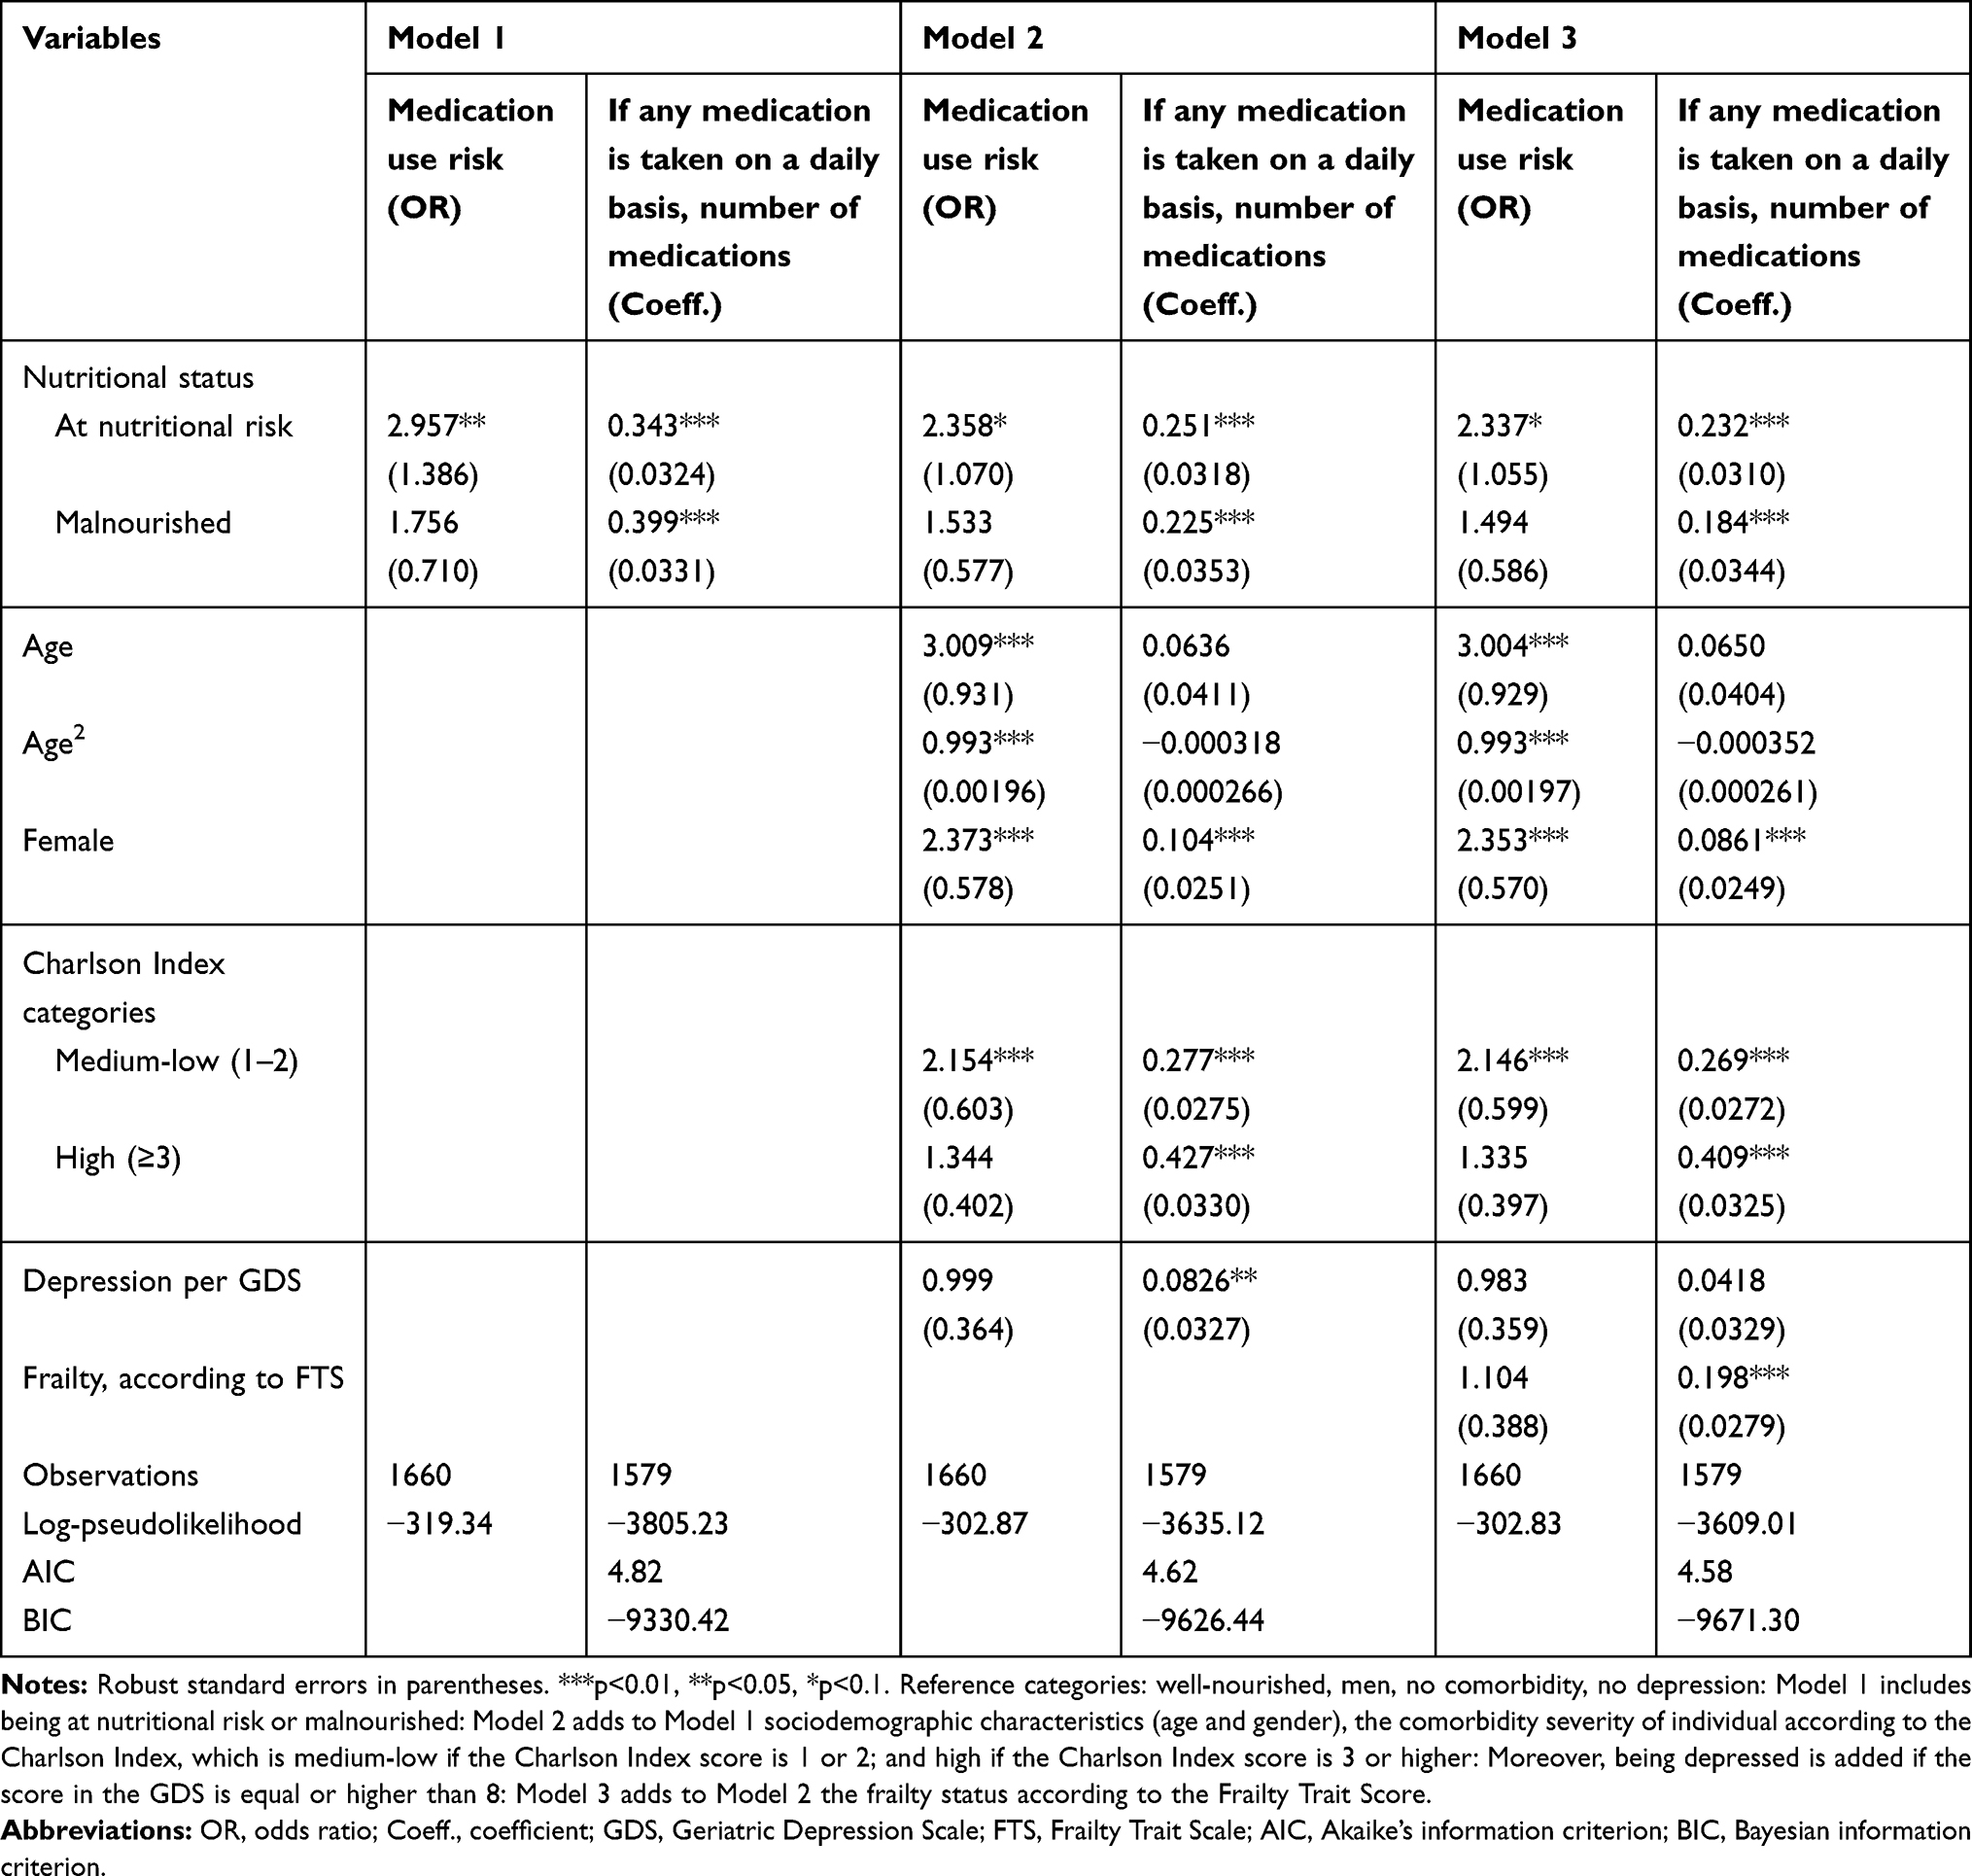 |
Table 3 Regression Results for the Cross-Sectional Analysis: Medications Use |
When nutritional status was the only independent variable included in the analysis (Model 1), being at-risk/malnourished was associated with an increase in the risk of being admitted to the hospital (OR=1.511 and OR=2.381 compared to WN individuals, Table 2). In model 1, AMR status was associated with a significantly longer average length of stay by 0.584 days (p<0.05). Further, being AMR was associated with increased costs for hospitalization (+19.5%) compared to WN counterparts. On the other hand, compared to WN patients, MN patients had significantly more hospital admissions (1.77 more, on average, per year) and with longer average length of stay per admission (0.728 more days [p<0.05]). Furthermore, being MN was associated with 20% higher hospitalization costs compared to WN individuals (p<0.05). However, when the variables of age and gender, comorbidities, depression, and number of medications were included (Model 2), nutritional status did not significantly alter the probability of having hospital admission or increase average length of stay. Still, being MN was associated with 15.4% higher hospital costs. Finally, when frailty was part of the analysis (Model 3), nutritional status was not significantly associated with risk of hospital admission, number of times admitted, or the average length of stay. In contrast, nutritional status was still significantly associated with hospital admission costs. In fact, being malnourished was associated with larger hospitalization costs by 13.2%, compared to WN individuals.
In Model 1, being malnourished was not significantly associated with the risk of taking any medications compared to WN individuals (Table 3), but being AMR was indeed significantly related to the risk of higher polypharmacy (OR=2.96). However, both nutritional status categories, compared to being WN, were significantly associated with the number of medications taken, which increased by 0.409 medications in case of being AMR and by 0.49 if MN (p<0.05). However, if age and gender, comorbidities, and depression were included (Model 2), nutritional status was not associated with the probability of taking any medications. Such non-significant relationship remained in Model 3, when frailty was added to the analysis. But, being AMR or MN were always associated with a higher number of medications taken on a daily basis, which ranged from 0.261 (Model 3) to 0.285 (Model 2) if AMR, and from 0.202 to 0.252 when MN, respectively.
Longitudinal Analysis
For longitudinal analyses, regression results on the association between nutritional status at baseline, as well as other independent variables, on the outcomes at follow-up (hospital admission, number of hospitalizations, average length of stay per admission, costs, and number of medications taken) are shown in Tables 4 and 5.
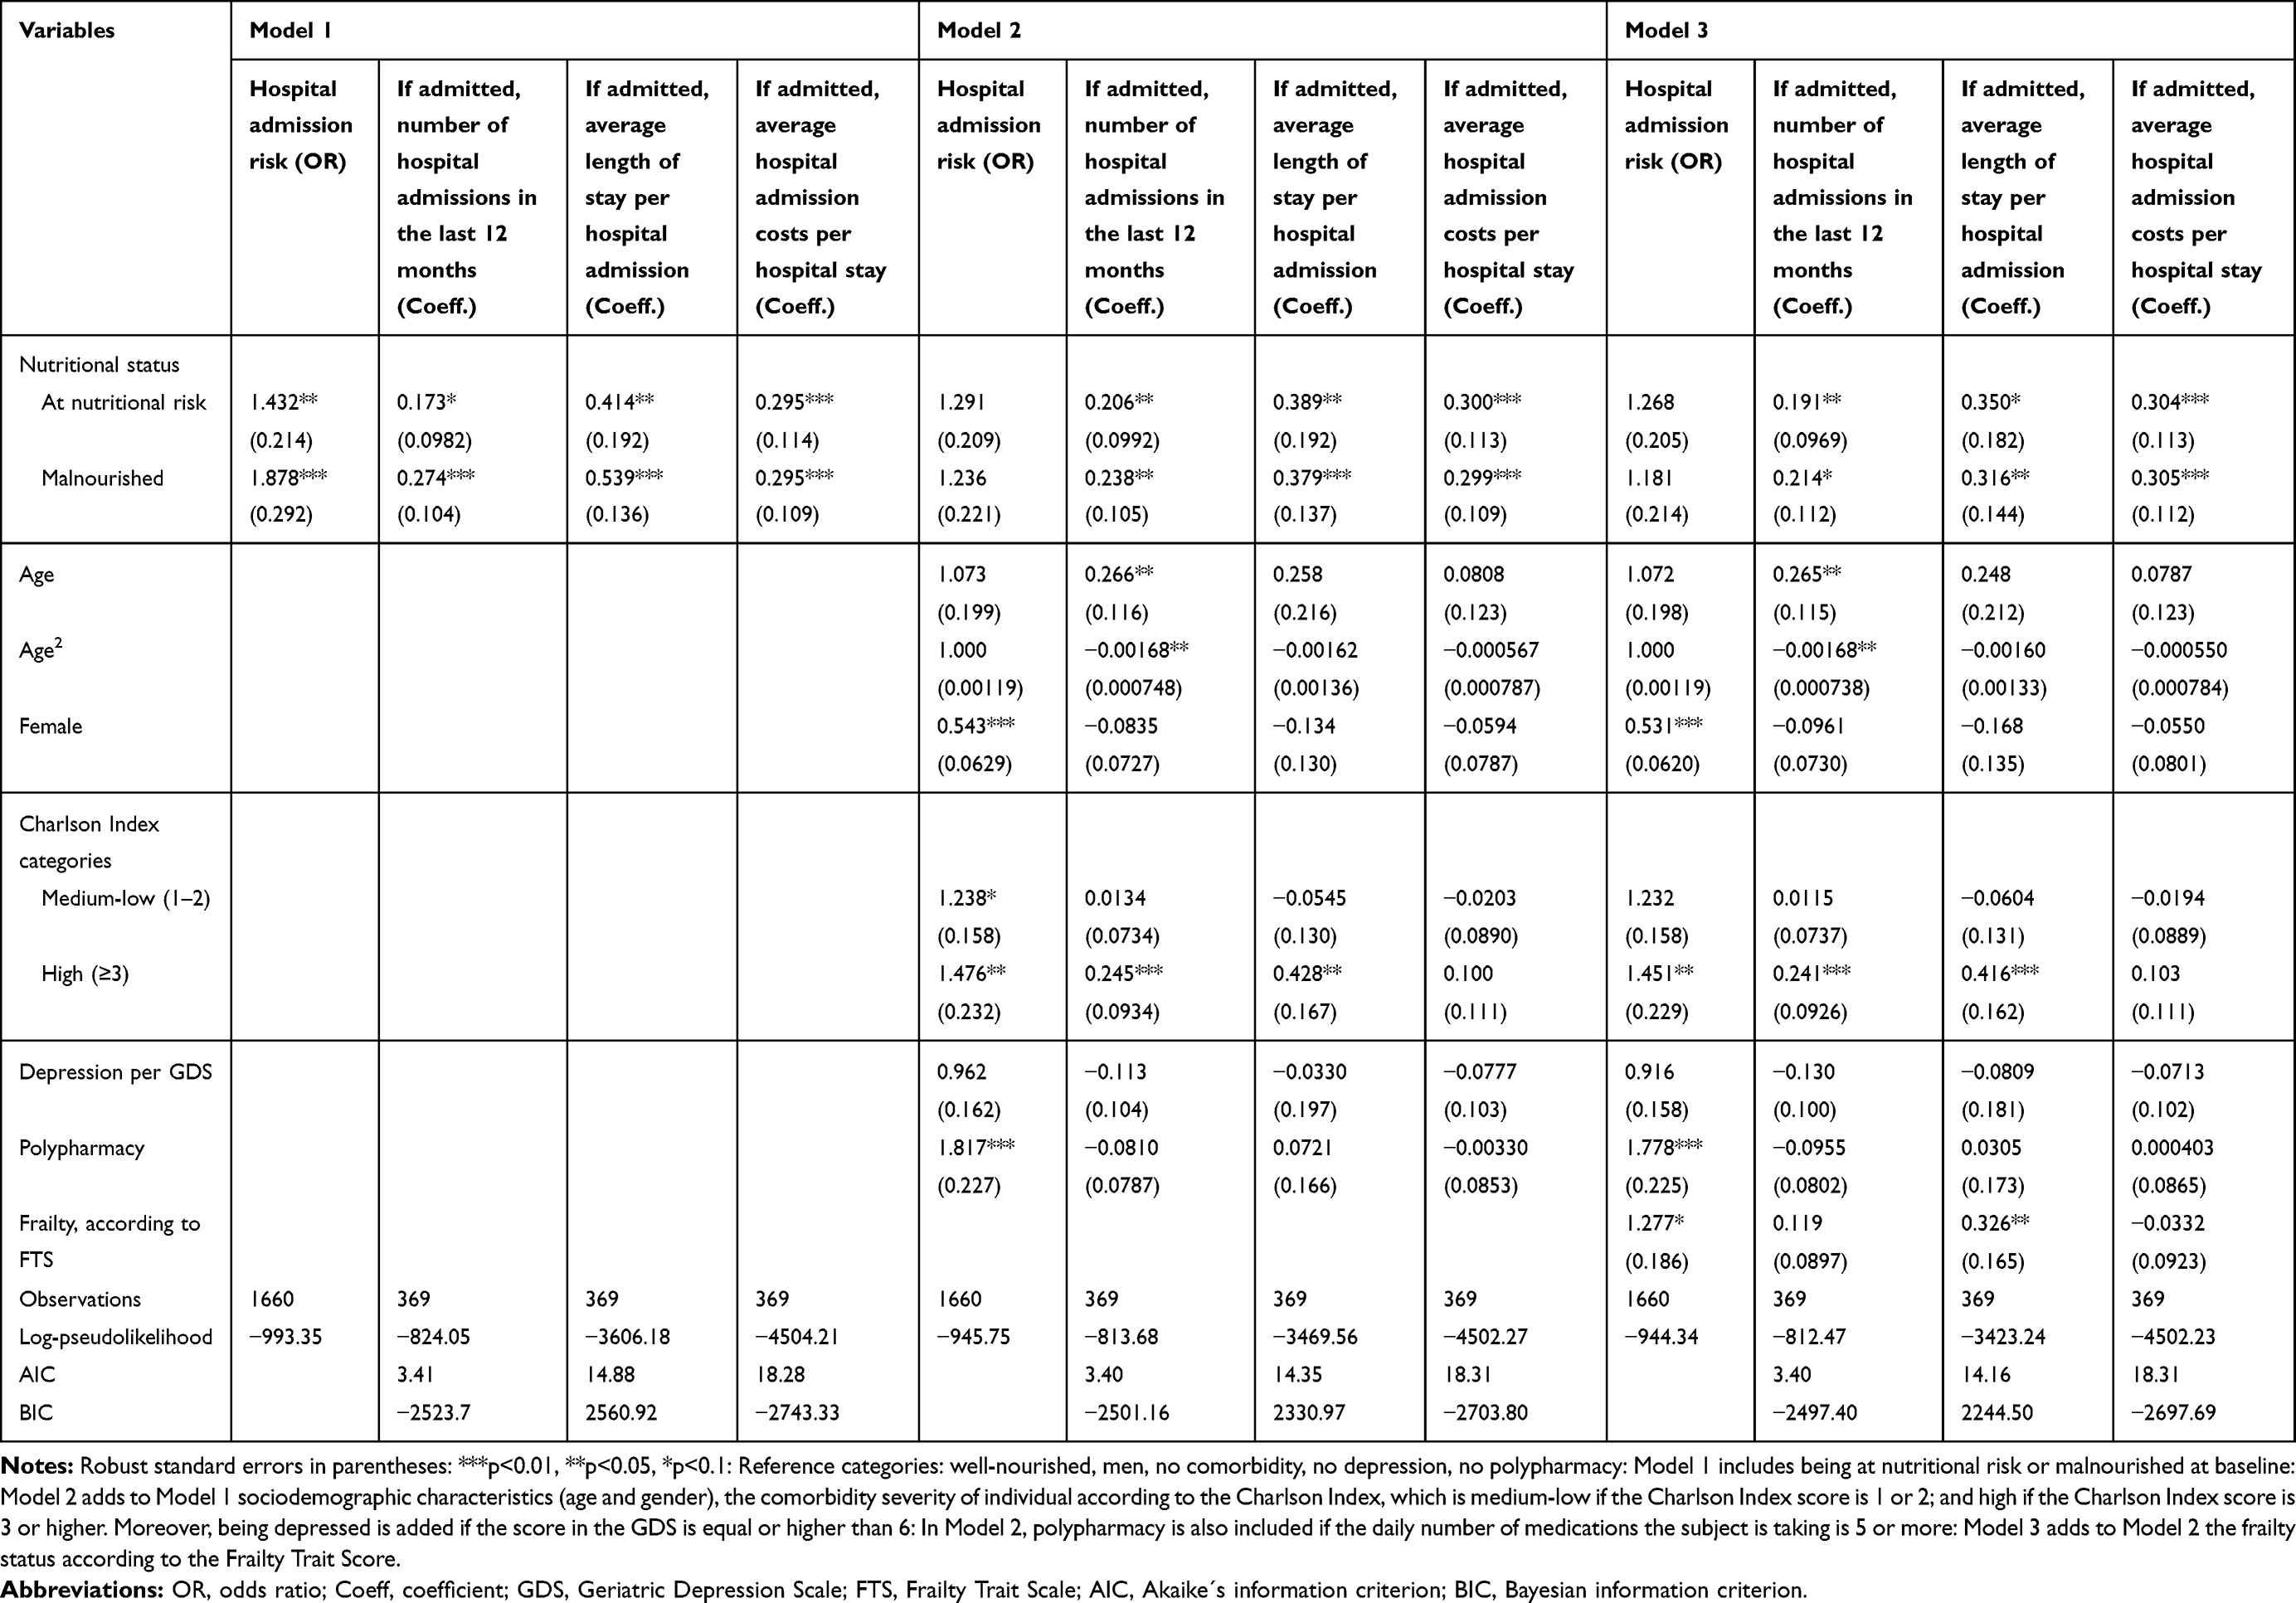 |
Table 4 Regression Results for the Longitudinal Analysis: Hospitalization Outcomes |
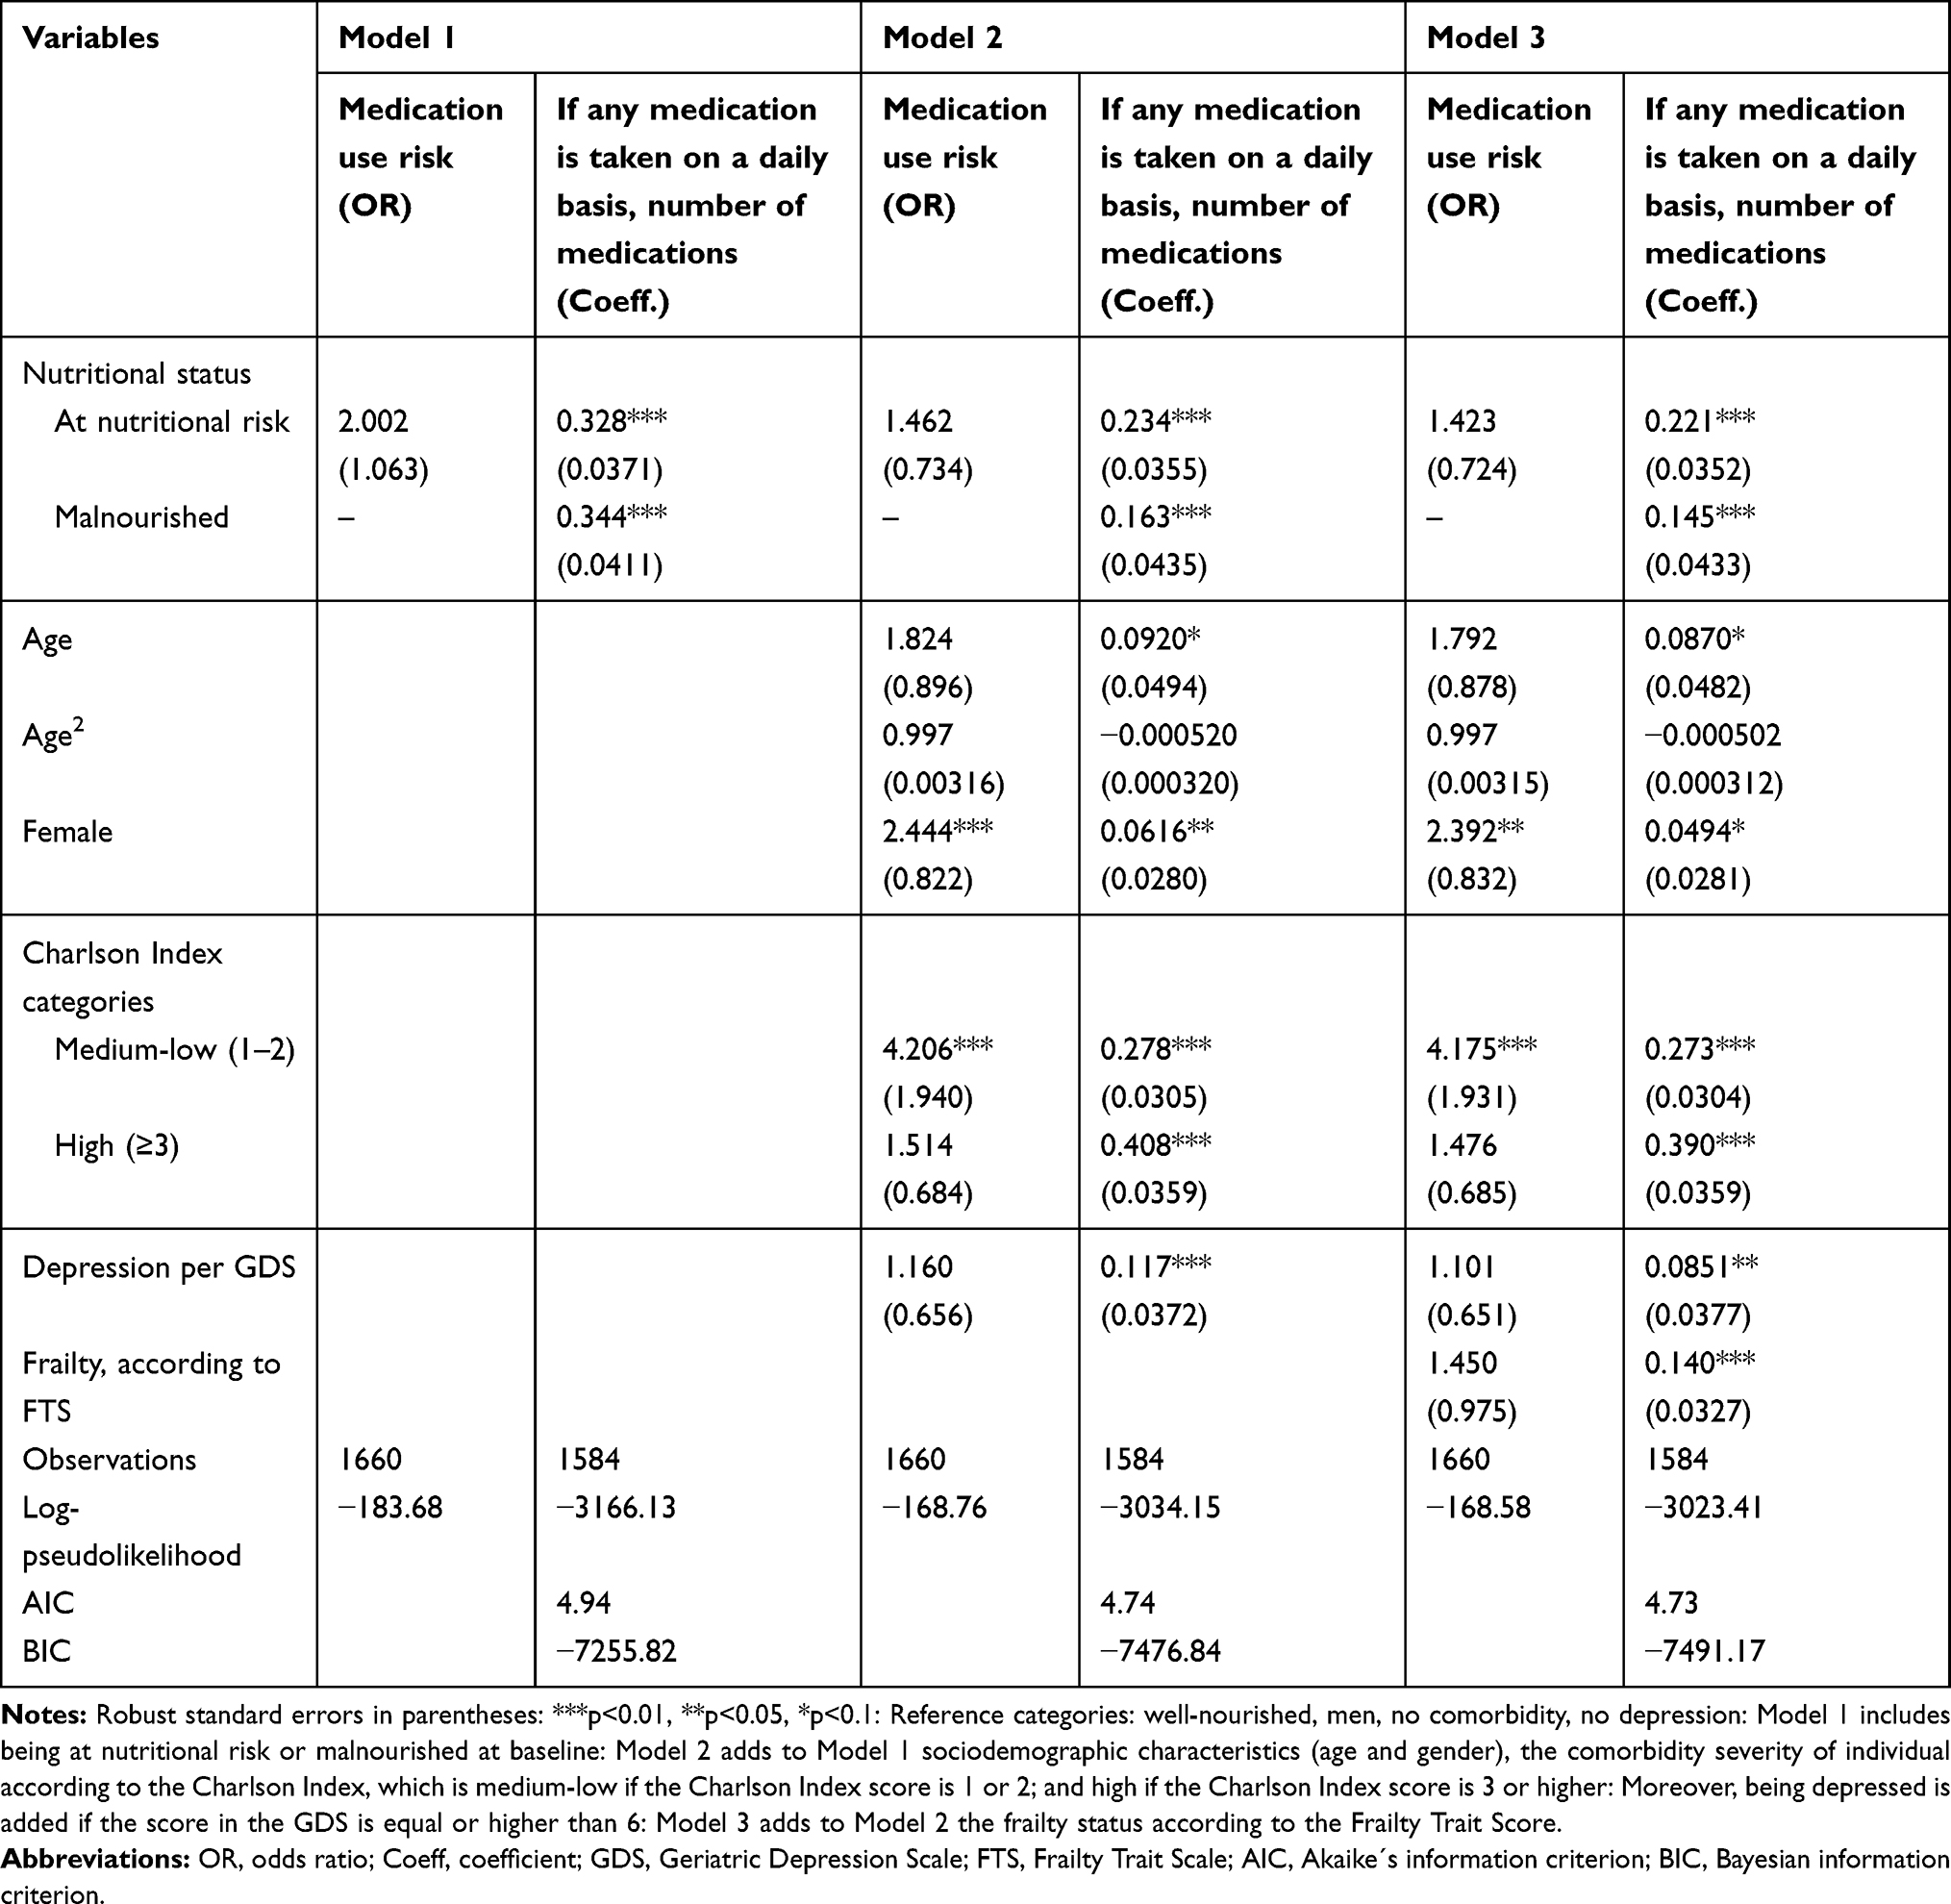 |
Table 5 Regression Results for the Longitudinal Analysis: Medications Use |
When nutritional status was the only independent variable included in the analysis (Model 1), being AMR and MN in wave 2 was related to an increased risk of hospital admission in wave 3 by 1.432 and 1.878 OR, respectively (compared to WN individuals, Table 4). Negative nutrition status was also associated with a greater number of hospital admissions, a longer average length of hospital stay, and higher hospitalization costs. These measures increased in MN patients by 0.655 times, 0.714 days, and 29.5% higher costs, respectively. For AMR patients, their nutrition status was significantly related to longer length of hospital stay and the cost of those hospitalizations (+0.513 days and 29.5%, respectively [p<0.05]). However, nutritional status was no longer significant in Model 2 for the odds of being admitted to the hospital, when adjusting for age, gender, comorbidities, depression, and polypharmacy. This trend held in the third regression model. Still, being AMR and MN were significantly related with higher hospitalization costs in the follow-up, which increased by 30% in both nutritional status categories. Moreover, being MN at baseline was significantly associated with longer hospital stays after 3 years of follow-up, which increased by 0.46 (Model 2) and 0.37 (Model 3) days. If AMR at baseline, the number of hospital admissions was higher at follow-up by 0.23 (Model 2) and 0.21 (Model 3) times (p<0.05).
Table 5 shows that, in Model 1, being at-risk in the previous wave was not significantly associated with the risk of taking any medications in the next wave, compared to WN individuals. Nutritional status was indeed significantly associated with the number of medications taken, which increased significantly for both AMR and MN groups (0.40 and 0.45 more medications taken daily, respectively [p<0.05]). Nutritional status at baseline was still associated with the number of medications taken when age, gender, comorbidities, and depression were included (Model 2); this trend was maintained in subsequent regression models (Model 3). Patients who were AMR at baseline took more medications on a daily basis at follow-up (0.26 [Model 2] and 0.25 [Model 3] more medications (p<0.05)). For MN older adults, the increase in number of daily medications was slightly smaller than among AMR subjects but still significant (0.18 and 0.16 more medications, respectively; p <0.05).
Discussion
We found malnutrition or its risk in over one of four (27.5%) older adults living in the Toledo community; such malnutrition was associated with higher use of healthcare resources and increased costs. These findings suggest that malnutrition risk-screening for older adults, and provision of nutrition counseling and care when needed, hold potential to improve health outcomes for older people and can lower overall costs of care in the Spanish healthcare system. More specifically, results from our study suggested that hospitalization costs can be up to €400 higher for ARM and MN older adults than for those who were WN, consistent with prior findings for older, community-living adults.16 Our findings of increased use of healthcare resources by ARM and MN adults were also generally consistent with findings from an observational study including somewhat younger community-dwelling adults in the United Kingdom.19
In the cross-sectional analysis, poor nutritional status was related to higher hospitalization costs, which increased by about 13–20% among older MN adults and by almost 11–20% if AMR, depending on the covariates included. Only when nutritional status was the unique independent variable, was being NRM significantly and positively associated with the probability of being admitted to hospital, having a longer hospital stay, and using more medications. Moreover, in longitudinal analyses, nutritional status at baseline was significantly related to increasing use of healthcare resources at follow-up. More specifically, being AMR or malnourished was associated with higher hospital-related costs due to hospitalization by 30%. Comparing our results to other studies, Meijers et al20 found that malnourished institutionalized people had, on average, higher costs by €10,000 per year per person. However, their analysis was for people living in nursing homes and focused on the additional costs for managing malnutrition. On the other hand, Guest et al16 found that 6-month healthcare costs were 47% higher for malnourished adults. However, only 60% of the subjects were older than 65 years old, so the numbers are not fully comparable to ours. Finally, Martínez-Reig et al6 used an adjusted analysis, hospital admission costs increased by nearly €500 among malnourished older people. Although this study might be generally comparable to ours, those authors evaluated frail older adults, who likely need more healthcare services than non-frail individuals. They also used a different nutritional assessment tool, and the study was only a cross-sectional analysis. Additional studies performing longitudinal analyses of associations between nutritional status and healthcare use are needed to confirm our findings.
Of interest in our study was the finding that when frailty entered the analysis, the association between nutritional status and some of the outcomes (hospital admission-related outcomes) was weakened, suggesting that frailty may independently affect other variables traditionally related to healthcare resource use, such as age or clinical health status.31–34 Malnutrition and frailty are two important geriatric syndromes in community-dwelling older adults,35 which significantly impact independent living, quality of life, and healthcare consumption, and both have a clear nutrition-related component. Moreover, malnutrition is a cornerstone in the management of frailty,36 since it is central to the clinical transition from frailty to disability, and, as a consequence, considered one of the most important factors in disability prevention.
This study has several limitations. First, the study inherits the limitations of the original THA study,22,23 and the interpretation of our findings as causative should be made with caution. However, this study is the first one that used a longitudinal analysis approach to look at the impact of malnutrition status on healthcare resource use over 3 years. It is worth mentioning that the observed significant association between at-risk/malnutrition and healthcare use and costs remained significant in the models even after adjusting for multiple covariates, including comorbidity severity. The relevance of this finding is two-fold: the percentage of the association remaining in the adjusted models is independent of the adjusting variable; but, at the same time, part of this association is accounted by the adjusting variable (the percentage of diminishing odds ratio/coefficient). We also believe that when the covariates that could potentially account for the association between the variables of interest (exposure and outcome) are carefully assessed, a true association and probably a causal relationship between nutritional status and healthcare use/costs could be demonstrated. A second limitation comes from using a non-validated criteria to identify malnutrition and its risk by using a recent consensual definition, the GLIM criteria.21 Future research is needed to validate our findings. Third, we did not account for other additional healthcare resources, such as emergency department use, primary care and specialist visits, and medication costs. However, we relied on DRG information which include the mean total costs related to any hospitalization, including diagnostic and laboratory tests or medications used during the hospital stay. Additionally, the costs accounted for in our analysis consist of the main drivers of healthcare costs. However, future research could benefit from including all healthcare and non-healthcare related costs, such as social and informal care provided by relatives or friends. Finally, the base case analysis does not account for variability among different sub-populations in the three study groups via robustness checks across specific subgroups (ie, different age groups or gender); therefore, future studies can employ sensitivity analysis to account for variability in measures assessed.
Regardless of these limitations, the results of this first-of-its-kind study provide evidence around the short- and long-term effect of malnutrition on healthcare resource use of community-dwelling older adults which could be used to inform healthcare policies and stakeholders communication in Spain. Specifically, the results of this study highlight the importance of malnutrition screening/assessment among older adults and provide a call to action for primary care and community health clinicians who should integrate nutrition protocols for evaluation nutritional issues to help improve clinical outcomes for older people.37 Moreover, the adoption of effective nutritional interventions, such as oral nutritional supplements (ONS), in at-risk/malnourished older adults living in the community, may have an important impact in improving health outcomes and reducing healthcare costs.16 Nutrition interventions have been found to be effective in improving anthropometrics (body weight), nutritional and functional status, energy and protein intake, and muscle strength (handgrip strength) among community-dwelling adults.30 A recent study evaluating a nutrition-focused program with screening, education, and ONS treatment of at-risk/malnourished community-dwelling adults receiving healthcare services at home was found to reduce 90-day hospitalizations, overall healthcare resource use (inclusive of hospitalizations, emergency department and outpatient clinic visits) and generate total savings of over $2.3 million.38
In conclusion, we call for government leaders and policy-makers to devise strategies that reduce malnutrition, as guided by the World Health Organization.39 Such actions must increase attention to healthy nutrition throughout life, including the older adult population living in the community. Healthcare professionals can harness the benefits of optimal nutrition to ensure a healthy aging process and to maximize healthy life-years by preventing all forms of malnutrition and frailty among older people.
Data Sharing Statement
The TSHA dataset can be made freely available upon request through its website ([email protected]).
Ethics Approval and Consent to Participate
Ethical approval was approved by the local Ethical Review Board of the Hospital Virgen del Valle (Toledo) and the Hospital Universitario de Getafe. Participants provided informed consent for original study, while a waiver of consent was used for this analysis.
Acknowledgments
We thank C. Hofmann & Associates for editorial support with the manuscript.
Author Contributions
All authors contributed to data analysis, drafting or revising the article, gave final approval of the version to be published, and agree to be accountable for all aspects of the work.
Disclosure
L Rodríguez-Mañas has received consultancy fees from Abbott. R Rueda and S Sulo are employees and stockholders of Abbott. The authors report no other conflicts of interest in this work.
References
1. Shakersain B, Santoni G, Faxen-Irving G, Rizzuto D, Fratiglioni L, Xu W. Nutritional status and survival among old adults: an 11-year population-based longitudinal study. Eur J Clin Nutr. 2016;70(3):320–325. doi:10.1038/ejcn.2015.109
2. United Nations. World Population Ageing 2019 - Highlights (ST/ESA/SER.A/430). New York, USA: Department of Economic and Social Affairs, Population Division; 2019.
3. Volkert D, Beck AM, Cederholm T, et al. ESPEN guideline on clinical nutrition and hydration in geriatrics. Clin Nutr. 2019;38(1):10–47. doi:10.1016/j.clnu.2018.05.024
4. Murphy JL, Aburrow A, Guestini A, Brown R, Parsons E, Wallis K. Identifying older people at risk of malnutrition and treatment in the community: prevalence and concurrent validation of the patients association nutrition checklist with ‘MUST’. J Hum Nutr Diet. 2020;33(1):31–37. doi:10.1111/jhn.12710
5. Tilly J. Opportunities to improve nutrition for older adults and reduce risk of poor health outcomes. Washington, DC: Administration for Community Living; 2017. Available from: https://nutritionandaging.org/wp-content/uploads/2017/03/Malnutrition-Issue-Brief-final-3-2017.pdf. Accessed June 24, 2020.
6. Martinez-Reig M, Aranda-Reneo I, Pena-Longobardo LM, et al. Use of health resources and healthcare costs associated with nutritional risk: the FRADEA study. Clin Nutr. 2018;37(4):1299–1305. doi:10.1016/j.clnu.2017.05.021
7. Cederholm T, Barazzoni R, Austin P, et al. ESPEN guidelines on definitions and terminology of clinical nutrition. Clin Nutr. 2017;36(1):49–64. doi:10.1016/j.clnu.2016.09.004
8. Bauer JM, Kaiser MJ, Anthony P, Guigoz Y, Sieber CC. The mini nutritional assessment its history, today’s practice, and future perspectives. Nutr Clin Pract. 2008;23(4):388–396. doi:10.1177/0884533608321132
9. Jimenez-Redondo S. Beltran de Miguel B, Gavidia Banegas J, Guzman Mercedes L, Gomez-Pavon J, Cuadrado Vives C. Influence of nutritional status on health-related quality of life of non-institutionalized older people. J Nutr Health Aging. 2014;18(4):359–364. doi:10.1007/s12603-013-0416-x
10. Martinez-Reig M, Gomez-Arnedo L, Alfonso-Silguero SA, Juncos-Martinez G, Romero L, Abizanda P. Nutritional risk, nutritional status and incident disability in older adults. The FRADEA study. J Nutr Health Aging. 2014;18(3):270–276. doi:10.1007/s12603-013-0388-x
11. Barker LA, Gout BS, Crowe TC. Hospital malnutrition: prevalence, identification and impact on patients and the healthcare system. Int J Environ Res Public Health. 2011;8(2):514–527. doi:10.3390/ijerph8020514
12. Cereda E, Pedrolli C, Klersy C, et al. Nutritional status in older persons according to healthcare setting: A systematic review and meta-analysis of prevalence data using MNA((R). Clin Nutr. 2016;35(6):1282–1290. doi:10.1016/j.clnu.2016.03.008
13. Correia MI, Waitzberg DL. The impact of malnutrition on morbidity, mortality, length of hospital stay and costs evaluated through a multivariate model analysis. Clin Nutr. 2003;22(3):235–239. doi:10.1016/S0261-5614(02)00215-7
14. Kaiser MJ, Bauer JM, Ramsch C, et al. Frequency of malnutrition in older adults: a multinational perspective using the mini nutritional assessment. J Am Geriatr Soc. 2010;58(9):1734–1738. doi:10.1111/j.1532-5415.2010.03016.x
15. Kiesswetter E, Colombo MG, Meisinger C, et al. Malnutrition and related risk factors in older adults from different health-care settings: an enable study. Public Health Nutr. 2020;23(3):446–456. doi:10.1017/S1368980019002271
16. Abizanda P, Sinclair A, Barcons N, Lizan L, Rodriguez-Manas L. Costs of malnutrition in institutionalized and community-dwelling older adults: a systematic review. J Am Med Dir Assoc. 2016;17(1):17–23. doi:10.1016/j.jamda.2015.07.005
17. Baumeister SE, Fischer B, Doring A, et al. The geriatric nutritional risk index predicts increased healthcare costs and hospitalization in a cohort of community-dwelling older adults: results from the MONICA/KORA augsburg cohort study, 19942005. Nutrition. 2011;27(5):534–542. doi:10.1016/j.nut.2010.06.005
18. Freijer K, Tan SS, Koopmanschap MA, Meijers JM, Halfens RJ, Nuijten MJ. The economic costs of disease related malnutrition. Clin Nutr. 2013;32(1):136–141. doi:10.1016/j.clnu.2012.06.009
19. Guest JF, Panca M, Baeyens JP, et al. Health economic impact of managing patients following a community-based diagnosis of malnutrition in the UK. Clin Nutr. 2011;30(4):422–429. doi:10.1016/j.clnu.2011.02.002
20. Meijers JM, Halfens RJ, Wilson L, Schols JM. Estimating the costs associated with malnutrition in Dutch nursing homes. Clin Nutr. 2012;31(1):65–68. doi:10.1016/j.clnu.2011.08.009
21. Cederholm T, Jensen GL, Correia M, et al. GLIM criteria for the diagnosis of malnutrition - A consensus report from the global clinical nutrition community. Clin Nutr. 2019;38(1):1–9. doi:10.1016/j.clnu.2018.08.002
22. Garcia-Garcia FJ, Gutierrez Avila G, Alfaro-Acha A, et al. The prevalence of frailty syndrome in an older population from Spain. The toledo study for healthy aging. J Nutr Health Aging. 2011;15(10):852–856. doi:10.1007/s12603-011-0075-8
23. Sanchez-Sanchez JL, Manas A, Garcia-Garcia FJ, et al. Sedentary behaviour, physical activity, and sarcopenia among older adults in the TSHA: isotemporal substitution model. J Cachexia Sarcopenia Muscle. 2019;10(1):188–198. doi:10.1002/jcsm.12369
24. Rubenstein LZ, Harker JO, Salvà A, Guigoz Y, Vellas B. Screening for undernutrition in geriatric practice: developing the short-form mini-nutritional assessment (MNA-SF). J Gerontol a Biol Sci Med Sci. 2001;56(6):M366–372. doi:10.1093/gerona/56.6.M366
25. Martínez-González M, Corella D, Salas-Salvadó J, et al. Cohort profile: design and methods of the PREDIMED study. Int J Epidemiol. 2012;41(2):377–385. doi:10.1093/ije/dyq250
26.Costes hospitalarios contabilidad analítica, 2017. Available from: https://www.mscbs.gob.es/estadEstudios/estadisticas/inforRecopilaciones/anaDesarrolloGDR.htm.
27. Herrmann N, Mittmann N, Silver I, et al. A validation study of the geriatric depression scale short form. Int J Geriat Psychiatry. 1996;11(5):457–460. doi:10.1002/(SICI)1099-1166(199605)11:5<457::AID-GPS325>3.0.CO;2-2
28. Sachdev M, Sun JL, Tsiatis AA, Nelson CL, Mark DB, Jollis JG. The prognostic importance of comorbidity for mortality in patients with stable coronary artery disease. J Am Coll Cardiol. 2004;43(4):576–582. doi:10.1016/j.jacc.2003.10.031
29. Farewell VT, Long DL, Tom BDM, Yiu S, Su L. Two-part and related regression models for longitudinal data. Annu Rev Stat Appl. 2017;4:283–315. doi:10.1146/annurev-statistics-060116-054131
30. Frondel M, Vance C. Interpreting the outcomes of two-part models. Appl Econ Lett. 2012;19(10):987–992. doi:10.1080/13504851.2011.610733
31. Cuerda C, Álvarez J, Ramos P, et al. Prevalence of malnutrition in subjects over 65 years of age in the community of madrid: the DREAM+65 study. Nutr Hosp. 2016;33:263–269. doi:10.20960/nh.263
32. Farre TB, Formiga F, Ferrer A, Plana-Ripoll O, Almeda J, Pujol R. Risk of being undernourished in a cohort of community-dwelling 85-year-olds: the Octabaix study. Geriatr Gerontol Int. 2014;14(3):702–709. doi:10.1111/ggi.12142
33. Gunduz E, Eskin F, Gunduz M, et al. Malnutrition in community-dwelling elderly in Turkey: a multicenter, cross-sectional study. Med Sci Monit. 2015;21:2750–2756. doi:10.12659/MSM.893894
34. Simsek H, Meser R, Sahin S, Ucku R. Prevalence of food insecurity and malnutrition, factors related to malnutrition in the elderly: a community-based, cross-sectional study from Turkey. Eur Geriatr Med. 2013;4(4):226–230. doi:10.1016/j.eurger.2013.06.001
35. Verlaan S, Ligthart-Melis GC, Wijers SLJ, Cederholm T, Maier AB, de van der Schueren MAE. High prevalence of physical frailty among community-dwelling malnourished older adults-a systematic review and meta-analysis. J Am Med Dir Assoc. 2017;18(5):374–382. doi:10.1016/j.jamda.2016.12.074
36. Fried LP, Tangen CM, Walston J, et al. Frailty in older adults: evidence for a phenotype. J Gerontol a Biol Sci Med Sci. 2001;56(3):M146–156. doi:10.1093/gerona/56.3.M146
37. Vandewoude MFJ, Alish CJ, Sauer AC, Hegazi RA. Malnutrition-sarcopenia syndrome: is this the future of nutrition screening and assessment for older adults? J Aging Res. 2012;2012:8. doi:10.1155/2012/651570
38. Riley K, Sulo S, Dabbous F, et al. Reducing hospitalizations and costs: a home health nutrition-focused quality improvement program. JPEN J Parenter Enteral Nutr. 2020;44(1):58–68. doi:10.1002/jpen.1606
39. World Health Organization. European food and nutrition action plan, 2014. Available from: http://www.euro.who.int/en/publications/abstracts/european-food-and-nutrition-action-plan-20152020-2014.
 © 2020 The Author(s). This work is published and licensed by Dove Medical Press Limited. The
full terms of this license are available at https://www.dovepress.com/terms
and incorporate the Creative Commons Attribution
- Non Commercial (unported, 3.0) License.
By accessing the work you hereby accept the Terms. Non-commercial uses of the work are permitted
without any further permission from Dove Medical Press Limited, provided the work is properly
attributed. For permission for commercial use of this work, please see paragraphs 4.2 and 5 of our Terms.
© 2020 The Author(s). This work is published and licensed by Dove Medical Press Limited. The
full terms of this license are available at https://www.dovepress.com/terms
and incorporate the Creative Commons Attribution
- Non Commercial (unported, 3.0) License.
By accessing the work you hereby accept the Terms. Non-commercial uses of the work are permitted
without any further permission from Dove Medical Press Limited, provided the work is properly
attributed. For permission for commercial use of this work, please see paragraphs 4.2 and 5 of our Terms.