")
Back to Journals » Clinical Interventions in Aging » Volume 13
Magnitude of dural tube compression does not show a predictive value for symptomatic lumbar spinal stenosis for 1-year follow-up: a prospective cohort study in the community
Authors Otani K , Kikuchi S, Nikaido T , Konno S
Received 13 April 2018
Accepted for publication 7 June 2018
Published 13 September 2018 Volume 2018:13 Pages 1739—1746
DOI https://doi.org/10.2147/CIA.S171049
Checked for plagiarism Yes
Review by Single anonymous peer review
Peer reviewer comments 2
Editor who approved publication: Dr Richard Walker
Koji Otani, Shin-ichi Kikuchi, Takuya Nikaido, Shin-ichi Konno
Department of Orthopaedic Surgery, Fukushima Medical University School of Medicine, Fukushima, Japan
Background: The North American Spine Society states that lumbar spinal stenosis (LSS) is a clinical syndrome, and there is insufficient evidence to make a recommendation for or against a correlation between clinical symptoms or function and the presence of anatomic narrowing of the spinal canal on MRI. The main purpose of this study was to assess the influence of the magnitude of dural tube compression on MRI on LSS symptoms at the cross-sectional and 1-year follow-up.
Methods: This was a prospective cohort study of 459 participants who were assessed for LSS using a questionnaire and conventional MRI of the lumbar spine. After 1 year, 335 subjects (follow-up rate 73.0%) were assessed for LSS using the same questionnaire. The time course of the clinical subjective symptoms of LSS and the relationship between the said symptoms of LSS and magnitude of dural tube compression on MRI were analyzed in a cross-sectional and longitudinal fashion.
Results: 1) The dural sac cross-sectional area (DCSA) decreased with age. 2) Severe dural tube compression had a strong influence on the presence of symptomatic LSS; however, 40%–70% of participants with severe dural tube compression did not show clinical symptoms of LSS. 3) At the 1-year follow-up, >50% of the LSS-positive participants in the initial year were reclassified as LSS negative, and 10% of the LSS-negative participants were reclassified as LSS positive. 4) The magnitude of the DCSA on MRI did not directly affect the presence of LSS at the 1-year follow-up.
Conclusion: LSS symptoms were changeable. Anatomical dural tube compression on MRI did not predict the presence of clinical LSS symptoms at the 1-year follow-up.
Keywords: lumbar spinal stenosis, epidemiology, natural history, quality of life, prognostic factors, comorbidities, cross-sectional area, MRI
Introduction
The clinical guidelines for degenerative lumbar spinal stenosis (LSS) by North American Spine Society (NASS) mention that LSS is a clinical syndrome, which is associated with diminished space available for the neural and vascular elements in the lumbar spine secondary to degenerative changes in the spinal canal.1 LSS is diagnosed through subjective symptoms, physical findings, such as neurological findings, and radiological abnormalities. The symptoms of LSS have certain characteristic provocative (neurogenic claudication) and palliative (symptom relief with forward flexion, sitting, and/or recumbency) features.2–6
As stated in the NASS guidelines, dural tube compression is indicative of symptomatic LSS; however, dural tube compression does not always have symptoms.1,7–9 Measurement of the dural sac cross-sectional area (DCSA) has been accepted as a way to evaluate the severity of dural tube compression for central stenosis. Up to now, it has been accepted that the borderline DCSA for diagnosing absolute spinal stenosis is <75 mm2 and for relative spinal stenosis is <100 mm2.10,11 However, controversy remains regarding the relationship between the severity of dural tube compression and clinical symptoms or quality of life (Qol).12–19
Recently, a diagnostic support tool for LSS has become available.20 Using this diagnostic support tool, epidemiologic studies for the prevalence21–23 and 1-year follow-up of LSS24 have been reported. However, the epidemiology of symptomatic LSS (diagnosed by subjective symptoms and radiological findings) and asymptomatic LSS (diagnosed by only radiological findings) is still unclear.
The main purpose of this study was to assess the influence of the magnitude of dural tube compression on MRI on LSS symptoms at the cross-sectional and 1-year follow-up.
Participants and methods
This was a prospective cohort study of 459 participants (male: 148 and female: 311) who were assessed for LSS using a questionnaire and conventional MRI of the lumbar spine. Most participants were aged 70–79 years. The participants comprised ~5.6% of local residents of Tadami town, Tateiwa village, and Ina village in Fukushima prefecture, Japan (Table 1). These 3 places are located in mountainous areas. All participants were self-sufficient (living in their own houses without the need for supplemental care and walking independently with or without support, such as a cane or a walker).22,24
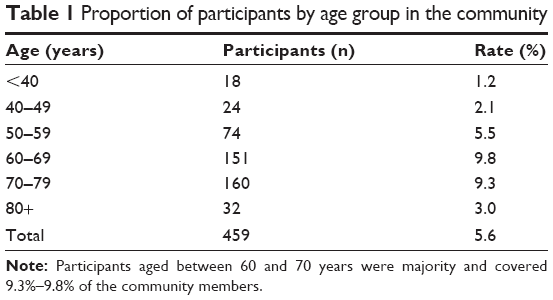 | Table 1 Proportion of participants by age group in the community |
After 1 year, 335 participants (male: 103 and female: 232) (follow-up rate 73.0%) were assessed for LSS using the same questionnaire. No subjects underwent surgery for LSS during the 1-year period.
All participants provided written informed consent in each initial analysis (2004) and 1-year follow-up (2005).
LSS symptoms
The presence of LSS was determined by a specially designed and validated LSS diagnostic support tool, which was a self-administered, self-reported history questionnaire (LSS-SSHQ). This questionnaire consisted of 10 yes/no questions (Table S1). The sensitivity of the questionnaire was 85.5% with the derivation data and 79.1% with the validation data. The specificity of this questionnaire was 84.3% with the derivation data and 78.1% with the validation data. The area under the receiver opening characteristic curve was 0.782.20 According to the result of LSS-SSHQ, participants were divided into 2 categories: LSS positive and LSS negative.
Evaluation of leg symptom intensity and disease-specific Qol
Leg symptom intensity was evaluated using an 11-point numerical rating scale (NRS; 0: absence of pain/numbness and 10: worst pain/numbness). The Roland–Morris Disability Questionnaire (RDQ) (Japanese version) was used to measure disease-specific disability.25–28 A Japanese version of the RDQ provides the national normative RDQ score and SD values (20–79 years old, male/female). All data regarding LSS-SSHQ, NRS of leg symptoms, and RDQ were collected by a self-report.
Evaluation of MRI findings
Axial T2-weighted images were obtained at the midpoint of each intervertebral disc from L1/2 to L5/S1 using 3 MRI machines. The details of these machines are described in Table 2. Transverse slices were aligned as parallel as possible to each intervertebral disc. The DCSA of L1/2–L5/S1 on the T2-weighted image was measured using the conventional formula described by Hamanishi et al.29 This formula is suitable for DCSA measurement because of its simplicity and reliability. The interobsever reliability of this formula was reported as 0.92. In addition, the correlation coefficient for DCSA measured using this formula and the digitizer method was 0.96. In this study, intraobserver reliability of 2 investigators (KO and TN) was 0.91 and 0.90, respectively. The interobserver reliability between the 2 investigators was 0.87.
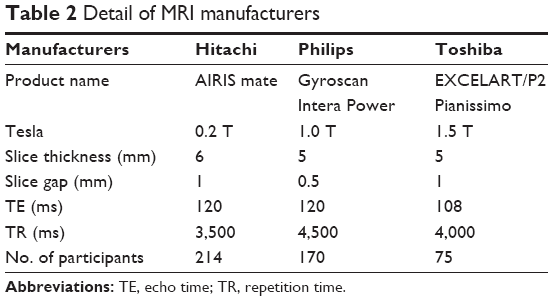 | Table 2 Detail of MRI manufacturers |
Both KO and TN were experienced spine surgeons. KO, in particular, was an attending surgeon licensed by the Japanese Society for Spine Surgery and Related Research.
The intra- and interobserver reliability was considered acceptable and the first measurement by KO was used for analysis. The smallest DCSA of L1/2–L5/S1 in each participant was divided into 5 categories: <25 mm2, 25–49.9 mm2, 50–74.9 mm2, 75–99.9 mm2, and ≥100 mm2. The number of intervertebral discs of which the smallest DCSA was <50 mm2 (ranged 0–5) was also analyzed.
Statistics
The presence of correlation between the 5 categories of the smallest DCSA and age was analyzed using Spearman’s rank correlation. The Mann–Whitney U test was used to examine the relationship between LSS positive/negative and the 5 categories of the smallest DCSA or the number of intervertebral discs of which DCSA was <50 mm2. A multiple logistic regression analysis was performed with the presence of LSS at the 1-year follow-up as the dependent variable, and age, gender, RDQ score, NRS of leg pain/numbness, presence of LSS at the initial analysis, smallest DCSA, and the number of intervertebral discs with DCSA <50 mm2 as independent variables. All statistical analyses were performed using the STAT View software package (version 5.0, SAS Institute Inc., Cary, NC, USA). A P-value of <0.05 was considered statistically significant.
Source of funding
This study was supported by a grant from the Fukushima Society for the Promotion of Medicine and a grant from Fukushima Prefectural Hospitals Office. These grants were mainly used for the cost of MRI, research assistance, and printing and posting the questionnaire.
Ethical approval
This study was approved by the ethical committee of Fukushima Medical University.
Results
Relationship between the smallest DCSA and age at the initial assessment
The magnitude and the average of the smallest DCSA decreased with age. There was a statistical correlation between the 5 DCSA categories and age (P<0.01) (Table 3). This indicates that degenerative changes to the spine strongly affect the magnitude of the smallest DCSA.
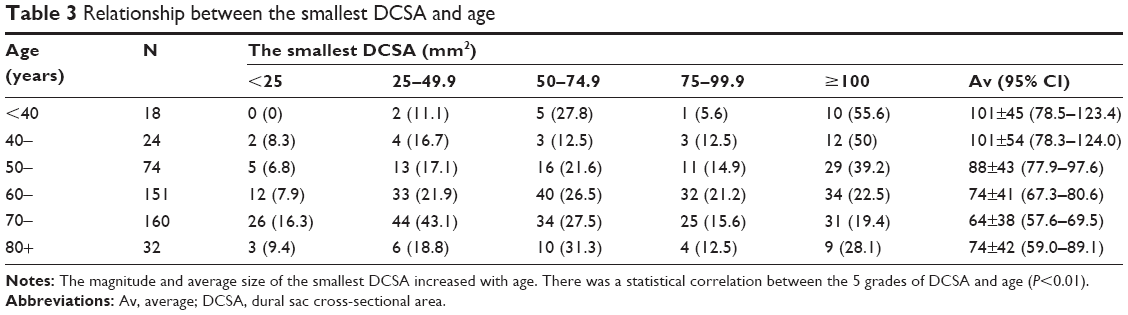 | Table 3 Relationship between the smallest DCSA and age |
Relationship between the smallest DCSA and the presence of LSS at the initial assessment
The number of participants judged as LSS positive was 27 of 48 (56.3%) in the group with the smallest DCSA of <25 mm2, 27 of 102 (26.5%) in the 25–49.9 mm2 group, 32 of 108 (29.6%) in the 50–74.9 mm2 group, 17 of 76 (22.4%) in the 75–99.9 mm2 group, and 25 of 125 (20%) in the group with DCSA of ≥100 mm2. There was a statistically significant difference in the distribution of the smallest DCSA between the participants with LSS positive and negative (P=0.0003) (Table 4). Similarly, a statistically significant difference was observed in the number of intervertebral discs of which the smallest DCSA of <50 mm2 between the participants with LSS positive and negative (P=0.0116) (Table 5). Among 57 participants with ≥2 DCSA of <50 mm2, 31 (54.4%) were judged as LSS negative.
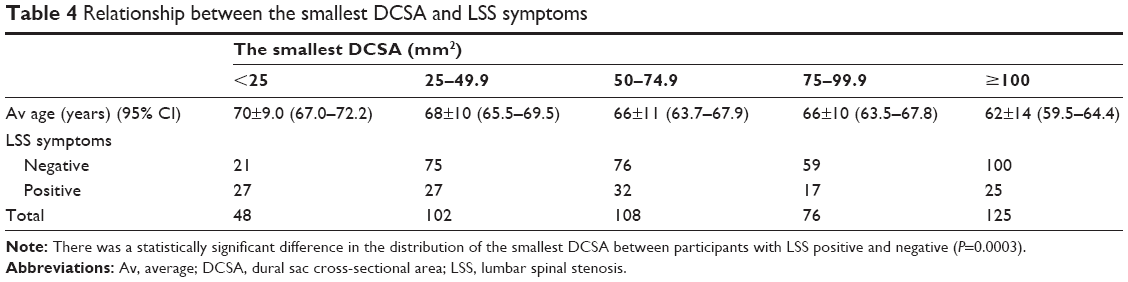 | Table 4 Relationship between the smallest DCSA and LSS symptoms |
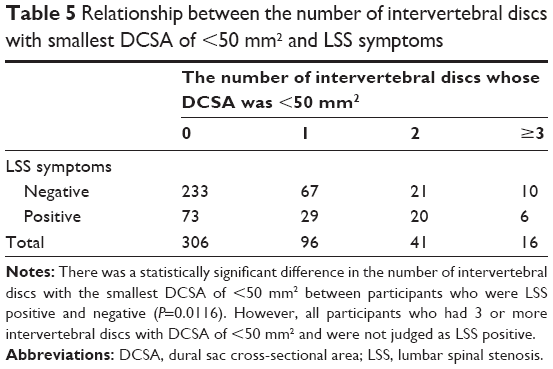 | Table 5 Relationship between the number of intervertebral discs with smallest DCSA of <50 mm2 and LSS symptoms |
LSS evaluated by questionnaire at the 1-year follow-up
In the 2004 LSS-positive group, 48 of 107 (44.9%) participants remained LSS positive in 2005, whereas 59 of 107 (55.1%) were reclassified as LSS negative. On the other hand, 205 of 228 participants (89.9%) in the LSS-negative group in 2004 were still in the LSS-negative group in 2005, with the other 23 of 228 (10.1%) having been reclassified as LSS positive (Table 6).
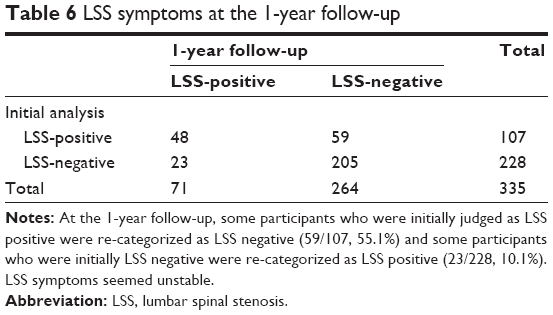 | Table 6 LSS symptoms at the 1-year follow-up |
In this study, standing X-ray images of anterior–posterior and lateral positions were taken to evaluate scoliosis (Cobb angle ≥10°), degenerative spondylolisthesis (anterolisthesis or retrolisthesis), and spondylolysis or isthmic spondylolisthesis. These X-ray image findings did not influence the presence of symptomatic LSS evaluated by LSS-SSHR at the initial assessment and 1-year follow-up (data not shown).
Analysis of predictors for LSS at the 1-year follow-up
According to a multiple logistic regression analysis, only 2 factors, the presence of LSS symptoms (OR 4.480) and the score below the normative RDQ score (OR 5.169) at the initial assessment, had statistically significant influence on the presence of LSS symptoms at the 1-year follow-up (Table 7).
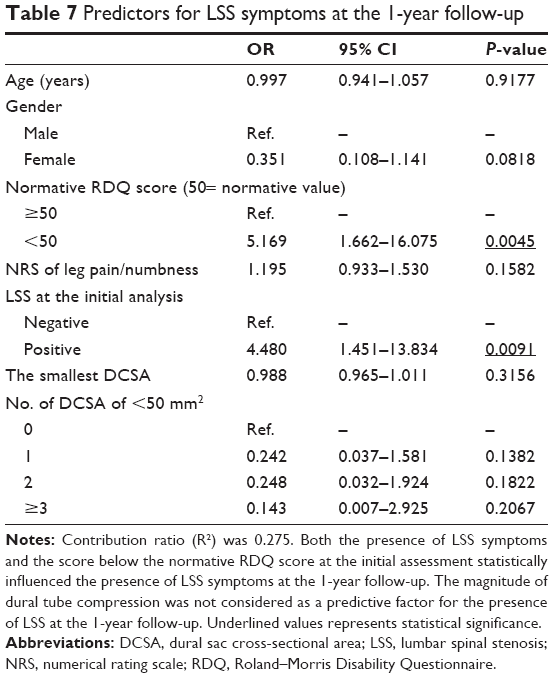 | Table 7 Predictors for LSS symptoms at the 1-year follow-up |
Discussion
In the present study, some controversial issues regarding etiology of LSS arose. First, in the group with the smallest DCSA of <25 mm2, which is considered severe dural tube compression, only half of the participants were judged as LSS positive (Table 4). Second, more than half of the participants with ≥2 DCSA of <50 mm2 were categorized as LSS negative (Table 5). Third, more than half of the participants with LSS positive were reclassified as LSS negative at the 1-year follow-up (Table 6). Fourth, the magnitude of dural tube compression, assessed by the smallest DCSA or the number of intervertebral discs of which the smallest DCSA of <50 mm2, was not a predictive factor for the presence of LSS after 1 year (Table 7). Overall, these findings suggest that severe dural tube compression did not always show LSS symptoms, LSS symptoms seemed not to be stable for 1-year period and the magnitude of dural tube compression was not a predictive factor for the presence of LSS at the 1-year follow-up.
In degenerative spine disease, it is well known that degenerative changes do not always cause symptoms.7–9 In patients with symptomatic LSS, operative treatment is preferred to improve pain, disability, and Qol compared with non-operative treatment.30,31 However, Herno reported that postoperative DCSA was not associated with these outcomes.32 Similarly, in the preoperative LSS patients, it is still controversial whether DCSA and the magnitude of symptoms or Qol are correlated or not.13–19 Several reasons are considered to explain the discrepancy between the magnitude of DCSA and occurrence of LSS symptoms. First, conventional MRI was obtained in the supine position; however, patients usually show LSS symptoms while standing and/or walking. Takahashi et al reported that a higher epidural pressure during standing and/or walking induces LSS symptoms compared with lower epidural pressure in the supine position.33,34 Many studies have reported the difference in DCSA in the supine position with and without axial loading. The size of DCSA in the supine position with axial loading was considered to be similar to that in the standing position. DCSA in the supine position with axial loading is statistically smaller than that without the loading.35–39 Second, it is not easy to detect the dynamic factor of so-called instability or occult spondylolisthesis on conventional MRI taken in just 1 static position.38,40–43 Third, whether they are aware of it or not, people with a smaller DCSA may adopt a forward-bending posture to either reduce or avoid LSS symptoms. Fourth, magnitude of DCSA represents only the degree of central stenosis and not lateral stenosis and foraminal stenosis that induce radicular symptoms.17,29
There are several limitations to this study. First, lateral stenosis and foraminal stenosis were not assessed. Second, there was no evaluation of the severity of LSS symptoms. Third, the follow-up rate of 77.3% is relatively low. Fourth, the 1-year follow-up period seemed to be too short to effectively judge any newly occurring LSS symptoms. Fifth, there was no evaluation of comorbidities, such as hip osteoarthritis (OA), knee OA, internal medicine problem, and more. Sixth, the research location was in a rural and mountainous area, so the data may not extrapolate completely to the typical Japanese population. Finally, all the participants in this study were volunteers and as such, there could be an unintentional sample bias. In spite of these limitations, the present study might still be worth because it shows that the magnitude of dural tube compression was not equal to the occurrence of symptomatic LSS at the 1-year follow-up in the community. This is the first prospective study to show the relationship between LSS symptoms and image findings in the community setting. Further study is needed to investigate the occurrence of LSS in a long-term follow-up and risk factors of LSS for the maintenance of health in the elderly.
Conclusion
At the 1-year follow-up, the magnitude of DCSA had not affected the presence of LSS directly. Dural tube compression is an anatomical cause for LSS; however, LSS is not always symptomatic. The relationships between symptomatic and asymptomatic LSS in people with dural tube compression remain unclear.
Acknowledgments
The authors wish to thank Dr Akira Onda, Dr Kazuya Yamauchi, Dr Yoshiaki Takeyachi, Dr Ichiro Takahashi, Dr Hisayoshi Tachihara, and Dr Bunji Takayama for participating in the data collection. The authors would also like to thank 5 public nurses (Nobuko Fujita, Nakako Hoshi, Misako Hoshi, Naoko Imada, and Seiko Kanno) for their support in carrying out this study. This study was supported by a grant from the Fukushima Society for the Promotion of Medicine and a grant from the Fukushima Prefectural Hospitals Office.
Author contributions
Conception and design: KO, SI Kikuchi, and SI Konno; data analysis: KO and TN; manuscript preparation: KO and SI Kikuchi.
Disclosure
All authors report no conflicts of interest in this work. This study was presented at the 39th Annual Meeting of International Society for the Study of the Lumbar Spine (May 2012, Amsterdam, the Netherlands).
References
North American Spine Society. Diagnosis and Treatment of Degenerative Lumbar Spinal Stenosis. Available from: https://www.spine.org/Documents/ResearchClinicalCare/Guidelines/LumbarStenosis.pdf. Accessed January 12, 2018. | ||
Takahashi N, Kikuchi S, Yabuki S, Otani K, Konno S. Diagnostic value of the lumbar extension-loading test in patients with lumbar spinal stenosis: a cross-sectional study. BMC Musculoskelet Disord. 2014;15:259. | ||
Dyck P, Doyle JB. “Bicycle test” of van Gelderen in diagnosis of intermittent cauda equina compression syndrome. Case report. J Neurosurg. 1977;46(5):667–670. | ||
Dong G, Porter RW. Walking and cycling tests in neurogenic and intermittent claudication. Spine (Phila Pa 1976). 1989;14(9):965–969. | ||
Suri P, Rainville J, Kalichman L, Katz JN. Does this older adult with lower extremity pain have the clinical syndrome of lumbar spinal stenosis? JAMA. 2010;304(23):2628–2636. | ||
Katz JN, Dalgas M, Stucki G, et al. Degenerative lumbar spinal stenosis. Diagnostic value of the history and physical examination. Arthritis Rheum. 1995;38(9):1236–1241. | ||
Wiesel SW, Tsourmas N, Feffer HL, Citrin CM, Patronas N. A study of computer-assisted tomography. I. The incidence of positive CAT scans in an asymptomatic group of patients. Spine (Phila Pa 1976). 1984;9(6):549–551. | ||
Boden SD, Davis DO, Dina TS, Patronas NJ, Wiesel SW. Abnormal magnetic-resonance scans of the lumbar spine in asymptomatic subjects. A prospective investigation. J Bone Joint Surg Am. 1990;72(3):403–408. | ||
Jensen MC, Brant-Zawadzki MN, Obuchowski N, et al. Magnetic resonance imaging of the lumbar spine in people without back pain. N Engl J Med. 1994;331(2):69–73. | ||
Schönström N, Lindahl S, Willén J, Hansson T. Dynamic changes in the dimensions of the lumbar spinal canal: an experimental study in vitro. J Orthop Res. 1989;7(1):115–121. | ||
Schonstrom NS, Bolender NF, Spengler DM. The pathomorphology of spinal stenosis as seen on CT scans of the lumbar spine. Spine (Phila Pa 1976). 1985;10(9):806–811. | ||
Ogikubo O, Forsberg L, Hansson T. The relationship between the cross-sectional area of the cauda equina and the preoperative symptoms in central lumbar spinal stenosis. Spine (Phila Pa 1976). 2007;32(13):1423–1428. | ||
Yukawa Y, Lenke LG, Tenhula J, Bridwell KH, Riew KD, Blanke K. A comprehensive study of patients with surgically treated lumbar spinal stenosis with neurogenic claudication. J Bone Joint Surg Am. 2002;84-A(11):1954–1959. | ||
Lohman CM, Tallroth K, Kettunen JA, Lindgren KA. Comparison of radiologic signs and clinical symptoms of spinal stenosis. Spine (Phila Pa 1976). 2006;31(16):1834–1840. | ||
Geisser ME, Haig AJ, Tong HC, et al. Spinal canal size and clinical symptoms among persons diagnosed with lumbar spinal stenosis. Clin J Pain. 2007;23(9):780–785. | ||
Sirvanci M, Bhatia M, Ganiyusufoglu KA, et al. Degenerative lumbar spinal stenosis: correlation with Oswestry Disability Index and MR imaging. Eur Spine J. 2008;17(5):679–685. | ||
Sigmundsson FG, Kang XP, Jönsson B, Strömqvist B. Correlation between disability and MRI findings in lumbar spinal stenosis: a prospective study of 109 patients operated on by decompression. Acta Orthop. 2011;82(2):204–210. | ||
Goni VG, Hampannavar A, Gopinathan NR, et al. Comparison of the oswestry disability index and magnetic resonance imaging findings in lumbar canal stenosis: an observational study. Asian Spine J. 2014;8(1):44–50. | ||
Park DK, An HS, Lurie JD, et al. Does multilevel lumbar stenosis lead to poorer outcomes?: a subanalysis of the Spine Patient Outcomes Research Trial (SPORT) lumbar stenosis study. Spine (Phila Pa 1976). 2010;35(4):439–446. | ||
Konno S, Kikuchi S, Tanaka Y, et al. A diagnostic support tool for lumbar spinal stenosis: a self-administered, self-reported history questionnaire. BMC Musculoskelet Disord. 2007;8:102. | ||
Miyakoshi N, Hongo M, Kasukawa Y, Ishikawa Y, Shimada Y. Prevalence, Spinal Alignment, and Mobility of Lumbar Spinal Stenosis with or without Chronic Low Back Pain: a Community-Dwelling Study. Pain Res Treat. 2011;2011:340629. | ||
Otani K, Kikuchi S, Yabuki S, et al. Lumbar Spinal Stenosis Has a Negative Impact on Quality of Life Compared with Other Comorbidities: an Epidemiological Cross-Sectional Study of 1862 Community-Dwelling Individuals. Scientific World Journal. 2013;2013(5):590652. | ||
Yabuki S, Fukumori N, Takegami M, et al. Prevalence of lumbar spinal stenosis, using the diagnostic support tool, and correlated factors in Japan: a population-based study. J Orthop Sci. 2013;18(6):893–900. | ||
Otani K, Kikuchi SI, Yabuki S, et al. Prospective one-year follow-up of lumbar spinal stenosis in a regional community. J Pain Res. 2018;11:455–464. | ||
Suzukamo Y, Fukuhara S, Kikuchi S, et al. Validation of the Japanese version of the Roland-Morris Disability Questionnaire. J Orthop Sci. 2003;8(4):543–548. | ||
Fujiwara A, Kobayashi N, Saiki K, Kitagawa T, Tamai K, Saotome K. Association of the Japanese Orthopaedic Association score with the Oswestry Disability Index, Roland-Morris Disability Questionnaire, and short-form 36. Spine (Phila Pa 1976). 2003;28(14):1601–1607. | ||
Nakamura M, Miyamoto K, Shimizu K. Validation of the Japanese version of the Roland-Morris Disability Questionnaire for Japanese patients with lumbar spinal diseases. Spine (Phila Pa 1976). 2003;28(20):2414–2418. | ||
Takahashi N, Kikuchi S, Fukuhara S, et al. Estimation of Japanese normative value in age and gender categories of Roland-Morris disability questionnaire. Rinsho Seikei Geka. 2004;39(3):315–319 (in Japanese). | ||
Hamanishi C, Matukura N, Fujita M, Tomihara M, Tanaka S. Cross-sectional area of the stenotic lumbar dural tube measured from the transverse views of magnetic resonance imaging. J Spinal Disord. 1994;7(5):388–393. | ||
Weinstein JN, Lurie JD, Tosteson TD, et al. Surgical compared with nonoperative treatment for lumbar degenerative spondylolisthesis. four-year results in the Spine Patient Outcomes Research Trial (SPORT) randomized and observational cohorts. J Bone Joint Surg Am. 2009;91(6):1295–1304. | ||
Weinstein JN, Tosteson TD, Lurie JD, et al. Surgical versus nonoperative treatment for lumbar spinal stenosis four-year results of the Spine Patient Outcomes Research Trial. Spine (Phila Pa 1976). 2010;35(14):1329–1338. | ||
Herno A, Airaksinen O, Saari T. Computed tomography after laminectomy for lumbar spinal stenosis. Patients’ pain patterns, walking capacity, and subjective disability had no correlation with computed tomography findings. Spine. 1994;19(17):1975–1978. | ||
Takahashi K, Miyazaki T, Takino T, Matsui T, Tomita K. Epidural pressure measurements. Relationship between epidural pressure and posture in patients with lumbar spinal stenosis. Spine (Phila Pa 1976). 1995;20(6):650–653. | ||
Takahashi K, Kagechika K, Takino T, Matsui T, Miyazaki T, Shima I. Changes in epidural pressure during walking in patients with lumbar spinal stenosis. Spine (Phila Pa 1976). 1995;20(24):2746–2749. | ||
Willén J, Danielson B. The diagnostic effect from axial loading of the lumbar spine during computed tomography and magnetic resonance imaging in patients with degenerative disorders. Spine (Phila Pa 1976). 2001;26(23):2607–2614. | ||
Hirasawa Y, Bashir WA, Smith FW, Magnusson ML, Pope MH, Takahashi K. Postural changes of the dural sac in the lumbar spines of asymptomatic individuals using positional stand-up magnetic resonance imaging. Spine (Phila Pa 1976). 2007;32(4):E136–E140. | ||
Madsen R, Jensen TS, Pope M, Sørensen JS, Bendix T. The effect of body position and axial load on spinal canal morphology: an MRI study of central spinal stenosis. Spine (Phila Pa 1976). 2008;33(1):61–67. | ||
Ozawa H, Kanno H, Koizumi Y, et al. Dynamic changes in the dural sac cross-sectional area on axial loaded MR imaging: is there a difference between degenerative spondylolisthesis and spinal stenosis? AJNR Am J Neuroradiol. 2012;33(6):1191–1197. | ||
Kanno H, Endo T, Ozawa H, et al. Axial loading during magnetic resonance imaging in patients with lumbar spinal canal stenosis: does it reproduce the positional change of the dural sac detected by upright myelography? Spine (Phila Pa 1976). 2012;37(16):E985–E992. | ||
Jayakumar P, Nnadi C, Saifuddin A, Macsweeney E, Casey A. Dynamic degenerative lumbar spondylolisthesis: diagnosis with axial loaded magnetic resonance imaging. Spine (Phila Pa 1976). 2006;31(10):E298–E301. | ||
Chaput C, Padon D, Rush J, Lenehan E, Rahm M. The significance of increased fluid signal on magnetic resonance imaging in lumbar facets in relationship to degenerative spondylolisthesis. Spine (Phila Pa 1976). 2007;32(17):1883–1887. | ||
Caterini R, Mancini F, Bisicchia S, Maglione P, Farsetti P. The correlation between exaggerated fluid in lumbar facet joints and degenerative spondylolisthesis: prospective study of 52 patients. J Orthop Traumatol. 2011;12(2):87–91. | ||
Lattig F, Fekete TF, Grob D, Kleinstück FS, Jeszenszky D, Mannion AF. Lumbar facet joint effusion in MRI: a sign of instability in degenerative spondylolisthesis? Eur Spine J. 2012;21(2):276–281. |
Supplementary material
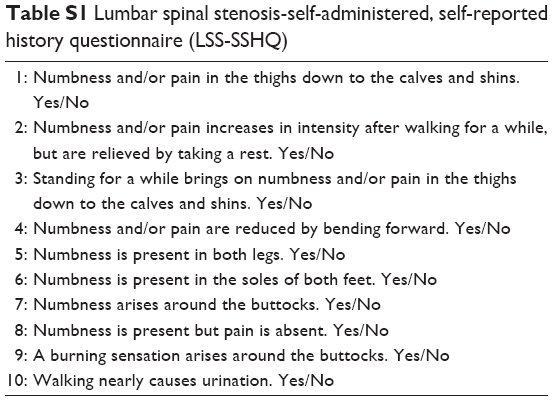 | Table S1 Lumbar spinal stenosis-self-administered, self-reported history questionnaire (LSS-SSHQ) |
 © 2018 The Author(s). This work is published and licensed by Dove Medical Press Limited. The full terms of this license are available at https://www.dovepress.com/terms.php and incorporate the Creative Commons Attribution - Non Commercial (unported, v3.0) License.
By accessing the work you hereby accept the Terms. Non-commercial uses of the work are permitted without any further permission from Dove Medical Press Limited, provided the work is properly attributed. For permission for commercial use of this work, please see paragraphs 4.2 and 5 of our Terms.
© 2018 The Author(s). This work is published and licensed by Dove Medical Press Limited. The full terms of this license are available at https://www.dovepress.com/terms.php and incorporate the Creative Commons Attribution - Non Commercial (unported, v3.0) License.
By accessing the work you hereby accept the Terms. Non-commercial uses of the work are permitted without any further permission from Dove Medical Press Limited, provided the work is properly attributed. For permission for commercial use of this work, please see paragraphs 4.2 and 5 of our Terms.