Back to Journals » Journal of Pain Research » Volume 11
Magnetic resonance imaging analysis of work-related chronic low back pain: comparisons of different lumbar disc patterns
Received 18 January 2018
Accepted for publication 18 June 2018
Published 31 October 2018 Volume 2018:11 Pages 2687—2698
DOI https://doi.org/10.2147/JPR.S162988
Checked for plagiarism Yes
Review by Single anonymous peer review
Peer reviewer comments 3
Editor who approved publication: Dr Erica Wegrzyn
Xin Jiang, Dong Chen
Department of Spine Surgery, China-Japan Friendship Hospital, Beijing, China
Background: Currently, there is a lack of comparative research about different lumbar disc patterns in patients with work-related chronic low back pain (CLBP) based on magnetic resonance imaging (MRI) analysis. Therefore, this study, on different patterns of lumbar disc degeneration or herniation in patients with CLBP, is valuable. In this study, we retrospectively investigated lumbar degenerative changes in patients with CLBP by using MRI analysis.
Materials and methods: Two hundred and eighty-three patients (110 women and 173 men) with work-related CLBP were enrolled and divided into four groups based on intervertebral disc morphology from MRI analysis, including normal discs (ND) group, degenerative discs (DD) group, bulging discs (BD) group, and herniated discs (HD) group. Demographic characteristics, occupational information, Visual Analog Scale (VAS) scores, and Oswestry Disability Index (ODI) scores were analyzed. Moreover, multiple parameters were investigated in the MRI analysis.
Results: The mean age of all 283 patients was 41.8±12.0 years (range, 18–80) and the mean duration of CLBP for all patients was 24.5±24.9 months. There were no significant differences in the patients’ BMI, history of smoking, and education level (P>0.05). The three most common occupational types were manual worker, desk worker, and technician. The VAS and ODI scores of patients with CLBP in the DD, BD, and HD groups were significantly higher than those of patients in the ND group (P<0.05). The degrees of degeneration of L4/5 and L5/S1 were significantly higher than those of other intervertebral discs (P<0.05). The disc heights of L4/5 in the BD and HD groups were significantly lower than those of the ND group (P<0.05) and the disc height of L5/S1 in the HD group was significantly lower than that of the ND group (P<0.05). At the neutral position, the distances of L3/4, L4/5, and L5/S1 discs’ bulge/herniation in the BD and HD groups were significantly higher than those in the ND and DD groups (P<0.05).
Conclusion: In summary, more severe degenerative changes of lower lumbar discs (L4/5 and L5/S1) such as higher degree of degeneration of disc, lower disc height, and significant displacement of disc were found in patients with work-related CLBP based on MRI analysis.
Keywords: chronic low back pain, magnetic resonance imaging analysis, degenerative discs, bulging discs, herniated discs
Introduction
Low back pain (LBP) is a highly prevalent, costly, and disabling musculoskeletal condition, which has become one of the most serious public health problems around the world.1 According to statistics, the lifetime prevalence of LBP is as high as 84% and approximately 11%–12% of people with LBP suffer from disability.2 Up to 2016, LBP has become the first leading cause of years lived with disability (YLDs) in both developed and developing countries, contributing 57.6 million (7.2%) of total YLDs.3 In the USA, the estimated economic burden caused by LBP ranges from 84.1 billion to 624.8 billion dollars including both direct and indirect costs.4 Based on the duration, LBP can be divided into acute LBP (less than 1 month), sub-acute LBP (between 1 and 3 months), and chronic low back pain (CLBP) (more than 3 months).5 Although most patients with acute LBP recover within 8–12 weeks, approximately two thirds of them relapse after 12 months and up to 15% develop CLBP, leading to persistent pain, significantly limited activity, and high risk for disability.6 Therefore, various therapeutic strategies, including non-pharmacological therapies, pharmacological therapies, and surgery, should be timely and properly used in treating CLBP based on different clinical examinations. Radiological imaging techniques, especially magnetic resonance imaging (MRI), play an essential role in aiding to identify or exclude pathological conditions and in planning appropriate therapeutic strategies for CLBP.7,8
Currently, numerous pathogenic factors of CLBP have been reported, such as work-related risk factors, traumatic factors, spinal degenerative diseases, aging, inflammation, tumor, and even psychosocial factors. As we all know, intervertebral disc degeneration (IDD) and intervertebral disc herniation (IDH) are the most common sources of work-related CLBP due to long-term unhealthy posture or manual handling of heavy objects. However, the correlation between the presence of radiographic degenerative changes in intervertebral discs and the presence or severity of back pain was still uncertain, which has drawn increased attention.9 It is an established fact that back pain is a typical symptom associated with degenerative discs (DD) because of direct stimulation caused by structural abnormalities, facet joint arthritis associated with disc height collapse or segmental micro-instability, and induced neurological symptoms.10 Additionally, however, more than 30% of asymptomatic volunteers without any history of back pain have different forms of degenerative changes.11 Besides individual levels of pain sensitivity, the main reason for this uncertain correlation is probably the lack of identified relationship between DD and herniated discs (HD), since disc degeneration does not always precede herniation, and some degenerative changes can follow herniation.12 Therefore, further comprehensive investigation into the correlation between various patterns of disc degeneration and back pain was urgently needed to elucidate the etiological and pathological mechanisms of CLBP.
In the present study, we retrospectively investigated 283 cases with CLBP by using MRI analysis. Four different lumbar disc patterns, including normal discs (ND), DD, bulging discs (BD), and HD, were found in CLBP and compared in detail regarding various aspects based on MRI findings. The aim of this study was to identify MRI differences according to different lumbar disc patterns in CLBP.
Materials and methods
Study design and patients
This retrospective, single-center study was performed based on protocol approved by the Institutional Review Board at the China-Japan Friendship Hospital and in accordance with the Good Clinical Practice guidelines and the principles of the Declaration of Helsinki. The requirement for informed consent was waived because the patient data reviewed were anonymous. We reviewed the medical records of adult patients with CLBP (duration ≥3 months) who received surgical or non-surgical treatment at the Department of Spinal Surgery, China-Japan Friendship Hospital between January 2012 and December 2015 (N=587). The inclusion criterion was a diagnosis of CLBP, defined as primary axial LBP from below the costal margin to the gluteal fold, back pain that was more severe than pain in other parts of the body, every day or almost every day for at least the past 3 months according to European guidelines for the management of chronic nonspecific LBP.13,14 Additional criteria for CLBP included complete clinical evaluations and MRI scan of the whole lumbar vertebrae. The exclusion criteria included patients aged younger than 18 years, lack of back pain every day or nearly every day for at least the past 3 months, pain elsewhere more severe than LBP, unable to undergo MRI scan, primary lumbar infection, spontaneous septic spondylodiscitis or epidural abscess, spinal trauma, spinal tumor, history of spinal or back surgery, severe spinal deformities, hip osteoarthritis, and severe psychological problems.
Demographic and clinical characteristics
Demographic characteristics of each patient were recorded in detail and comprehensively analyzed, including, sex, age, duration of LBP, body mass index (BMI), history of smoking, and education level. Moreover, occupational information, including various work types, working hours per week, manual handling of heavy objects at work, and hours of desk work per day, was further investigated. Visual Analog Scale (VAS) scores and Oswestry Disability Index (ODI) scores were recorded by using professional numerical rating scales. VAS scores (0, no pain, to 10, worst pain) were applied for evaluating back pain. The ODI scores were used to assess functional capacity with a lower percentage indicating a better health status.
MRI analysis and grouping
MRI was the best radiographic method to observe anatomic structures of the lower back including lumbar vertebrae, intervertebral discs, paravertebral soft tissues, and to assess the structural abnormalities, such as degeneration, edema, and displacement.
In this study, MRI scanning of the whole lumbar vertebrae was performed (before the patient underwent any treatment) with a 3.0 Tesla scanner (Symphony Quantum, Siemens AG Medical Solutions, Erlangen, Germany). The standard MRI protocol for LBP typically included 2D sagittal T1-weighted (T1w) fast spin-echo (FSE) with repetition time (TR) <800 and echo time (TE) <30, sagittal and axial T2-weighted (T2w) FSE (TR =2,000; 50< TE <100). Moreover, MRI scanning was performed in three different positions, including neutral position, flexion position, and extension position. Two experienced radiologists and one orthopedic surgeon evaluated all MR images independently. Patients receiving complete clinical examinations and MRI scanning were enrolled in this study and they were divided into four groups according to MRI results, including ND group, DD group, BD group, and HD group. Based on the Lumbar Disc Nomenclature (version 2.0) recommended by the North American Spine Society, the American Society of Spine Radiology, and the American Society of Neuroradiology, “normal disc” was defined as a fully and normally developed disc with no changes attributable to trauma, disease, degeneration, or aging; “degenerative disc” included any or all discs following changes such as desiccation, cleft formation, fibrosis, and gaseous degradation of the nucleus, mucinous degradation, fissuring, loss of integrity of the annulus, defects in and/or sclerosis of the end plates, and osteophytes at the vertebral apophyses; “bulging disc” was defined as a disc in which the contour of the outer annulus extends, or appears to extend, in the horizontal (axial) plane beyond the edges of the disc space, usually greater than 25% (90°) of the circumference of the disc and usually less than 3 mm beyond the edges of the vertebral body apophyses; and “herniated disc” was defined as localized or focal displacement of disc material beyond the normal margin of the intervertebral disc space.
Statistical analysis
Statistical analysis was performed using Statistical Package for the Social Sciences version 19.0 software (IBM Corporation, Armonk, NY, USA). The results were presented as mean ± SD. Student’s t-test and one-way ANOVA were applied for continuous data, and chi-squared test for categorical data. A value of P<0.05 was considered statistically significant.
Results
Demographic characteristics
A total of 283 adult patients (110 women and 173 men) with CLBP were enrolled in this study and were divided into four groups based on MRI analysis, including ND group (n=37), DD group (n=85), BD group (n=123), and HD group (n=38). The mean age of all 283 patients was 41.8±12.0 years (range, 18–80) and the mean age of ND group (31.9±9.6 years) was significantly lower compared with the other groups (P<0.05). Compared with ND group, the mean ages of DD group (42.8±10.1 years), BD group (44.9±12.6 years), and HD group (39.3±11.0 years) were significantly higher (P<0.05). The sex ratio of all patients was approximately six vs four (male vs female), however, the sex ratio of the HD group (84.2% for male and 15.8% for female) was significantly different within each group (P<0.05). The mean duration of CLBP for all patients was 24.5±24.9 months. After grouping, the mean pain duration of ND group, DD group, BD group, and HD group was 15.0±15.2, 23.4±22.9, 28.2±27.8, and 24.8±25.2 months, respectively; the median pain duration of ND group, DD group, BD group, and HD group was 10, 17, 18, and 18 months, respectively. The mean pain duration of BD group was significantly longer than that of ND group (P<0.05). As shown in Table 1, there were no significant differences in the patients’ BMI, history of smoking, and education levels (P>0.05).
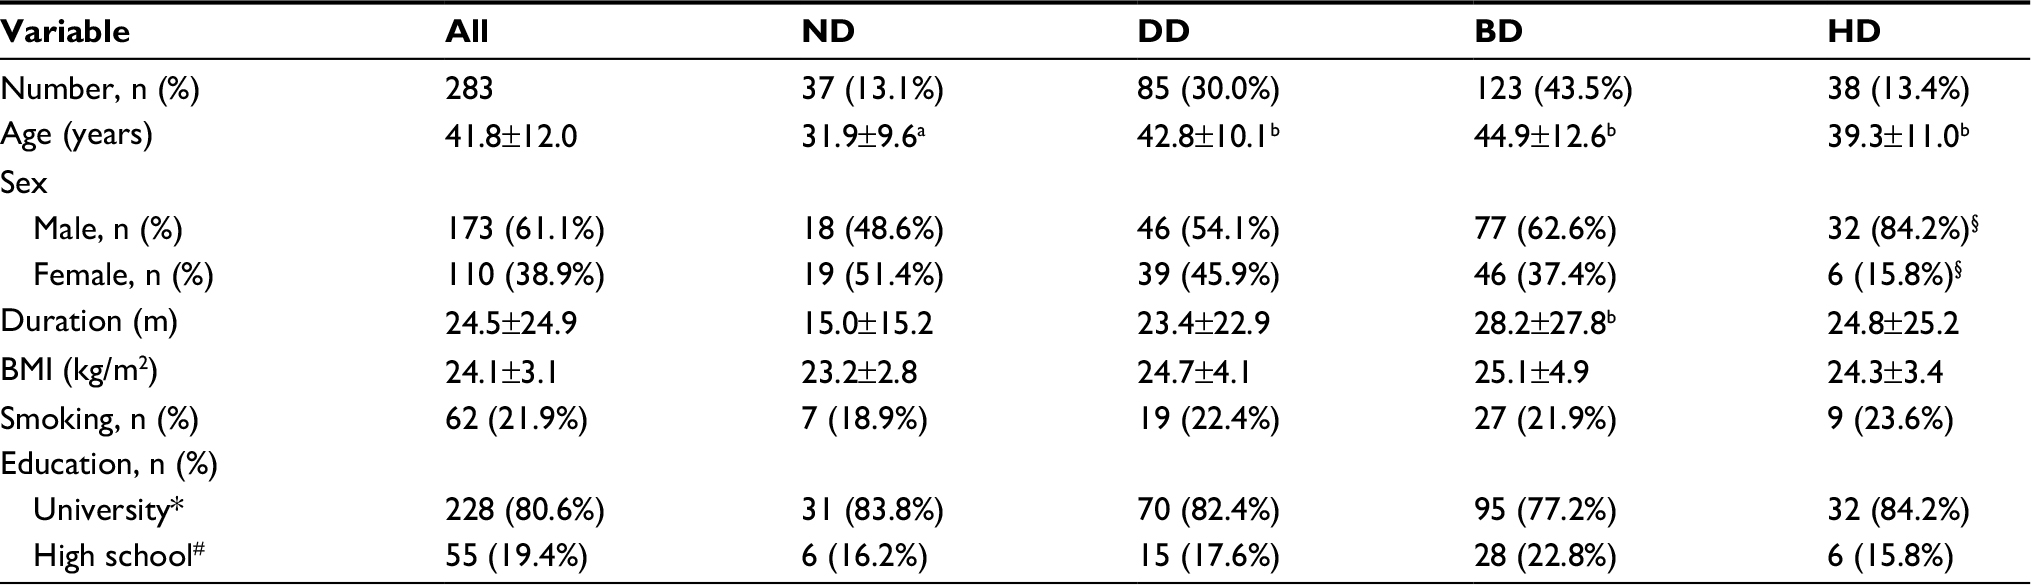 | Table 1 Demographic characteristics of patients with CLBP Notes: Data presented as mean ± SD or n (%) and P<0.05 was considered statistically significant. *Means university or above; #means high school or below. aP<0.05 vs all; bP<0.05 vs ND group; §P<0.05 comparing HD group with each group. Abbreviations: BD, bulging discs; CLBP, chronic low back pain; DD, degenerative discs; HD, herniated discs; ND, normal discs. |
Occupational information
Furthermore, occupation types of patients in the four groups were categorized into ten groups, including manual worker, desk worker, technician, commercial personnel, driver, farmer, freelancer, housekeeping, student, and other unclassified types. The three most common occupation types in the ND, DD, BD, and HD groups were manual workers (37.8%, 22.4%, 26.8%, and 36.8%, respectively), desk workers (18.9%, 16.5%, 13.8%, and 13.2%, respectively), and technicians (10.8%, 23.5%, 28.4%, and 21.1%, respectively). There were no significant differences in all work types percentages between each group (P>0.05). Moreover, the working hours of patients in the ND, DD, BD, and HD groups were 59.7±14.1, 56.4±17.0, 61.1±19.4, and 63.2±18.3 hours per week, respectively. There were no significant differences in working hours per week between each group (P>0.05). As for manual handling of heavy objects at work, the percentages of no manual handling in the ND, DD, BD, and HD groups were 62.2%, 77.6%, 73.2%, and 63.2%, respectively, which were significantly higher than the percentages of manual handling of <20 kg objects or ≥20 kg objects in each group (P<0.05). As shown in Table 2, the hours of desk work in the ND, DD, BD, and HD groups were 4.8±1.3, 6.6±2.5, 5.7±1.9, and 5.1±1.7 hours per day, respectively. The desk work hours of patients in the DD group were significantly higher than those in the other three groups (P<0.05).
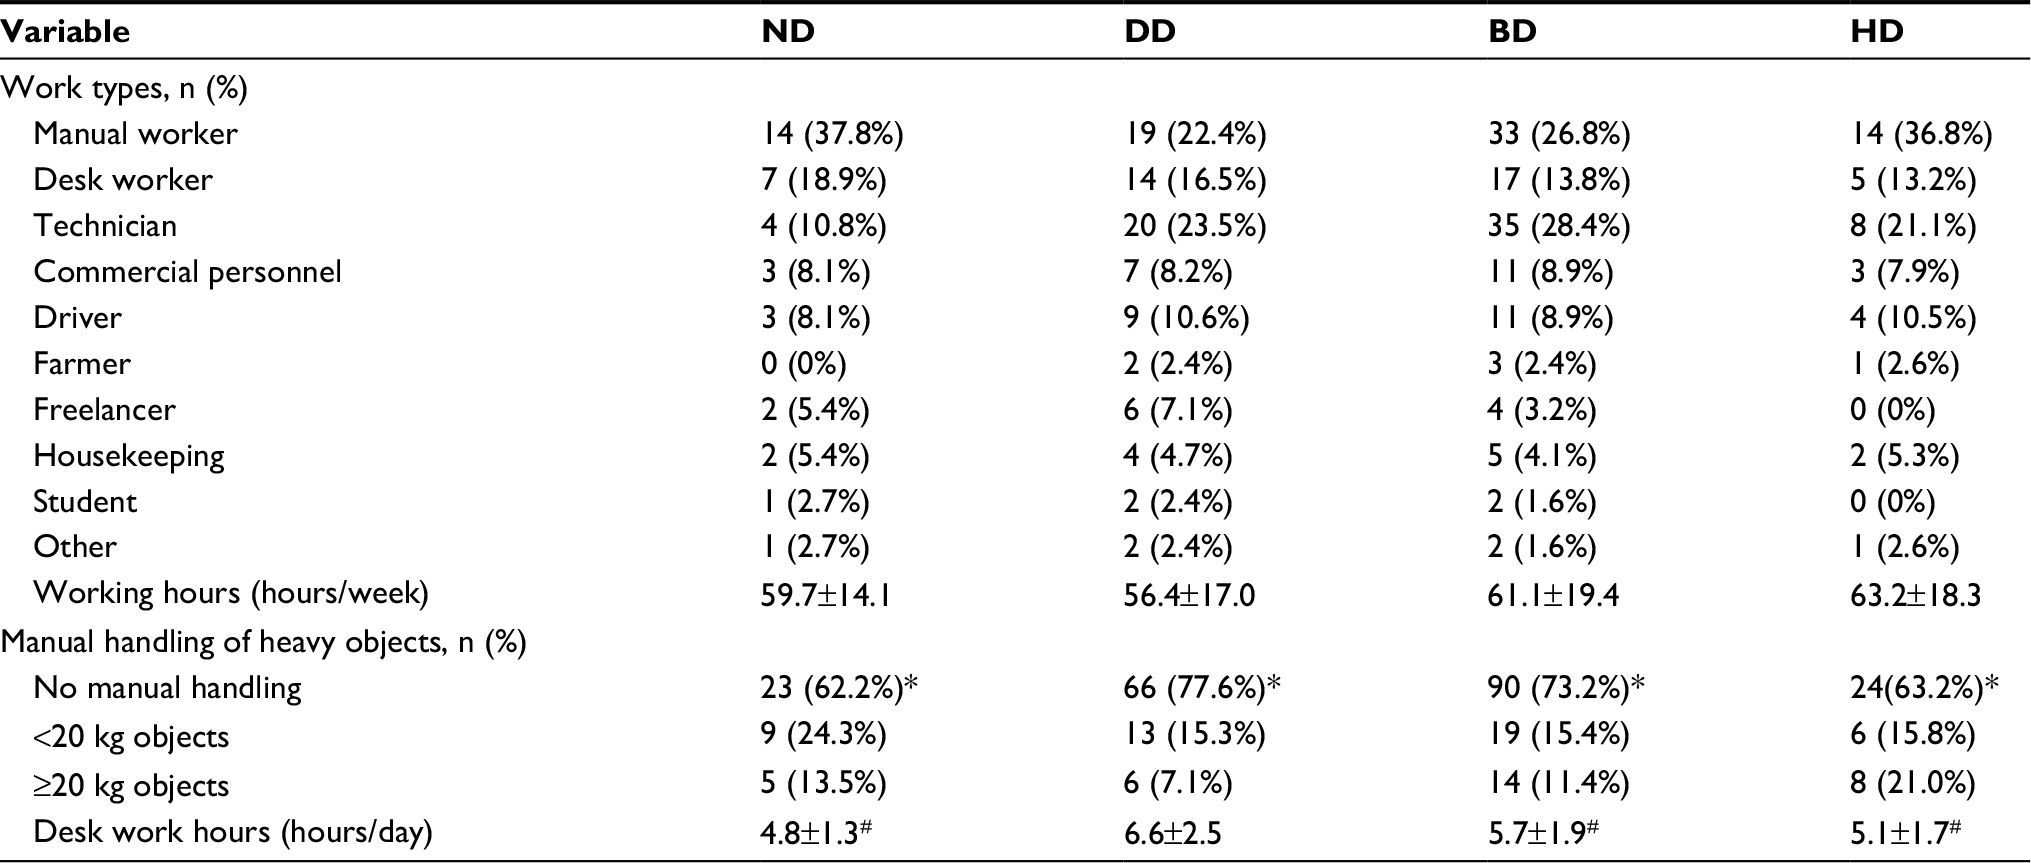 | Table 2 Occupational information of patients with CLBP Notes: Data presented as mean ± SD or n (%) and P<0.05 was considered statistically significant. *P<0.05 vs manual handling of <20 kg objects or manual handling of ≥20 kg objects in each group; #P<0.05 vs DD group. Abbreviations: BD, bulging discs; CLBP, chronic low back pain; DD, degenerative discs; HD, herniated discs; ND, normal discs. |
Clinical characteristics
Clinical symptoms of CLBP were evaluated using VAS scores and ODI scores. VAS scores (0, no pain, to 10, worst pain) were applied for evaluating back pain. As shown in Figure 1, the VAS scores of patients with CLBP in the DD (5.91±2.05), BD (5.76±1.90), and HD (6.13±2.22) groups were significantly higher than the VAS scores of patients in the ND group (4.75±1.29) (P<0.05).
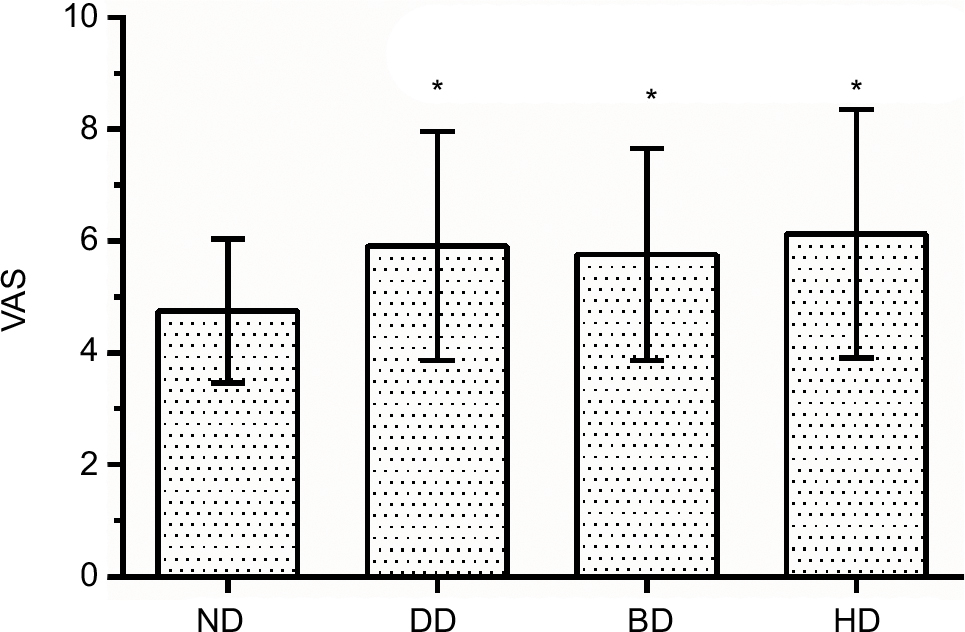 | Figure 1 VAS of patients with CLBP in the four groups. Notes: Data were presented as mean ± SD and P<0.05 was considered statistically significant. *P<0.05 vs ND group. Abbreviations: BD, bulging discs; CLBP, chronic low back pain; DD, degenerative discs; HD, herniated discs; ND, normal discs; VAS, Visual Analog Scale. |
The ODI scores were used to assess functional capacity with a lower percentage indicating a better health status. As shown in Figure 2, the ODI scores of patients in the ND, DD, BD, and HD groups were 26.2%±3.8%, 28.1%±4.6%, 29.4%±5.8%, and 32.5%±6.4%, respectively. Compared with the ND group, the ODI scores of BD and HD groups were significantly higher (P<0.05). Moreover, the ODI scores of HD group were significantly higher than those of DD and BD groups (P<0.05).
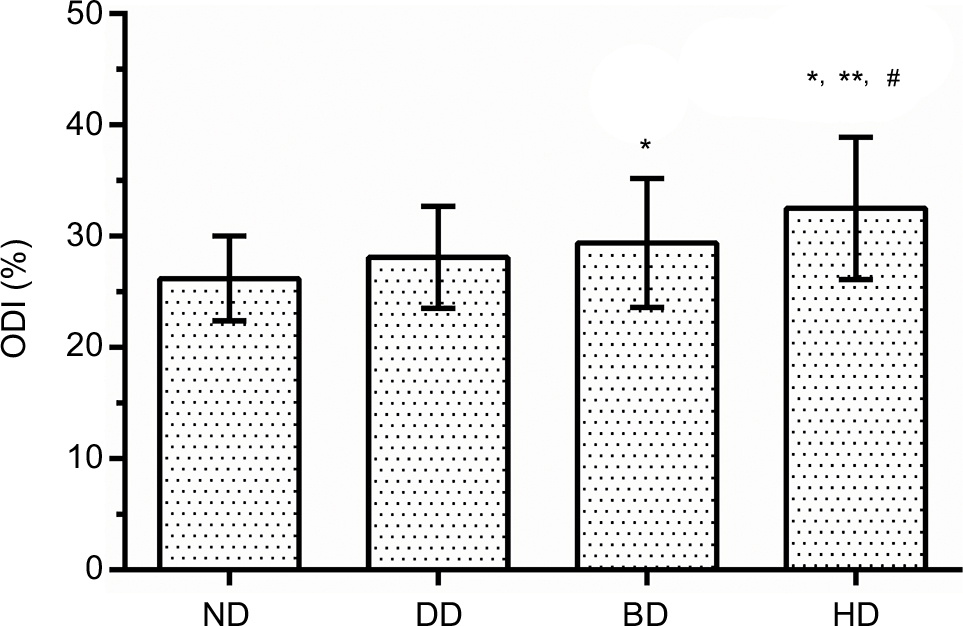 | Figure 2 ODI of patients with CLBP in the four groups. Notes: Data were presented as mean ± SD and P<0.05 was considered statistically significant. *P<0.05 vs ND group; **P<0.05 vs DD group; #P<0.05 vs BD group. Abbreviations: BD, bulging discs; CLBP, chronic low back pain; DD, degenerative discs; HD, herniated discs; ND, normal discs; ODI, Oswestry Disability Index. |
MRI analysis
Multiple parameters were investigated in the MRI analysis, including the degree of degeneration of intervertebral discs (L1-S1), T12-S1 Global Cobb angles (GCAs) (in the neutral, flexion, and extension positions), anterior and posterior vertebral height (PVH), slipping distance of spondylolisthesis (in the neutral, flexion, and extension positions), disc heights (L1-S1), distances of discs’ bulge/herniation (T12-S1 in the neutral, flexion, and extension positions), anteroposterior (AP) diameter of spinal canal at disk level (T12-S1 in the neutral, flexion, and extension positions), and translational motion (L1-S1).
First, the degrees of degeneration of lumbar discs were classified into five grades based on the Pfirrmann grading system: Grade I “homogenous, bright hyperintense disc structure and normal disc height”; Grade II “inhomogeneous, but hyperintense disc structure, with clear differentiation between nucleus and annulus, normal disc height”; Grade III “inhomogeneous, intermediately gray disc with an unclear distinction between nucleus and annulus, normal or slightly decreased disc height”; Grade IV “inhomogeneous, hypointense dark-gray disc with indistinct interface between nucleus and annulus, normal or moderately decreased disc height”; and Grade V “inhomogeneous, hypointense black disc without any distinction between nucleus and annulus, collapsed disc space”.15 As shown in Figure 3, for all 283 patients, the degrees of degeneration of L1/2, L2/3, L3/4, L4/5, and L5/S1 intervertebral discs were 2.50±0.77, 2.56±0.83, 2.76±0.88, 3.08±0.97, and 3.28±0.98, respectively; the degree of degeneration of L3/4 was significantly higher than that of L1/2 (P<0.05); comparing degrees of degeneration of L1/2, L2/3, and L3/4, the intervertebral discs of L4/5 and L5/S1 exhibited more serious degeneration (P<0.05).
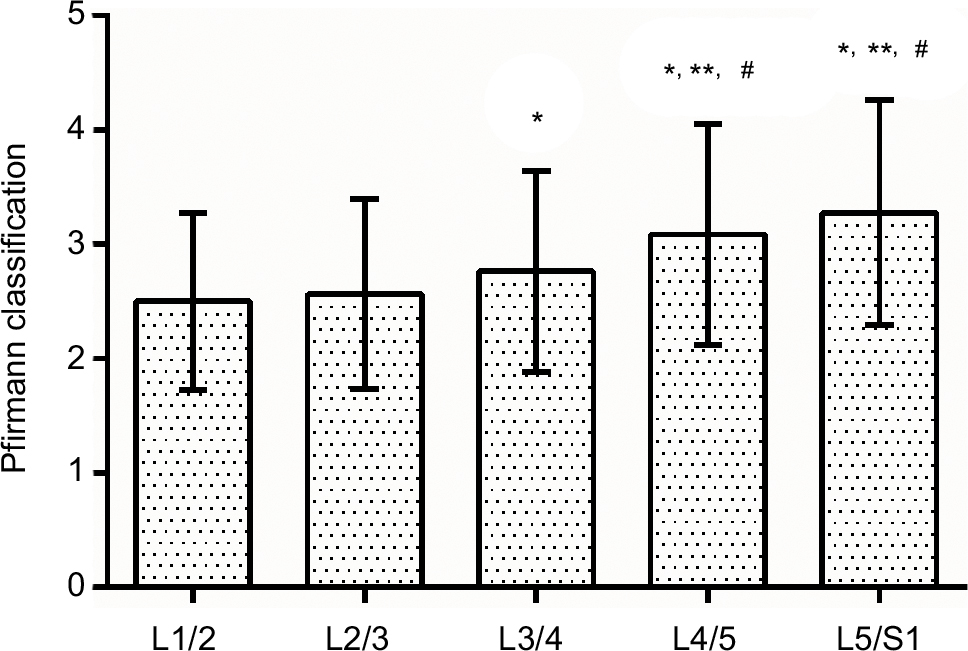 | Figure 3 Degrees of degeneration of lumbar discs in all 283 patients with chronic low back pain based on Pfirrmann classification. Notes: Data were presented as mean ± SD and P<0.05 was considered statistically significant. *P<0.05 vs L1/2; **P<0.05 vs L2/3; #P<0.05 vs L3/4 group. |
After grouping, the degrees of degeneration of L1/2, L2/3, L3/4, L4/5, and L5/S1 discs in the ND group were 1.97±0.16, 2.00±0.00, 2.00±0.24, 1.97±0.16, and 2.02±0.16, respectively; those in the DD group were 2.49±0.73, 2.52±0.80, 2.61±0.74, 2.84±0.88, and 3.14±0.91, respectively; those in the BD group were 2.68±0.85, 2.77±0.90, 3.04±0.94, 3.45±0.88, and 3.63±0.86, respectively; those in the HD group were 2.45±0.72, 2.55±0.80, 2.95±0.87, 3.55±0.86, and 3.66±0.88, respectively. Compared with the ND group, the degrees of degeneration of L1-S1 discs in the DD, BD, and HD groups were significantly higher (P<0.05) and compared with the DD group, the degrees of degeneration of L3-S1 discs in the BD and HD group were significantly higher (P<0.05). As shown in Figure 4, there were no significant differences in disc degeneration within the five different segments (P>0.05). In the DD group, the degree of degeneration of L4/5 disc was significantly higher than that of L1/2 (P<0.05) and that of L5/S1 disc was significantly higher than that of L1/2, L2/3, and L3/4 (P<0.05); in the BD group, the degree of degeneration of L3/4 disc was significantly higher than that of L1/2 (P<0.05) and that of L4/5 and L5/S1 were significantly higher than those of L1/2, L2/3 and L3/4 (P<0.05); and in the HD group, the degrees of degeneration of L4/5 and L5/S1 were significantly higher than those of L1/2, L2/3, and L3/4 (P<0.05).
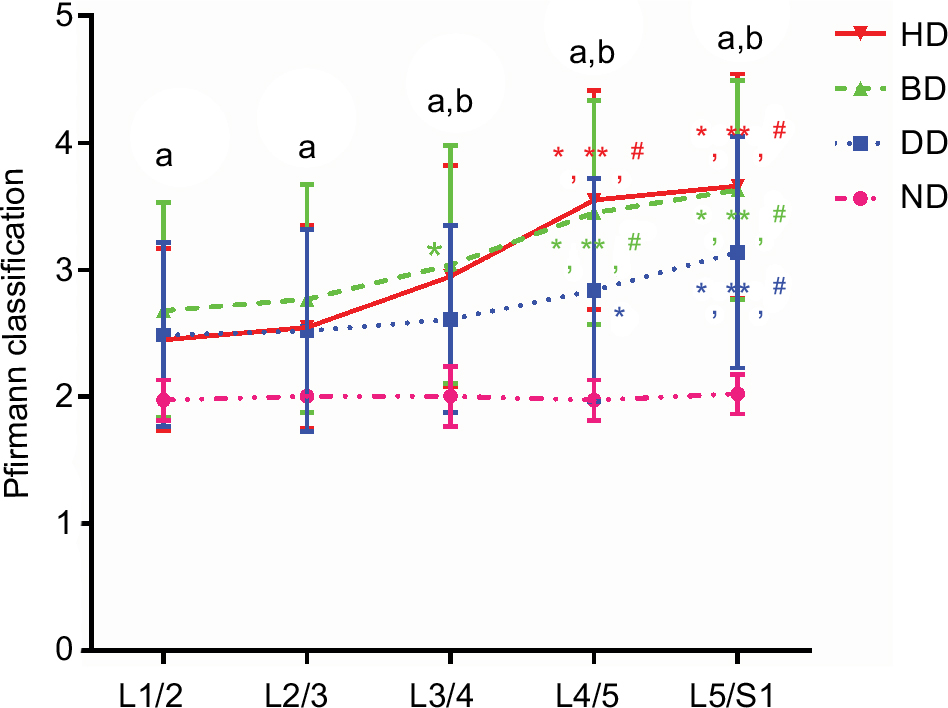 | Figure 4 Degrees of degeneration of lumbar discs in different groups. Notes: Data were presented as mean ± SD and P<0.05 was considered statistically significant. *P<0.05 vs L1/2; **P<0.05 vs L2/3; #P<0.05 vs L3/4 group; aP<0.05 vs ND group; bP<0.05 vs DD group. Abbreviations: BD, bulging discs; DD, degenerative discs; HD, herniated discs; ND, normal discs. |
T12-S1 GCA of lumbar lordosis was measured as the angle between the inferior vertebral endplate of T12 and superior sacral base (S1) at three different positions, such as neutral, flexion, and extension (Figure 5).
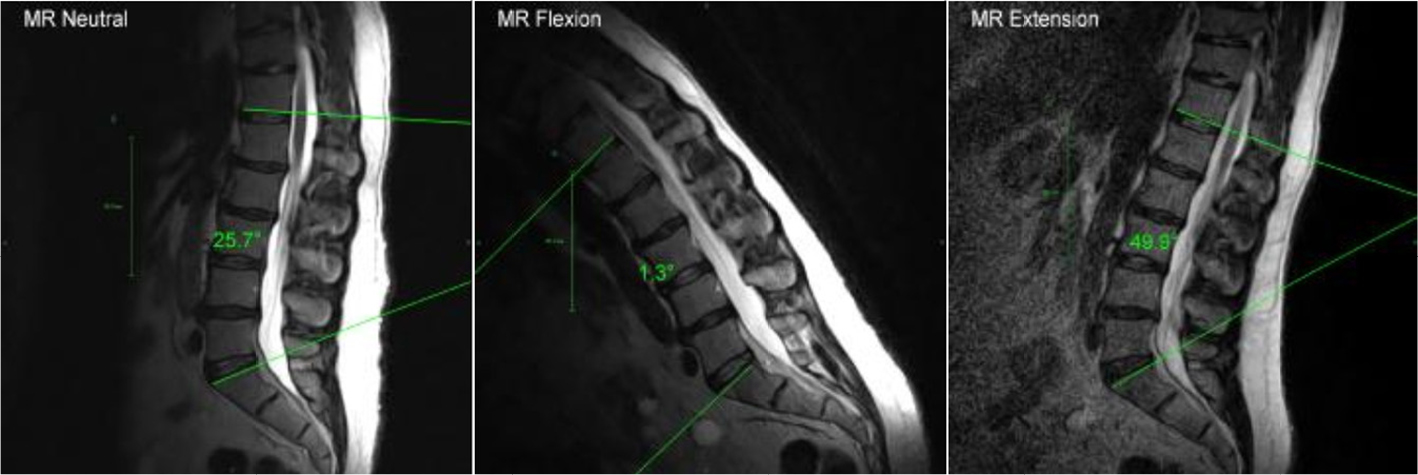 | Figure 5 T12-S1 Global Cobb angle of lumbar lordosis. |
The GCAn (GCA at the neutral position) of the ND, DD, BD, and HD groups were –29.230±11.99°, –32.960±14.57°, –31.280±14.91°, and –29.970±14.49°, respectively; the GCAf (GCA at the flexion position) of the ND, DD, BD, and HD groups were –11.30±13.84°, –15.05±14.12°, –12.33±15.48°, and –13.06±11.40°, respectively; and GCAe (GCA at the extension position) of the ND, DD, BD, and HD groups were –56.97±10.35°, –57.46±11.61°, –50.61±13.39°, and –51.72±15.62°, respectively. As shown in Figure 6, the GCAe of BD group was significantly lower than that of DD group (P<0.05).
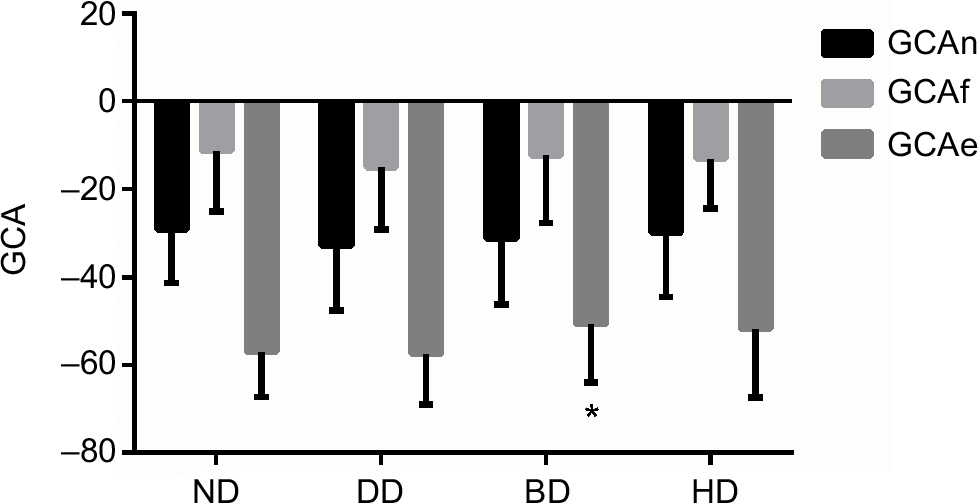 | Figure 6 T12-S1 Global Cobb angle of lumbar lordosis. Notes: Data were presented as mean ± SD and P<0.05 was considered statistically significant. *P<0.05 vs DD group. Abbreviations: BD, bulging discs; DD, degenerative discs; GCA, Global Cobb angle; GCAe, GCA at the extension position; GCAf, GCA at the flexion position; GCAn, GCA at the neutral position; HD, herniated discs; ND, normal discs. |
Anterior vertebral height (AVH) was measured as the distance between the anterosuperior and anteroinferior corners of the vertebral body, as seen on the sagittal view (Figure 7). PVH was measured as the distance between the posterosuperior and posteroinferior corners of the vertebral body, as seen on the sagittal view (Figure 7). The AVH and PVH of patients in the four groups were shown in Table 3 and there were no significant differences within each group (P>0.05) (Figure 7).
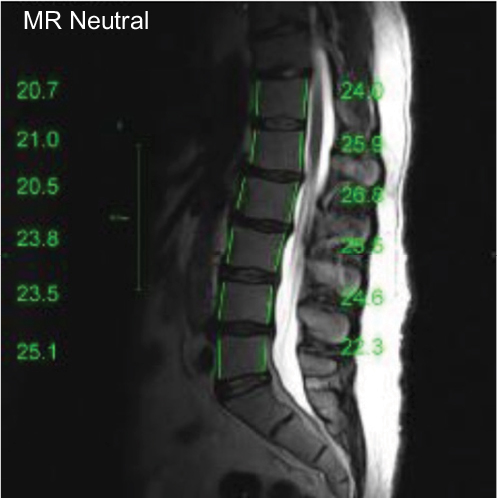 | Figure 7 Anterior and posterior vertebral height. |
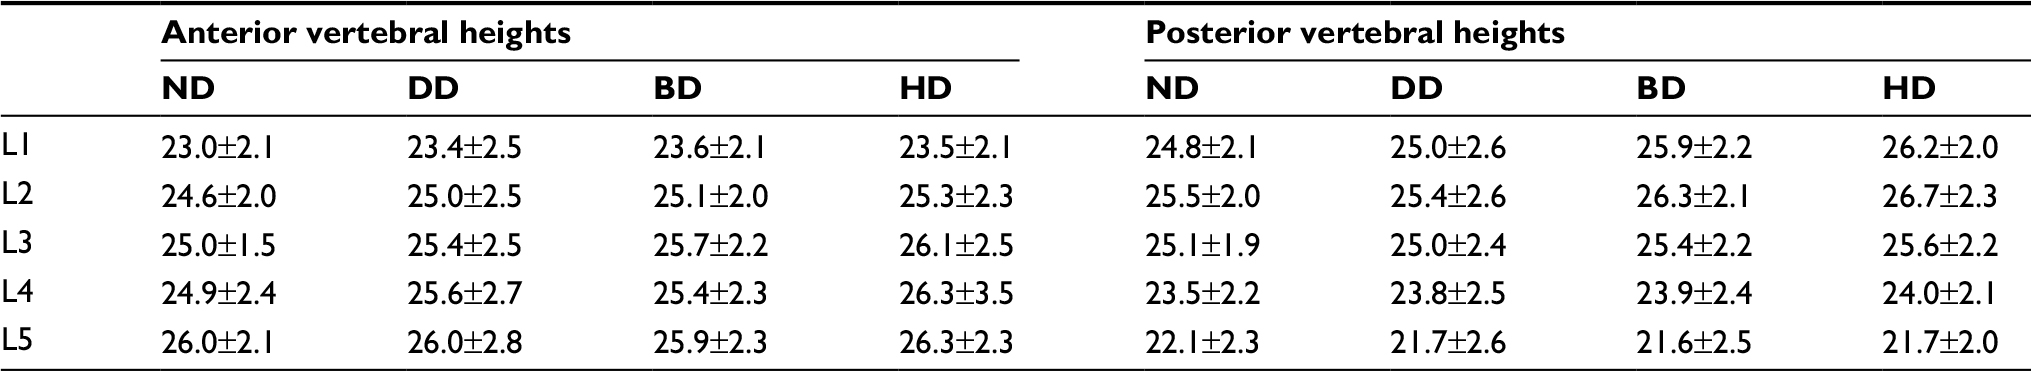 | Table 3 Anterior vertebral heights (AVHs) and posterior vertebral heights (PVHs) of patients in the four groups Note: Data presented as mean ± SD. Abbreviations: BD, bulging discs; DD, degenerative discs; HD, herniated discs; ND, normal discs. |
Slipping distance of spondylolisthesis was the measured displacement of the inferior endplate of the vertebra above with respect to the superior endplate of the vertebra below (Figure 8). Positive values denoted an anterior slip whereas negative values denoted a posterior slip. As shown in Table 4, there were no significant differences in slipping distance of spondylolisthesis within each group (P>0.05).
 | Figure 8 Slipping distance of spondylolisthesis at the neutral, flexion, and extension position. |
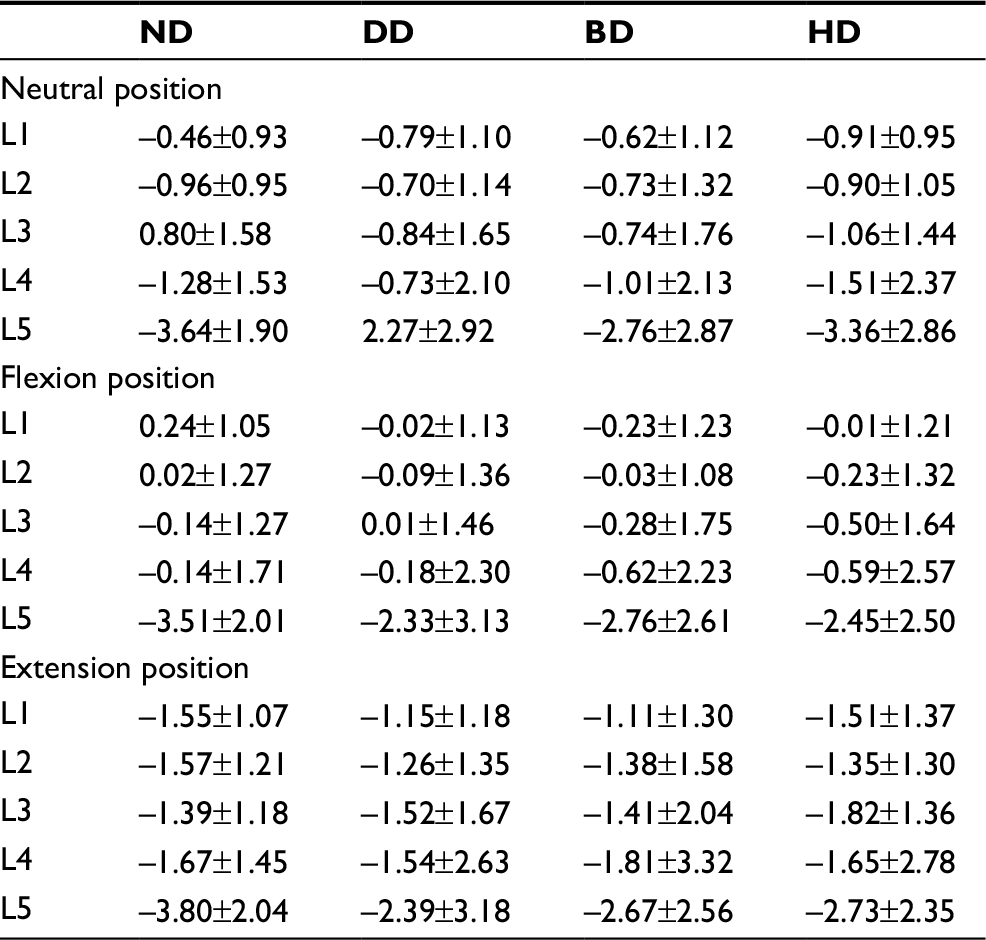 | Table 4 Slipping distance of spondylolisthesis of patients in four groups at the neutral, flexion, and extension position Note: Data presented as mean ± SD. Abbreviations: BD, bulging discs; DD, degenerative discs; HD, herniated discs; ND, normal discs. |
Mid-disk height of the intervertebral disc was measured as the distance between the centers of adjacent vertebral endplates. The disc height of L1/L2 (DHL1) of the ND, DD, BD, and HD groups were 10.01±1.50, 9.78±1.54, 9.72±1.76, and 10.22±1.79, respectively; the disc height of L2/3 (DHL2) of the ND, DD, BD, and HD groups were 11.31±1.75, 11.08±1.93, 11.11±1.99, and 11.23±1.93, respectively; the disc height of L3/4 (DHL3) of the ND, DD, BD, and HD groups were 12.03±1.66, 11.56±1.59, 11.24±2.20, and 11.56±2.21, respectively; the disc height of L4/5 (DHL4) of the ND, DD, BD, and HD groups were 12.64±1.66, 12.00±1.80, 11.31±2.41, and 10.68±2.60, respectively; and the disc height of L5/S1 (DHL5) of the ND, DD, BD, and HD groups were 11.26±1.62, 10.67±2.24, 10.45±5.78, and 9.56±2.35, respectively. As shown in Figure 9, the disc heights of L4/5 in the BD and HD groups were significantly lower than those of the ND group (P<0.05); the disc height of L4/L5 in the HD group was significantly lower than that of the DD group (P<0.05); the disc height of L5/S1 in the HD group was significantly lower than that of the ND group (P<0.05).
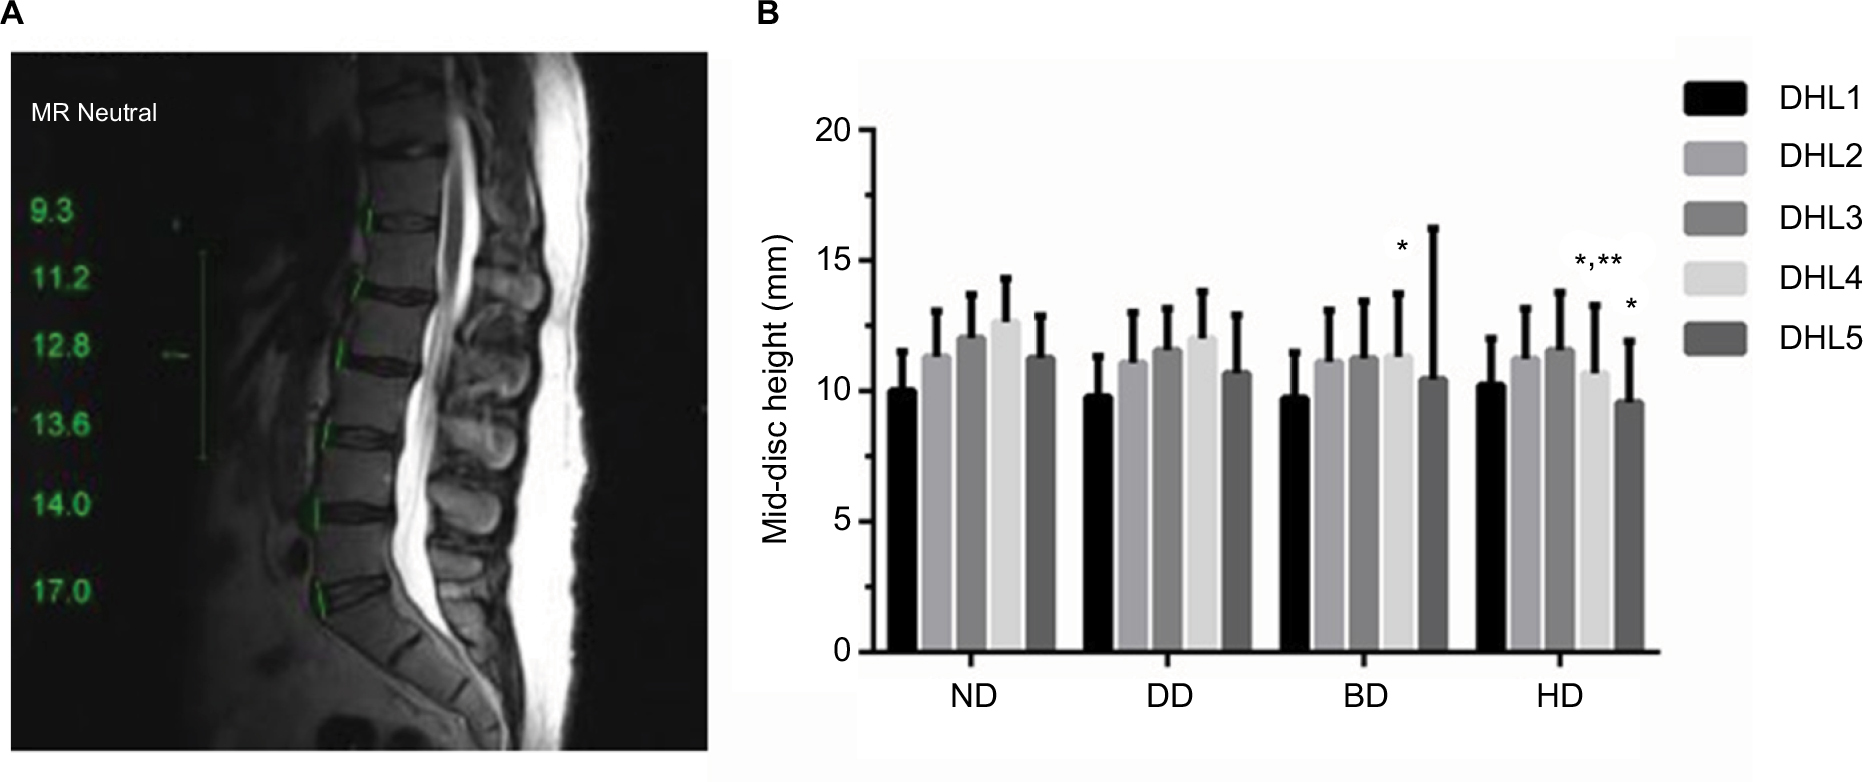 | Figure 9 Mid-disk height of the intervertebral discs (A) in four groups (B). Notes: Data were presented as mean ± SD and P<0.05 was considered statistically significant. *P<0.05 vs ND group; **P<0.05 vs DD group. Abbreviations: BD, bulging discs; DD, degenerative discs; DHL1, disc height of L1/2; DHL2, disc height of L2/3; DHL3, disc height of L3/4; DHL4, disc height of L4/5; DHL5, disc height of L5/S1; HD, herniated discs; ND, normal discs. |
Disc bulge/herniation was measured as the extension of the disc beyond the intervertebral space (Figure 10). Grading classification was according to the size of the disc bulge/herniation. It was termed small when <5 mm; moderate when 6–10 mm; and severe when >10 mm. As shown in Table 5, at the neutral position, the distances of L3/4, L4/5, and L5/S1 discs’ bulge/herniation in the BD and HD groups were significantly higher than those in the ND and DD groups (P<0.05), the displacement distance of L4/5 in the HD group was also significantly higher than that of the BD group (P<0.05); at the flexion position, the distances of L4/5 and L5/S1 discs’ bulge/herniation in the BD and HD groups were significantly higher than those in the ND and DD groups (P<0.05), the displacement distance of L3/4 in the HD group was also significantly higher than that of the ND and DD groups (P<0.05); at the extension position, the distances of L4/5 and L5/S1 discs’ bulge/herniation in the BD and HD groups were significantly higher than those in the ND and DD groups (P<0.05).
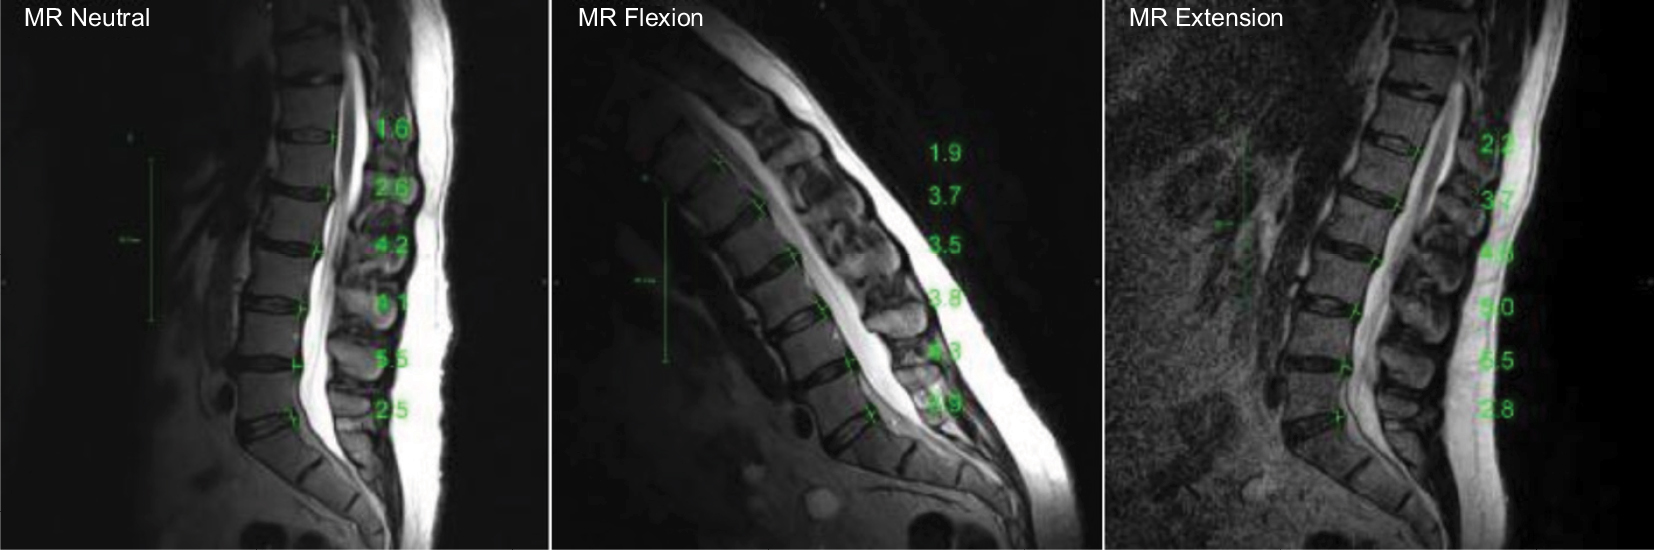 | Figure 10 Distances of T12-S1 discs’ bulge/herniation at the neutral, flexion, and extension position. |
 | Table 5 Distances of T12-S1 discs’ bulge/herniation at the neutral, flexion, and extension positions Notes: Data presented as mean ± SD (mm) and P<0.05 was considered statistically significant. *P<0.05 vs ND group; **P<0.05 vs DD group; #P<0.05 vs BD group. Abbreviations: BD, bulging discs; DD, degenerative discs; HD, herniated discs; ND, normal discs. |
AP diameter of spinal canal at disc level was measured as the AP diameter of the spinal canal between the posterior surface of the disk and the interspinous ligament (excluding the posterior epidural fat) (Figure 11). As shown in Table 6, there were no significant differences in AP diameter of spinal canal at disc level within each group at the neutral, flexion, and extension position (P>0.05).
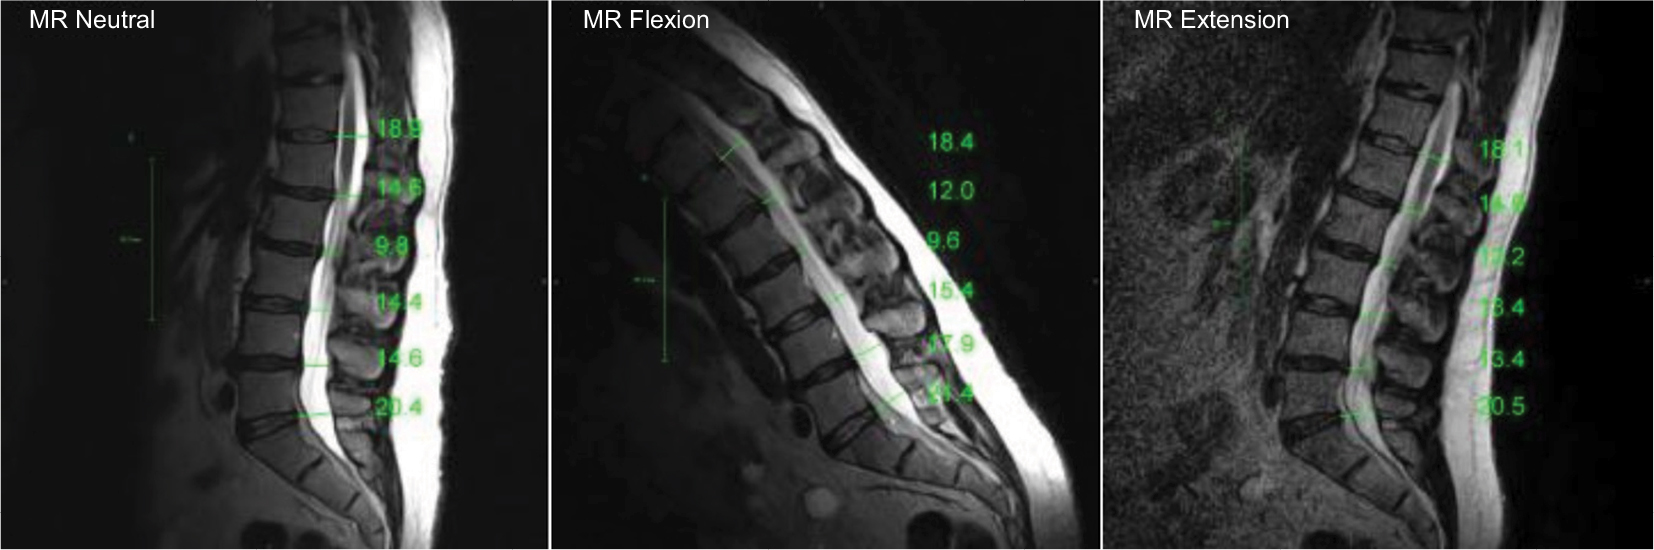 | Figure 11 Anteroposterior (AP) diameter of spinal canal at disc level in the neutral, flexion, and extension position. |
 | Table 6 Anteroposterior (AP) diameter of spinal canal at disc level in the neutral, flexion, and extension position Note: Data presented as mean ± SD (mm) and P<0.05 was considered statistically significant. Abbreviations: BD, bulging discs; DD, degenerative discs; HD, herniated discs; ND, normal discs. |
Translational motion was measured by determining the AP motion of one vertebra over another (Figure 12). As shown in Table 7, there were no significant differences in the translational motion (L1-S1) within different groups (P>0.05).
 | Figure 12 Translational motion (L1-S1). |
 | Table 7 Translational motion (L1-S1) of patients in the four groups Note: Data presented as mean ± SD. Abbreviations: BD, bulging discs; DD, degenerative discs; HD, herniated discs; ND, normal discs. |
Discussion
DD disease is the most common cause of LBP. However, the relationship between various patterns of DD and LBP was still unclear. Comprehensive MRI analysis of lumbar disc degeneration patterns in CLBP could help to fully elucidate the structural characteristics of various kinds of disc degeneration and their relationship with LBP.16 In this study, four kinds of lumbar disc degeneration patterns were found in 283 patients with work-related CLBP, including ND (morphologically ND), DD (degenerative changes without any kind of displacement), BD (annular tissue which extends symmetrically or asymmetrically beyond the edges of vertebral apophyses, usually greater than 25% of the circumference of the disc), and HD (localized or focal displacement of disc material beyond the limits of the intervertebral disc space). The mean age of patients in the ND group was significantly lower than that of all patients in the other three groups, indicating that aging was one of the most important factors in disc degeneration in CLBP. LBP can be divided into acute LBP (less than 1 month), sub-acute LBP (between 1 and 3 months), and CLBP (more than 3 months).5 Approximately two thirds of acute LBP patients will relapse after 12 months and up to 15% will develop CLBP.6 In our study, the pain duration of every enrolled patient with LBP was longer than 3 months and the mean duration was 24.5±24.9 months (3–120 months). The mean pain duration of the BD group was significantly longer than that of the ND group and there were no significant differences in pain duration compared within each group. Konstantinou et al17 reported that approximately 43.4% patients had suffered back pain longer than 3 months and duration of back pain in 28.2% patients was longer than 6 months. Azimi et al18 found that mean duration of LBP in patients with lumbar canal stenosis was approximately 25.1–29.6 months, which was similar to our results. Duration and intensity of back pain were the strongest independent prognostic factors negatively associated with better clinical outcomes in LBP.19 Increasingly, more attention should be focused on CLBP because of its high risk for physical disability and persistent pain-related psychological problems.6 Moreover, the relatively low overall level of BMI (<30) and smoking habits probably accounted for no significant differences in CLBP patients’ BMI and smoking history.
Furthermore, the occupational information of patients with work-related CLBP (ruling out other factors inducing LBP, such as trauma, psychological problems, tumor, deformity, and infection) was carefully analyzed. The three most common work types were manual work, desk work, and technician work in our study. Moreover, the mean working hours of patients in the BD and HD groups were higher than 60 hours per week and the mean working hours of patients in the ND and DD groups were lower than 60 hours per week, however, there were no significant differences between each group. Matsudaira et al20 performed a 2-year, prospective cohort study (Japan epidemiological research of occupation-related back pain study) and, similarly, found that most participants’ (86%) working hours were lower than 60 hours per week. It suggested that working hours might not be a significant risk factor for back pain. Moreover, in our study, the percentages of no manual handling of heavy objects in the ND, DD, BD, and HD groups were significantly higher than the percentages of manual handling of <20 kg objects or ≥20 kg objects in each group, indicating that most patients with work-related CLBP did not perform manual handling of heavy objects at work, and a high education level (80.6% university) might be one of the reasons. Similar results from another study by Matsudaira et al21 reported that approximately 65%–70% patients with back pain performed no manual handling of heavy objects at work. Compared with the ND group, the ODI scores of BD and HD groups were significantly higher; the ODI scores of HD group were significantly higher than that of DD and BD groups. VAS and ODI scores further suggested that CLBP patients with disc degeneration seemed to have more severe physical disability and more intense pain; however, there was no significant association between disc degeneration and severity of disability or intensity of pain in patients with CLBP, which was similar to a previous study.22
According to the MRI analysis, we found that, comparing degrees of degeneration of L1/2, L2/3, and L3/4, the intervertebral discs of L4/5 and L5/S1 exhibited more serious degeneration. Based on the experimental biomechanical observations, the incidence of lower lumbar degeneration (L4/5 and L5/S1) was 74.6% compared with upper lumbar degeneration (25.4%) due to highest biomechanical stress. However, patients with DD disease had a higher incidence of upper lumbar degeneration and L1/2, L2/3, and L3/4 discs were more frequently involved in the degenerative process even in mechanically advantageous positions, which further indicated that multiple factors could lead to disc degeneration instead of merely mechanical stress.23 Furthermore, we performed comparisons within each group and found that compared with the ND group, the degrees of degeneration of L1-S1 discs in the DD, BD, and HD groups were significantly higher; compared with the DD group, the degrees of degeneration of L3-S1 discs in the BD and HD groups were significantly higher, indicating that degrees of degeneration of discs in the BD and HD groups seemed to be more severe. Although there was no temporal sequence between disc degeneration and disc displacement (bulging and herniation), most surgically removed HD tissues seemed to exhibit degenerative changes.12 In this study, BD and HD patients with work-related CLBP exhibited higher degrees of degeneration than other disc patterns due to exclusion of trauma, tumor, infection, and other destructive factors. Second, we found that the disc heights of L4/5 in the BD and HD groups were significantly lower than those of the ND group; the disc height of L4/L5 in the HD group was significantly lower than that of DD group; the disc height of L5/S1 in the HD group was significantly lower than that of ND group. Chen et al25 performed an age-/sex-matched case-control radiographic study and suggested that decreased anterior disc height was an independent predictor of lumbar degenerative disc disease in middle-aged women with LBP. Moreover, Lidar et al26 found that significant weight reduction was associated with a marked increase in the L4/5 disc height and a significant decrease in LBP. Third, we found that the distances of L3/4, L4/5, and L5/S1 discs’ bulge/herniation in the BD and HD groups were significantly higher than those in the ND and DD groups, the displacement distance of L4/5 in the HD group was also significantly higher than that of the BD group, indicating that the disc displacement in lower lumbar discs might be associated with LBP. Lidar et al26 suggested that axial overloading was harmful to lumbar disc degeneration and static overloading could predispose to the posterior herniation of discs leading to LBP. Overall, in this study, we found that patients with work-related CLBP could exhibit more severe degenerative changes of discs, such as higher degree of degeneration of disc, lower disc height, and significant disc displacement, especially in the lower lumbar discs (L4/5 and L5/S1). This study has contributed to a better understanding of MRI changes in work-related CLBP and its relevant clinical features.
There were still several limitations within this study, including insufficient number of enrolled patients, lack of MRI data of other risk factors related to CLBP, the absence of follow-up research – especially MRI changes after effective treatments for CLBP, and not being a prospective, randomized controlled trail.
Conclusion
In summary, more severe degenerative changes in lower lumbar discs (L4/5 and L5/S1), such as higher degree of disc degeneration, lower disc height, and significant disc displacement, were found in patients with work-related CLBP based on MRI analysis.
Disclosure
The authors report no conflicts of interest in this work.
References
Morlion B. Chronic low back pain: pharmacological, interventional and surgical strategies. Nat Rev Neurol. 2013;9(8):462–473. | ||
Balagué F, Mannion AF, Pellisé F, Cedraschi C. Non-specific low back pain. Lancet. 2012;379(9814):482–491. | ||
GBD 2016 Disease and Injury Incidence and Prevalence Collaborators. Global, regional, and national incidence, prevalence, and years lived with disability for 328 diseases and injuries for 195 countries, 1990–2016: a systematic analysis for the Global Burden of Disease Study 2016. Lancet. 2017;390(10100):1211–1259. | ||
Gore M, Sadosky A, Stacey BR, Tai KS, Leslie D. The burden of chronic low back pain: clinical comorbidities, treatment patterns, and health care costs in usual care settings. Spine. 2012;37(11):E668–E677. | ||
Ract I, Meadeb JM, Mercy G, et al. A review of the value of MRI signs in low back pain. Diagn Interv Imaging. 2015;96(3):239–249. | ||
Maher C, Underwood M, Buchbinder R. Non-specific low back pain. Lancet. 2017;389(10070):736–747. | ||
Zheng CJ, Chen J. Disc degeneration implies low back pain. Theor Biol Med Model. 2015;12:24. | ||
Gopalakrishnan N, Nadhamuni K, Karthikeyan T. Categorization of pathology causing low back pain using magnetic resonance imaging (MRI). J Clin Diagn Res. 2015;9(1):TC17–TC20. | ||
Amin RM, Andrade NS, Neuman BJ, Herniation LD. Lumbar disc herniation. Curr Rev Musculoskelet Med. 2017;10(4):507–516. | ||
Heuck A, Glaser C. Basic aspects in MR imaging of degenerative lumbar disk disease. Semin Musculoskelet Radiol. 2014;18(3):228–239. | ||
Farshad-Amacker NA, Farshad M, Winklehner A, Andreisek G. MR imaging of degenerative disc disease. Eur J Radiol. 2015;84(9):1768–1776. | ||
Lama P, Le Maitre CL, Dolan P, et al. Do intervertebral discs degenerate before they herniate, or after? Bone Joint J. 2013;95-B(8):1127–1133. | ||
Airaksinen O, Brox JI, Cedraschi C, et al. Chapter 4. European guidelines for the management of chronic nonspecific low back pain. Eur Spine J. 2006;15(Suppl 2):S192–S300. | ||
Bechara BP, Agarwal V, Boardman J, et al. Correlation of pain with objective quantification of magnetic resonance images in older adults with chronic low back pain. Spine. 2014;39(6):469–475. | ||
Pfirrmann CW, Metzdorf A, Zanetti M, Hodler J, Boos N. Magnetic resonance classification of lumbar intervertebral disc degeneration. Spine. 2001;26(17):1873–1878. | ||
Suthar P, Patel R, Mehta C, Patel N. MRI evaluation of lumbar disc degenerative disease. J Clin Diagn Res. 2015;9(4):TC04–TC09. | ||
Konstantinou K, Dunn KM, Ogollah R, et al. Prognosis of sciatica and back-related leg pain in primary care: the ATLAS cohort. Spine J. 2018;18(6):1030–1040. | ||
Azimi P, Yazdanian T, Benzel EC. Preliminary results of relationship between preoperative walking ability and magnetic resonance imaging morphology in patients with lumbar canal stenosis: comparison between trefoil and triangle types of spinal stenosis. Asian Spine J. 2017;11(4):580–585. | ||
Dunn KM, Croft PR. The importance of symptom duration in determining prognosis. Pain. 2006;121(1–2):126–132. | ||
Matsudaira K, Konishi H, Miyoshi K, et al. Potential risk factors for new onset of back pain disability in Japanese workers: findings from the Japan epidemiological research of occupation-related back pain study. Spine. 2012;37(15):1324–1333. | ||
Matsudaira K, Kawaguchi M, Isomura T, et al. Identification of risk factors for new-onset sciatica in Japanese workers: findings from the Japan epidemiological research of occupation-related back pain study. Spine. 2013;38(26):E1691–E1700. | ||
Perera RS, Dissanayake PH, Senarath U, et al. Associations between disc space narrowing, anterior osteophytes and disability in chronic mechanical low back pain: a cross sectional study. BMC Musculoskelet Disord. 2017;18(1):193. | ||
Kanna RM, Shetty AP, Rajasekaran S. Patterns of lumbar disc degeneration are different in degenerative disc disease and disc prolapse magnetic resonance imaging analysis of 224 patients. Spine J. 2014;14(2):300–307. | ||
Roberts S, Evans EH, Kletsas D, Jaffray DC, Eisenstein SM. Senescence in human intervertebral discs. Eur Spine J. 2006;15(Suppl 3):S312–S316. | ||
Chen IR, Wei TS. Disc height and lumbar index as independent predictors of degenerative spondylolisthesis in middle-aged women with low back pain. Spine. 2009;34(13):1402–1409. | ||
Lidar Z, Behrbalk E, Regev GJ, et al. Intervertebral disc height changes after weight reduction in morbidly obese patients and its effect on quality of life and radicular and low back pain. Spine. 2012;37(23):1947–1952. |
 © 2018 The Author(s). This work is published and licensed by Dove Medical Press Limited. The
full terms of this license are available at https://www.dovepress.com/terms
and incorporate the Creative Commons Attribution
- Non Commercial (unported, 3.0) License.
By accessing the work you hereby accept the Terms. Non-commercial uses of the work are permitted
without any further permission from Dove Medical Press Limited, provided the work is properly
attributed. For permission for commercial use of this work, please see paragraphs 4.2 and 5 of our Terms.
© 2018 The Author(s). This work is published and licensed by Dove Medical Press Limited. The
full terms of this license are available at https://www.dovepress.com/terms
and incorporate the Creative Commons Attribution
- Non Commercial (unported, 3.0) License.
By accessing the work you hereby accept the Terms. Non-commercial uses of the work are permitted
without any further permission from Dove Medical Press Limited, provided the work is properly
attributed. For permission for commercial use of this work, please see paragraphs 4.2 and 5 of our Terms.