Back to Journals » Risk Management and Healthcare Policy » Volume 14
Machine Learning-Based Prediction for 4-Year Risk of Metabolic Syndrome in Adults: A Retrospective Cohort Study
Authors Zhang H, Chen D, Shao J, Zou P ![]() , Cui N
, Cui N ![]() , Tang L
, Tang L ![]() , Wang X, Wang D, Wu J, Ye Z
, Wang X, Wang D, Wu J, Ye Z
Received 9 July 2021
Accepted for publication 18 September 2021
Published 20 October 2021 Volume 2021:14 Pages 4361—4368
DOI https://doi.org/10.2147/RMHP.S328180
Checked for plagiarism Yes
Review by Single anonymous peer review
Peer reviewer comments 2
Editor who approved publication: Dr Jongwha Chang
Hui Zhang,1,* Dandan Chen,1,* Jing Shao,1 Ping Zou,2 Nianqi Cui,3 Leiwen Tang,1 Xiyi Wang,4 Dan Wang,1 Jingjie Wu,1 Zhihong Ye1
1Department of Nursing, Zhejiang University School of Medicine Sir Run Run Shaw Hospital, Hangzhou, Zhejiang, People’s Republic of China; 2Department of Scholar Practitioner Program, School of Nursing, Nipissing University, Toronto, Ontario, Canada; 3Department of Nursing, The Second Affiliated Hospital Zhejiang University School of Medicine, Hangzhou, Zhejiang, People’s Republic of China; 4Department of Nursing, School of Nursing, Shanghai JiaoTong University, Shanghai, People’s Republic of China
*These authors contributed equally to this work
Correspondence: Zhihong Ye
Department of Nursing, Zhejiang University School of Medicine Sir Run Run Shaw Hospital, 3# Qingchun Dong Road, Jianggan District, Hangzhou, Zhejiang, People’s Republic of China
Tel +86 13606612119
Email [email protected]
Purpose: Machine learning (ML) techniques have emerged as a promising tool to predict risk and make decisions in different medical domains. We aimed to compare the predictive performance of machine learning-based methods for 4-year risk of metabolic syndrome in adults with the previous model using logistic regression.
Patients and Methods: This was a retrospective cohort study that employed a temporal validation strategy. Three popular ML techniques were selected to build the prognostic models. These techniques were artificial neural networks, classification and regression tree, and support vector machine. The logistic regression algorithm and ML techniques used the same five predictors. Discrimination, calibration, Brier score, and decision curve analysis were compared for model performance.
Results: Discrimination was above 0.7 for all models except classification and regression tree model in internal validation, while the logistic regression model showed the highest discrimination in external validation (0.782) and the smallest discrimination differences. The logistic regression model had the best calibration performance, and ANN also showed satisfactory calibration in internal validation and external validation. For overall performance, logistic regression had the smallest Brier score differences in internal validation and external validation, and it also had the largest net benefit in external validation.
Conclusion: Overall, this study indicated that the logistic regression model performed as well as the flexible ML-based prediction models at internal validation, while the logistic regression model had the best performance at external validation. For clinical use, when the performance of the logistic regression model is similar to ML-based prediction models, the simplest and more interpretable model should be chosen.
Keywords: prognosis model, metabolic syndrome, calibration, discrimination, machine learning
Introduction
Metabolic Syndrome (MetS) refers to a group of risk factors including hypertension, hyperglycemia, dyslipidemia, hypertension, and abdominal obesity.1 It is well known that metabolic risk factors can increase the likelihood of developing heart disease and diabetes mellitus. Research has suggested that MetS predicts a 5-fold increase in the risk of type 2 diabetes mellitus, a 1.5-fold increase in all-cause mortality, and a two-fold increase in the risk of cardiovascular disease.2–4 Moreover, evidence has shown that MetS is related to the occurrence of cancers and chronic kidney disease.5,6 All these influences are associated with increased healthcare costs. Consequently, it is crucial to develop a prediction model to identify individuals who are at a high risk of MetS early and provide the appropriate treatment strategy.
A prediction model can estimate the individualized absolute risk probability of a particular outcome. Prediction models can be classified into two categories: (1) diagnostic models, which are developed to identify whether a disease is present; (2) prognostic models, which are developed to detect whether an outcome will occur in the future.7 A prediction model can motivate both physicians and patients in their clinical risk-management decisions, guide patient management, and inform health initiatives.7 Clinical practice would therefore benefit from accurate individual estimates of MetS through the use of prediction models.
A systematic review was performed previously by our team to assess the risk of bias of the prognostic prediction models for MetS.8 We found that existing prognostic prediction models for metabolic syndrome had a high risk of bias in their methodological quality. This means that the predictive performance of models can be distorted and cannot be applied in clinical practice. Therefore, we developed a prediction model for 4-year risk of metabolic syndrome in adults using logistic regression which was internally and externally validated based on health examination cohorts.9,10 The reproducibility and generalizability of this prognostic model was also determined.
Although the discrimination and calibration of this previous prognostic model were satisfactory, we have only applied the logistic regression technique to develop this model based on these datasets. Over the last few years, an increasing number of advanced and more flexible machine learning (ML) techniques have been developed and we are now in an era of employing artificial intelligence in medicine.11 ML techniques have also emerged as a promising tool to predict risk and make decisions in different medical domains. Data can be learned directly and automatically by ML without any prior assumptions since ML relies on patterns and inferences from the data itself.12 Compared to conventional statistical techniques (eg, logistic regression), ML is capable of “big”, non-linear, and high-dimensional data. In our previous systematic review, some studies used ML to develop prognostic models for metabolic syndrome, but they were at high risk bias due to inadequate reporting of model performance, selection of predictors, and sample size.8 Inaccurate estimation of these models creates barriers to their use in clinical practice.
Herein, we present ML-based methods for the prediction of 4-year risk of metabolic syndrome in adults and compare ML model performance with the previous model using logistic regression.9,10
Methods
Source of Data
The healthcare information and management systems of a tertiary hospital provided the data used in this study. For model development and internal validation, a retrospective cohort of health examinations from 1 January 2011 to 31 December 2014 was obtained, and the datasets were used to develop and internally validate the logistic regression model. For external validation, a retrospective cohort of health examinations from January 2015 to 31 December 2018 was obtained. The following inclusion criteria were chosen: (1) participants ≥18 years old; (2) participants who were not diagnosed with metabolic syndrome in 2011 and 2018; (3) participants who attended a health examination for 4 consecutive years.
Outcomes
The outcome was defined as metabolic syndrome (MetS), and the diagnostic criteria used was the 2009 Joint Scientific Statement (harmonizing criteria 2009).13 According to the criteria, the diagnosis of MetS can be established if an individual has three of the following five criteria:
- Central obesity: waist circumference ≥ 85 cm in men; waist circumference ≥ 80 cm in women;
- Triglycerides of 1.7 mmol/L or greater or treatment;
- Plasma high-density lipoprotein cholesterol (HDL-C) <1.0 mmol/L in men or treatment; Plasma high-density lipoprotein cholesterol <1.3 mmol/L in women or treatment;
- Blood Pressure of 130/85 or greater or treatment;
- fasting plasma glucose of 5.6 mg/dl or greater or treatment.
Predictor Variables
Based on our previous work, age (years), total cholesterol (TC, mmol/l), serum uric acid (UA, μmol/l), alanine transaminase (ALT, U/L), and body mass index (BMI, Kg/m2) were identified as predictors in the prognostic prediction model.9,10 Therefore, these specified predictors were included in ML-based models.
Sample Size
Usually, the number of events per variable (EPV) are used to evaluate the appropriate sample size in prediction modeling studies. It is recommended that EPV should be above 200 for ML-based prediction models.14 EPV in this study met the criteria.
Machine Learning
In this study, we have chosen three popular ML techniques to develop the prognostic models:15,16 Artificial Neural Networks (ANN), Classification and Regression Tree (CART), and Support Vector Machine (SVM).
An ANN includes many artificial neurons called processing units.17 They can simulate the signal transmission which consists of an input layer, several hidden layers, and an output layer. There are many perceptron in each layer, and different weights connect the perceptron between layers. An ANN has self-learning capabilities to produce the best prediction by matching each input with corrected output.17
A CART is a type of decision tree methodology and is a graphical depiction of a decision that helps show a set of decisions followed by potential outcomes.18 A parent node is the starting point for a CART. A possible decision or an action results in binary groups. Two child nodes are then generated from a parent node and this tree-growing methodology leads to the best split based on the splitting criterion. During this course, every child node will become a parent node when it splits. The decision-making process stops when no contribution exists in the further branching.
An SVM involves a quadratic optimization problem, which includes minimizing penalties and maximizing margin width. This means that an SVM will iteratively generate the hyperplane to minimize the error, and the datasets are separated into classes to find a maximum marginal hyperplane (MMH) using a mathematical transformation known as the kernel trick. By using a logistic transformation, a rescaled version of the original classifiers scores is generated, which is posterior estimates.
Statistical Analysis
Adhering to the TRIPOD guidelines, continuous variables will not be dichotomized to avoid a loss of prognostic information. For variables with missing data, we employed multiple imputation to generate five imputed data sets.19 The multiple imputation used fully conditional specification methods for final estimates. Variables were removed if they contained missing values above 50%. The ML-based prediction model employed the same inclusion criteria, candidate predictors, and outcome definition, which were used in the logistic regression-based prediction model.9,10 Optimal hyperparameters were selected to enable the ML algorithms to work optimally (Supplement file 1).
The performance of ML-based prognostic models was evaluated. Discrimination (whether the model separates individuals who suffer from events from those who do not) was evaluated using the C-statistic, with the ideal value as 1. Calibration (whether the estimations of risk are accurate) was assessed using a calibration plot, calibration intercept, and calibration slope. The ideal value for calibration intercept and slope are 0 and 1, respectively. Additionally, the Brier score was evaluated because it can be viewed as overall performance of a model. Decision curve analysis (DCA) was employed to evaluate clinical utility since this technique is increasingly used in supporting decision-making.20 Clinicians can make a judgment about using prediction models as a strategy associated with benefits (treating a true-positive case) and harms (treating a false-positive case). In DCA, the net benefit is the key, which can be interpreted as the proportion of true positives in the observed proportion of false positives weighted by the different threshold probability. We compared ML model performance with the previous logistic regression model.9,10 In order to adhere to TRIPOD guidelines, training and validated performance were reported in this study. The 10-fold cross-validation technique was used for calibration plot, and the bootstrapping method was used for other indexes for internal validation. All analyses were performed using R software (version 3.6.2).
Ethical Approval
This study was approved by the ethics committee of Zhejiang University School of Medicine Sir Run Run Shaw Hospital (20181220-3). The ethics committee has approved a request to waive the documentation of informed consent because of the secondary use of the data. This study was conducted in accordance with the principles of the Declaration of Helsinki.
Results
Baseline Characteristics
In the development and internal validation cohort, there were 6793 participants followed up for 4 years. A total of 1750 participants suffered from MetS (25.76%) by the end of the 4 year period. In the external validation cohort, there were 7681 participants followed up for 4 years and 2222 participants developed MetS (28.93%) during the study period. Baseline characteristics can be found in Table 1.
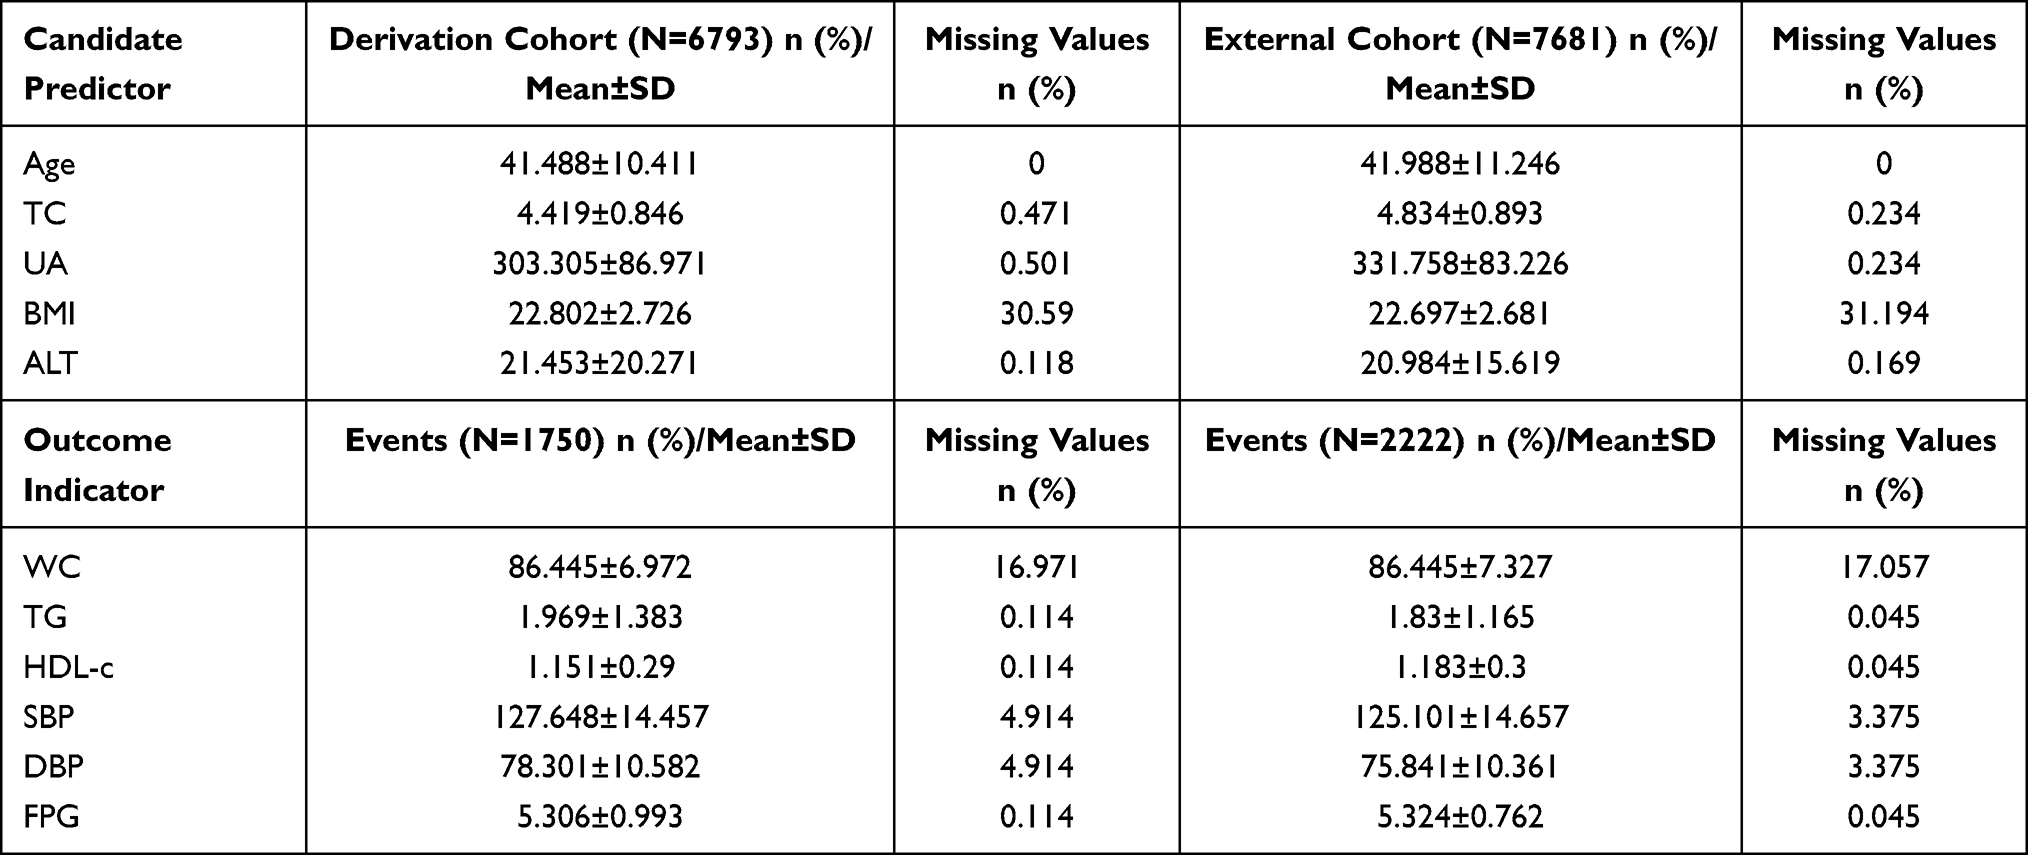 |
Table 1 Characteristics of Participants |
Discrimination
For all models, the C-statistic at internal validation was above 0.7 except CART algorithms (0.663, 95% CI: 0.645–0.681). There was a decrease in the C-statistic for 2 models (logistic regression and ANN) when external validation was performed (Table 2), and the C-statistic of the CART algorithms was the lowest at internal validation (0.663, 95% CI:0.645–0.681) and external validation (0.740, 95% CI: 0.728–0.752). The logistic regression model showed the highest level of discrimination at external validation (0.782, 95% CI: 0.771–0.793), and it had the smallest discrimination differences (0.001).
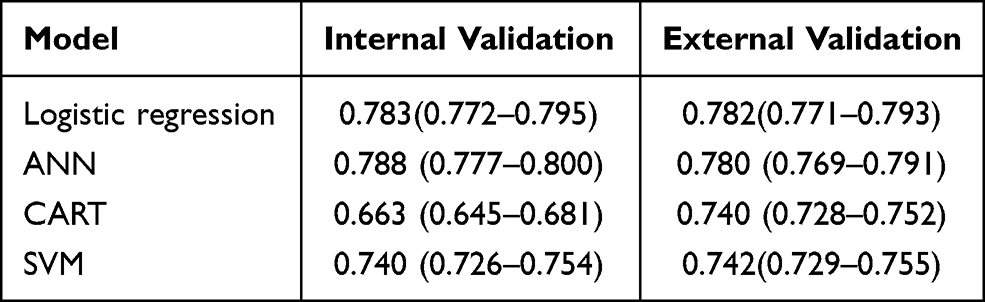 |
Table 2 Results of the Discrimination at Internal and External Validation |
Calibration
In the internal validation, calibration slopes and intercepts were similar for all models except the model based on SVM algorithms. For calibration in the external validation, the calibration intercept (−0.045, 95% CI: −0.113–0.022) and the calibration slope (1.006, 95% CI: −0.011–1.063) of logistic regression were close to 0 and 1, respectively. The SVM model had unsatisfactory calibration performance in internal validation and external validation (Figures 1, 2, and Table 3).
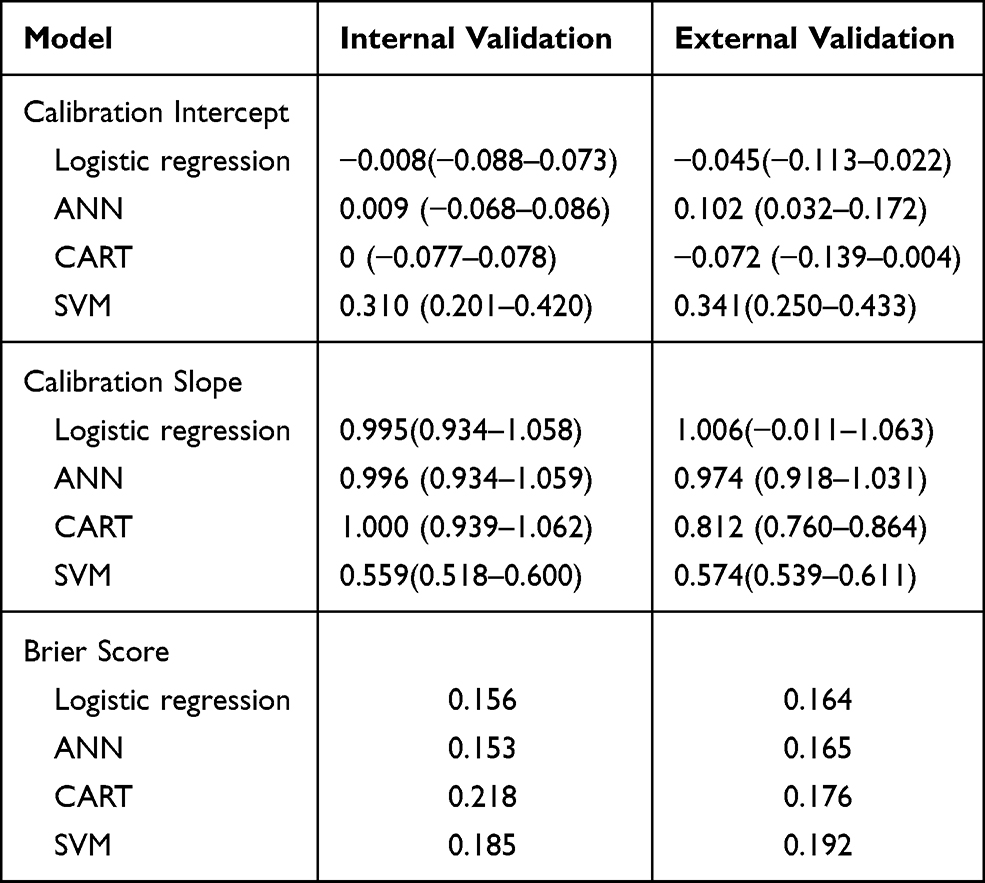 |
Table 3 Results of the Calibration Intercept, Calibration Slope, and the Brier Score at Internal and External Validation |
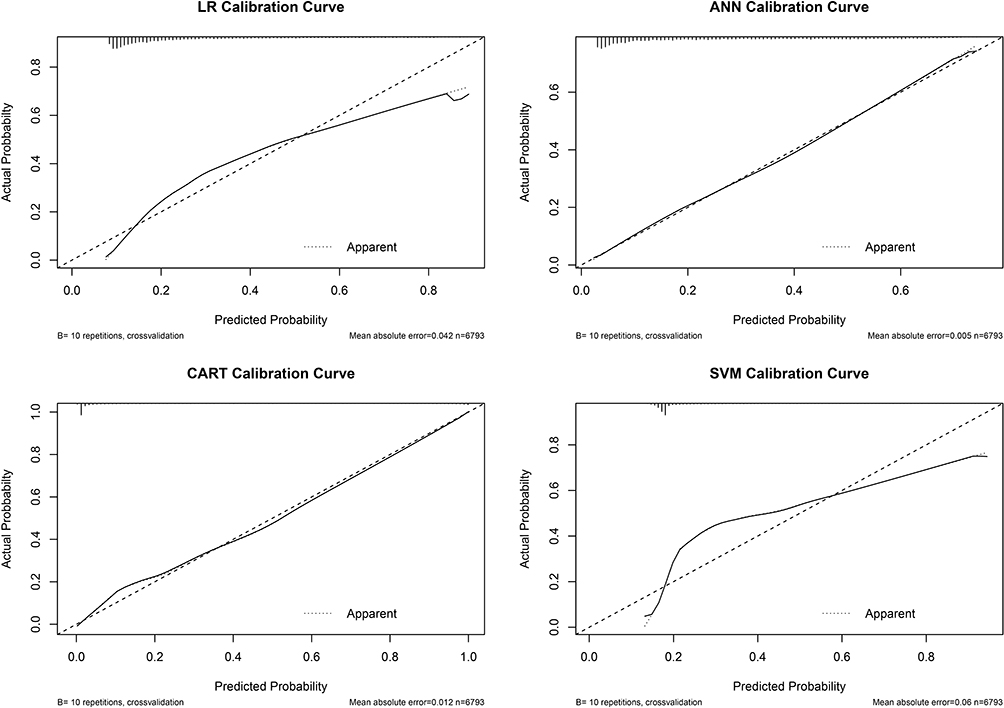 |
Figure 1 Calibration plot in internal validation. Abbreviations: ANN, artificial neural networks; CART, classification and regression tree; SVM, support vector machine. |
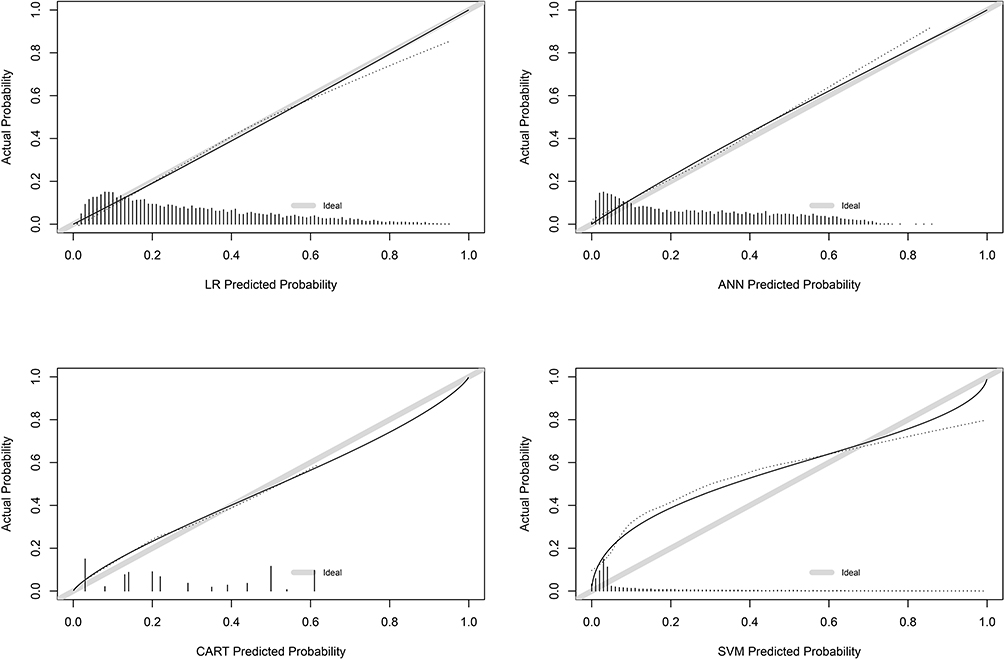 |
Figure 2 Calibration plot in external validation. Abbreviations: ANN, artificial neural networks; CART, classification and regression tree; SVM, support vector machine. |
Brier Score
At internal validation, the Brier score of ANN (0.153) was better than that of logistic regression (0.156), and CART (0.218) had the poorest Brier score. The Brier score was very similar for logistic regression (0.164) and ANN (0.165) at external validation, but logistic regression was slightly higher.
Clinical Utility
Figure 3 presents the results of the decision curve analysis. Based on the plotted net benefit, the logistic regression model was superior to the other models (CART, SVM), and was slightly higher than the ANN model.
 |
Figure 3 Decision-curve analysis in external validation dataset. Abbreviations: ANN, artificial neural networks; CART, classification and regression tree; SVM, support vector machine. |
Discussion
Development and validation of clinical risk prediction models help healthcare providers to identify disease and make clinical decisions. Additionally, it can classify true positive patients with significant risk factors earlier in order to optimize hospital resources. ML methods are starting to be used to improve medical research and clinical care with tremendous potential since electronic health records gained popularity in healthcare systems. Therefore, the results of this study can offer important insights on the differences between flexible ML algorithms and traditional logistic regression in both internal validation and external validation.
We found that discrimination was above 0.7 for all models except the CART model in internal validation, while the logistic regression model showed the highest discrimination in external validation and the discrimination difference was the smallest. Based on the results of calibration plot, slope, and intercept, we found the logistic regression model had the best calibration performance, and ANN showed satisfactory calibration. For overall performance, logistic regression had the smallest brier score in external validation, and it also had the smallest brier score differences in internal validation and external validation. Although ANN had the best brier score at internal validation, logistic regression was slightly better than ANN in external validation. The results of the decision curve analysis indicated that the logistic regression model had the largest net benefit in external validation. This could be explained by the fact that the most important prognostic effects are more likely to serve as independent, linear effects.16
According to TRIPOD, external validation provides important information about the transportability of models. The predictive performance of the logistic regression model at internal validation indicated that traditional algorithms can perform as well as ML algorithms, and the logistic regression model had the best performance at external validation. As the logistic regression models can be presented as a formula, a linear predictor called a prognostic index can be calculated. It is easy to use and understand the prediction model based on traditional algorithms, while ML algorithms are limited by the difficulty of explaining these prediction models. Additionally, based on the logistic regression model, the risk calculator can be produced to facilitate clinical application. Therefore, for clinical use, when the performance of the logistic regression model is similar or superior to ML-based prediction models, the simplest and more interpretable model should be chosen.21
Due to enhanced access to electronic health records and increased international collaborations, available data are becoming increasingly large and ML techniques are being widely used for clinical prediction. However, a recent systematic review suggested that compared to the traditional statistical approach, flexible ML techniques did not find incremental value.15 The findings of this study supported this conclusion. It may be true that compared to traditional statistical methods, flexible ML techniques are likely to be data hungry.22
The comparison between the logistic regression model and ML based-models highlighted key findings from a recent systematic review.15 First, reporting of methodology lacked transparency. Second, the findings were incomplete and unclear. Additionally, calibration plot, calibration intercept, and calibration slope were seldom examined. Consequently, there were several strengths in the present study. Adhering to TRIPOD, ML-based prediction models in our study were both internally and externally validated with optimal hyperparameters. Calibration was accessed using a multidimensional approach (Calibration plot, calibration intercept, and calibration slope). Additionally, the Brier score and decision curve analysis were applied to evaluate overall performance and clinical utility, respectively.
Limitations
Some limitations must be considered in this study. First, datasets were collected from one hospital. The multicenter dataset could be a more reliable and generalizable source. Second, we only used five predictors to develop ML-based prediction models according to the previous results.9,10 This may limit the performance of ML-based prediction models as it is well known that flexible ML methods perform better than the classic regression approach when numerous predictors and high-dimensional data are used. However, limited numbers of predictors are less likely to be over-fitting, and using high-dimensional data usually represents fewer details or lower quality.16
Conclusion
Overall, this study indicated that the logistic regression model performed as well as the flexible ML-based prediction models at internal validation, and the logistic regression model had the best performance at external validation. For clinical use, when the performance of the logistic regression model is similar to ML-based prediction models, the simplest and more interpretable model should be chosen. The results indicated that continuous updating of prediction models in different datasets was crucial to ensure the logistic regression model performed as well as the flexible ML-based prediction models. Additionally, the utility was emphasized by comparing classic algorithms to ML through a small number of evidence-based predictor variables.
Acknowledgments
All authors want to thank Mr. Liangyuan Li for his crucial contribution.
Author Contributions
All authors made a significant contribution to the work reported, whether that is in the conception, study design, execution, acquisition of data, analysis and interpretation, or in all these areas; took part in drafting, revising or critically reviewing the article; gave final approval of the version to be published; have agreed on the journal to which the article has been submitted; and agree to be accountable for all aspects of the work.
Funding
This work was supported by Zhejiang province medical technology project [WKJ-ZJ-1925], National Social Science Fund of China [20BGL275], Postdoctoral Foundation of Zhejiang Province [zj2019022], and National Natural Science Foundation of China [72004193].
Disclosure
Hui Zhang and Dandan Chen are co-first authors for this study. The authors have no conflict of interest.
References
1. Alberti G, Zimmet P, Shaw J, Grundy SM. The IDF Consensus Worldwide Definition of the Metabolic Syndrome. International Diabetes Federation; 2018.
2. Boudreau DM, Malone DC, Raebel MA, et al. Health care utilization and costs by metabolic syndrome risk factors. Metab Syndr Relat Disord. 2009;7(4):305–314. doi:10.1089/met.2008.0070
3. Grundy SM, Brewer HB, Cleeman JI, Smith SC, Lenfant C. Definition of metabolic syndrome. Circulation. 2004;109(3):433–438. doi:10.1161/01.CIR.0000111245.75752.C6
4. Mottillo S, Filion KB, Genest J, et al. The metabolic syndrome and cardiovascular risk: a systematic review and meta-analysis. J Am Coll Cardiol. 2010;56(14):1113–1132. doi:10.1016/j.jacc.2010.05.034
5. Chen J, Muntner P, Hamm LL, Jones DW, Vecihi B. The metabolic syndrome and chronic kidney disease in U.S. adults. Ann Intern Med. 2004;140(3):167–174. doi:10.7326/0003-4819-140-3-200402030-00007
6. Esposito K, Chiodini P, Colao A, Lenzi A, Giugliano D. Metabolic syndrome and risk of cancer. A Systematic Review and Meta-Analysis. Diabetes Care. 2012;35(11):2402–2411.
7. Moons KG, Altman DG, Reitsma JB, et al. Transparent Reporting of a multivariable prediction model for Individual Prognosis or Diagnosis (TRIPOD): explanation and elaboration. Ann Intern Med. 2019;162(1):W1–73. doi:10.7326/M14-0698
8. Zhang H, Shao J, Chen D, et al. Reporting and methods in developing prognostic prediction models for metabolic syndrome: a systematic review and critical appraisal. Diabetes Metab Syndr Obes. 2020;13:4981–4992. doi:10.2147/DMSO.S283949
9. Zhang H, Chen D, Shao J, Zou P. Development and internal validation of a prognostic model for 4 year -risk of metabolic syndrome in adults: a retrospective cohort study. Diabetes Metab Syndr Obes. 2021;14:2229–2237. doi:10.2147/DMSO.S288881
10. Zhang H, Chen D, Shao J, et al. External validation of the prognostic prediction model for 4-year risk of metabolic syndrome in adults: a retrospective cohort study. Diabetes Metab Syndr Obes. 2021;14:3027–3034. doi:10.2147/DMSO.S316950
11. Patel VL, Shortliffe EH, Stefanelli M, et al. The coming of age of artificial intelligence in medicine. Artif Intell Med. 2009;46(1):5–17. doi:10.1016/j.artmed.2008.07.017
12. Sidey-Gibbons JAM, Sidey-Gibbons CJ. Machine learning in medicine: a practical introduction. BMC Med Res Methodol. 2019;19(1):64. doi:10.1186/s12874-019-0681-4
13. Alberti KG, Eckel RH, Grundy SM, et al. Harmonizing the metabolic syndrome: a joint interim statement of the International Diabetes Federation Task Force on Epidemiology and Prevention; National Heart, Lung, and Blood Institute; American Heart Association; World Heart Federation; International Atherosclerosis Society; and International Association for the Study of Obesity. Circulation. 2009;120(16):1640–1645.
14. Moons KGM, Wolff RF, Riley RD, et al. PROBAST: a tool to assess risk of bias and applicability of prediction model studies: explanation and elaboration. Ann Intern Med. 2019;170(1):W1–W33. doi:10.7326/M18-1377
15. Christodoulou E, Ma J, Collins GS, Steyerberg EW, Verbakel JY, Van Calster B. A systematic review shows no performance benefit of machine learning over logistic regression for clinical prediction models. J Clin Epidemiol. 2019;110:12–22. doi:10.1016/j.jclinepi.2019.02.004
16. Gravesteijn BY, Nieboer D, Ercole A, et al. Machine learning algorithms performed no better than regression models for prognostication in traumatic brain injury. J Clin Epidemiol. 2020;122:95–107. doi:10.1016/j.jclinepi.2020.03.005
17. Basheer IA, Hajmeer M. Artificial neural networks: fundamentals, computing, design, and application. J Microbiol Methods. 2000;43(1):3–31. doi:10.1016/S0167-7012(00)00201-3
18. Lemon SC, Roy J, Clark MA, Friedmann PD, Rakowski W. Classification and regression tree analysis in public health: methodological review and comparison with logistic regression. Ann Behav Med. 2003;26(3):172–181. doi:10.1207/S15324796ABM2603_02
19. Steyerberg EW, Moons KG, van der Windt DA, et al. Prognosis Research Strategy (PROGRESS) 3: prognostic model research. PLoS Med. 2013;10(2):e1001381. doi:10.1371/journal.pmed.1001381
20. Van Calster B, Wynants L, Verbeek JFM, et al. Reporting and interpreting decision curve analysis: a guide for investigators. Eur Urol. 2018;74(6):796–804. doi:10.1016/j.eururo.2018.08.038
21. Lynam AL, Dennis JM, Owen KR, et al. Logistic regression has similar performance to optimised machine learning algorithms in a clinical setting: application to the discrimination between type 1 and type 2 diabetes in young adults. Diagn Progn Res. 2020;4:6. doi:10.1186/s41512-020-00075-2
22. van der Ploeg T, Austin PC, Steyerberg EW. Modern modelling techniques are data hungry: a simulation study for predicting dichotomous endpoints. BMC Med Res Methodol. 2014;14:137. doi:10.1186/1471-2288-14-137
 © 2021 The Author(s). This work is published and licensed by Dove Medical Press Limited. The
full terms of this license are available at https://www.dovepress.com/terms
and incorporate the Creative Commons Attribution
- Non Commercial (unported, 3.0) License.
By accessing the work you hereby accept the Terms. Non-commercial uses of the work are permitted
without any further permission from Dove Medical Press Limited, provided the work is properly
attributed. For permission for commercial use of this work, please see paragraphs 4.2 and 5 of our Terms.
© 2021 The Author(s). This work is published and licensed by Dove Medical Press Limited. The
full terms of this license are available at https://www.dovepress.com/terms
and incorporate the Creative Commons Attribution
- Non Commercial (unported, 3.0) License.
By accessing the work you hereby accept the Terms. Non-commercial uses of the work are permitted
without any further permission from Dove Medical Press Limited, provided the work is properly
attributed. For permission for commercial use of this work, please see paragraphs 4.2 and 5 of our Terms.