Back to Journals » Cancer Management and Research » Volume 14
Machine Learning-Based Model for the Prognosis of Postoperative Gastric Cancer
Authors Liu D ![]() , Wang X, Li L, Jiang Q, Li X, Liu M, Wang W, Shi E, Zhang C, Wang Y, Zhang Y, Wang L
, Wang X, Li L, Jiang Q, Li X, Liu M, Wang W, Shi E, Zhang C, Wang Y, Zhang Y, Wang L
Received 15 October 2021
Accepted for publication 23 December 2021
Published 7 January 2022 Volume 2022:14 Pages 135—155
DOI https://doi.org/10.2147/CMAR.S342352
Checked for plagiarism Yes
Review by Single anonymous peer review
Peer reviewer comments 3
Editor who approved publication: Dr Ahmet Emre Eşkazan
Donghui Liu,1,2 Xuyao Wang,3 Long Li,4 Qingxin Jiang,5 Xiaoxue Li,2 Menglin Liu,2 Wenxin Wang,2 Enhong Shi,2 Chenyao Zhang,2 Yinghui Wang,2 Yan Zhang,1,* Liru Wang1,2,*
1School of Life Science and Technology, Harbin Institute of Technology, Harbin, Heilongjiang Province, People’s Republic of China; 2Department of Oncology, Heilongjiang Provincial Hospital, Harbin, Heilongjiang Province, People’s Republic of China; 3Department of Pharmacy, Harbin Second Hospital, Harbin, Heilongjiang Province, People’s Republic of China; 4Department of General Surgery, First Affiliated Hospital of Harbin Medical University, Harbin, Heilongjiang Province, People’s Republic of China; 5Department of General Surgery, Harbin 242 Hospital of Genertec Medical, Harbin, Heilongjiang Province, People’s Republic of China
*These authors contributed equally to this work
Correspondence: Yan Zhang
School of Life Science and Technology, Harbin Institute of Technology, No. 92 Xidazhi Street, Nangang District, Harbin, Heilongjiang, People’s Republic of China
Tel +86 13936253249
Email [email protected]
Liru Wang
Department of Oncology, Heilongjiang Provincial Hospital, No. 82 Zhongshan Road, Xiangfang District, Harbin, Heilongjiang, People’s Republic of China
, Tel +86 13633609001
Email [email protected]
Background: The use of machine learning (ML) in predicting disease prognosis has increased, and scientists have adopted different methods for cancer classification to optimize the early screening of cancer to determine its prognosis in advance. In this study, we aimed at improving the prediction accuracy of gastric cancer in postoperation patients by constructing a highly effective prognostic model.
Methods: The study used postoperative gastric cancer patient data from the SEER database. The LASSO regression method was used to construct a clinical prognostic model, and four machine learning methods (Boruta algorithm, neural network, support vector machine, and random forest) were used to screen and recombine the features to construct an ML prognostic model. Clinical information on 955 postoperative gastric cancer patients collected from the Affiliated Tumor Hospital of Harbin Medical University was used for external verification.
Results: Experimental results showed that the AUC values of 1, 3 and 5 years in the training set, validation set and external validation set of clinical prognosis model and ML prognosis model directly established by LASSO regression are all around 0.8.
Conclusion: Both models can accurately evaluate the prognosis of postoperative patients with gastric cancer, which may be helpful for accurate and personalized treatment of postoperative patients with gastric cancer.
Keywords: machine learning, gastric cancer, prognosis, Boruta, ElasticNet, SVM, random forest
Introduction
According to the global cancer statistics released by the World Health Organization in 2018, the incidence and mortality rate of gastric cancer (GC) ranked fifth and third respectively. It is common in East Asia, with an incidence rate of 32.1/100,000 people and a mortality rate of 13.2/100,000 people;1 therefore, the prevention and treatment of gastric cancer should arouse our great attention. In fact, the treatment of tumors mainly depends on the judgment of prognosis prediction. Accurately predicting the prognosis of different individuals is of immense significance for patients with gastric cancer to choose appropriate treatment strategies. Surgery, as the main treatment for gastric cancer, is considered to be the only possible cure method. Although the level of surgery has continuously improved in recent years, the overall prognosis is poor.2,3 There are many influencing factors, such as gender, age, Eastern Cooperative Oncology Group (ECOG) score, tumor location, tumor size, degree of differentiation, tumor grade, tissue typing, TNM staging, and chemotherapy,4–6 among which TNM staging is widely used in clinical work. Unfortunately, TNM staging alone cannot accurately predict the overall postoperative prognosis of patients;7 therefore, it is very important to establish a reliable model to predict the prognosis of high-risk patients and formulate individualized treatment strategies.
In recent years, scientists have adopted different methods to optimize the early screening of cancer to determine the prognosis in advance through the classification of cancer and, at the same time, develop new targeted cancer treatment strategies. Therefore, machine learning (ML) methods have become an important tool in the field of medical research. ML methods are good at capturing complex, interactive, or nonlinear relationships and can also effectively predict their prognosis.8 ML is a subfield of artificial intelligence. The main research focus in this field is artificial intelligence, especially improving the performance of specific algorithms in empirical learning. ML improves the quality of data and analysis results through feature screening, feature extraction, dimensionality reduction, and other processes. Especially, the benefits of dimensionality reduction are more obvious on datasets with large numbers of features, such as in noise reduction and the elimination of low-relevance features.9 In addition, various ML methods have been widely used in disease prognosis prediction; especially, the use of supervised learning techniques such as random forest (RF), support vector machine (SVM), decision tree (DT), and convolutional neural network (CNN), to predict cancer prognosis is increasing.10–13 Different types of prognostic models have also been widely used in cancer treatment.14–17 By integrating a variety of ML methods to build a prognostic model, we can effectively improve the effectiveness of the model18 and help clinicians carry out precise and individualized treatments.
At present, there is still a lack of effective machine learning prognosis model in gastric cancer, so we are based on the clinical information of large samples of gastric cancer from the surveillance epidemiology and end results (SEER) database, this study aimed to directly construct a prognostic model using the LASSO regression method and integrate a variety of ML methods to sort and reassemble the importance of clinical features of gastric cancer prognosis. This was aimed at improving the accuracy of prognostic prediction in gastric cancer patients after operation and constructing a highly effective prognostic model. In addition, we used the information of gastric cancer patients collected in the real world to evaluate the accuracy of the constructed model.
We believe that our study makes a significant contribution to the literature because traditional TNM system can no longer meet the precise treatment of patients, whereas in the current study, the ML models established can accurately evaluate the prognosis of postoperative gastric cancer patients, which may be helpful for accurate prediction in the clinical environment.
Materials and Methods
Data Acquisition
Clinical information data related to postoperative patients with gastric adenocarcinoma (STAD) (from January 1, 2002 to April 31, 2014) were obtained from the SEER database (SEER_1975_2016) (https://seer.cancer.gov/). A total of 167,748 postoperative gastric adenocarcinoma patients were obtained, including 11 clinical features: Age at diagnosis, Gender, Primary Site, Grade, Histologic, AJCC Stage Group, T stage, N stage, M stage, Regional nodes examined (RNE), and Lymph node metastasis rate (LNMR). We deleted uncertain data to reduce noise, such as T0, Tis, Tx, N3, Nx, Nxa, Nxr, and Mx. After screening, we obtained 22,112 patients with complete information, which were randomly divided into training and validation sets at a ratio of 4:1. The external validation dataset comes from the clinical information of 955 postoperative patients with gastric cancer collected by the Affiliated Tumor Hospital of Harbin Medical University (from January 1, 2002 to April 31, 2014), including 692 males and 263 females, with a male to female ratio of 2.6:1 and a median age of 58 years old (23–88 years old). The work flow chart is shown in (Figure 1).
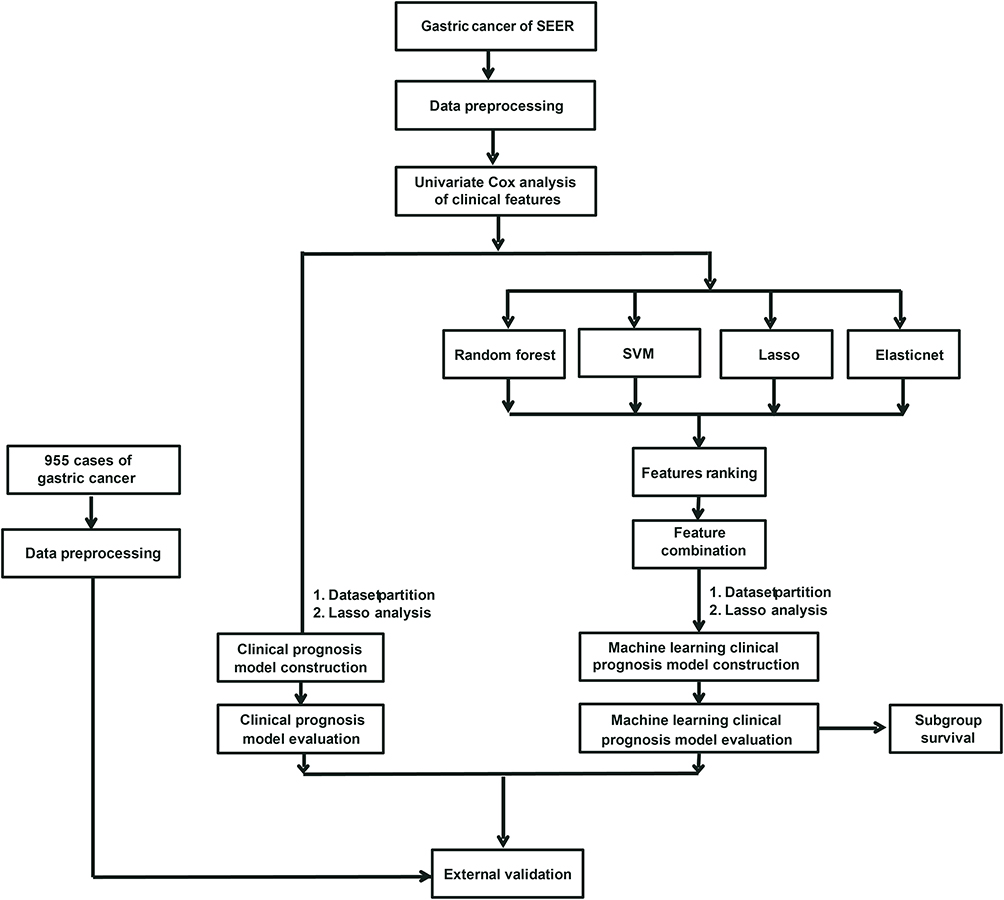 |
Figure 1 Work flow chart. |
Construction and Evaluation Index of Key Features of the Clinical Prognosis Model
First, the univariate Cox regression model was used to analyze the relationship between clinical features and survival time, and 11 clinical features were preliminarily screened. The clinical prognosis model was constructed using the LASSO regression model, and the clinical prognostic riskscore (cp-riskscore) was calculated.19 Taking the median risk score as the dividing point, the patients were divided into low-risk and high-risk groups. The pROC package for R was used to obtain the ROC curve area,20 and the “survivalROC” package for R was used for independent time ROC curve analysis.21
Screening of Key Features of Machine Learning Clinical Prognosis Model
As with the clinical prognosis model, the clinical characteristics were screened by univariate Cox regression model. Subsequently, four algorithms—Boruta,22 Elasticnet,23 SVM,24 and Random Forest25 were used to screen the key features. The importance ranking of clinical features is combined with four algorithms, which are sorted by the sum of ranks. Thereafter, the filtered key features were combined through different ways (at least two features were extracted from the key features each time as the constituent elements of the new feature) to obtain the combined features (first add 1 to the quantized value of each feature, and then replace the value of the newly generated combined features with the product of the quantization value of the features). Univariate Cox regression was used to screen candidate features for constructing prognostic-related models.
Construction and Evaluation Index of Machine Learning Clinical Prognosis Model
We randomly extracted candidate features to count the C-index value obtained by each combination, and to select the feature combination with the highest C-index average in the training and validation sets as the modeling feature for this time. We constructed the machine learning prognostic model using LASSO regression and calculated the machine learning clinical prognostic riskscore (mL-riskscore);19 we used the median risk score value as the demarcation point to divide patients into low-risk and high-risk groups. The “pROC” package for R was used to obtain the ROC curve area,20 and the “survivalROC” package was used for independent time ROC curve analysis.21
Statistical Analysis
The survival curve was generated by Kaplan-Meier method and compared by log-rank. The correlation between the risk score and clinical features was analyzed using the Student’s t-test and Kruskal Wallis test, and all statistical analyses were performed using R (Appendix Material 2) (version 3.6.1). All statistical tests were bilateral, and p < 0.05 was statistically significant.
Results
The Proportion of Survival and Death in Each Subgroup of Clinical Features
The different subtypes of each clinical feature were statistically analyzed to explore the relationship between clinical indexes and death rate. The results showed that the number of survival cases with clinical features Histologic-Carcinoid was much higher than that of deaths, while the number of survival cases with clinical features LNMR-≥70% was much lower than that of deaths (Figure 2).
 |
Figure 2 Survival and death ratio of clinical features of postoperative patients with gastric cancer in the SEER database in each subtype. |
Construction and Effectiveness Evaluation of the Clinical Prognosis Model
The patient information in the SEER database was randomly divided into training and validation sets at a 4:1 ratio. After 11 clinical features were analyzed using the univariate Cox regression model, nine features with significant differences were obtained as the modeling features. The corresponding best cp-riskscore was calculated using a LASSO regression analysis for subsequent analyses (Figure 3A–C), cp-riskscore = Age × (−0.4942) + RNE × (−0.1973) + Primary × (−0.0098) + N × (0.0601) + Grade × (0.0947) + Stage × (0.1348) + T × (0.2141) + LNMR × (0.3365) + M × (0.4104). According to the median value of the risk score, the patients were divided into high-risk and low-risk groups, and Kaplan-Meier was used to draw a survival curve. The results showed that the overall survival (OS) of the high-risk group in the training set and test set was significantly lower than that of the low-risk group (Figure 3D and E); the baseline data are shown in (Tables 1–2). In addition, the ROC curve results showed that the AUC values for 1, 3, and 5 years in the training set were 0.76, 0.8, and 0.8, and the AUC values for 1, 3, and 5 years in the test set were 0.77, 0.79, and 0.78, respectively (Figure 3F and G), indicating that the clinical prognosis model had better verification efficiency.
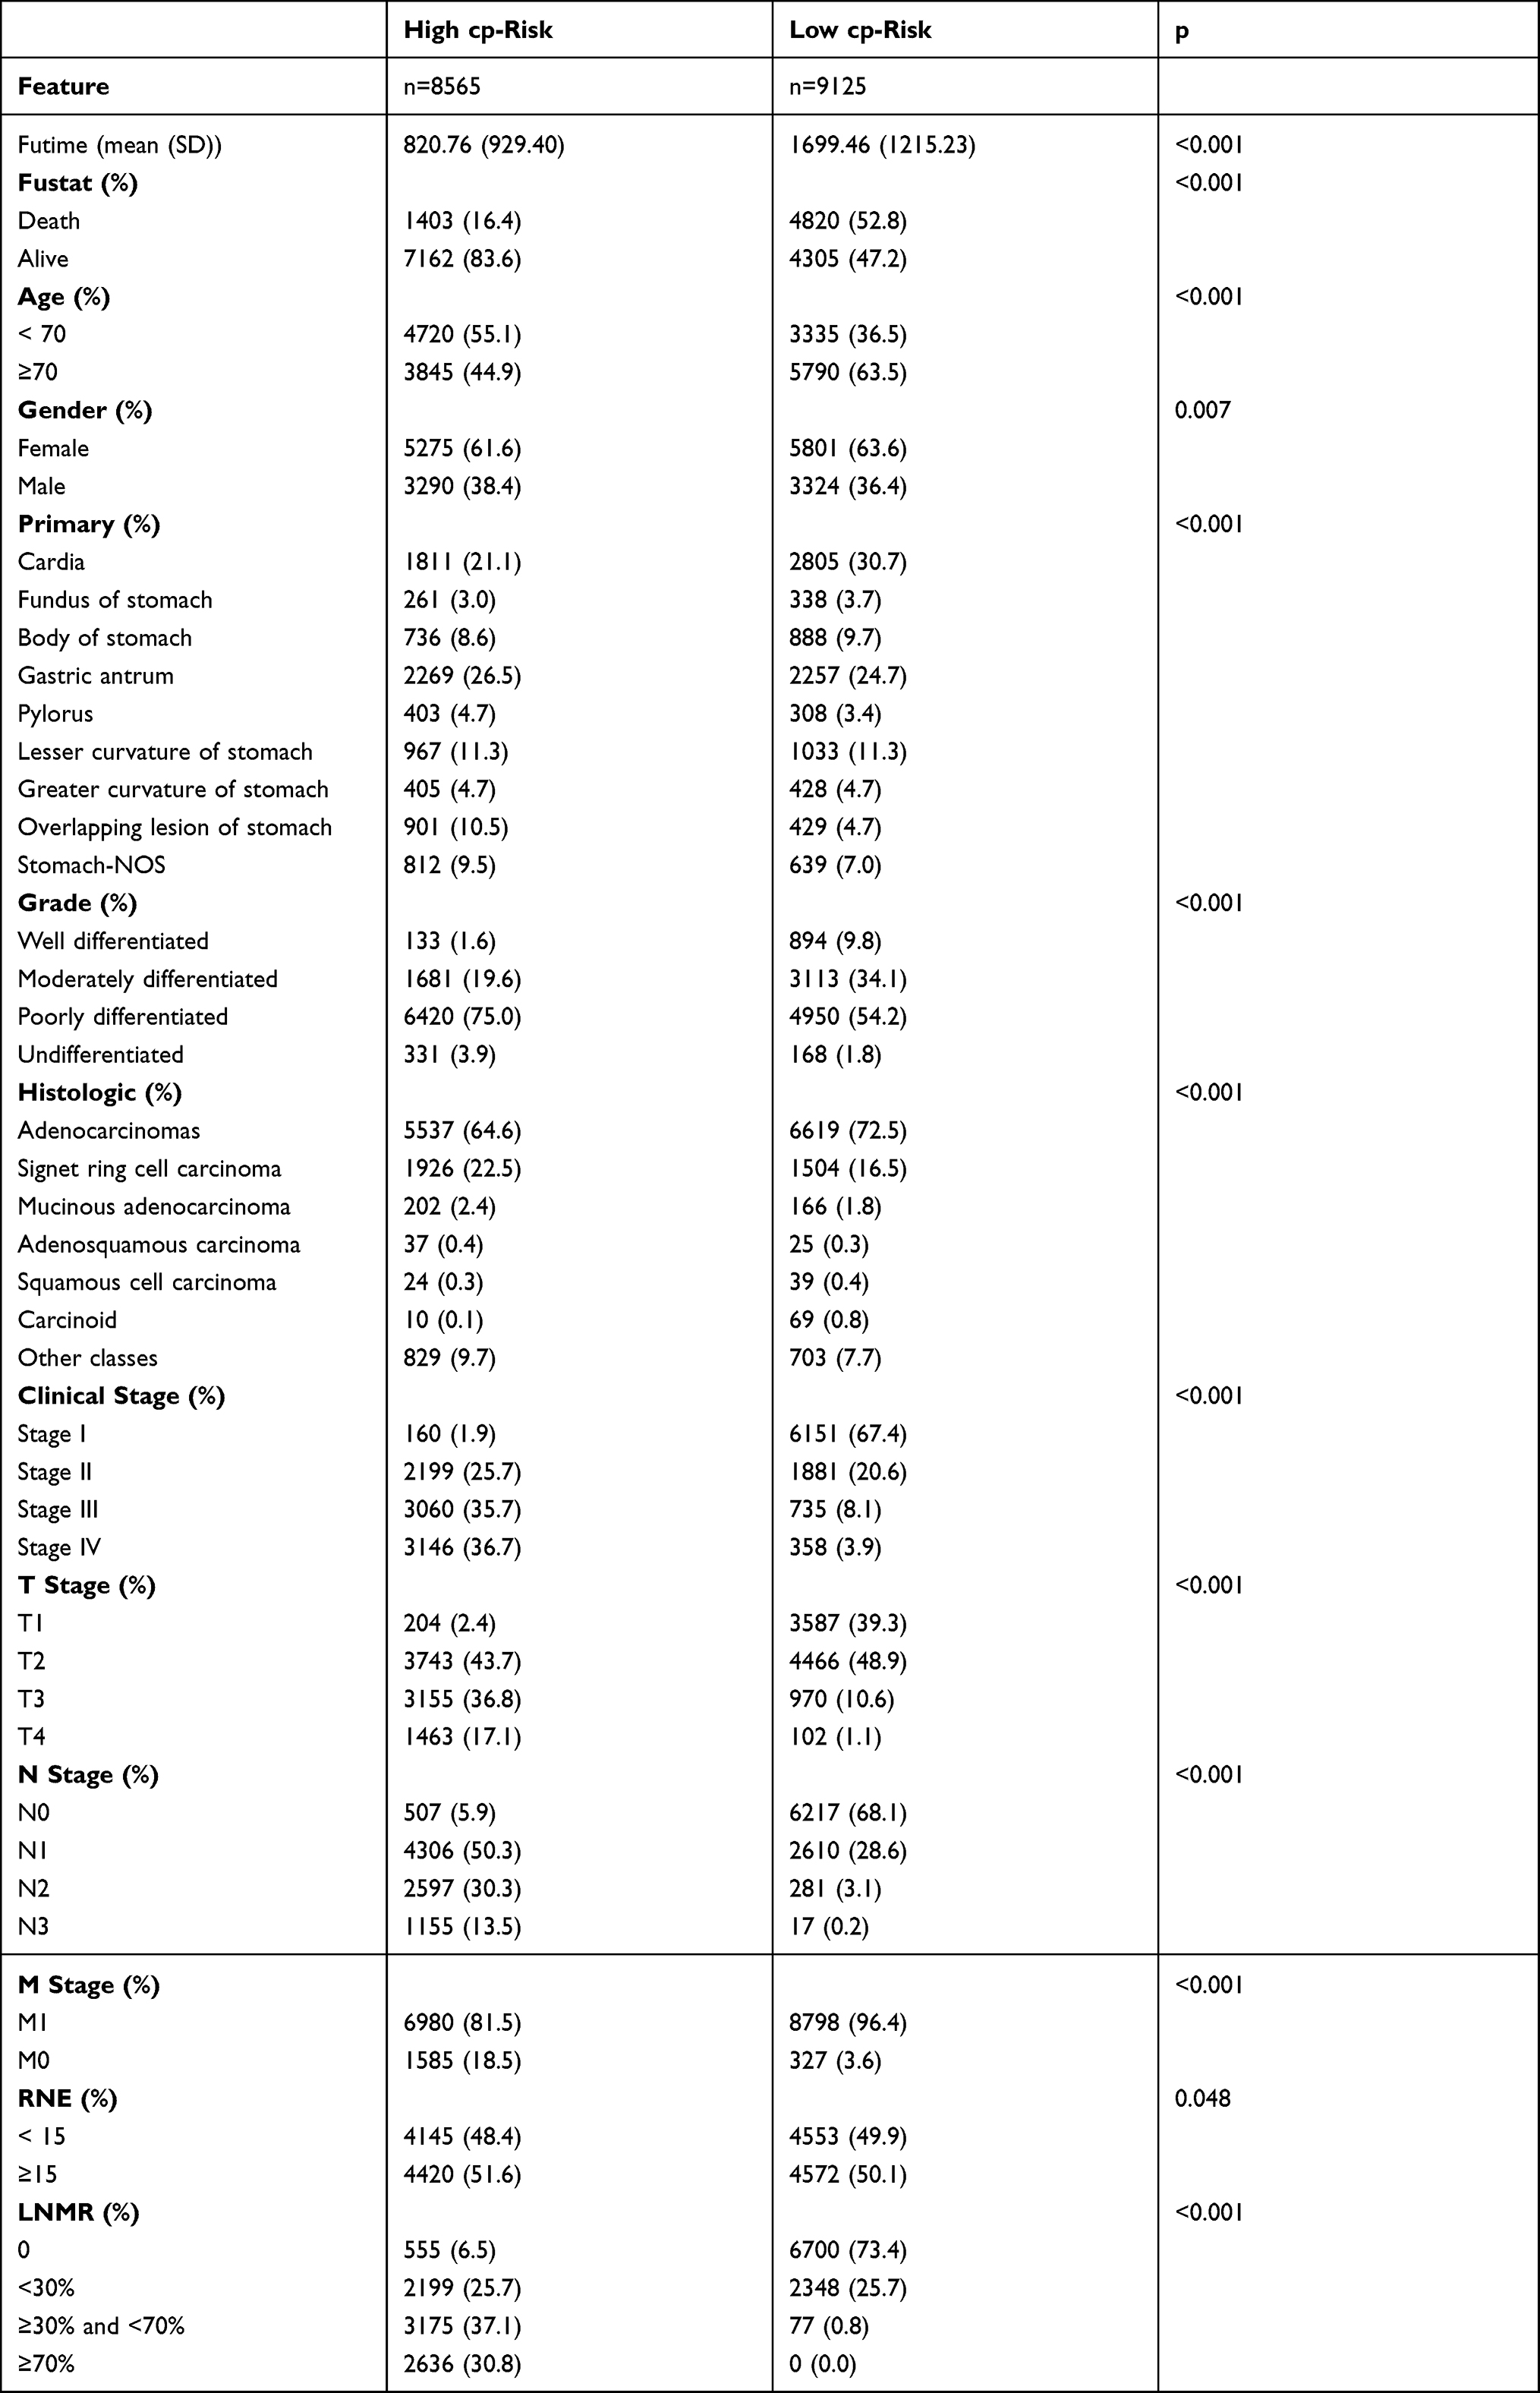 |
Table 1 Baseline Data of High-Risk Group and Low-Risk Group in the Training Set of Clinical Prognosis Model |
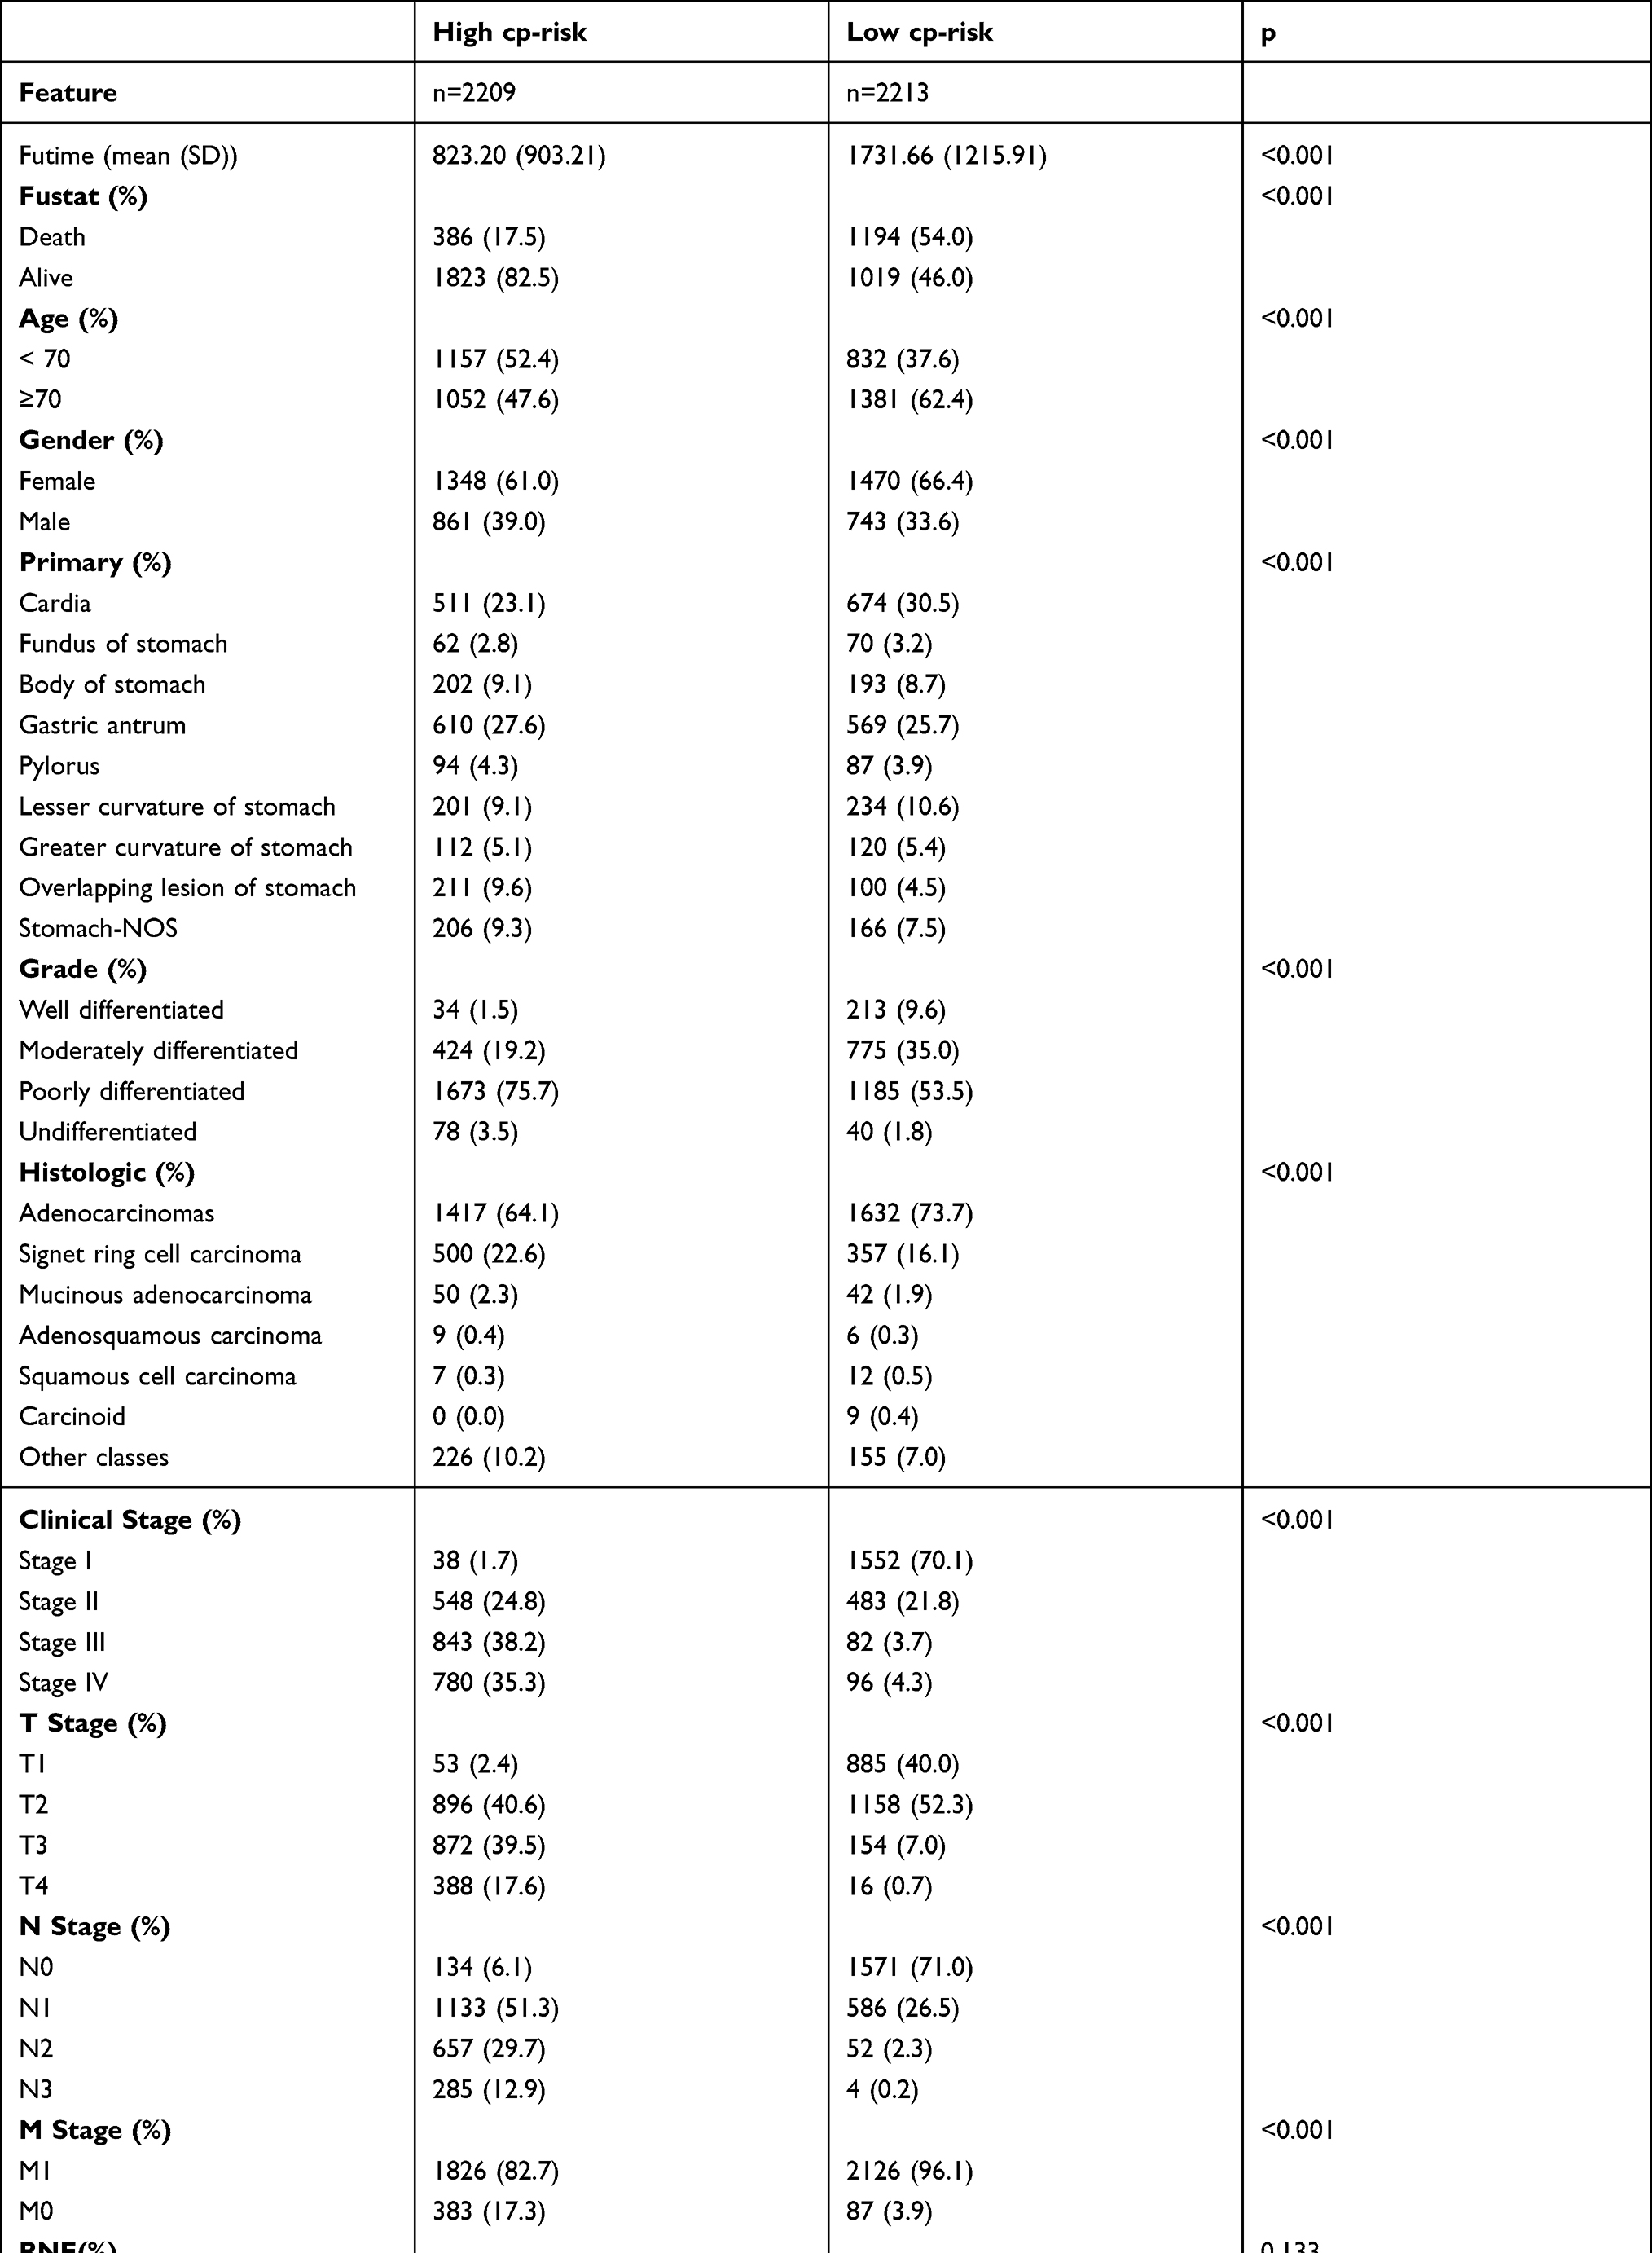 |
Table 2 Baseline Data of High-Risk Group and Low-Risk Group in the Internal Validation Set of Clinical Prognosis Model |
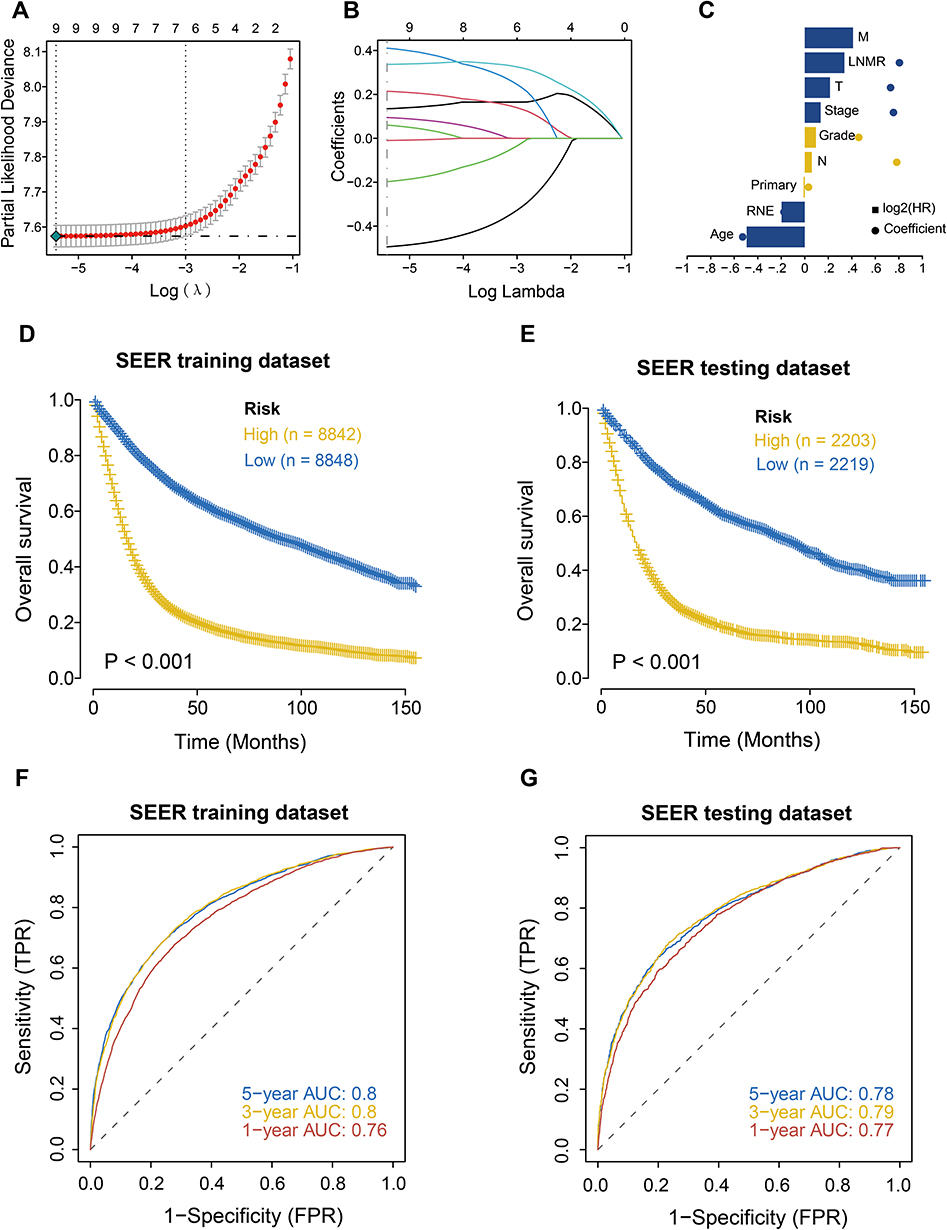 |
Figure 3 Construction of prognostic model of postoperative gastric cancer patients in the SEER database and survival analysis of high and low risk groups. (A) Misclassification error of different quantitative variables revealed by the LASSO regression model. The red dot represents the misclassification error value, gray line represents the standard error (SE), and left and right vertical dashed lines represent the optimal value under the minimum criterion and 1-SE criterion, respectively, and “lambda” is the tuning parameter. (B) Variation in coefficient values (Coefficients) corresponding to the variables with the lambda value of the tuning parameter. (C) Characteristic coefficient diagram of the LASSO regression model. The dots represent the model coefficients and bar graphs represent log2 (HR). (D) Survival analysis of the high and low risk groups in the training set. Yellow represents the high-risk group, and blue represents the low-risk group. (E) Survival analysis of the high and low risk groups in the internal validation set. Yellow represents the high-risk group, and blue represents the low-risk group. (F) ROC analysis of risk score in training set (1, 3, 5 years). (G) ROC analysis of risk score in internal validation set (1, 3, 5 years). |
External Verification of the Clinical Prognosis Model
The clinical information of gastric cancer patients collected from the Affiliated Tumor Hospital of Harbin Medical University was used as the external validation data of this model. The survival difference between the two groups was evaluated by Kaplan Meier to explore the stability of the clinical prognosis model. The results showed that in the external validation set, the OS of the high-risk group was significantly lower than that of the low-risk group (Figure 4A), and its baseline data table is shown in (Table 3). The ROC curve was used to evaluate the accuracy of the model’s prediction, and the results showed that the model had strong predictive efficiency. The AUC values for 1, 3, and 5 years on the external validation dataset were 0.81, 0.80, and 0.80, respectively (Figure 4B).
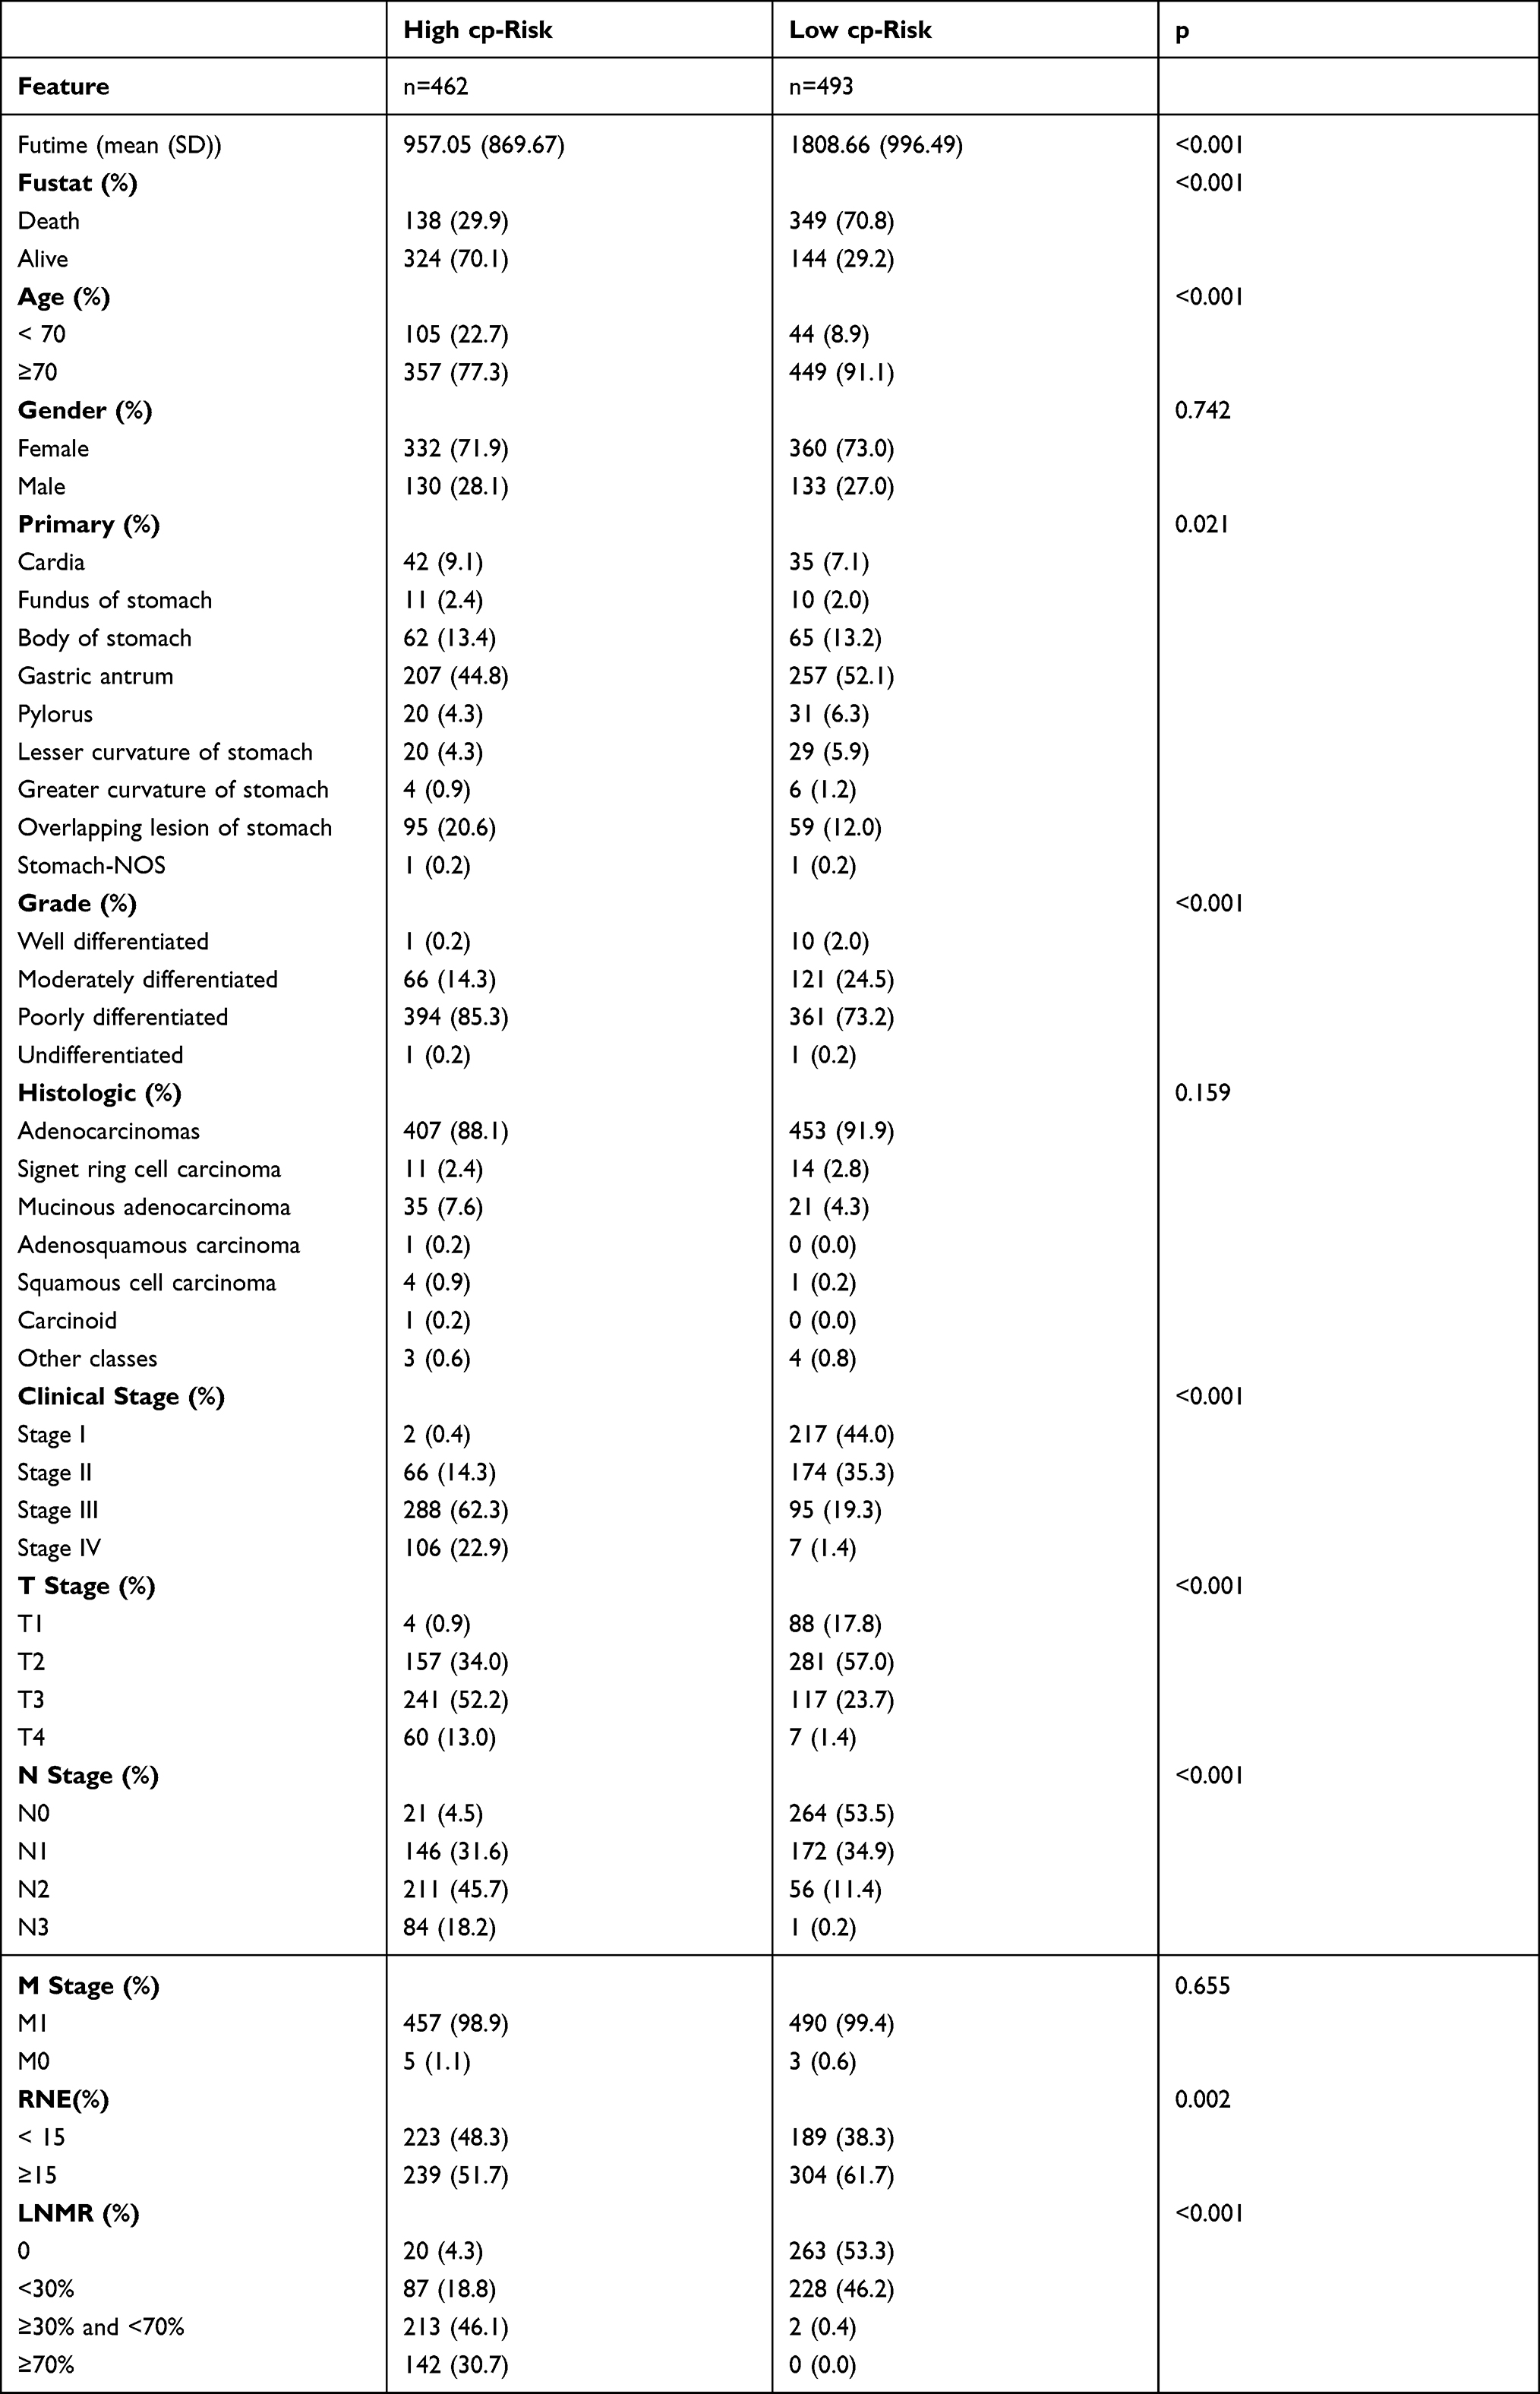 |
Table 3 Baseline Data of High-Risk Group and Low-Risk Group in External Validation Set of Clinical Prognosis Model |
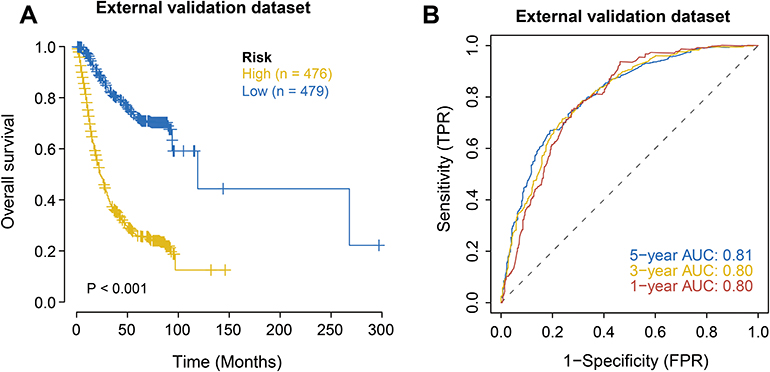 |
Figure 4 External validation of the clinical prognosis model of postoperative patients with gastric cancer. (A) Survival analysis of the external validation set. Yellow represents the high-risk group, and blue represents the low-risk group. (B) ROC analysis of risk score on external validation (1, 3, 5 years). |
Screening of Key Features of Machine Learning Clinical Prognosis Model
Similarly, after analyzing the 11 clinical features of gastric cancer patients from the SEER database through univariate Cox regression, it was found that all the features were significant except for the two clinical features of gender and Histologic (Figure 5A). Furthermore, the remaining nine clinical features were screened using the Borutafit algorithm, Elasticnet, SVM, and Random Forest (Figure 5B–E), and the top five clinical features (the average value of the importance ranking of the four algorithms) were obtained: Age, LNMR, RNE, Grade and T (Figure 5F); thereafter, the selected key features were combined through different combinations methods to obtain combined features. Finally, 31 features were obtained (Appendix Material 1), which were combined with survival information, and the univariate Cox regression analysis was performed to obtain 30 candidate features significantly related to the prognosis.
 |
Figure 5 Feature selection of postoperative patients with gastric cancer in the SEER database. (A) Univariate Cox regression forest plot for feature selection. Regression analysis was performed on each clinical feature using the Cox proportional hazard model. The red dots indicate that the clinical feature is significantly related to survival (p < 0.05). (B) Feature selection of Boruta algorithm. The Boruta algorithm was used to obtain the importance of each clinical feature, and the value of importance was used to reflect the correlation between the feature and survival. (C) Feature selection of Elasticnet algorithm to obtain the importance of each clinical feature and reflect the impact of the feature on survival through the size of risk coefficient of each feature. (D) Feature selection of SVM algorithm. The machine learning method based on SVM sorted the scores of each feature, and finally selected the required features. (E) Feature selection of the Random Forest algorithm. %IncMSE means increase in mean squared error. The larger the value, the greater the importance of the variable; IncNodePurity means increase in node purity. The larger the value, the greater the importance of the variable. This study evaluated the importance of features according to %IncMSE. (F) Ranking summary of the importance of clinical information features of gastric cancer. |
Construction and Effectiveness Evaluation of Machine Learning Clinical Prognosis Model
Patient information in the SEER database was randomly divided into training and validation sets at a ratio of 4:1, and then the C-index value of each combination was calculated by randomly extracting candidate features, and the combination feature with the highest C-index mean in the training and validation sets was selected as the modeling feature, and the corresponding best mL-riskscore was calculated through LASSO regression analysis for subsequent analyses (Figure 6A–C). Nineteen combined features were obtained, where Calculated mL-riskscore = Age × (−0.5858) + RNE × (−0.1212) + Age_RNE × (−0.0821) + Grade_RNE × (−0.0197) + LNMR_T × (−0.0176) + Age_Grade_RNE × (−0.0089) + LNMR_RNE_T × (−0.0030) + Grade_LNMR_RNE_T × (−0.0015) + Grade_LNMR_T × (−0.0007) + Age_LNMR × (0.0002) + Grade_LNMR_RNE × (0.0013) + Age_Grade_T × (0.0038) + Grade_LNMR × (0.0051) + Age_LNMR_RNE × (0.0316) + Age_T × (0.0397) + T × (0.0522) + Grade_T × (0.0641) + LNMR_RNE × (0.0919) + LNMR × (0.1571). According to the median value of the risk score, the patients were divided into high-risk and low-risk groups, and Kaplan-Meier was used to obtain a survival curve. The results showed that the OS of the high-risk group in the training and test sets was significantly lower than that of the low-risk group (Figure 6D–E), the baseline data is shown in (Tables 4 and 5). In addition, the ROC curve results showed that the AUC values for 1, 3, and 5 years in the training set were 0.76, 0.79, and 0.79, respectively, and the AUC values for 1, 3, and 5 years in the test set were 0.76, 0.79, and 0.79, respectively (Figure 6F and G), indicating that the machine learning clinical prognosis model had good validation efficiency.
 |
Table 4 Baseline Data of High-Risk Group and Low-Risk Group in Training Set of Machine Learning Clinical Prognosis Model |
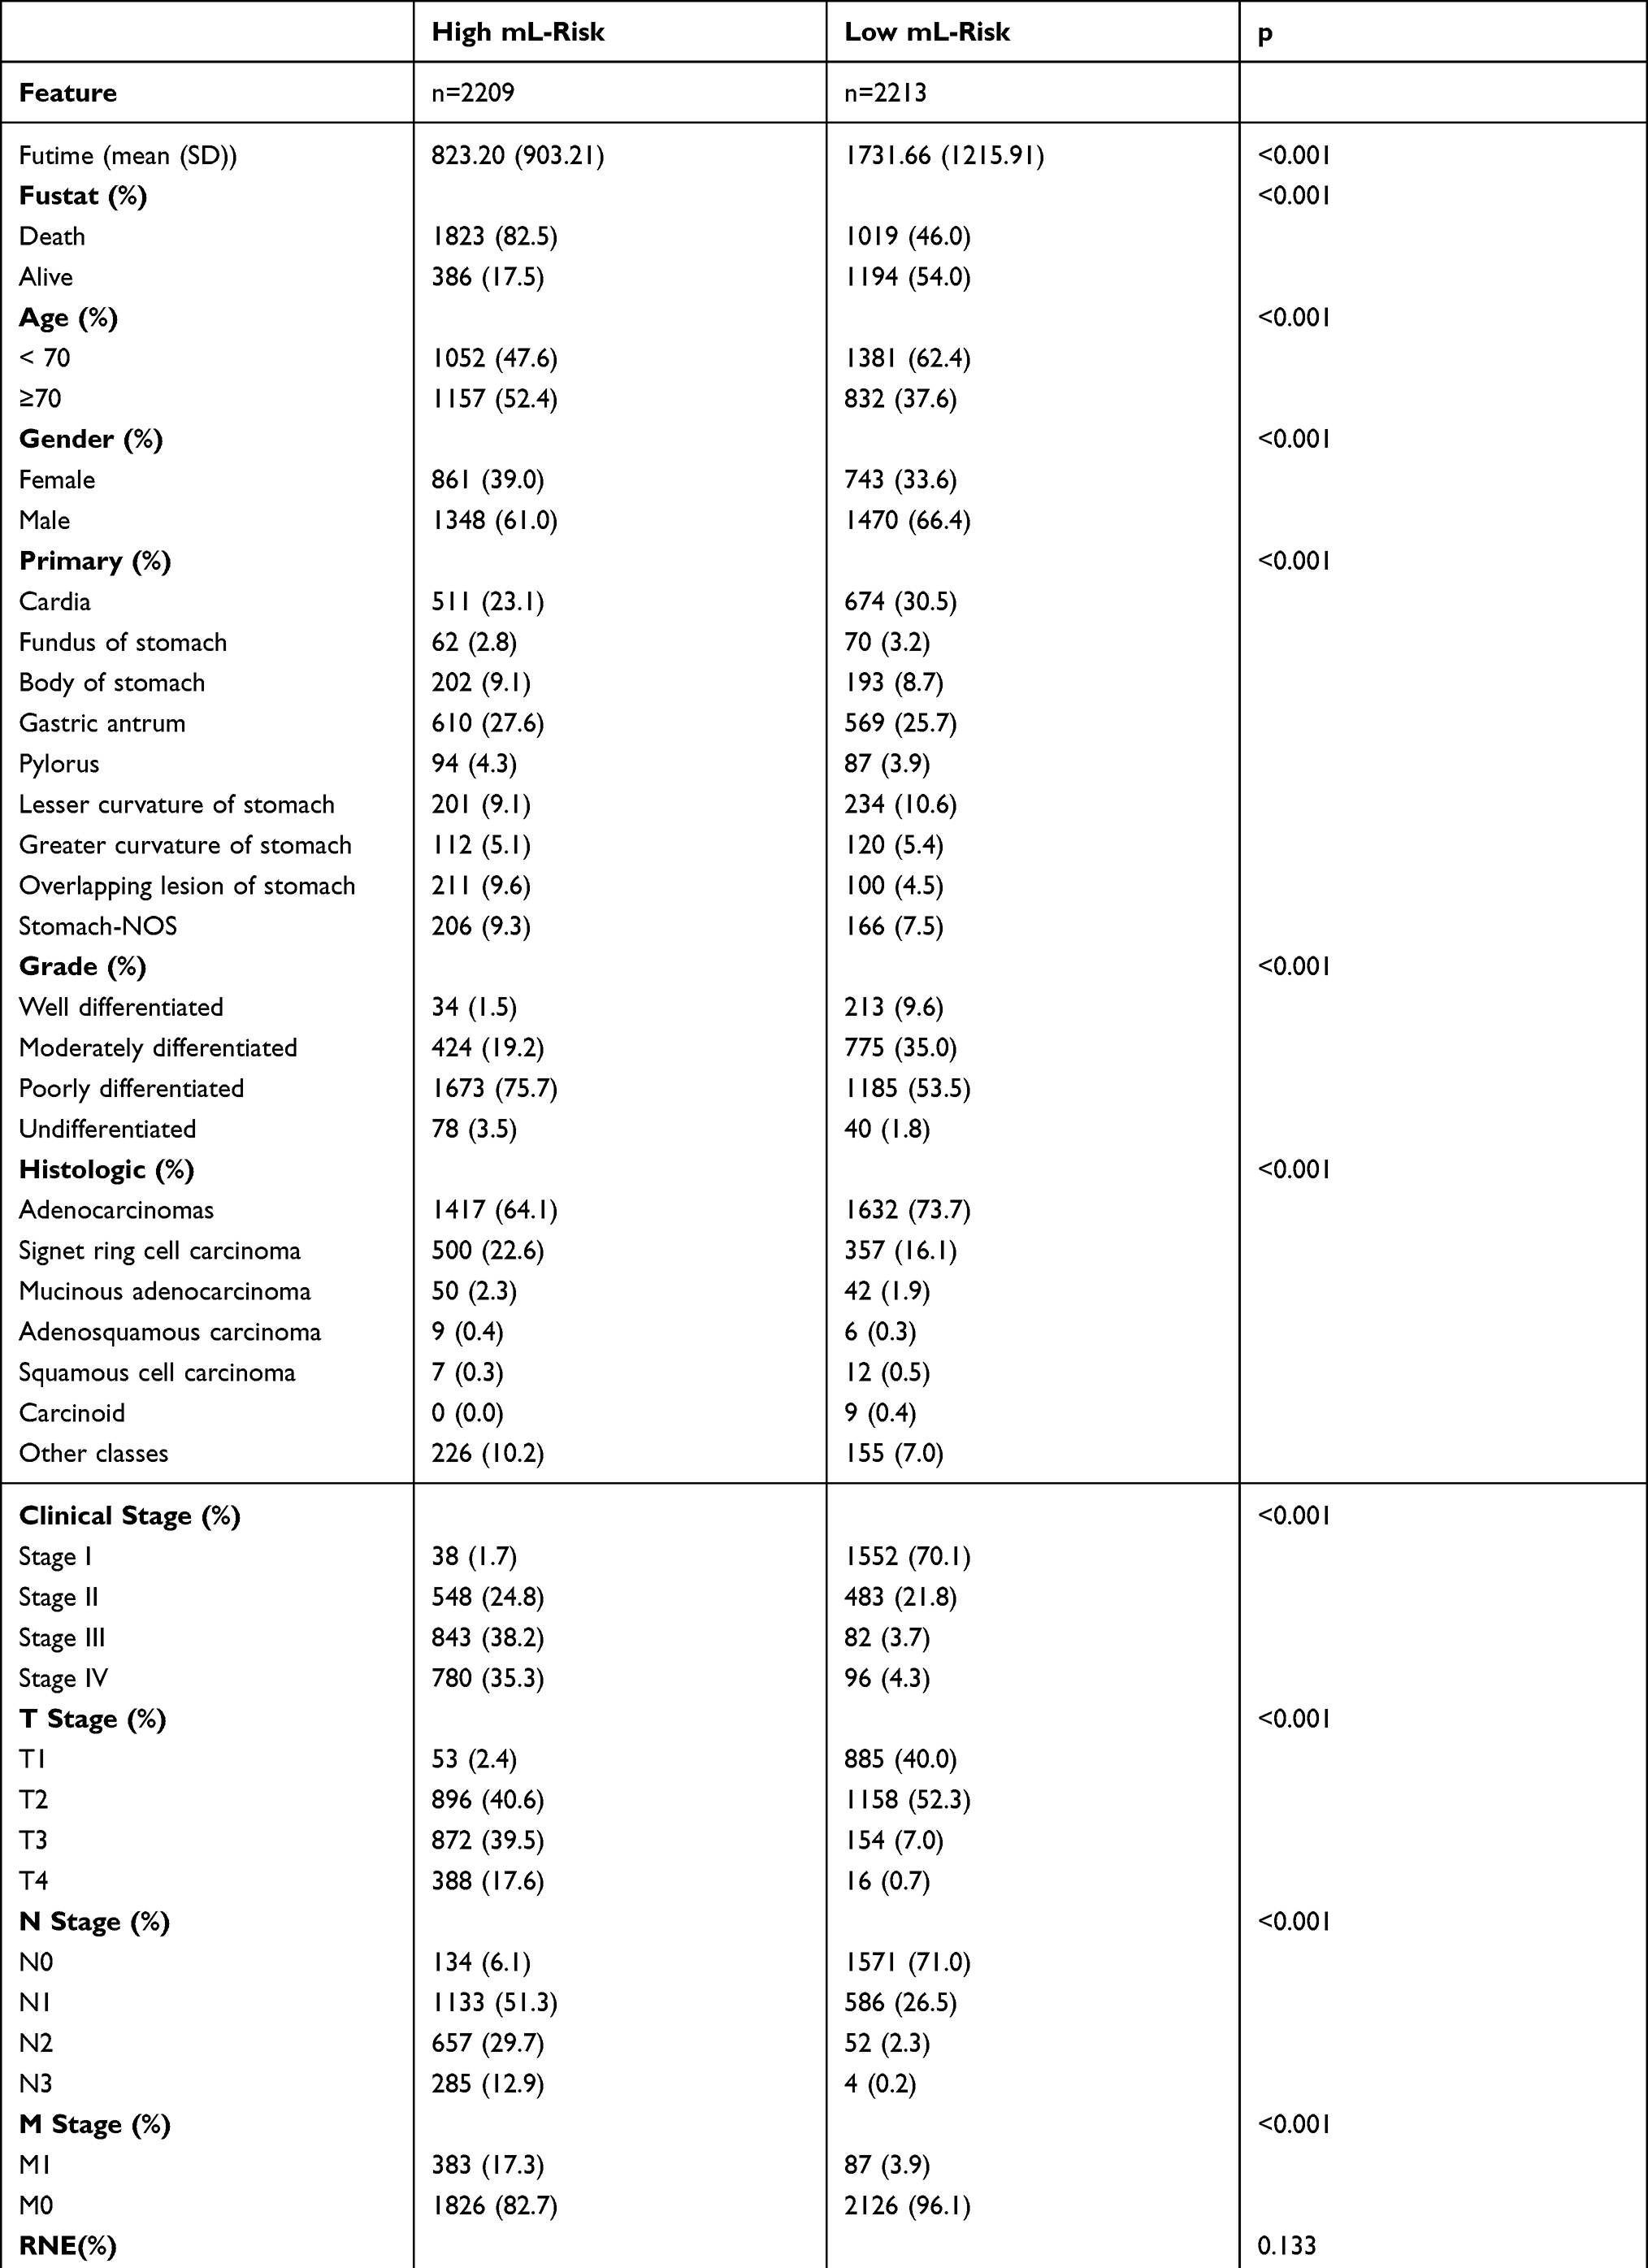 |
Table 5 Baseline Data of High-Risk Group and Low-Risk Group in Internal Validation Set of Machine Learning Clinical Prognosis Model |
 |
Figure 6 Construction of machine learning clinical prognosis model for postoperative gastric cancer patients in the SEER database and survival analysis of high and low risk groups. (A) Misclassification error of different quantitative variables revealed by LASSO regression model. The red dot represents the misclassification error value, gray line represents the standard error (SE), the left and right vertical dashed lines represent the optimal value under the minimum criterion and 1-SE criterion respectively, and “lambda” is the tuning parameter. (B) Variation in coefficient values (Coefficients) corresponding to the variables with the lambda value of the tuning parameter. (C) The characteristic coefficient diagram of the LASSO regression model. The dots represent the model coefficients and bar graphs represent log2 (HR). (D) Survival analysis of the high and low risk groups in the training set. Yellow represents the high-risk group, and blue represents the low-risk group. (E) Survival analysis of the high and low risk groups in the internal validation set. Yellow represents the high-risk group, and blue represents the low-risk group. (F) ROC analysis of risk score in training set (1, 3, 5 years). (G) ROC analysis of risk score in internal validation set (1, 3, 5 years). |
External Validation of Machine Learning Clinical Prognosis Models
The clinical information of gastric cancer patients collected from the Affiliated Tumor Hospital of Harbin Medical University was used as the external validation data of this model. The survival difference between the two groups was evaluated by Kaplan Meier to explore the stability of the prognostic model. The results showed that in the external validation set, the OS of the high-risk group was significantly lower than that of the low-risk group (Figure 7A), and its baseline data are presented in Table 6. The ROC curve was used to evaluate the accuracy of the model’s prediction, and the results showed that the machine learning clinical prognosis model had strong predictive efficiency. The AUC values for 1, 3, and 5 years in the external validation dataset were 0.80, 0.80, and 0.80, respectively (Figure 7B).
 |
Table 6 Baseline Data of High-Risk Group and Low-Risk Group in External Validation Set of Machine Learning Clinical Prognosis Model |
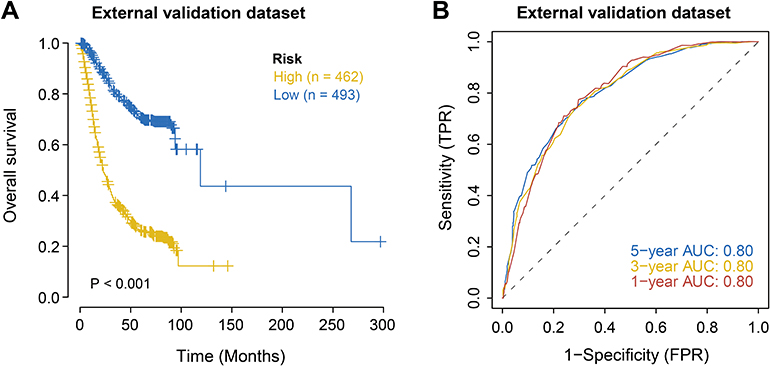 |
Figure 7 External validation of machine learning clinical prognosis model for postoperative patients with gastric cancer. (A) Survival analysis of the external validation set. Yellow represents the high-risk group and blue represents the low-risk group. (B) ROC analysis of risk score in external validation (1, 3, 5 years). |
Survival Analysis of Clinical Subgroups Based on Machine Learning and Clinical Features
To further explore the application value of risk scores, this study analyzed the survival of risk scores of different subtypes in each clinical feature. The results showed that except that the groups with LNMR≥70% were high-risk groups, the survival curve could not be constructed, and that there were significant differences in the survival of the remaining 43 clinical feature subtypes between the high-risk group and the low-risk group (Figure 8).
 |
Figure 8 Survival analysis of the clinical features of postoperative patients with gastric cancer in the high and low risk groups in each subgroup in the SEER database. |
Discussion
There are many clinical factors affecting gastric cancer. The traditional TNM staging can no longer meet the needs of individualized and precise treatment of patients in the clinic. Some studies have proved that the performance of constructing prognosis model by Cox risk ratio analysis26 and SVM11 is significantly better than TNM staging system. Therefore, selecting more representative features to evaluate the prognosis more accurately is an urgent problem to be solved. Machine learning algorithms have become the first choice to solve this problem. Previously, there was a similar application in the research and development of a prognostic prediction model using clinical data of patients.27–29 Turkki R applied an artificial neural network and support vector machine in prognostic prediction of breast cancer.30 He selected the cancer recurrence time (local and systemic) and whether a patient died of cancer within 32 months as the outcome variables. The results showed that the model constructed by each algorithm had good efficiency. Wang et al used five classifiers: Naive Bayes, the generalized linear model, the linear discriminant model, glmnet, and the quadratic discriminant model to rank the importance of clinical features of patients with colon cancer after surgery.18 They averaged the five importance rankings as the final importance ranking of clinical features and successively constructed a clinical prognosis model with good efficiency; however, this has not been verified on external datasets.
First, based on the nine clinical features selected by the univariate Cox analysis, the classic clinical prognosis model was directly constructed by LASSO regression analysis, and the cp-riskcore of each patient was calculated. The results showed that the prognosis model constructed by this method was effective, and the AUC values for 1, 3, and 5 years in the training set were 0.76, 0.80, and 0.80 respectively. The AUC values for 1, 3, and 5 years in the internal and external validation sets were 0.77, 0.79, and 0.78, and 0.81, 0.80, and 0.80, respectively, and there were significant differences between the high-risk group and the low-risk group. Subsequently, we used Boruta, Elasticnet, SVM, and Random Forest as feature selection methods according to the features of different learning methods. The Boruta algorithm can help us understand the influencing factors of the dependent variable more comprehensively. It helps to eliminate the limitations of related variables, prejudice, and unnecessary noise. The stability and scalability of the experimental results were excellent.31 Elastic network is a linear regression model that uses L1 and L2 as prior regularization terms to train. While using L1 regularization to eliminate unimportant features, L2 regularization is used to select highly relevant features at the same time, which helps to reduce the risk of overfitting. It is a very effective feature selection method when there are many interconnected features.32 SVM is a supervised learning method that can solve high-dimensional problems, deal with the interaction of nonlinear features, and has strong a generalization ability.33 The random forest algorithm was proposed by Breiman in 2001,34 which is an integrated tree classifier. The biggest advantage of random forest is that it can be used to analyze data with a much larger number of variables than the sample size, therefore, the overfitting problem does not occur easily; moreover, it can solve the problem of collinearity. It uses unbiased estimation, has an excellent accuracy, and has strong model generalizability. In this study, the features selected by combining the four algorithms have good predictive performance. We calculated the optimal mL-riskscore corresponding to each sample through LASSO regression. The results showed that we also obtained better results in the process of large-sample machine learning. The AUC values for 1, 3, and 5 years in the training and validation sets were 0.76, 0.79, and 0.79, respectively, especially in the external validation queue, the AUC value for 1, 3 and 5 years was 0.8; in addition, the survival analysis between the high-risk group and low-risk group showed significant differences. After comparing the two prediction models, it is found that the AUC values of the clinical prognostic model and the machine learning prognostic model in the training set, internal validation set and external validation set are similar, floating up and down at 0.8, which has strong generalization. Compared with the clinical prognostic model, the machine learning clinical prognostic model does not show its advantages, which may be due to the large sample size of SEER database, The model has strong generalization ability and is less affected by machine learning algorithm. Although the efficiency of the two algorithms was similar, and the model constructed using machine learning algorithms was relatively complex in terms of mathematical calculations, the results obtained by applying the two models in clinical practice were undoubtedly more reliable. In addition, to clarify the clinical application value of mL-riskscore, we analyzed the survival of high-risk and low-risk groups in different subgroups of clinical features. It was found that mL-riskscore could well distinguish the survival rate in each subgroup of clinical features.
To the best of our knowledge, this study is the first to construct a clinical prognosis model of postoperative patients with gastric cancer by fitting machine learning algorithms. The objective of this study was to construct two effective clinical prognosis models for postoperative patients with gastric cancer, and verify them with a large sample of external data, which has strong clinical practicability. However, there are few limitations. First, there may be a sample selection bias due to the retrospective study design. Second, the machine learning prognostic model we constructed does not show obvious advantages compared with the classic prognostic model. We will continue to optimize the model by trying different machine learning algorithms in the future. In addition, this study did not consider molecular features, such as gene mutation, DNA methylation, and transcriptome markers. In a future work, we will integrate molecular features into the model to improve the overall prognostic efficiency of the model. In conclusion, the two prognostic models of gastric cancer that we have established have the characteristics of low cost, high sensitivity, and specificity, and can provide help for clinical accurate and individualized treatment of postoperative patients with gastric cancer.
Conclusion
Based on the public data of postoperative patients with gastric cancer obtained from the SEER database and the clinical data of postoperative patients with gastric cancer collected from the Affiliated Tumor Hospital of Harbin Medical University, we constructed a clinical prognosis model of gastric cancer and constructed a machine learning clinical prognosis model of gastric cancer for the first time. The models were verified on external datasets, and they accurately evaluated the prognosis of postoperative patients with gastric cancer, which may be helpful for accurate and personalized treatment of postoperative patients with gastric cancer in the clinical environment.
Data Sharing Statement
The SEER data were available upon request to the SEER website (www.seer.cancer.gov). The external validation dataset comes from the clinical information of 955 postoperative patients with gastric cancer collected by the Affiliated Tumor Hospital of Harbin Medical University (from January 1, 2002 to April 31, 2014). The former work affiliations of the authors Donghui Liu and Xiaoxue Li were the Affiliated Tumor Hospital of Harbin Medical University. All external validation set data comes from this hospital. Now the work affiliations of Donghui Liu and Xiaoxue Li have been transferred to Harbin Institute of technology and Heilongjiang Provincial Hospital. Therefore, the name of the ethics committee of the study does not match the affiliation of the author, and we still apply the ethics committee approved by the Affiliated Tumor Hospital of Harbin Medical University.
Ethics Approval and Informed Consent
The study was approved by the ethics committee of The Affiliated Tumor Hospital of Harbin Medical University (KY2016-21), Heilongjiang Province, China. Since this study is a retrospective study, the information of the applied patients is only clinical information, and most of the patients died or were lost during the follow-up, which will not affect the further diagnosis and treatment of the patients, and as such the ethics committee did not require the patients to agree to review their medical records. The study ensured the confidentiality of the patient data and abided by the Declaration of Helsinki.
Consent for Publication
Consent for publication was obtained from all participants.
Acknowledgment
These authors have contributed equally to this work and share corresponding authorship: Yan Zhang and Liru Wang.
Funding
Heilongjiang applied technology research and development plan (GA20C018). Scientific research project of Heilongjiang Provincial Health Commission (20210303100116). and Scientific research project of Heilongjiang Provincial Health Commission (2020-231).
Disclosure
The authors report no conflicts of interest for this work and declare that the research was conducted in the absence of any commercial or financial relationships that could be construed as a potential conflict of interest.
References
1. Bray F, Ferlay J, Soerjomataram I, et al. Erratum: global cancer statistics 2018: GLOBOCAN estimates of incidence and mortality worldwide for 36 cancers in 185 countries. CA Cancer J Clin. 2020;70(4):313. doi:10.3322/caac.21609
2. Kinoshita T, Uyama I, Terashima M, et al. Long-term Outcomes of Laparoscopic Versus Open Surgery for Clinical Stage II/III Gastric Cancer: a Multicenter Cohort Study in Japan (LOC-A Study). Ann Surg. 2019;269(5):887–894. doi:10.1097/SLA.0000000000002768
3. Liu F, Huang C, Xu Z, et al. Morbidity and Mortality of Laparoscopic vs Open Total Gastrectomy for Clinical Stage I Gastric Cancer: the CLASS02 Multicenter Randomized Clinical Trial. JAMA Oncol. 2020;6(10):1590–1597. doi:10.1001/jamaoncol.2020.3152
4. Touchefeu Y, Guimbaud R, Louvet C, et al. Prognostic factors in patients treated with second-line chemotherapy for advanced gastric cancer: results from the randomized prospective Phase III FFCD-0307 trial. Gastric Cancer. 2019;22(3):577–586. doi:10.1007/s10120-018-0885-z
5. Chen QY, Zhong Q, Wang W, et al. Prognosis of Young Survivors of Gastric Cancer in China and the U.S.: determining Long-Term Outcomes Based on Conditional Survival. Oncologist. 2019;24(6):e260–e274. doi:10.1634/theoncologist.2018-0220
6. Dixon M, Mahar AL, Helyer LK, Vasilevska-Ristovska J, Law C, Coburn NG. Prognostic factors in metastatic gastric cancer: results of a population-based, retrospective cohort study in Ontario. Gastric Cancer. 2016;19(1):150–159. doi:10.1007/s10120-014-0442-3
7. Cheong JH, Yang HK, Kim H, et al. Predictive test for chemotherapy response in resectable gastric cancer: a multi-cohort, retrospective analysis. Lancet Oncol. 2018;19(5):629–638. doi:10.1016/S1470-2045(18)30108-6
8. Chekroud AM, Bondar J, Delgadillo J, et al. The promise of machine learning in predicting treatment outcomes in psychiatry. World Psychiatry. 2021;20(2):154–170. doi:10.1002/wps.20882
9. Kourou K, Exarchos T, Exarchos K, Karamouzis M, Fotiadis D. Machine learning applications in cancer prognosis and prediction. Comput Struct Biotechnol J. 2015;13:8–17. doi:10.1016/j.csbj.2014.11.005
10. Hwangbo S, Kim SI, Kim JH, et al. Development of Machine Learning Models to Predict Platinum Sensitivity of High-Grade Serous Ovarian Carcinoma. Cancers. 2021;13(8):1875. doi:10.3390/cancers13081875
11. Jiang Y, Xie J, Han Z, et al. Immunomarker Support Vector Machine Classifier for Prediction of Gastric Cancer Survival and Adjuvant Chemotherapeutic Benefit. Clin Cancer Res. 2018;24(22):5574–5584. doi:10.1158/1078-0432.CCR-18-0848
12. Brims FJ, Meniawy TM, Duffus I, et al. A novel clinical prediction model for prognosis in malignant pleural mesothelioma using decision tree analysis. J Thorac Oncol. 2016;11(4):573–582. doi:10.1016/j.jtho.2015.12.108
13. Shim WS, Yim K, Kim TJ, et al. DeepRePath: identifying the prognostic features of early-stage lung adenocarcinoma using multi-scale pathology images and deep convolutional neural networks. Cancers. 2021;13:13. doi:10.3390/cancers13133308
14. Hopkins AM, Kichenadasse G, Garrett-Mayer E, Karapetis CS, Rowland A, Sorich MJ. Development and validation of a prognostic model for patients with advanced lung cancer treated with the immune checkpoint inhibitor atezolizumab. Clin Cancer Res. 2020;26(13):3280–3286. doi:10.1158/1078-0432.CCR-19-2968
15. Peng H, Dong D, Fang MJ, et al. Prognostic Value of Deep Learning PET/CT-Based Radiomics: potential Role for Future Individual Induction Chemotherapy in Advanced Nasopharyngeal Carcinoma. Clin Cancer Res. 2019;25(14):4271–4279. doi:10.1158/1078-0432.CCR-18-3065
16. Ma X, Chen H, Wang G, Li L, Tao K. DNA methylation profiling to predict overall survival risk in gastric cancer: development and validation of a nomogram to optimize clinical management. J Cancer. 2020;11(15):4352–4365. doi:10.7150/jca.44436
17. Zhang Y, Li H, Zhang W, Che Y, Bai W, Huang G. LASSO‑based Cox‑PH model identifies an 11‑lncRNA signature for prognosis prediction in gastric cancer. Mol Med Rep. 2018;18(6):5579–5593. doi:10.3892/mmr.2018.9567
18. Wang L, Su M, Zhang M, et al. Accurate Prediction of Prognosis by Integrating Clinical and Molecular Characteristics in Colon Cancer. Front Cell Dev Biol. 2021;9:664415. doi:10.3389/fcell.2021.664415
19. Yi L, Wu G, Guo L, Zou X, Huang P. Comprehensive Analysis of the PD-L1 and Immune Infiltrates of m(6)A RNA Methylation Regulators in Head and Neck Squamous Cell Carcinoma. Mol Ther Nucleic Acids. 2020;21:299–314. doi:10.1016/j.omtn.2020.06.001
20. Robin X, Turck N, Hainard A, et al. pROC: an open-source package for R and S+ to analyze and compare ROC curves. BMC Bioinform. 2011;12:77. doi:10.1186/1471-2105-12-77
21. Heagerty PJ, Zheng Y. Survival model predictive accuracy and ROC curves. Biometrics. 2005;61(1):92–105. doi:10.1111/j.0006-341X.2005.030814.x
22. Speiser JL, Miller ME, Tooze J, Ip E. A Comparison of Random Forest Variable Selection Methods for Classification Prediction Modeling. Expert Syst Appl. 2019;134:93–101. doi:10.1016/j.eswa.2019.05.028
23. Simon N, Friedman J, Hastie T, Tibshirani R. Regularization Paths for Cox’s Proportional Hazards Model via Coordinate Descent. J Stat Softw. 2011;39(5):1–13. doi:10.18637/jss.v039.i05
24. Wang Q, Liu X. Screening of feature genes in distinguishing different types of breast cancer using support vector machine. Onco Targets Ther. 2015;8:2311–2317. doi:10.2147/OTT.S85271
25. Chen X, Ishwaran H. Random forests for genomic data analysis. Genomics. 2012;99(6):323–329. doi:10.1016/j.ygeno.2012.04.003
26. Woo Y, Son T, Song K, et al. A Novel Prediction Model of Prognosis After Gastrectomy for Gastric Carcinoma: development and Validation Using Asian Databases. Ann Surg. 2016;264(1):114–120. doi:10.1097/SLA.0000000000001523
27. Zhou C, Hu J, Wang Y, et al. A machine learning-based predictor for the identification of the recurrence of patients with gastric cancer after operation. Sci Rep. 2021;11(1):1571. doi:10.1038/s41598-021-81188-6
28. Zhou C, Wang Y, Ji M, Tong J, Yang J, Xia H. Predicting Peritoneal Metastasis of Gastric Cancer Patients Based on Machine Learning. Cancer Control. 2020;27(1):1073274820968900. doi:10.1177/1073274820968900
29. Bang C, Ahn J, Kim J, Kim Y, Choi I, Shin W. Establishing Machine Learning Models to Predict Curative Resection in Early Gastric Cancer with Undifferentiated Histology: development and Usability Study. J Med Internet Res. 2021;23(4):e25053. doi:10.2196/25053
30. Turkki R, Byckhov D, Lundin M, et al. Breast cancer outcome prediction with tumour tissue images and machine learning. Breast Cancer Res Treat. 2019;177(1):41–52. doi:10.1007/s10549-019-05281-1
31. Acharjee A, Larkman J, Xu Y, Cardoso V, Gkoutos G. A random forest based biomarker discovery and power analysis framework for diagnostics research. BMC Med Genomics. 2020;13(1):178. doi:10.1186/s12920-020-00826-6
32. Zou H, Zhang H. ON THE ADAPTIVE ELASTIC-NET WITH A DIVERGING NUMBER OF PARAMETERS. Ann Stat. 2009;37(4):1733–1751. doi:10.1214/08-AOS625
33. Cherkassky V. The nature of statistical learning theory~. IEEE Trans Neural Netw. 1997;8(6):1564. doi:10.1109/TNN.1997.641482
34. Statistics LB, Breiman L. Random Forests. Mach Learn. 2001;2:5–32.
 © 2022 The Author(s). This work is published and licensed by Dove Medical Press Limited. The
full terms of this license are available at https://www.dovepress.com/terms
and incorporate the Creative Commons Attribution
- Non Commercial (unported, 3.0) License.
By accessing the work you hereby accept the Terms. Non-commercial uses of the work are permitted
without any further permission from Dove Medical Press Limited, provided the work is properly
attributed. For permission for commercial use of this work, please see paragraphs 4.2 and 5 of our Terms.
© 2022 The Author(s). This work is published and licensed by Dove Medical Press Limited. The
full terms of this license are available at https://www.dovepress.com/terms
and incorporate the Creative Commons Attribution
- Non Commercial (unported, 3.0) License.
By accessing the work you hereby accept the Terms. Non-commercial uses of the work are permitted
without any further permission from Dove Medical Press Limited, provided the work is properly
attributed. For permission for commercial use of this work, please see paragraphs 4.2 and 5 of our Terms.