
Back to Journals » Diabetes, Metabolic Syndrome and Obesity » Volume 19
Machine Learning-Based Identification of Serum Metabolic Signatures in Adult Patients with Type 1 Diabetes
Authors Wang C  , Lan Y, Zhao M, Zhu J, Tan H, Li X, Ding Y, Zheng X, Liu S, Gu Z
Received 30 September 2025
Accepted for publication 13 January 2026
Published 3 February 2026 Volume 2026:19 569281
DOI https://doi.org/10.2147/DMSO.S569281
Checked for plagiarism Yes
Review by Single anonymous peer review
Peer reviewer comments 2
Editor who approved publication: Dr Pablo Corral
Chaofan Wang,1,* Yuhe Lan,2,* Minzhe Zhao,3 Jiangyu Zhu,3 Huiling Tan,3 Xingyu Li,3 Yu Ding,3 Xueying Zheng,3 Sihua Liu,4 Zhaohe Gu3
1Department of Endocrinology and Metabolism, The Third Affiliated Hospital of Sun Yat-Sen University, Guangdong Provincial Key Laboratory of Diabetology, Guangzhou, Guangdong, 510630, People’s Republic of China; 2Huiqiao Medical Center, Southern Medical University Nanfang Hospital, Guangzhou, Guangdong, 510515, People’s Republic of China; 3Department of Endocrinology, Institute of Endocrine and Metabolic Diseases, The First Affiliated Hospital of USTC, Division of Life Sciences and Medicine, Clinical Research Hospital of Chinese Academy of Sciences (Hefei), University of Science and Technology of China, Hefei, Anhui, 230001, People’s Republic of China; 4Department of Epidemiology and Biostatistics, School of Public Health, Anhui Medical University, Hefei, Anhui, 231200, People’s Republic of China
*These authors contributed equally to this work
Correspondence: Zhaohe Gu, Email [email protected] Sihua Liu, Email [email protected]
Background: Metabolomic profiling via machine learning can reveal signatures of host metabolism and identify useful biomarkers. We aimed to investigate metabolomic profiles and biomarkers in adult patients with type 1 diabetes (T1D) via machine learning.
Methods: We recruited 29 adult patients with T1D and matched them with 29 healthy controls on the basis of age, sex, and body mass index (BMI). We collected serum samples from both groups and performed nontargeted metabolomics with liquid chromatography‒mass spectrometry (LC‒MS). Four machine learning algorithms (logistic regression, support vector machine, Gaussian naive Bayes, and random forest) were used to screen potential T1D-related biomarkers.
Results: We identified 328 differently abundant metabolites between the T1D group and the control group that were significantly enriched in three metabolic pathways (purine metabolism, ketone body synthesis and degradation, and methyl butyrate metabolism), with P values less than 0.05. Ten metabolites were identified as T1D-related indicators, including L-fucopyranose, hept-2-ulose, L-rhamnose, docosahexaenoic acid, pumiliotoxin 251d, 9,12-octadecadienal, oleamide, estrane, (e,e)-2,4-heptadienal, and hexadecanamide. The predictive value of the ten candidate metabolites, as measured by the area under the curve (AUC), ranged from 0.86 to 0.95.
Conclusion: In this study, we identified purine metabolism, synthesis and degradation of ketone bodies, and impaired methyl butyrate metabolism as metabolic pathways that are altered in adult patients with T1D. Our findings present an extensive profile of metabolic changes in adult patients with T1D, and the identified biomarkers may have important clinical significance in the diagnosis of T1D and the monitoring of responses to therapeutic interventions.
Keywords: biomarkers, type 1 diabetes mellitus, machine learning, metabolic disorders, metabolomic
Introduction
Type 1 diabetes (T1D) is a persistent autoimmune disorder characterized by the destruction of insulin-secreting β-cells in the pancreas.1 Although T1D is traditionally associated with pediatric patients, the recognition of adult patients with T1D has increased.2,3 However, most longitudinal cohort studies on T1D have focused on pediatric populations, resulting in a scarcity of data about adult patients.3 Studies indicate that approximately 40% of adult patients who are diagnosed with T1D are initially misidentified as having type 2 diabetes (T2D).4 The natural course of adult-onset T1D differs markedly from that of childhood-onset T1D, with slower disease progression.5 Some adult patients may retain higher levels of C-peptide at diagnosis and may not display typical T1D symptoms.6 This misdiagnosis can have significant consequences, such as an increased risk of diabetic ketoacidosis (DKA), when adult patients with T1D are inappropriately treated with noninsulin therapies.4,7
Early identification of T1D is critical for improving disease management and preventing complications.8,9 However, current approaches remain suboptimal due to the lack of specific biomarkers and the heterogeneity of clinical presentation. Some patients, particularly adults, do not exhibit classic symptoms such as polyuria, polydipsia, and weight loss at an early stage, which complicates timely recognition of the disease.10 Existing criteria mainly rely on blood glucose and insulin measurements, which may miss the early course of T1D. For example, persistently high C-peptide levels can mask the gradual decline in β-cell function, thereby delaying detection.11 Although a limited number of studies have investigated metabolic alterations in adult-onset T1D, most available metabolomics and biomarker studies have focused on pediatric populations or mixed-age cohorts, underscoring the need for adult-specific investigations.12,13
Metabolomics has emerged as a promising tool for early diagnosis, offering insights into the metabolic alterations associated with T1D through comprehensive profiling.14 These metabolic alterations may occur before clinical symptoms, providing an opportunity for earlier diagnosis in adult patients with T1D.15 The application of machine learning in the analysis of metabolomics data further enhances the potential to identify significant biomarkers that could facilitate timely T1D diagnosis and intervention.16,17
This study sought to investigate the metabolic profiles linked to adult-onset T1D through the application of advanced machine learning methods. By emphasizing the identification of key metabolic biomarkers and assessing their diagnostic accuracy, we aim to develop strategies for early detection of adult-onset T1D. Our findings have the potential to improve the clinical diagnosis of adult-onset T1D, facilitating earlier diagnosis and intervention.
Materials and Methods
Subject Recruitment and Sample Collection
From 2019–2020, a cross-sectional investigation involving 29 patients with T1D and an equal number of age- and sex-matched healthy controls was conducted at the Department of Endocrinology at the Third Affiliated Hospital of Sun Yat-sen University.18 The American Diabetes Association’s guidelines were utilized for diagnosing T1D. To ensure the study’s specificity, we excluded participants with the following conditions: 1) chronic metabolic diseases; 2) chronic or acute inflammatory or infectious diseases; 3) use of medications that affect metabolism within three months prior to enrollment; 4) pregnancy; 5) lactation. We meticulously collected participants’ personal and medical histories through interviews and electronic patient records. Blood samples were collected from each individual for metabolite analysis and immediately stored at −80 °C until further processing. This strict protocol ensured the preservation of sample integrity and allowed for accurate and reliable metabolite analysis.
Serum Metabolomics Analysis
Metabolite extraction was conducted following previously reported methods.19,20 For quality control and evaluation of sample preparation, a 100-µL sample (2:1, v/v) containing internal standard combinations 1 (IS1) and 2 (IS2) was extracted. The sample was mixed with 300 µL of chilled methanol and acetonitrile. After vortexing for 1 minute, the mixture was incubated at −20 °C for 2 hours and then centrifuged at 4000 rpm for 20 minutes. The resulting supernatant was then carefully transferred and subjected to vacuum and freeze-drying. After freeze-drying, the sample was reconstituted in 150 µL of 50% methanol, followed by centrifugation at room temperature for 30 minutes. The supernatant was finally transferred into autosampler vials for LC‒MS analysis.
Raw LC–MS/MS data were processed using Compound Discoverer version 3.1 (Thermo Fisher Scientific, USA). The preprocessing workflow included peak extraction, retention time alignment within and between batches, adduct ion grouping, missing value filling, background peak annotation, and metabolite identification. Metabolite identification was performed by matching against a combined database consisting of the BGI in-house standard library, mzCloud, and ChemSpider databases, including HMDB, KEGG, and LipidMaps.
The output data matrix from Compound Discoverer was subsequently imported into the metaX package for further preprocessing and quality control.21 Signal intensity normalization was performed using Probabilistic Quotient Normalization (PQN) to obtain relative peak areas, as recommended for non-targeted metabolomics data.22 Batch effects and signal drift were corrected using QC-based robust LOESS signal correction (QC-RLSC) based on quality control (QC) samples.20 To ensure analytical reproducibility, the coefficient of variation (CV) of each feature was calculated across all QC samples, and features with a CV greater than 30% were excluded from further analysis, following established metabolomics quality control practices.
Metabolomic analyses were conducted on the MetaboAnalyst website.23 To explore the identified small molecule metabolites, we employed orthogonal projections with OPLS-DA to assess the global metabolic profile and identify differentially abundant metabolites between the T1D and control groups. Differentially abundant serum metabolites were selected on the basis of fold changes exceeding 2.0 and P values less than 0.05. In addition, we employed MetaboAnalyst to annotate the signaling pathways and biochemical metabolic pathways associated with these differentially abundant metabolites. Through this comprehensive analysis, we identified specific metabolic alterations associated with T1D. Moreover, this approach shed light on potential underlying mechanisms that may have an impact on the development and progression of T1D. Additionally, we applied four machine learning algorithms, including Logistic Regression (LR), Gaussian Naive Bayes (GNB), Support Vector Machine (SVM), and Random Forest (RF), implemented in Python (scikit-learn library), to explore metabolic features that discriminate adult patients with T1D from healthy controls. All classifiers were trained using default model parameters, with a linear kernel specified for SVM. Given the exploratory nature of the study and the relatively small sample size, no extensive hyperparameter tuning was performed in order to reduce the risk of overfitting. No explicit feature selection was applied prior to model training. Instead, all metabolite features that passed quality control were included in the models. Feature importance was subsequently assessed using model-intrinsic coefficients from the logistic regression model due to its interpretability. To further interpret the contribution of individual metabolites to model predictions, we applied SHAP (SHapley Additive exPlanations), a game theory–based approach implemented in Python, to provide consistent and model-agnostic explanations of feature importance.
Statistical Analysis
R version 4.2.2 (http://www.r-project.org/) and Python 3.8 (https://www.python.org/) were used to perform the statistical analyses. The R package “Comparison Group 4.5.1” was employed to analyze data on clinical characteristics. Prior to analysis, the Shapiro‒Wilk test was performed to assess the normal distribution of continuous variables. Differences in continuous variables between groups were assessed with Student’s t test or ANOVA, whereas categorical data were evaluated with Fisher’s exact test or the chi-square test.
For the analysis of microbiome and metabolome data, specific matching statistical methods and online tools, as described earlier, were utilized. Statistical significance was defined at a P value threshold of less than 0.05.
Machine learning techniques were employed with Python 3, and four algorithms were applied: LR, SVM, GNB and RF. To ensure robustness, the four algorithms employed fivefold cross-validation, randomly dividing the dataset into training and testing sets.
Ethics Approval
In accordance with the principles set forth in the Declaration of Helsinki, this study was approved by the Ethics Committee of The Third Affiliated Hospital of Sun Yat-sen University. To ensure that ethical guidelines were followed, each participant signed a written informed consent form prior to their involvement in the research. This process ensured their voluntary and informed involvement in the study, safeguarding their rights and privacy. Strict adherence to ethical guidelines and obtaining informed consent were paramount to maintaining the integrity and credibility of the study’s findings.
Results
Clinical Characteristics
We recruited 29 patients with T1D and 29 healthy controls, ensuring that they were matched for age and sex. Table 1 summarizes the clinical features of the study participants. There were no significant differences regarding age, sex, BMI, triglyceride (TG) levels, total cholesterol (TC) levels, or low-density lipoprotein cholesterol (LDL-c) levels. However, high-density lipoprotein cholesterol (HDL-c) and hemoglobin A1c (HbA1c) levels differed significantly between the two groups.
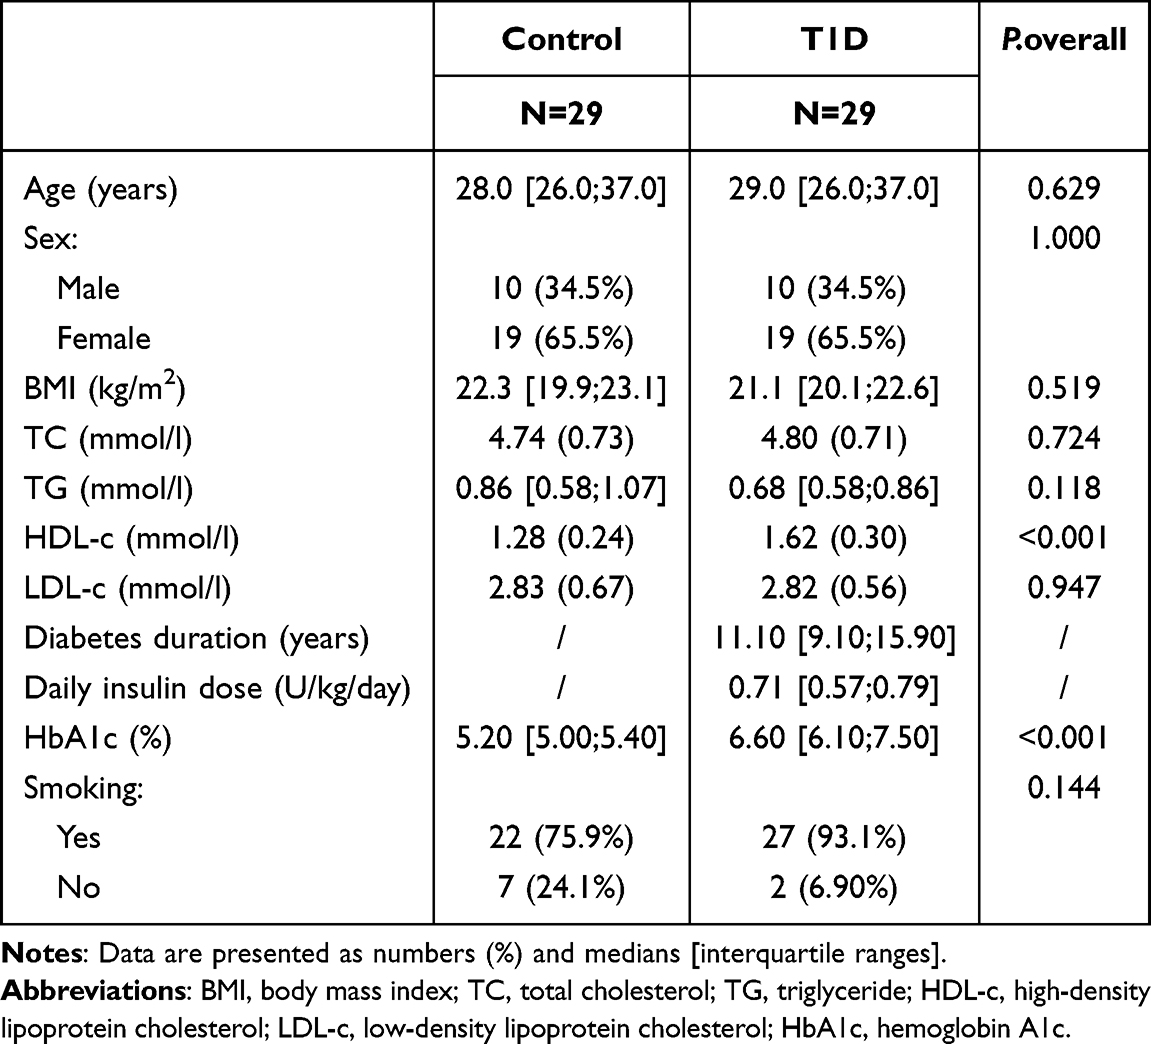 |
Table 1 Clinical Characteristics of the Participants |
Metabolomic Changes Between the T1D Group and the Control Group
The PCA model score plot for samples obtained from the 2 isolates is shown in Figure 1. Compared with the control group, the T1D group displayed a distinct separation in the PCA score plot, indicating overall changes in the serum metabolite composition in patients with T1D (Figure S1a). In addition, a heatmap of the top 25 differentially abundant metabolites further illustrated distinct metabolic patterns between the T1D and control groups (Figure S1b). To better distinguish the two categories, OPLS-DA was employed in the T1D and control groups to identify potential metabolic biomarkers (Figure 1a), suggesting a distinct metabolic difference between the two groups. The bar plot displays the top 10 metabolites ranked by their Variable Importance in Projection (VIP) scores. A-l-fucopyranose, Hept-2-ulose, and L-rhamnose exhibit the highest VIP scores (Figure 1b), indicating their substantial contribution to distinguishing between the T1D and control groups. The volcano plot highlights metabolites with a fold change (FC) > 2 and a p-value < 0.05. Significant metabolites, including A-l-fucopyranose, Hept-2-ulose, and Estradiol valerate, are marked in red, showing that they are upregulated in the T1D group. Conversely, metabolites such as Salbutamol and Clindamycin are downregulated in T1D (Figure 1c).
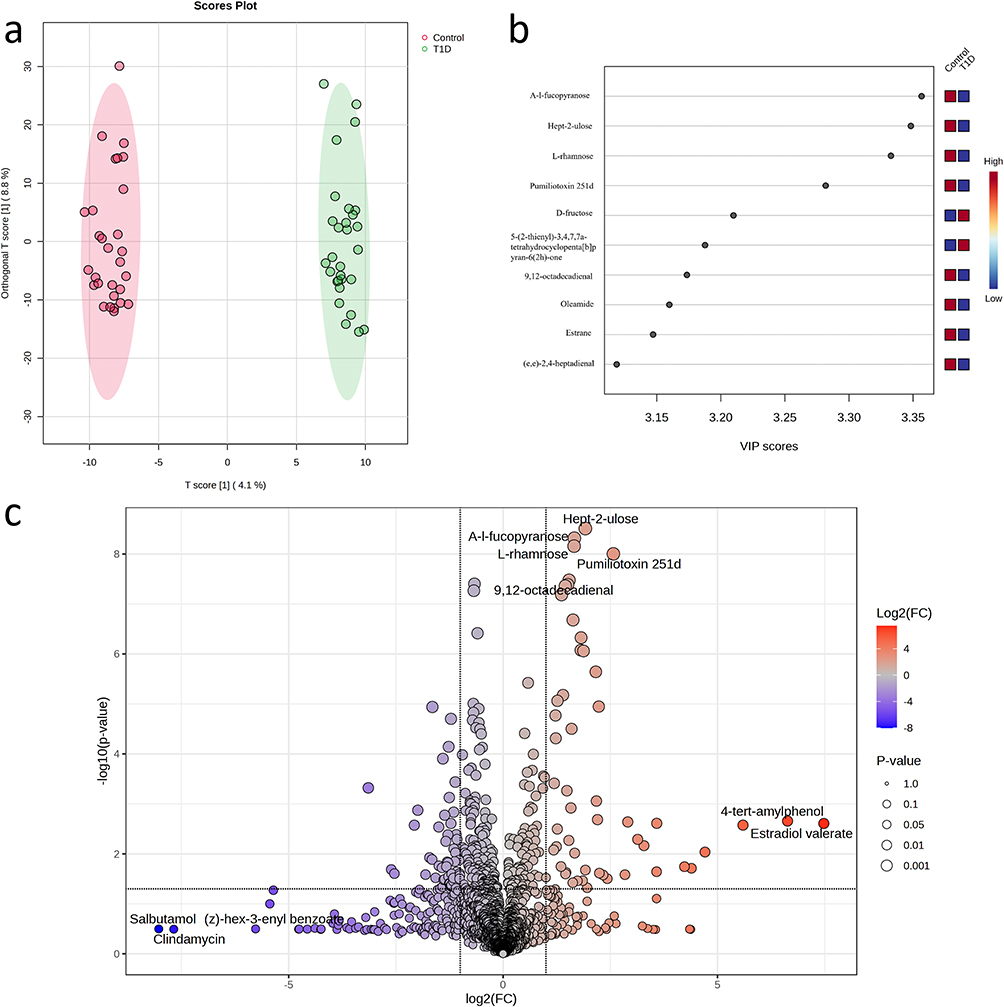 |
Figure 1 Metabolomic changes between the T1D group and the control group. (a) The OPLS-DA score plot further confirms the clear separation of the two groups, indicating significant differences in their metabolic profiles. (b) A bar plot displaying the top 10 metabolites ranked by their Variable Importance in Projection (VIP) scores. (c) Volcano plots demonstrating the differential abundance of metabolites (P value < 0.05) between patients with T1D and controls. |
Metabolic Profiling of T1D and Control Groups Using Machine Learning
The bar plot (Figure 2a) shows the top 10 metabolites significantly upregulated in the T1D group, identified based on feature importance derived from the logistic regression model. Metabolites such as 4-hydroxy-5-methyl-3(2H)-thiophenone, P-cresylsulfate, and D-fructose exhibited the highest importance scores, indicating their significant role in distinguishing T1D from the control group. The top 10 metabolites upregulated in the control group are shown in Figure 2b, with hydroxyethylmethacrylate, 3-indoxyl sulfate, and choline showing the highest importance scores, reflecting their role in differentiating the control group from T1D. Figure 2c presents the top 20 metabolites with significant differences between T1D and control groups, as identified by the SHAP algorithm. In total, 328 metabolites with non-zero mean SHAP values were identified and considered influential in model predictions. These were subsequently used for pathway enrichment analysis. Key metabolites such as Docosahexaenoic acid, Pumiliotoxin 251d, and A-l-fucopyranose demonstrated the highest SHAP values, with red-colored metabolites more associated with T1D and blue-colored metabolites more associated with the control group. Local explanations for three randomly selected subjects are depicted in Figure S1c-e. This analysis highlights the metabolites with strong discriminatory power between the two groups.
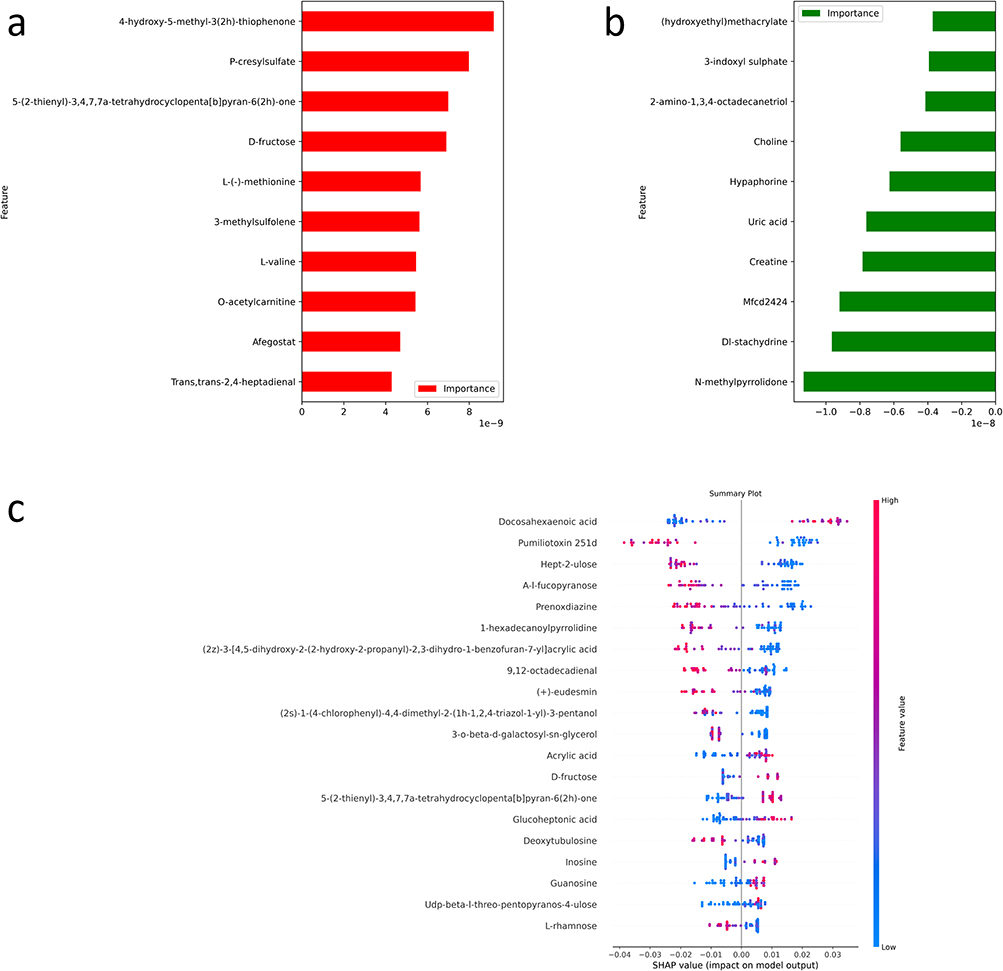 |
Figure 2 Metabolic Profiling of T1D and Control Groups Using Machine Learning and SHAP Analysis. (a) The bar plot shows the top 10 metabolites that are upregulated in the T1D group based on a machine learning model. (b) The bar plot shows the top 10 metabolites that are upregulated in the control group based on a machine learning model. (c) The summary plot represents the top 20 metabolites showing significant differences between T1D and control groups, as identified using the SHAP algorithm. |
Diagnostic Accuracy of the Candidate Biomarkers for T1D
The top 10 metabolites were selected as candidate biomarkers of T1D, illustrating the diagnostic accuracy of the ten candidate biomarkers of T1D, which were selected on the basis of their significant differences between adult patients with T1D and healthy controls. Each subplot in Figure 3 includes a receiver operating characteristic (ROC) curve on the left and a box plot on the right, showing the expression levels of each metabolite in the two groups. The ROC curves indicate a strong discriminatory ability of these metabolites, with area under the curve (AUC) values for all biomarkers ranging from 0.86 to 0.96, suggesting excellent diagnostic potential. Specifically, A-l-fucopyranose, hept-2-ulose, L-rhamnose, docosahexaenoic acid, pumiliotoxin 251d, 9,12-octadecadienal, oleamide, estrane, (e,e)-2,4-heptadienal, and hexadecanamide were expressed at lower levels in patients with T1D, as demonstrated by the lower median levels in the T1D group (green box) compared to the control group (red box). These decreased levels may reflect underlying metabolic disturbances associated with T1D, potentially involving lipid metabolism, carbohydrate processing, and immune modulation pathways, supporting their potential as diagnostic biomarkers of T1D. (Figure 3).
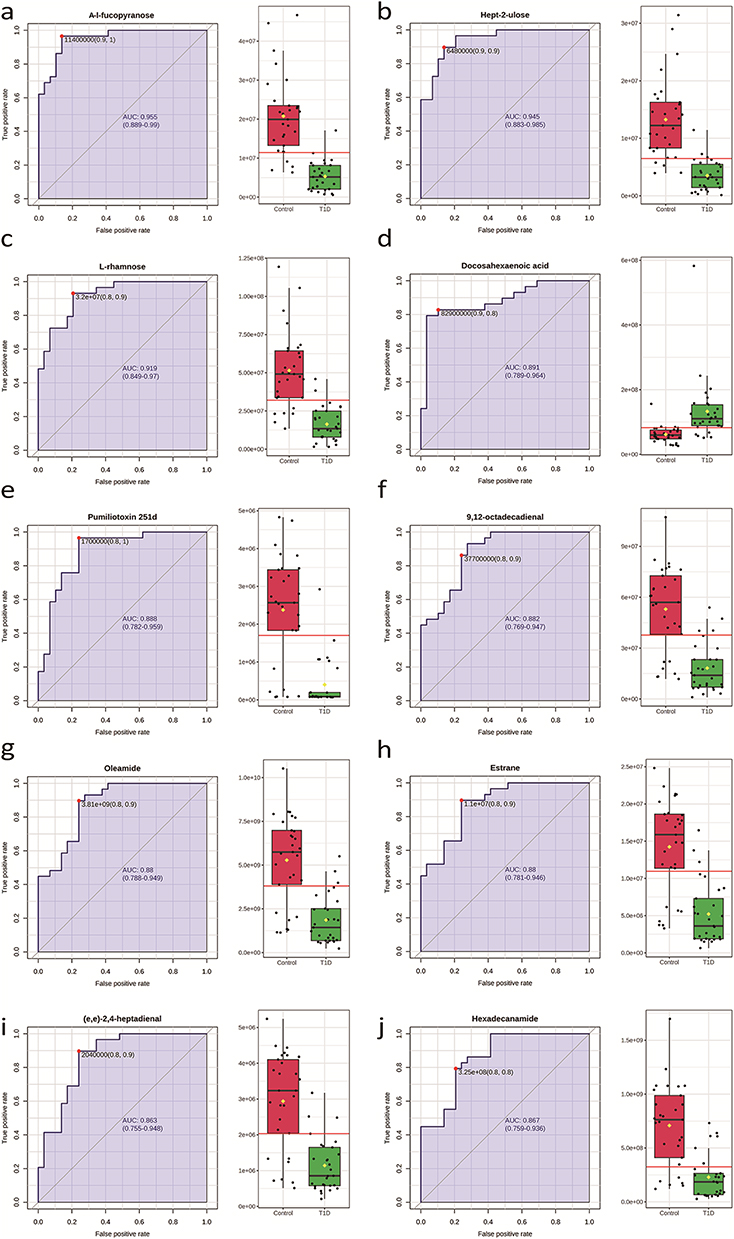 |
Figure 3 ROC curve analysis of the top 10 candidate biomarkers for T1D. Receiver operating characteristic (ROC) curve analysis was performed to evaluate the use of metabolites as biomarkers for T1D. (a). The P value and AUC for A-l-fucopyranose were 4.88E-10 and 0.95, respectively; (b) the P value and AUC for Hept-2-ulose were 3.08E-9 and 0.94, respectively; (c) the P value and AUC for L-rhamnose were 6.94E-9 and 0.92, respectively; (d) the P value and AUC for docosahexaenoic acid were 3.66E-4 and 0.88, respectively; (e) the P value and AUC for pumiliotoxin 251d were 9.92E-9 and 0.88, respectively; (f) the P value and AUC for 9,12-octadecadienal were 3.34E-8 and 0.88, respectively; (g) the P value and AUC for oleamide were 4.10E-8 and 0.88, respectively; (h) the P value and AUC for estrane were 4.37E-8 and 0.88, respectively; (i) the P value and AUC for (e,e)-2,4-heptadienal were 6.52E-8 and 0.86. (j) the P value and AUC for Hexadecanamide were 2.09E-7 and 0.86, respectively. |
Pathway Enrichment Analysis
The SHAP algorithm was used to identify 328 differential metabolites between the two groups. Among these, 146 metabolites were annotated using the KEGG database, and they were found to be enriched in 5 significantly metabolic pathways and 2 significant enriched metabolite sets (P < 0.05). An overview of the top 25 enriched metabolic pathways is provided in Figure S2a. The differentially expressed metabolites were subjected to KEGG pathway analyses to comprehensively investigate functional changes.24 These pathways included (1) fructose and mannose metabolism (Figure 4b); (2) galactose metabolism; (3) amino sugar and nucleotide sugar metabolism; (4) pantothenate and CoA biosynthesis; and (5) purine metabolism (Figure 4a). Detailed metabolite interaction networks for amino sugar and nucleotide sugar metabolism, galactose metabolism, and pantothenate and CoA biosynthesis are shown in Figure S2b–d. Figure 4c illustrates the purine metabolism pathway, highlighting the differentially abundant metabolites (inosine and guanine) with elevated levels in the individuals in the T1D group. The metabolite interaction network (Figure 4d) highlights key metabolites, such as Alpha-D-Glucose, Tryptophan, and Beta-Alanine, which play central roles in metabolic alterations. Peripheral metabolites, like Inosine and Guanosine, show interactions but are less significant in the altered pathways.
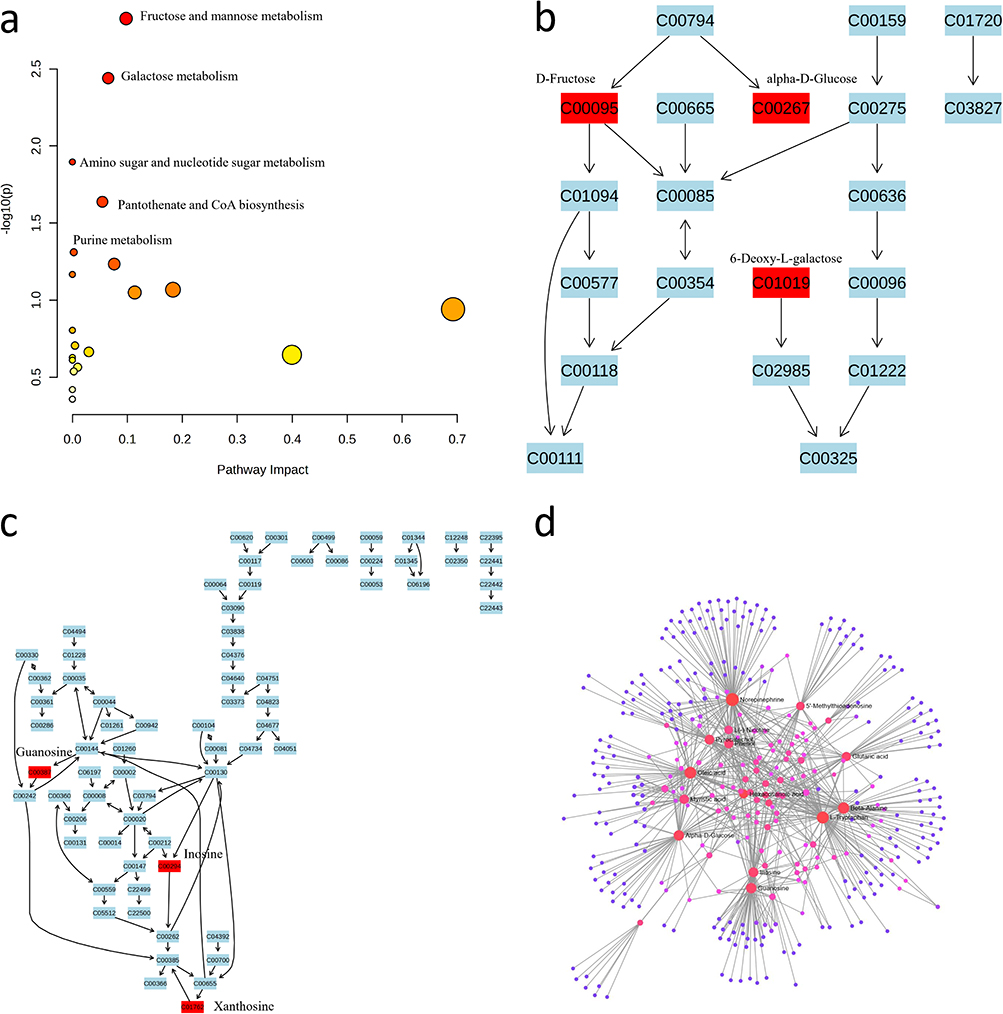 |
Figure 4 Pathway analysis of significantly altered metabolites. (a) The analysis of differentially abundant metabolites revealed significant involvement in various metabolic pathway. (b) Fructose and Mannose Metabolism Network; (c) Purine Metabolism Network; (d) Metabolite Interaction Network: The interaction network connects metabolites across different pathways, with red nodes representing the most significant metabolites involved in the altered pathways. |
Discussion
In this study, we investigated the metabolic profiles of adult patients with T1D and compared them with those of healthy controls, revealing notable differences between the two groups. Additionally, we identified several top differentially abundant metabolites, including A-l-fucopyranose, hept-2-ulose, L-rhamnose, docosahexaenoic acid, pumiliotoxin 251d, 9,12-octadecadienal, oleamide, estrane, (e,e)-2,4-heptadienal, and hexadecanamide. These metabolites play roles in various biochemical processes, and their altered concentrations may reflect changes in metabolic pathways relevant to T1D pathophysiology.
For example, the discovery of docosahexaenoic acid (DHA), an omega-3 fatty acid recognized for its anti-inflammatory properties,25 may suggest disturbances in lipid metabolism and inflammation in patients with T1D, which is consistent with previous studies that highlighted the importance of lipid dysregulation in diabetes. DHA (22:6n–3) is a long-chain PUFA (LCPUFA).26 Through a sequence of desaturation and elongation steps, α-linolenic acid [ALA (18:3n–3)], its essential precursor, can be partially metabolized.27 While ALA can undergo metabolic transformation into EPA (20:5n-3) and subsequently into DHA, the conversion efficiency in humans is believed to be relatively low.28 In a previous study, it was discovered that fatty acid status during infancy was correlated with type 1 diabetes-associated autoimmunity. In particular, fish-derived fatty acids such as DHA were found to have a protective effect.29 The consumption of long-chain omega-3 polyunsaturated fatty acids and branched-chain amino acids has been linked to the prospective maintenance of β-cell function in earlier SEARCH cohort studies.30 These findings indicate that dietary components may offer beneficial effects in supporting long-term β-cell health. According to a study by Davanso MR et al, treatment with DHA successfully reversed the inflammatory conditions observed in macrophages from type 1 diabetes model mice. These findings suggest that DHA may be biologically relevant to inflammatory and lipid metabolic processes associated with T1D; however, its clinical implications require further investigation.31 Nonetheless, we discovered that DHA levels were elevated in the T1D group, indicating that more research is needed. In addition to DHA, another metabolite, estradiol, was also found to prevent β-cell apoptosis in vivo and protect mice from insulin deficiency due to diabetes.32 Consistent with previous studies, estrane was also decreased in the T1D group.33
Moreover, changes in the levels of sugars such as L-rhamnose may indicate altered carbohydrate metabolism, potentially linked to the impaired glucose handling observed in T1D.34,35 A-l-fucopyranose is a monosaccharide that serves a critical function in immune modulation and anti-inflammation.36 For T1D, the potential of A-l-fucopyranose to exert immune modulation and anti-inflammatory effects may be involved in immune-related and inflammatory pathways relevant to T1D pathophysiology and lowering immune-mediated inflammation levels. Hexadecanamide is a fatty acid amide with antiallergic, antioxidant and neuroprotective properties.37 Since T1D involves immune attack and chronic inflammation, hexadecanamide may be associated with inflammatory and neurological processes observed in T1D.
Additionally, the differentially abundant serum metabolites identified in this research were found to be associated primarily with the purine metabolism pathway. Interestingly, previous studies have explored the connection between purine metabolism and diabetes, including T1D, T2D, and gestational diabetes mellitus. This observation suggests the possible importance of purine metabolism in various types of diabetes and warrants further investigation into its underlying mechanisms and clinical implications.38–40 The study revealed that serum inosine levels were higher in the control group than in the T1D group, the observed differences in inosine levels suggest a potential association between purine metabolism and T1D-related immune or metabolic regulation. Considering these findings, further investigations into the possible therapeutic relevance of inosine for managing and preventing T1D in humans are warranted.41–43 Indeed, inosine has been shown to have a neuroprotective effect by preventing glial cell death during glucose deprivation.44 Therefore, it may support future screening and risk assessment strategies for individuals at high risk of T1D. These metabolic pathway markers may be useful in the development of early interventions to prevent and delay disease progression.
The purpose of this study was to explore the metabolomic profiles and biomarkers of individuals with T1D via machine learning. However, the limitations of our study should be acknowledged. First, it is essential to note that the sample size in this study was comparatively limited. This limitation may reduce the robustness of machine learning model performance and increase the risk of overfitting; therefore, the results should be interpreted as exploratory rather than definitive. While certain metabolic disorders were identified in patients with T1D, further studies with larger sample sizes are necessary to validate and better understand this potential pathogenic mechanism. Additionally, it is crucial to consider that the metabolic variability among individual study subjects was not adequately controlled. Another limitation is that we lacked detailed information on participants’ use of lipid-lowering therapies (eg, statins), which may influence lipid-related metabolites such as HDL and total cholesterol. This limitation could partially affect the interpretation of lipid profile differences between T1D patients and controls. In addition, although basic clinical characteristics were recorded, several clinically relevant covariates that may influence metabolomic profiles, such as glucose control variability and comorbid conditions, were not comprehensively available and could not be systematically adjusted for in the analysis.
Future studies should incorporate comprehensive medication histories to improve the accuracy of metabolite-based biomarker discovery. One limitation of our study is the absence of a T2D comparison group, which limits our ability to distinguish metabolic alterations driven by autoimmunity from those caused by hyperglycemia or insulin resistance. Previous studies have shown that T2D patients exhibit reduced levels of DHA and other n‑3 polyunsaturated fatty acids, which are associated with inflammation and insulin resistance.45 In contrast, our T1D cohort showed preserved or slightly elevated DHA levels, suggesting a distinct metabolic response potentially linked to autoimmune pathways. Moreover, elevated plasma fucosylation (eg, N-glycan branching) are commonly observed in T2D,46 but were not prominent in our T1D samples. These findings collectively support the notion that part of the observed metabolic profile in T1D may reflect immune-mediated processes rather than general metabolic dysregulation. Future studies incorporating T2D controls are warranted to confirm specificity. Various factors, such as environmental conditions, lifestyle choices, and diet, can significantly impact the body’s metabolic activity. Future studies should aim to control for these factors to obtain more reliable and comprehensive findings. Considering these factors will strengthen the validity and generalizability of the study’s results.
Conclusions
In summary, on the basis of an AUC greater than 0.85, A-l-fucopyranose, hept-2-ulose, L-rhamnose, docosahexaenoic acid, pumiliotoxin 251d, 9,12-octadecadienal, oleamide, estrane, (e,e)-2,4-heptadienal, and hexadecanamide were identified as being associated with adult T1D. These metabolites represent candidate features associated with adult-onset T1D; validation in larger independent cohorts is required before their potential clinical relevance can be determined.
Abbreviations
T1D, Type 1 Diabetes; T2D, Type 2 Diabetes; DKA, Diabetic Ketoacidosis; C-peptide, Connecting Peptide (part of proinsulin); HbA1c, Hemoglobin A1c; PCA, Principal Component Analysis; OPLS-DA, Orthogonal Partial Least Squares Discriminant Analysis; VIP, Variable Importance in Projection; SHAP, SHapley Additive exPlanations; AUC, Area Under the Curve; LC-MS, Liquid Chromatography-Mass Spectrometry; QC, Quality Control; IS1, Internal Standard 1; IS2, Internal Standard 2; BMI, Body Mass Index; TG, Triglyceride; TC, Total Cholesterol; LDL-c, Low-Density Lipoprotein Cholesterol; HDL-c, High-Density Lipoprotein Cholesterol; RF, Random Forest; GNB, Gaussian Naive Bayes; SVM, Support Vector Machine; LR, Logistic Regression; FDA, Food and Drug Administration; DHA, Docosahexaenoic Acid; LCPUFA, Long-Chain Polyunsaturated Fatty Acids; ALA, Alpha-Linolenic Acid; EPA, Eicosapentaenoic Acid; PUFA, Polyunsaturated Fatty Acids.
Data Sharing Statement
The dataset supporting the conclusions of this article is available in the SRA database, [PRJNA766410 and https://www.ncbi.nlm.nih.gov/sra/SRX12360921[accn].
Ethics Approval and Consent to Participate
Each participant understood the process of the study and signed a written informed consent before the start of the study. All study protocols of the current study were approved by the ethics committee of the Third Affiliated Hospital of Sun Yat-sen University. All methods were performed in accordance with the Declaration of Helsinki.
Acknowledgments
We thank all the participants for donating the data.
Author Contributions
CW and YL: Conceptualization, Methodology, Formal analysis, Writing – original draft. MZ: Formal analysis, Data curation, Writing – original draft. JZ: Formal analysis, Data curation, Visualization, Writing – original draft. HT: Conceptualization, Methodology, Supervision, Writing – review and editing. XL: Writing – review and editing, Validation. YD and XZ: Writing – review and editing, Visualization. SL and ZG: Conceptualization, Methodology, Formal analysis, Writing – review and editing, Supervision, Project administration. All authors made a significant contribution to the work reported; gave final approval of the version to be published; have agreed on the journal to which the article has been submitted; and agree to be accountable for all aspects of the work.
Funding
This study received support from grants from the National Natural Science Foundation of China (Grant No. 82470870), the National Natural Science Foundation of China (Grant No. 82300904) and the Science and Technology Projects in Guangzhou (Grant No. 2023A04J1087). The authors would like to express their gratitude to all the patients and volunteers.
Disclosure
The authors declare no competing interests.
References
1. Bluestone JA, Buckner JH, Herold KC. Immunotherapy: building a bridge to a cure for type 1 diabetes. Science. 2021;373(6554):510–13. doi:10.1126/science.abh1654
2. Chiang JL, Kirkman MS, Laffel LM, Peters AL. Type 1 diabetes through the life span: a position statement of the American Diabetes Association. Diabetes Care. 2014;37(7):2034–2054. doi:10.2337/dc14-1140
3. Leslie RD, Evans-Molina C, Freund-Brown J, et al. Adult-onset type 1 diabetes: current understanding and challenges. Diabetes Care. 2021;44(11):2449–2456. doi:10.2337/dc21-0770
4. de Lusignan S, Sadek N, Mulnier H, Tahir A, Russell-Jones D, Khunti K. Miscoding, misclassification and misdiagnosis of diabetes in primary care. Diabetic Med. 2012;29(2):181–189. doi:10.1111/j.1464-5491.2011.03419.x
5. Leete P, Mallone R, Richardson SJ, Sosenko JM, Redondo MJ, Evans-Molina C. The effect of age on the progression and severity of type 1 diabetes: potential effects on disease mechanisms. Curr Diab Rep. 2018;18(11):115. doi:10.1007/s11892-018-1083-4
6. VanBuecken DE, Greenbaum CJ. Residual C-peptide in type 1 diabetes: what do we really know? Pediatric Diabetes. 2014;15(2):84–90. doi:10.1111/pedi.12135
7. Thomas NJ, Lynam AL, Hill AV, et al. Type 1 diabetes defined by severe insulin deficiency occurs after 30 years of age and is commonly treated as type 2 diabetes. Diabetologia. 2019;62(7):1167–1172. doi:10.1007/s00125-019-4863-8
8. Katsarou A, Gudbjörnsdottir S, Rawshani A, et al. Type 1 diabetes mellitus. Nat Rev Dis Primer. 2017;3(1):1–17. doi:10.1038/nrdp.2017.16
9. Akil AA, Yassin E, Al-Maraghi A, Aliyev E, Al-Malki K, Fakhro KA. Diagnosis and treatment of type 1 diabetes at the Dawn of the personalized medicine era. J Transl Med. 2021;19(1):137. doi:10.1186/s12967-021-02778-6
10. Atkinson MA, Eisenbarth GS, Michels AW. Type 1 diabetes. Lancet. 2014;383(9911):69–82. doi:10.1016/S0140-6736(13)60591-7
11. Thomas NJ, Jones SE, Weedon MN, et al. Frequency and phenotype of type 1 diabetes in the first six decades of life: a cross-sectional, genetically stratified survival analysis from UK Biobank. Lancet Diabetes Endocrinol. 2018;6(2):122–129. doi:10.1016/S2213-8587(17)30362-5
12. Tuerxunyiming M, Zhao Q, Hu Q, Zhu P, Zhu S. LC-MS-based conventional metabolomics combined with machine learning models to identify metabolic markers for the diagnosis of type I diabetes. Front Endocrinol. 2025;16:1588718. doi:10.3389/fendo.2025.1588718
13. Ma L, Liu J, Deng M, Zhou L, Zhang Q, Xiao X. Metabolomics analysis of serum and urine in type 1 diabetes patients with different time in range derived from continuous glucose monitoring. Diabetol Metab Syndr. 2024;16(1):21. doi:10.1186/s13098-024-01257-4
14. Chai J, Sun Z, Xu J. A contemporary insight of metabolomics approach for type 1 diabetes: potential for novel diagnostic targets. Diab Metabol Syndr Obesity. 2022;1605–1625. doi:10.2147/DMSO.S357007
15. Sosenko JM, Palmer JP, Greenbaum CJ, et al. Patterns of metabolic progression to type 1 diabetes in the diabetes prevention trial–type 1. Diabetes Care. 2006;29(3):643–649. doi:10.2337/diacare.29.03.06.dc05-1006
16. Luo Y, Zhang W, Qin G. Metabolomics in diabetic nephropathy: unveiling novel biomarkers for diagnosis. Mol Med Rep. 2024;30(3):1–13. doi:10.3892/mmr.2024.13280
17. Tan H, Shi Y, Yue T, et al. Machine learning approach reveals microbiome, metabolome, and lipidome profiles in type 1 diabetes. J Adv Res. 2024;64:213–221. doi:10.1016/j.jare.2023.11.025
18. Weng J, Zhou Z, Guo L, et al. Incidence of type 1 diabetes in China, 2010-13: population based study. BMJ. 2018;360:j5295. doi:10.1136/bmj.j5295
19. Sarafian MH, Gaudin M, Lewis MR, et al. Objective set of criteria for optimization of sample preparation procedures for ultra-high throughput untargeted blood plasma lipid profiling by ultra performance liquid chromatography-mass spectrometry. Anal Chem. 2014;86(12):5766–5774. doi:10.1021/ac500317c
20. Dunn WB, Broadhurst D, Begley P, et al. Procedures for large-scale metabolic profiling of serum and plasma using gas chromatography and liquid chromatography coupled to mass spectrometry. Nature Protocols. 2011;6(7):1060–1083. doi:10.1038/nprot.2011.335
21. Wen B, Mei Z, Zeng C, Liu S. metaX: a flexible and comprehensive software for processing metabolomics data. BMC Bioinf. 2017;18(1):183. doi:10.1186/s12859-017-1579-y
22. Di Guida R, Engel J, Allwood JW, et al. Non-targeted UHPLC-MS metabolomic data processing methods: a comparative investigation of normalisation, missing value imputation, transformation and scaling. Metabolomics. 2016;12:93. doi:10.1007/s11306-016-1030-9
23. Pang Z, Chong J, Zhou G, et al. MetaboAnalyst 5.0: narrowing the gap between raw spectra and functional insights. Nucleic Acids Res. 2021;49(W1):W388–W396. doi:10.1093/nar/gkab382
24. Kanehisa M, Furumichi M, Tanabe M, Sato Y, Morishima K. KEGG: new perspectives on genomes, pathways, diseases and drugs. Nucleic Acids Res. 2017;45(D1):D353–d361. doi:10.1093/nar/gkw1092
25. Calder PC. Omega-3 fatty acids and inflammatory processes. Nutrients. 2010;2(3):355–374. doi:10.3390/nu2030355
26. Flock MR, Harris WS, Kris-Etherton PM. Long-chain omega-3 fatty acids: time to establish a dietary reference intake. Nutr Rev. 2013;71(10):692–707. doi:10.1111/nure.12071
27. Weiser MJ, Butt CM, Mohajeri MH. Docosahexaenoic acid and cognition throughout the lifespan. Nutrients. 2016;8(2):99. doi:10.3390/nu8020099
28. Burdge GC, Calder PC. Conversion of alpha-linolenic acid to longer-chain polyunsaturated fatty acids in human adults. Reproduct Nutri Develop. 2005;45(5):581–597. doi:10.1051/rnd:2005047
29. Niinistö S, Takkinen HM, Erlund I, et al. Fatty acid status in infancy is associated with the risk of type 1 diabetes-associated autoimmunity. Diabetologia. 2017;60(7):1223–1233. doi:10.1007/s00125-017-4280-9
30. Mayer-Davis EJ, Dabelea D, Crandell JL, et al. Nutritional factors and preservation of C-peptide in youth with recently diagnosed type 1 diabetes: SEARCH Nutrition Ancillary Study. Diabetes Care. 2013;36(7):1842–1850. doi:10.2337/dc12-2084
31. Davanso MR, Crisma AR, Braga TT, et al. Macrophage inflammatory state in Type 1 diabetes: triggered by NLRP3/iNOS pathway and attenuated by docosahexaenoic acid. Clin Sci. 2021;135(1):19–34. doi:10.1042/cs20201348
32. Le May C, Chu K, Hu M, et al. Estrogens protect pancreatic beta-cells from apoptosis and prevent insulin-deficient diabetes mellitus in mice. Proc Natl Acad Sci USA. 2006;103(24):9232–9237. doi:10.1073/pnas.0602956103
33. Toor S, Yardley JE, Momeni Z. Type 1 diabetes and the menstrual cycle: where/how does exercise fit in? Int J Environ Res Public Health. 2023;20(4):2772.
34. Mooradian AD, Morley JE, Levine AS, Prigge WF, Gebhard RL. Abnormal intestinal permeability to sugars in diabetes mellitus. Diabetologia. 1986;29(4):221–224. doi:10.1007/bf00454879
35. Darzi J, Frost GS, Swann JR, Costabile A, Robertson MD. L-rhamnose as a source of colonic propionate inhibits insulin secretion but does not influence measures of appetite or food intake. Appetite. 2016;98:142–149. doi:10.1016/j.appet.2015.12.011
36. Zhang X, Wei Z, Xue C. Physicochemical properties of fucoidan and its applications as building blocks of nutraceutical delivery systems. Crit Rev Food Sci Nutr. 2022;62(32):8935–8953. doi:10.1080/10408398.2021.1937042
37. Bao L, Sun H, Zhao Y, et al. Hexadecanamide alleviates staphylococcus aureus-induced mastitis in mice by inhibiting inflammatory responses and restoring blood-milk barrier integrity. PLoS Pathogens. 2023;19(11):e1011764. doi:10.1371/journal.ppat.1011764
38. Papandreou C, Li J, Liang L, et al. Metabolites related to purine catabolism and risk of type 2 diabetes incidence; modifying effects of the TCF7L2-rs7903146 polymorphism. Sci Rep. 2019;9(1):2892. doi:10.1038/s41598-019-39441-6
39. Murfitt SA, Zaccone P, Wang X, et al. Metabolomics and lipidomics study of mouse models of type 1 diabetes highlights divergent metabolism in purine and tryptophan metabolism prior to disease onset. J Proteome Res. 2018;17(3):946–960. doi:10.1021/acs.jproteome.7b00489
40. Law KP, Han TL, Mao X, Zhang H. Tryptophan and purine metabolites are consistently upregulated in the urinary metabolome of patients diagnosed with gestational diabetes mellitus throughout pregnancy: a longitudinal metabolomics study of Chinese pregnant women part 2. Clin Chim Acta. 2017;468:126–139. doi:10.1016/j.cca.2017.02.018
41. Marton A, Pacher P, Murthy KG, Németh ZH, Haskó G, Szabó C. Anti-inflammatory effects of inosine in human monocytes, neutrophils and epithelial cells in vitro. IntJ Mol Med. 2001;8(6):617–621.
42. Haskó G, Kuhel DG, Németh ZH, et al. Inosine inhibits inflammatory cytokine production by a posttranscriptional mechanism and protects against endotoxin-induced shock. J Iimmunol. 2000;164(2):1013–1019. doi:10.4049/jimmunol.164.2.1013
43. Mabley JG, Pacher P, Liaudet L, et al. Inosine reduces inflammation and improves survival in a murine model of colitis. Am J Physiol Gastrointestinal Liver Physiol. 2003;284(1):G138–44. doi:10.1152/ajpgi.00060.2002
44. Jurkowitz MS, Litsky ML, Browning MJ, Hohl CM. Adenosine, inosine, and guanosine protect glial cells during glucose deprivation and mitochondrial inhibition: correlation between protection and ATP preservation. J Neurochem. 1998;71(2):535–548. doi:10.1046/j.1471-4159.1998.71020535.x
45. Azizi-Soleiman F, Jazayeri S, Eghtesadi S, et al. Effects of pure eicosapentaenoic and docosahexaenoic acids on oxidative stress, inflammation and body fat mass in patients with type 2 diabetes. Int J Prev Med. 2013;4(8):922–928.
46. Ana C, Massimo M, Marko T, et al. Plasma N-glycome shows continuous deterioration as the diagnosis of insulin resistance approaches. BMJ Open Diabetes Res Care. 2021;9(1):e002263. doi:10.1136/bmjdrc-2021-002263
 © 2026 The Author(s). This work is published and licensed by Dove Medical Press Limited. The
full terms of this license are available at https://www.dovepress.com/terms
and incorporate the Creative Commons Attribution
- Non Commercial (unported, 4.0) License.
By accessing the work you hereby accept the Terms. Non-commercial uses of the work are permitted
without any further permission from Dove Medical Press Limited, provided the work is properly
attributed. For permission for commercial use of this work, please see paragraphs 4.2 and 5 of our Terms.
© 2026 The Author(s). This work is published and licensed by Dove Medical Press Limited. The
full terms of this license are available at https://www.dovepress.com/terms
and incorporate the Creative Commons Attribution
- Non Commercial (unported, 4.0) License.
By accessing the work you hereby accept the Terms. Non-commercial uses of the work are permitted
without any further permission from Dove Medical Press Limited, provided the work is properly
attributed. For permission for commercial use of this work, please see paragraphs 4.2 and 5 of our Terms.