Back to Journals » Journal of Inflammation Research » Volume 19
Lymphatic Vessels are Involved in Monosodium Urate Clearance and Resolution of Gouty Inflammation in Mice
Authors Chen S ![]() , Zhao X, Wu C, Wang CY, Yuan L, Xing L, Xu H, Liu S, Wu J, Dai J, Zhou P, Liang Q, Li N, Ruan M, Wang X
, Zhao X, Wu C, Wang CY, Yuan L, Xing L, Xu H, Liu S, Wu J, Dai J, Zhou P, Liang Q, Li N, Ruan M, Wang X
Received 30 September 2025
Accepted for publication 18 December 2025
Published 10 January 2026 Volume 2026:19 566380
DOI https://doi.org/10.2147/JIR.S566380
Checked for plagiarism Yes
Review by Single anonymous peer review
Peer reviewer comments 2
Editor who approved publication: Dr Ujjwol Risal
Shaohua Chen,1– 4,* Xiao Zhao,4,* Changgui Wu,5 Chin-Yun Wang,1– 3 Luying Yuan,1– 3 Lianping Xing,6 Hao Xu,1– 3 Shunchao Liu,4 Jinxia Wu,4 Jun Dai,4 Peijuan Zhou,7 Qianqian Liang,1– 3 Ning Li,1– 3 Ming Ruan,1– 3 Xiaoyun Wang1– 3,8
1Longhua Hospital, Shanghai University of Traditional Chinese Medicine, Shanghai, People’s Republic of China; 2Spine Institute, Shanghai University of Traditional Chinese Medicine, Shanghai, People’s Republic of China; 3Key Laboratory of Theory and Therapy of Muscles and Bones, Ministry of Education (Shanghai University of Traditional Chinese Medicine), Shanghai, People’s Republic of China; 4Department of Education and Research, Shanghai Changning Tianshan Traditional Chinese Medicine Hospital, Shanghai, People’s Republic of China; 5Ruijin Hospital, Shanghai Jiao Tong University School of Medicine, Shanghai, People’s Republic of China; 6Department of Pathology and Laboratory Medicine, University of Rochester Medical Center, Rochester, NY, USA; 7Renji Hospital, Shanghai Jiao Tong University, Shanghai, People’s Republic of China; 8Shanghai Research Institute of Acupuncture and Meridian, Shanghai University of Traditional Chinese Medicine, Shanghai, People’s Republic of China
*These authors contributed equally to this work
Correspondence: Xiaoyun Wang, Shanghai Research Institute of Acupuncture and Meridian, Shanghai University of Traditional Chinese Medicine, 650 Wan-Ping South Road, Shanghai, 200032, People’s Republic of China, Email [email protected] Ming Ruan, Spine Institute, Shanghai University of Traditional Chinese Medicine, 725 Wan-Ping South Road, Shanghai, 200032, People’s Republic of China, Email [email protected]
Objective: To investigate the potential role of lymphatic system in gouty arthritis (GA) by integrating clinical observations in human draining lymph nodes with functional studies in a mouse model.
Methods: We first conducted ultrasound examinations of draining lymph nodes in 30 GA patients and 30 healthy controls. Subsequently, we established mouse models of acute and chronic GA via monosodium urate (MSU) crystal injection. Lymphatic nodes were assessed using ultrasound, the structure and function of lymphatic vessels were assessed using histology and near-infrared imaging. We further employed a VEGFR-3 inhibitor to disrupt lymphatic function and evaluated its impact on inflammatory resolution in MSU-induced GA mouse model.
Results: Patients with GA showed significantly larger draining lymph nodes compared with healthy controls, a finding also observed in MSU-induced GA mouse model. The concentration of uric acid in the draining lymph nodes after MSU injection was significantly elevated and exceeded that in the serum. The structure of lymphatic vessels in paw tissues was impaired, and the draining function was reduced during the inflammatory process induced by MSU injection at 1 and 4 weeks. Lymphatic vessel leakage was observed after 4 weeks of MSU treatment. Critically, pharmacological inhibition of VEGFR-3, which disrupted lymphatic integrity, subsequently delayed the resolution of MSU-induced inflammation.
Conclusion: Our findings in humans demonstrate a clinical association between GA and lymphatic system engagement. Mouse studies highlight a dual and critical role of the lymphatic system in GA pathogenesis: it is involved in clearance but vulnerable to damage, which may perpetuate inflammation.
Keywords: gouty arthritis, monosodium urate, lymphatic vessels, vascular endothelial growth factor receptor-3, inflammation
Introduction
Gouty arthritis (GA) is a common inflammatory disease that usually occurs in the first metatarsophalangeal joint and is an important clinical manifestation of gout. The global prevalence of GA is 0.1%–6.8%, with an incidence of 0.58–2.89/1000 person-years.1 If not treated properly, deposited urate crystals cause irreversible tissue damage and bone erosion, resulting in joint rigidity and deformity, which brings great pain to patients and seriously affects their quality of life.2 Current clinical practice guidelines recommend the use of nonsteroidal anti-inflammatory drugs (NSAIDs) like Ibuprofen, naproxen, and celecoxib, colchicine, or glucocorticoids for acute attacks of GA.3,4 Uric acid–lowering drugs are used to control blood levels of uric acid, and they can reduce the frequency of GA episodes.5
Acute inflammation near the joints of patients with GA is initiated by the deposition of urate crystals, which activate NLRP3 (NACHT, LRR, and PYD domains–containing protein 3) inflammasomes and caspase-1 in macrophages, leading to the release of active Interleukin-1β (IL-1β).6 IL-1β further recruits neutrophils to the tissue and promotes the release of inflammatory mediators, thereby exacerbating the inflammatory response of GA.7 It’s worth noting that the acute inflammation of GA is self-limited and usually disappears after 7–10 days even without treatment.8 Currently, the following mechanisms related to the inflammation regression in GA are recognized: 1) Apolipoprotein (apo) B and apo E inhibit crystal-induced neutrophil stimulation by binding to the surface of the crystals.9 2) High-density lipoprotein (HDL) may attenuate inflammation by adhesion to the crystals and/or by acting directly on the cells through blockade of the putative crystal receptors/sensors or diminution of the threshold of cell response to the crystals.10 3) Neutrophil extracellular traps (NETs) can degrade cytokines to promote the regression of inflammation.11 However, the clearance route of deposited urate crystals during the inflammatory process, which represent the core pathological factor in GA, remains unclear. Clarifying this clearance mechanism is of crucial importance for fully revealing the physiological basis of GA’s self-limiting regression and for developing novel therapeutic strategies.
Lymphatic system (LS) consists of lymphatic vessels (LVs), lymphatic organs (such as lymph nodes), and lymphatic tissues, and it is involved in physiological processes such as the maintenance of fluid balance and immunosurveillance.12 Lymphatic endothelial cells (LECs) are the main structures that constitute the wall of LVs.13 In peripheral tissues, the main type of LVs are capillary LVs.14 These specialized structures form primary valves (button-like junctions) that open when interstitial hydrostatic pressure exceeds intraluminal pressure, allowing unidirectional entry of interstitial fluid, macromolecules, and nanoparticles in the tens-to-hundreds of nanometers range. Such size scales overlap with the smaller cross-sectional dimensions of monosodium urate (MSU) crystals and with particulate cargo that can be transported by phagocytes toward draining lymph nodes.15–17 Capillary lymphatics converge to form collecting lymphatic vessels, which transport interstitial fluid to lymph nodes via the contraction of lymphatic smooth muscle cells.18 Lymphatics can return and clear a wide range of pathological materials from tissues, including inflammatory cells and catabolic factors in the synovium of mice with inflammatory arthritis,19 viruses,20 and erythrocytes.21 In contrast to renal clearance, which removes soluble uric acid from systemic circulation,22 lymphatic drainage may represent a distinct clearance pathway for the local clearance of deposited MSU crystals from affected joint. Therefore, this study aims to address the unmet question of whether lymphatic vessels correlate with gouty arthritis through modulating the clearance of urate crystals and the resolution of inflammation in a murine model.
Methods
Ethics Approval and Informed Consent
Human Study
This study followed the principles outlined in the Declaration of Helsinki (2013 revision). It was conducted with the approval of the Ethics Committee of Longhua Hospital Affiliated to Shanghai University of Traditional Chinese Medicine and Shanghai Changning Tianshan Traditional Chinese Medicine Hospital (2020LCSY025), and written informed consent was obtained from all participants. During the period from June 2020 to December 2022, the unilateral inguinal lymph nodes and first metatarsophalangeal joints of patients with GA flare (30 patients) and normal volunteers without arthritis or other inflammation (30 persons) were examined by ultrasound (Philips Affiniti50; Esaote Mylab Class C; Hitachi Arietta 70). All examinations and data acquisition were performed by a single, senior sonographer. The maximal cross-sectional area of the inguinal lymph nodes was determined with an ultrasonic machine. The examined side was the affected side in GA patients and a corresponding side in healthy volunteers.
To examine both the inguinal lymph nodes and first metatarsophalangeal joints, Philips Affiniti-50 color ultrasound system (L12-5 probe), Esaote MyLab Class C color ultrasound system (LA523 probe), and Hitachi Arietta 70 color ultrasound system (L64 probe) were operated at a detection frequency of 12 MHz.
Animals
Six- to eight-week-old specific pathogen-free (SPF) C57BL/6J male mice were purchased from Shanghai JieSiJie Laboratory Animal Co., Ltd. and housed at Shanghai Model Biological Co., Ltd., with a 12-h light/dark cycle and free access to adequate food and water. The mice were acclimatized for 2 weeks before the experiment, and 8–10-week-old mice were used for the study. After acclimatization, all the mice were numbered and randomly divided into groups using a random number table.
All animal experiments were approved by the Institutional Animal Care and Use Committee of Shanghai University of Traditional Chinese Medicine (approval number: PZSHUTCM201211002), which complies with the National Research Council’s Guide for the Care and Use of Laboratory Animals. All animal experiments were performed in compliance with the ARRIVE guidelines. For all procedures, the mice were anesthetized using isoflurane (RWD, Catalog No.: R510-22-4) delivered via a multichannel small-animal anesthesia machine (Matrx, Model: VMR). For induction, an 800-mL chamber was pre-charged with 5% isoflurane at 4 L/minute for 30s. Up to five mice were placed simultaneously to minimize batch differences in anesthetic depth. After confirming adequate anesthesia, the flow rate was reduced to 2 L/minute. For surgical procedures, individual mice were transferred to a nose cone for maintenance at 0.5–1.0 L/minute. For euthanasia, cervical dislocation was performed under isoflurane anesthesia; before tissue collection, death was confirmed by the absence of heartbeat and respiration and loss of reflexes. All anesthesia and euthanasia procedures were conducted in accordance with the AVMA Guidelines for the Euthanasia of Animals.
Establishment of Acute and Chronic GA Models
1.2 mL of phosphate-buffered saline (PBS) was pipetted into a 1.5-mL sterile EP tube. Then, 60 mg of MSU crystals was weighed using an electronic balance and dissolved in PBS. After vortexing, the mixture was homogenized into a uniform MSU suspension using an ultrasonic cell disruptor (25% intensity, 5s ON, 10s OFF) for 1 min. As described previously,23,24 20 μL of the 5% MSU crystal suspension (Cat. No. 1198–77-2, Sigma) was injected periarticularly around deep small joints in mouse hind paws using a 50-μL Hamilton microsyringe to establish a GA model. The acute GA model was injected every 2 days for 1 week (Control group and GA 1-week group, n = 10 per group), whereas the chronic GA model was induced by continuous injection for 1 month (Control group and GA 1-month group, n = 8 per group). The thickness of the most swollen part of the mouse hind paw was measured using high-precision electronic vernier calipers (MNT150, MNT Shanghai), and the mean value was calculated. Swelling degree was determined as the (measured value − baseline value)/baseline value × 100%.
Vascular Endothelial Growth Factor Receptor-3 (VEGFR-3) Treatment
SAR131675 (Cat. 15458, MCE) is a VEGFR-3 inhibitor that inhibits the function of VEGFR-3 in LVs. The mice were randomized into four groups: Control + Vehicle (n = 10), GA+Vehicle (n = 10), Control + SAR131675 (n = 10), and GA + SAR131675 (n = 10). Before GA model was established, mice were injected intraperitoneally with SAR131675 at 50 mg/kg body weight for 42 consecutive days, and the control mice were injected with the same volume of solvent (equivalent dose of solvent, 15 mL PEG 400 + 2.5 mL Tween-80 + 30 mL double-distilled water). The dose and treatment duration were selected based on previous studies that demonstrate robust inhibition of lymphangiogenesis with acceptable tolerability.25 Then, a MSU-induced GA model was established when lymphatic clearance was significantly inhibited in the SAR131675-treated mice.
Ultrasound Scan
After removing the hair around the popliteal lymph nodes (PLNs), the mice were anesthetized using isoflurane gas and fixed in a prone position on a thermostatic hot plate at 37°C. Three-dimensional (3D) ultrasound images of the PLNs and the skin surface of the hind paws were scanned using an MX550D ultrasound probe with a medical ultrasound coupler as a medium. 3D reconstruction was performed using Vevo Lab 3.2.0 software to determine the maximum cross-sectional area and volume of the paw and PLNs.
Histology
The paw tissue was fixed, decalcified, and embedded in paraffin. Then, 4-μm-thick tissue sections were taken and stained with hematoxylin and eosin (H&E). The stained sections were digitized by a whole-section imaging system (VS120-S5-E, Olympus, USA) and analyzed by ImageJ software. Using ImageJ software with a unified scale, identical regions at the plantar surface of the mouse hind paws were selected. We captured and analyzed areas of equal size, which clearly demonstrated that deep purple–stained areas in the GA mice represent inflammatory infiltration zones, whereas purple-stained areas in the control group are limited. The same area of plantar tissue was selected from each section, and the ratio of the inflammatory infiltration area to the total contour area was calculated.
Uric Acid Concentration Measurement
To detect the concentration of uric acid, we collected serum by removing the eyeballs, and we mixed the isolated PLNs and iliac lymph nodes (ILNs) with 10 times greater volume of PBS, ground them at 4°C with a multi-sample tissue grinder (Shanghai Jingxin, Tissuelyser-24), and centrifuged them to collect the supernatant. Then, the concentrations of uric acid in serum, PLNs, and ILNs were measured with uric acid assay kits (Cat. C012-2-1) purchased from the Nanjing Jiancheng Bioengineering Institute.
Near-Infrared–Indocyanine Green (NIR-ICG) Lymphatic Imaging
After isoflurane gas anesthesia, 10 μL of 0.1 mg/mL ICG solution was injected subcutaneously into a hind paw of each mouse (Catalog 17478–701-02, Akorn Corporation). The mice were fixed on a thermostatic hot plate at 37°C to minimize the effect of temperature on the contractile function of LVs. As described previously,26 fluorescence intensity images were obtained at 15 min and 24 h after ICG injection by irradiating the footpad area with a near-infrared laser to calculate the lymphatic clearance rate over a 24-h period. The 15-min time point captured the early filled phase of ICG entering the draining LVs, whereas the 24-h time point reflected the overall clearance capacity throughout the entire inflammatory cycle. The ICG fluorescence of the afferent LVs from the injection site to the PLN was continuously visualized and recorded at 1-s intervals using an Olympus microscope to observe the pulsation of the LVs over a certain period. LV pulsation was calculated by counting the number of times the ICG fluorescence signal crossed the afferent LVs to reach the region of interest (ROI) within 500s, and the data were analyzed using ImageJ software. ImageJ software was used to analyze brightness changes in selected LV regions and acquire data. Continuously stable 500-s signal data were extracted to generate LV pulsation curves via GraphPad Prism 8. Pulsation events were counted and converted to lymphatic pulsation frequency per minute (Pulse), which was recorded. Additionally, after setting the parameters, 1001 consecutive images recorded at 1-s intervals by the Olympus microscope were imported into ImageJ. These images were converted into a dynamic video using the software, clearly revealing brightness fluctuations in LVs and allowing direct visualization of their rhythmic pulsations. The same anesthetic regimen was applied across all groups to minimize variability in lymphatic contractility related to isoflurane exposure.
Whole-Mount Staining
For whole-mount staining of the collecting LVs, the foot skin was fixed in 4% paraformaldehyde, blocked with 3% milk in 0.3% Triton X-100, and incubated with FITC-conjugated mouse monoclonal anti-mouse α-smooth muscle actin (α-SMA, Cat. No. F3777, Sigma, 1:400), hamster anti-mouse Podoplanin (PDPN, Cat. No. ab11936, Abcam, 1:1000), and Alexa-546 goat anti-hamster IgG (H+L) (Cat. No. A211, 1:400), as previously reported.19 The tissues were then mounted with glycerin and imaged with a whole-slide imaging system, and all images were analyzed using ImageJ software. After setting calibrated scale parameters in ImageJ software, we outlined α-SMA (green fluorescent signal) to obtain its area, calculate its coverage ratio (%) within the identical region area, and perform between-group comparisons. The percentage of α-SMA coverage on mature LVs was quantified by using the following equation: αSMA+ area/PDPN+ area at LVs × 100%.
Statistical Analysis
All statistical analyses were performed using GraphPad Prism 8.0 software. Measurement data were expressed as mean values ± standard deviation (SD). The Student’s t test was used to compare the measurement data between two groups. Count data between two groups were compared using the Fisher’s exact test. Differences between the mean values of more than two groups were analyzed using one-way ANOVA with post-hoc Dunnett’s t or Bonferroni test. Multi-group comparison of repeated measurements was determined by repeated-measures ANOVA (RM-ANOVA). P values < 0.05 were considered significant.
Results
GA Patients Have an Increased Volume of Draining Lymph Nodes
To observe the morphology of the draining lymph nodes in patients with GA, we performed ultrasound examination of the first metatarsophalangeal joint and its draining lymph nodes (ILNs; Table 1) in 30 patients with GA flare and 30 normal volunteers without arthritis or any other inflammation disease at both lower extremities. Ultrasound imaging revealed dilatation of the first metatarsophalangeal joint, thickening of the synovium, and multiple internal punctate strong echogenic spots in the patients with GA (Figure 1A). It is commonly recognized that the ILNs in humans drain the superficial LVs of the lower extremities, except for the lateral margin of the foot and the posterior lateral aspect of the lower leg.27 As shown in Figure 1A and B, the patients with GA had significantly larger ILNs than normal volunteers. This suggests that the enlarged draining lymph nodes may be related to the inflammatory response at the joint sites in arthritis.
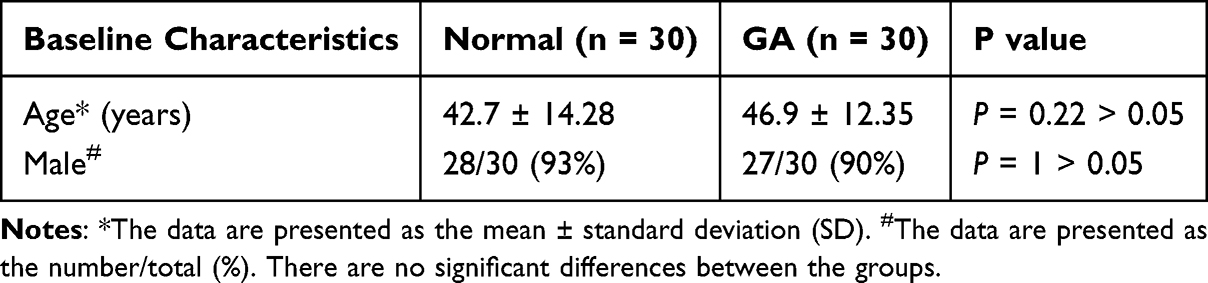 |
Table 1 Patient Baseline Characteristics |
 |
Figure 1 GA patients with enlarged inguinal lymph nodes. Inguinal lymph nodes and the first metatarsophalangeal joints of patients with GA flare (n = 30 patients) and normal volunteers without arthritis or any other inflammatory disease at both lower extremities (n = 30 persons) were examined by ultrasound. (A) Representative ultrasound images of inguinal lymph nodes and the first metatarsophalangeal joints from normal volunteers and GA patients. Yellow arrow indicates enlarged lymph node of upper image and dilated joint of lower image. Green “+” and Red “+” indicate vertices of the long and short axis of a lymph node, respectively. (B) Histomorphometric analyses of maximum cross-sectional area of inguinal lymph nodes were performed. Each symbol represents a single sample; bars show the mean. ***P < 0.001 by the Student’s t test. |
Increased Volume and Uric Acid Concentration in Draining Lymph Nodes of Mice Injected with MSU for 1 Week
Repeated injections of MSU resulted in persistent swelling of the hind paws of the mice in the GA-1W group, with thickness peaking at 12 h after modeling. Compared with the control group, the GA-1W group showed an average thickness increase of 40% (Figure 2A and B). Likewise, the results of H&E staining showed that the area of inflammatory infiltration was significantly increased in the GA-1W group (Figure 2C and D). Previous studies in mice have shown that PLNs can drain lymphatic fluid from the ankle and footpad regions.28 We used ultrasound 3D imaging to capture and analyze the volume of the paw and PLNs. Compared with the normal mice, the mice in the GA-1W group had a threefold increase in the paw volume (Figure 2E and F) and a 1.7-fold increase in the PLN volume (Figure 2G). To further investigate whether increased lymph node volume was associated with MSU, we examined uric acid concentrations in the draining lymph nodes. Uric acid concentrations were significantly increased in the GA-1W group, showing a fivefold increase in PLNs and a threefold increase in ILNs. In contrast, serum uric acid concentrations did not increase significantly (Figure 2H). These findings suggest that urate in the hind paw can be transferred to the lymph nodes, which may account for the increase in lymph node volume during MSU-induced inflammation.
 |
Figure 2 Uric acid concentrations in the PLNs are elevated in the GA-1W group, whereas serum uric acid concentrations are not. (A) Measurement of the paw swelling degree in GA-1W mice by using high-precision electronic digital display vernier calipers and analyses at 12 hours, 1 day, 2 days, 3 days, 4 days, 5 days, 6 days, and 7 days; the results are presented as the mean ± standard deviation (SD). Statistical analysis was performed using a repeated-measures analysis of variance, followed by the Bonferroni post-hoc test to assess the significance of the results (n = 20 legs from 10 mice; ***P < 0.001 vs control mice). (B) Representative mice after acute GA modeling of foot swelling images (scale bar = 1 cm). (C) Representative images of H&E-stained sections of foot and ankle tissues to illustrate the inflammation infiltration area in the foot tissues after MSU modeling (scale bar = 100 μm). (D) Inflammation area ratio indicates the percentage of the inflammatory area to the total area of the intercepted field (n = 6, **P < 0.01 vs control mice). (E) Representative images of ultrasound scans of the pedicle claw tissue and popliteal lymph nodes in B mode and 3D mode. (F) Paw volumes before and after modeling were analyzed using VEVO Lab software (n = 10, ***P < 0.001 vs control mice). (G) Volume of the 1W popliteal lymph nodes before and after modeling in 3D mode was analyzed using VEVO Lab software (n = 9–10, *** P < 0.001 vs control mice). (H) Differences in uric acid concentration in the 1W popliteal lymph nodes, inguinal lymph nodes, and serum before and after modeling were analyzed (***P < 0.001 vs control mice; ns = no significant difference). |
Drainage of MSU Leads to Structural and Functional Dysfunction of the LVs
LVs are important channels for the removal of local pathological products and inflammatory mediators from tissues. Thus, to observe the alterations in the function of LVs in the GA mice, we injected ICG into the footpad of the mice and assessed the ability of LVs to eliminate ICG by NIR imaging. We found that the diameter of the LVs in the GA-1W group increased and the LVs showed irregular hyperplasia (blue arrows in Figure 3A). The signal intensity of the PLNs was dampened (Figure 3A), whereas the signal intensity of the pulses from the LVs was enhanced (Figure 3B). The frequency of LV pulses per unit time increased (Figure 3C). Furthermore, compared with the normal group, the fluorescence intensity of ICG in the plantar foot of the mice in the GA-1W group remained strong 24 h after ICG injection, indicating a significant reduction in the drainage capacity of the LVs (Figure 3D and E). To further observe the structure of the LVs, we performed immunofluorescence staining of the whole foot skin with podoplanin and α-SMA double-positive markers to label the mature LVs and calculated the area covered by LV smooth muscle. The reduction of LV smooth muscle coverage area in the GA-1W group (Figure 3F and G) indicated that the lymphatic tissue structure was impaired in this group.
 |
Figure 3 Impaired lymphatic function and reduced lymphatic vessel (LV) coverage in the GA-1W group. (A) Representative near-infrared indocyanine green image with white arrows indicating ICG injection sites, Orange arrows showing LVs, yellow arrows indicating popliteal lymph nodes, and small blue circles as regions of interest (ROIs) for measurement pulses. (B) Representative histogram of lymphatic pulses in arbitrary units in the control group (blue) compared with the GA-1W group (red). The NIR-ICG image in the histogram shows the real-time passage of ICG pulses through the lymphatic vessels, as evidenced by the change in pulse signal intensity over 500s. (C) Quantitative analysis of the number of lymphatic beats as a function of the interval between beats. The values are reported as the mean ± standard deviation (SD) of 10–16 legs from 5–8 mice. Statistical analysis was conducted using the Student’s t test, ***P < 0.001 vs control mice. (D) Representative images of fluorescence intensity at the footpad site were analyzed in two groups of mice at 15 min and 24 h after injection of ICG solution. Orange circles are the ROIs when analyzing fluorescence intensity. (E) Quantitation analysis of the percentage of ICG clearance. Values are the mean ± SD of 10–16 legs of 5–8 mice. ***P < 0.001 vs control mice by the Student’s t test. (F) Representative merge images of whole-mount immunofluorescence staining. Podoplanin (red), α-SMA (green); scale bar = 200 μm. (G) Quantification of coverage rate of α-SMA. *P < 0.05 vs control mice by the Student’s t test. |
Long-Term MSU Challenge Exacerbates Inflammatory Response and Elevates Urate Concentration in PLNs, ILNs, and Serum
Although GA is a self-limiting inflammatory disease, recurrent flares of GA can occur and tophi may form in the paws when uric acid levels are not properly controlled. To mimic clinical features of patients with long-term recurrent gout flares, we repeatedly stimulated mice for 1 month with MSU. We found that as the duration of the MSU exposure increased, the degree of paw swelling increased in the mice in the GA-1M group (Figure 4A and B), and H&E staining showed that the area of inflammatory cell infiltration also increased significantly (Figure 4C and D). Besides, ultrasound scanning showed significant increases in the volume of paws and lymph nodes of the mice in the GA-1M group (Figure 4E–G). We further detected the concentrations of uric acid and found that compared with normal mice, there was a 15-fold increase in the PLNs, a 5-fold increase in the ILNs, and a 5-fold increase in the serum of UA concentration in the GA-1M group (Figure 4H). Importantly, the uric acid concentrations in the PLNs, ILNs, and serum of the mice in the GA-1M group were higher than those of the mice in the GA-1W group.
 |
Figure 4 Uric acid is increased in lymph nodes and serum in the GA-1M group. (A) Analysis of the paw swelling degree of GA-1M mice. Data are shown as the mean values ± standard deviation (SD) and analyzed by repeated-measures ANOVA with Bonferroni post-hoc test (n = 12-16 legs from 6–8 mice, *** P < 0.001 for comparison with control group). (B) Representative images of paw swelling in GA-1M and control mice (scale bar = 1 cm). (C) Histological images of the foot from the control and GA-1M groups are shown in this figure, with the area of inflammatory infiltration in the foot paw clearly visible (scale bar = 100 μm). (D) Histomorphometric analysis of the area of inflammatory infiltration in the paw tissue was performed using ImageJ software. The inflammation area ratio indicates the percentage of the inflammatory area to the total area of the intercepted field. Data are expressed as mean ± SD. Unpaired t tests were used to analyze differences between the control mice and GA-1M mice (n = 6, *** P < 0.001 for comparison with the control group). (E) Representative images of ultrasound scans of foot claw tissue and popliteal lymph nodes in B mode and 3D mode. (F–G) Quantitative analysis was conducted to determine the foot paw and volume of popliteal lymph nodes (PLNs) in the control mice and GA-1M mice. The values represent the mean ± SD of 11–16 legs from 6–8 mice. Unpaired t tests were used to analyze the differences between the two groups (***P < 0.001 for comparison with the control group). (H) Uric acid concentration in PLNs, ILNs, and serum was measured. *P < 0.05, **P < 0.01, ***P < 0.001 vs control mice by the Student’s t test. |
Long-Term MSU Challenge Exacerbates LV Damage in GA Mice
Since LVs are essential for the clearance of tissue-deposited urate, to observe the morphological and functional changes of LVs during recurrent episodes of GA, we continuously stimulated the mice with MSU for 1 month. In the control group, the ICG fluorescence signals of the lower limb’s LVs and PLN were clear and contracted twice per minute on average (Figure 5A and B). In contrast, two different fluorescence signal conditions were found in the GA-1M group. First, no visible pulsation was detected in the draining LVs (dLVs) of the GA-1M group, and the ICG fluorescence signals of the LVs and PLNs were very weak. Second, a large number of small and curved dLVs were found in the limbs, and some of them showed ICG leakage, which resulted in disturbed ICG signals (Figure 5B). In the GA-1M group, ICG signals were weak in the dLVs, and no significant pulses were detected in the lower limbs of nearly half of the mice. The GA-1M mice with measurable lymphatic pulses had stronger signal intensity and faster beating rhythm in the dLVs. The signal of the collecting LVs was weaker than that of the lateral LVs but stronger than that of the control group, with a lower pulsation frequency (Figure 5B and C). The increased frequency of lower-limb lymphatic pulsations in the mice in the GA-1M group suggests that chronic recurrent inflammation may promote lymphatic pulsations, although the average number of pulsations per unit of time was lower than that in mice in the GA-1W group (Figure 5D). Like in the GA-1W group, the ICG clearance rate in the GA-1M group was lower than that in the control group (Figure 5E and F). In addition, examination of mature LVs in the skin of the foot pads by whole-mount staining revealed that the LVs in the GA-1M group were thinner-walled, and the coverage of smooth muscle in the LVs was significantly lower (Figure 5G and H). In conclusion, repeated MSU injections lead to more severe paw swelling, enlarged draining lymph nodes, and impaired LV function.
 |
Figure 5 Repeated chronic GA inflammation leads to impaired lymphatic function and reduced vascular coverage. (A) Representative NIR-ICG images showing LVs, popliteal lymph nodes (PLNs; white arrows), ICG injection site (light orange arrows), normal Lvs (deep orange arrows), ICG leakage (yellow arrows), and region of interest (ROI) where the pulses were measured (blue circle indicates ROI at dominant LVs in the control group; red circle indicates dominant LVs in the GA-1M group; and green circle indicates collateral LVs that bypass the PLN). (B) Histogram showing ICG pulses in the dominant LV of a control mouse (in blue) and in the dominant LV (dLV, in red) and collateral LV (in green) of a GA-1M mouse. (C) Number of legs with or without pulses in the dominant LVs was recorded for all tested legs. Statistical analysis was performed using Fisher’s exact test, *P < 0.05 vs the control group. (D) Quantitative analysis was conducted to determine the number of lymphatic pulses in the dominant LVs vs the interval between beats. The values represent the mean ± standard deviation (SD) of 9–12 legs from 5–6 mice. Statistical analysis was performed using the Student’s t test, *P < 0.05 vs the control group. (E) Representative images of fluorescence intensity at the footpad site of the control group versus the GA-1M group at 15 min and 24 h after injection of ICG. Orange circles are the ROIs for analyzing fluorescence intensity. (F) Quantitation analysis of the percentage of ICG clearance. Values are shown as the mean ± SD of 12 legs of 6 mice. **P < 0.01 vs control mice by the Student’s t test. (G) Representative merge images of whole-mount immunofluorescence staining, with podoplanin labeled in red and α-SMA labeled in green. Scale bar = 200 μm. (H) Quantitative analysis was performed to determine the coverage rate of α-SMA, as depicted in panel G. The data represent the mean ± SD of nine samples, with statistical significance indicated by asterisks: ***P < 0.001 compared with the control group, as determined by the Student’s t test. |
Disruption of LVs Delays the Resolution of the Inflammatory Response in GA Mice
To investigate the impact of the function of LVs on the regression of GA inflammation, we treated the mice with a VEGFR-3 inhibitor (SAR131675) for 42 days to suppress the LV function beforehand, and the progression of inflammation induced by a single paw injection of MSU was then observed (Figure 6A). Lymphatic function in mice was successfully suppressed after SAR131675 treatment, as evidenced by decreased clearance of ICG injected in the footpad (Figure 6B and C). We found that the GA mice stimulated once with MSU had the highest degree of paw swelling within 1 day, followed by a steady decline, which almost returned to normal by day 9. However, the mice receiving the VEGFR-3 inhibitor treatment had a much lower rate of swelling regression, and the degree of swelling was still significantly higher than that in the GA+Vehicle group by day 9 (Figure 6D). Ultrasonography results confirmed that the paws of the inhibitor-treated mice were significantly larger than those of the model group (Figure 6E and F), while the PLN volume was increased in the modeling group (Figure 6G). Consistent with this, H&E staining showed that the area of inflammation in the foot tissue of the mice in the GA+SAR131675 group was twice as large as that in the GA+Vehicle group (Figure 6H and I). Taken together, these results suggest that disruption of LVs leads to more persistent inflammation in MSU-induced GA.
 |
Figure 6 VEGFR-3 inhibition slows the regression of MSU-induced inflammation. (A) Seven-week-old male C57BL/6J mice received intraperitoneal injections of SAR131675 (50 mg/kg) or Vehicle for 42 days. NIR imaging detected impaired lymphatic vessel function at 43 days. Acute GA was induced by injecting 5% MSU into the soles of the feet for one time. Popliteal lymph nodes and foot swelling volumes were examined by ultrasound prior to euthanasia (6–7 mice per group). (B) Fluorescence intensity images of the metatarsal surfaces of the feet of two groups of mice were analyzed 15 min and 24 h after injection of ICG solution. Orange circles indicate the regions of interest (ROIs) where the fluorescence intensity was analyzed. (C) ICG clearance percentage was quantitatively analyzed in 26–28 legs of 13–14 mice, with results reported as the mean value ± SD. A significant difference was observed using the Student’s t test: ***P < 0.001 compared with the control mice. (D) Paw swelling was analyzed in each group and presented as mean ± SD. Repeated-measures ANOVA with Bonferroni post-hoc test was used to analyze the data from a sample size of 12–14 legs (6–7 mice). The GA+SAR131675 group showed a statistically significant difference compared with the GA+Vehicle group, *P < 0.05, **P < 0.01. (E) 3D-mode ultrasound scans of paw and popliteal lymph nodes are presented as representative images. (F–G) Quantitative analysis of the volume of paw and popliteal lymph nodes. Values are shown as mean ± SD. One-way analysis of variance followed the Dunnett’s t post-hoc test. *P < 0.05, ***P < 0.001, ns = no significance. (H) To quantify the extent of inflammation in foot tissue, we used ImageJ software to measure the area of inflammation as a percentage of the total intercepted area. Data are expressed as mean ± SD, ***P< 0.001, n= 6. (I) Representative histological images of foot tissues from each group are shown, depicting the area of inflammatory infiltration in the foot paw. Scale bar = 100 μm. |
Discussion
Integrating clinical imaging of GA patients with data from mouse models, our findings provide correlative evidence that the lymphatic system is involved in uric acid clearance and inflammation resolution. This is further supported by the observation that pharmacological inhibition of VEGFR-3, which was associated with impaired lymphatic drainage, also correlated with a delay in the resolution of MSU-induced inflammation. These collective data suggest an important role for functional lymphatic drainage in the inflammatory resolution process of GA.
Uric acid is the product of purine metabolism, circulating in the form of urate.29 When serum uric acid remains within its solubility range, it is cleared primarily in dissolved form through renal/intestinal pathways.30 Within the microenvironment of peripheral joints (exposed to cold temperatures and pH fluctuations), local concentrations exceeding solubility thresholds lead to the formation of monosodium urate (MSU) needle-like crystals.31 These crystals diffuse poorly back into the bloodstream and therefore tend to become “trapped” within the joint and surrounding tissues.2 Their removal relies on local clearance mechanisms mediated by macrophages and neutrophils.32 However, whether urate crystals undergo lymphatic transport and their relationship with the lymphatic system were unknown. In this study, we observed markedly elevated urate levels in the PLN/ILN in short-term models, even before serum urate showed significant elevation, suggesting that draining lymph nodes may serve as an early “frontline station”. Moreover, inhibition of lymphatic function impaired crystal clearance, indicating that the lymphatic system contributes to urate removal in GA.
The lymphatic system not only maintains immune homeostasis but also participates in the onset and resolution of inflammatory responses by draining interstitial fluid and local pathological products.18 In rheumatoid arthritis (RA), lymphatic vessels drain inflammatory exudates and degradation products from the synovial cavity and periarticular tissues to draining lymph nodes.19 In the early stages of RA, enhanced lymphatic drainage aids inflammatory control. However, within the context of persistent chronic inflammation, substantial accumulation of immune cells such as B cells within draining lymph nodes can lead to lymphatic sinus collapse or luminal compression.33 Concurrently, inflammatory cytokines TNF induce LEC to produce excessive nitric oxide (NO), which inhibits the contraction of lymphatic smooth muscle cells, thereby impairing lymphatic return function.19,34 In GA, we hypothesise that the mechanism of impaired lymphatic drainage may share similarities with RA: monosodium urate (MSU), acting as a damage-associated molecular pattern (DAMP), activates macrophages and neutrophils, inducing neutrophil extracellular traps (NETs) and prompting these cells to release substantial inflammatory mediators (including NO).10,35,36 This inhibits contraction of the smooth muscle in collecting lymphatic vessels. Furthermore, under persistent hyperuricaemic conditions, some MSU and uric acid may deposit within lymphatic vessels. Their needle-like crystals may inflict direct mechanical and toxic damage upon lymphatic endothelial cells and surrounding smooth muscle cells, potentially causing focal obstruction or lymphatic leakage. The combined effects of these factors may progressively impair lymphatic endothelium and smooth muscle cells, leading to lymphatic pump failure and diminished drainage capacity. However, the critical mechanisms driving this progressive lymphatic failure remain to be fully elucidated and will require future studies that integrate high-resolution intravital imaging of lymphatic–immune cell interactions, single-cell transcriptomic profiling of lymphatic endothelial and smooth muscle cells in GA models, and reductionist in vitro systems exposing these cell types to MSU crystals and NET-associated mediators.
This study has several limitations. First, though enlargement of draining lymph nodes in patients with GA has been detected by ultrasound, direct evidence of lymphatic drainage function is still lacking. In future studies, we plan to use the clinically approved ICG dye to assess lymphatic drainage in the affected joints of patients with GA. Second, the GA model relied on repeated periarticular injections of exogenous MSU crystals, which provides high experimental controllability but does not fully recapitulate crystal formation under chronic hyperuricemia.37 These factors may influence the dynamics of lymphatic responses. Despite these limitations, the model reliably induces joint inflammation and allows controlled assessment of lymphatic function during defined disease phases. Future studies using models that better mimic endogenous urate deposition and spontaneous relapse–remission patterns will help further validate the mechanisms identified here.
Conclusion
Our findings demonstrate that MSU crystals in GA are preferentially drained via lymphatic vessels to regional lymph nodes, thereby establishing a local urate reservoir where concentration rises significantly earlier than in serum. This clearance pathway is compromised as lymphatic structure and function become impaired during both acute and chronic phases of MSU-induced inflammation. VEGFR-3 inhibition delays inflammation resolution indicates the importance of lymphatic function. Collectively, this work highlights the lymphatic system’s indispensable role in local urate homeostasis and posits that enhancing lymphatic function may represent a novel therapeutic strategy for GA.
Data Sharing Statement
All data are available from the corresponding author upon reasonable request.
Acknowledgments
We thank LetPub (www.letpub.com.cn) for its linguistic assistance during the preparation of this paper.
Author Contributions
SHC: Conceptualization, Data curation, Investigation, Methodology, Writing - original draft, Writing – review & editing. XZ: Conceptualization, Project administration, Methodology, Writing - original draft, Writing – review & editing. CGW: Data curation, Investigation, Methodology, Writing - original draft. CYW: Investigation, Methodology, Writing – review & editing. LYY: Data curation, Methodology, Writing – review & editing. LPX: Data curation, Investigation, Writing – review & editing. HX: Investigation, Methodology, Writing – review & editing. SCL: Data curation, Methodology, Writing – review & editing. JXW: Methodology, Validation, Writing – review & editing. JD: Methodology, Validation, Writing – review & editing. PJZ: Methodology, Validation, Writing – review & editing. QQL: Conceptualization, Supervision, Writing – review & editing. NL: Data curation, Writing – review & editing. MR: Project administration, Methodology, Writing - original draft, Writing – review & editing. XYW: Conceptualization, Data curation, Writing - original draft, Writing – review & editing.
All authors agreed to the final version submitted for publication, agreed to submit this paper to the Journal of Inflammation Research, and agree to be accountable for the content of this paper.
Funding
This work was supported by funding from the Health Youth Talent Project of Shanghai Health Commission (2022YQ025), the Traditional Chinese Medicine Research Project of Shanghai Health Commission (2024QN050), the National Natural Science Foundation (81822050, 81920108032, 81730107), the Traditional Chinese Medicine Research Project Innovation Team Project of Shanghai Health Commission (2022CX001), Shanghai “Science and Technology Innovation Action Plan” medical innovation research project (21Y11921400), Shanghai Top Priority Research Center Construction Project (2022ZZ01009), National Institutes of Health, USA (R01 AG059775), Specialized Department Construction Project of Shanghai Changning District Health Commission (20232004), and the PI research project team construction project of the health system in Changning District, Shanghai (PI202425, PI202426).
Disclosure
The authors report no conflicts of interest in this work.
References
1. Dehlin M, Jacobsson L, Roddy E. Global epidemiology of gout: prevalence, incidence, treatment patterns and risk factors. Nat Rev Rheumatol. 2020;16(7):380–14. doi:10.1038/s41584-020-0441-1
2. Dalbeth N, Gosling AL, Gaffo A, Abhishek A. Gout. Lancet. 2021;397(10287):1843–1855. doi:10.1016/s0140-6736(21)00569-9
3. FitzGerald JD, Dalbeth N, Mikuls T, et al. 2020 American College of rheumatology guideline for the management of gout. Arthritis Rheumatol. 2020;72(6):879–895. doi:10.1002/art.41247
4. Richette P, Doherty M, Pascual E, et al. 2016 updated EULAR evidence-based recommendations for the management of gout. Ann Rheum Dis. 2017;76(1):29–42. doi:10.1136/annrheumdis-2016-209707
5. Khanna D, Khanna PP, Fitzgerald JD, et al. 2012 American College of rheumatology guidelines for management of gout. Part 2: therapy and antiinflammatory prophylaxis of acute gouty arthritis. Arthritis Care Res. 2012;64(10):1447–1461. doi:10.1002/acr.21773
6. Martinon F, Petrilli V, Mayor A, Tardivel A, Tschopp J. Gout-associated uric acid crystals activate the NALP3 inflammasome. Nature. 2006;440(7081):237–241. doi:10.1038/nature04516
7. So AK, Martinon F. Inflammation in gout: mechanisms and therapeutic targets. Nat Rev Rheumatol. 2017;13(11):639–647. doi:10.1038/nrrheum.2017.155
8. Dalbeth N, Choi HK, Joosten LAB, et al. Gout. Nat Rev Dis Prim. 2019;5(1):69. doi:10.1038/s41572-019-0115-y
9. Terkeltaub RA, Dyer CA, Martin J, Curtiss LK. Apolipoprotein (apo) E inhibits the capacity of monosodium urate crystals to stimulate neutrophils. Characterization of intraarticular apo E and demonstration of apo E binding to urate crystals in vivo. J Clin Invest. 1991;87(1):20–26. doi:10.1172/jci114971
10. Rock KL, Kataoka H, Lai JJ. Uric acid as a danger signal in gout and its comorbidities. Nat Rev Rheumatol. 2013;9(1):13–23. doi:10.1038/nrrheum.2012.143
11. Schauer C, Janko C, Munoz LE, et al. Aggregated neutrophil extracellular traps limit inflammation by degrading cytokines and chemokines. Nat Med. 2014;20(5):511–517. doi:10.1038/nm.3547
12. Petrova TV, Koh GY. Biological functions of lymphatic vessels. Science. 2020;369(6500). doi:10.1126/science.aax4063
13. Randolph GJ, Ivanov S, Zinselmeyer BH, Scallan JP. The Lymphatic System: integral Roles in Immunity. Ann Rev Immunol. 2017;35:31–52. doi:10.1146/annurev-immunol-041015-055354
14. Breslin JW, Yang Y, Scallan JP, Sweat RS, Adderley SP, Murfee WL. Lymphatic vessel network structure and physiology. Compr Physiol. 2018;9(1):207–299. doi:10.1002/cphy.c180015
15. Rodriguez-Navarro C, Elert K, Ibañez-Velasco A, et al. Unraveling the pathological biomineralization of monosodium urate crystals in gout patients. Commun Biol. 2024;7(1):828. doi:10.1038/s42003-024-06534-6
16. Weitman E, Cuzzone D, Mehrara BJ. Tissue engineering and regeneration of lymphatic structures. Future Oncol. 2013;9(9):1365–1374. doi:10.2217/fon.13.110
17. Oyewumi MO, Kumar A, Cui Z. Nano-microparticles as immune adjuvants: correlating particle sizes and the resultant immune responses. Expert Rev Vaccines. 2010;9(9):1095–1107. doi:10.1586/erv.10.89
18. Schwager S, Detmar M. Inflammation and Lymphatic Function. Front Immunol. 2019;10:308. doi:10.3389/fimmu.2019.00308
19. Liang Q, Zhang L, Xu H, et al. Lymphatic muscle cells contribute to dysfunction of the synovial lymphatic system in inflammatory arthritis in mice. Arthritis Res Ther. 2021;23(1):58. doi:10.1186/s13075-021-02438-6
20. Li X, Qi L, Yang D, et al. Meningeal lymphatic vessels mediate neurotropic viral drainage from the central nervous system. Nat Neurosci. 2022;25(5):577–587. doi:10.1038/s41593-022-01063-z
21. Chen J, Wang L, Xu H, et al. Meningeal lymphatics clear erythrocytes that arise from subarachnoid hemorrhage. Nat Commun. 2020;11(1):3159. doi:10.1038/s41467-020-16851-z
22. So A, Thorens B. Uric acid transport and disease. J Clin Invest. 2010;120(6):1791–1799. doi:10.1172/jci42344
23. Reber LL, Gaudenzio N, Starkl P, Galli SJ. Neutrophils are not required for resolution of acute gouty arthritis in mice. Nature Med. 2016;22(12):1382–1384. doi:10.1038/nm.4216
24. Zhang HJ, Li LN, Zhou J, et al. Effects of Gnaphalium affine D. Don on hyperuricemia and acute gouty arthritis. J Ethnopharmacol. 2017;203:304–311. doi:10.1016/j.jep.2017.03.057
25. Zheng Y, Wang P, Zhao L, et al. A novel therapy for fracture healing by increasing lymphatic drainage. J Orthop Translat. 2024;45:66–74. doi:10.1016/j.jot.2024.02.001
26. Zhou Q, Wood R, Schwarz EM, Wang YJ, Xing L. Near-infrared lymphatic imaging demonstrates the dynamics of lymph flow and lymphangiogenesis during the acute versus chronic phases of arthritis in mice. Arthritis Rheum. 2010;62(7):1881–1889. doi:10.1002/art.27464
27. Shinaoka A, Koshimune S, Suami H, et al. Lower-limb lymphatic drainage pathways and lymph nodes: a CT lymphangiography cadaver study. Radiology. 2020;294(1):223–229. doi:10.1148/radiol.2019191169
28. Nakajima Y, Asano K, Mukai K, et al. Near-infrared fluorescence imaging directly visualizes lymphatic drainage pathways and connections between superficial and deep lymphatic systems in the mouse hindlimb. Sci Rep. 2018;8(1):7078. doi:10.1038/s41598-018-25383-y
29. Kim SH, Shin J, Son HE, Kang DH. Role of urate transporters in the kidneys and intestine in uric acid homeostasis. Kidney Res Clin Pract. 2025. doi:10.23876/j.krcp.24.321
30. Ohashi Y, Toyoda M, Saito N, et al. Evaluation of ABCG2-mediated extra-renal urate excretion in hemodialysis patients. Sci Rep. 2023;13(1):93. doi:10.1038/s41598-022-26519-x
31. Martillo MA, Nazzal L, Crittenden DB. The crystallization of monosodium urate. Curr Rheumatol Rep. 2014;16(2):400. doi:10.1007/s11926-013-0400-9
32. Cronstein BN, Terkeltaub R. The inflammatory process of gout and its treatment. Arthritis Res Ther. 2006;8(Suppl 1):S3. doi:10.1186/ar1908
33. Li J, Zhou Q, Wood RW, et al. CD23(+)/CD21(hi) B-cell translocation and ipsilateral lymph node collapse is associated with asymmetric arthritic flare in TNF-Tg mice. Arthritis Res Ther. 2011;13(4):R138. doi:10.1186/ar3452
34. Bloom SI, Islam MT, Lesniewski LA, Donato AJ. Mechanisms and consequences of endothelial cell senescence. Nat Rev Cardiol. 2023;20(1):38–51. doi:10.1038/s41569-022-00739-0
35. Scanu A, Luisetto R, Oliviero F, et al. High-density lipoproteins inhibit urate crystal-induced inflammation in mice. Ann Rheum Dis. 2015;74(3):587–594. doi:10.1136/annrheumdis-2013-203803
36. Wu C, Chen S, Liu Y, et al. Cynarin suppresses gouty arthritis induced by monosodium urate crystals. Bioengineered. 2022;13(5):11782–11793. doi:10.1080/21655979.2022.2072055
37. Patil T, Soni A, Acharya S. A brief review on in vivo models for gouty arthritis. Metabol Open. 2021;11:100100. doi:10.1016/j.metop.2021.100100
 © 2026 The Author(s). This work is published and licensed by Dove Medical Press Limited. The
full terms of this license are available at https://www.dovepress.com/terms
and incorporate the Creative Commons Attribution
- Non Commercial (unported, 4.0) License.
By accessing the work you hereby accept the Terms. Non-commercial uses of the work are permitted
without any further permission from Dove Medical Press Limited, provided the work is properly
attributed. For permission for commercial use of this work, please see paragraphs 4.2 and 5 of our Terms.
© 2026 The Author(s). This work is published and licensed by Dove Medical Press Limited. The
full terms of this license are available at https://www.dovepress.com/terms
and incorporate the Creative Commons Attribution
- Non Commercial (unported, 4.0) License.
By accessing the work you hereby accept the Terms. Non-commercial uses of the work are permitted
without any further permission from Dove Medical Press Limited, provided the work is properly
attributed. For permission for commercial use of this work, please see paragraphs 4.2 and 5 of our Terms.