Back to Journals » Diabetes, Metabolic Syndrome and Obesity » Volume 13
Lycopene Improves the Metformin Effects on Glycemic Control and Decreases Biomarkers of Glycoxidative Stress in Diabetic Rats
Authors Figueiredo ID, Lima TFO ![]() , Inácio MD
, Inácio MD ![]() , Costa MC
, Costa MC ![]() , Assis RP
, Assis RP ![]() , Brunetti IL, Baviera AM
, Brunetti IL, Baviera AM ![]()
Received 10 June 2020
Accepted for publication 7 August 2020
Published 7 September 2020 Volume 2020:13 Pages 3117—3135
DOI https://doi.org/10.2147/DMSO.S265944
Checked for plagiarism Yes
Review by Single anonymous peer review
Peer reviewer comments 2
Editor who approved publication: Prof. Dr. Juei-Tang Cheng
Ingrid Delbone Figueiredo, Tayra Ferreira Oliveira Lima, Maiara Destro Inácio, Mariana Campos Costa, Renata Pires Assis, Iguatemy Lourenço Brunetti, Amanda Martins Baviera
Department of Clinical Analysis, School of Pharmaceutical Sciences, São Paulo State University (Unesp), Araraquara, São Paulo, Brazil
Correspondence: Amanda Martins Baviera Department of Clinical Analysis
School of Pharmaceutical Sciences, São Paulo State University Rodovia Araraquara Jaú, Km 01 – s/n, Campos Ville, Araraquara, São Paulo CEP 14800-903, Brazil
Tel +55 16 3301 5717
Fax +55 16 3322 0073
Email [email protected]
Introduction: Oxidative stress and exacerbated generation of advanced glycation end products (AGEs) participate in the onset of diabetic complications. Lycopene is a potent antioxidant; evidence accounts for its ability to mitigate diabetic disturbances, including the deleterious events of advanced glycation. Therefore, this carotenoid has emerged as a candidate to be used in combination with antidiabetic drugs, such as metformin, attempting to counteract the glycoxidative stress. This study investigated the effects of the treatments with lycopene or metformin, alone or in combination, on glycoxidative stress biomarkers and antioxidant defenses in diabetic rats.
Methods: Streptozotocin-induced diabetic rats were treated for 35 days with lycopene (45 mg/kg) or metformin (250 mg/kg), alone or as mixtures in yoghurt. Plasma levels of glucose, triglycerides, cholesterol, thiobarbituric acid reactive substances and protein carbonyl groups (biomarkers of oxidative damage), fluorescent AGEs (biomarkers of advanced glycation), and paraoxonase 1 activity (antioxidant enzyme) were assessed. Changes in the hepatic and renal levels of glycoxidative damage biomarkers and the activities of antioxidant enzymes were investigated.
Results: The combination of lycopene with metformin maintained the beneficial effects of the isolated treatments, improving the glucose tolerance and lipid profile, lessening biomarkers of oxidative damage, and increasing the paraoxonase 1 activity. Besides, the combined therapy caused further decreases in postprandial glycemia, plasma levels of cholesterol and AGEs, avoided lipid peroxidation (plasma, kidney), and increased antioxidant defenses, mainly the activity of superoxide dismutase (liver, kidney), indicating the maintenance of the lycopene effects.
Conclusion: Lycopene combined with metformin may act synergistically in the control of postprandial glycemia, dyslipidemia and glycoxidative stress, as well as increased antioxidant defenses, arising as a promising therapeutic strategy to mitigate diabetic complications.
Keywords: diabetes mellitus, combined therapy, lycopene, paraoxonase, glycoxidative stress
Introduction
In recent years, there is a growing interest from the general population and the scientific community in the phytochemicals, which seems to be encouraged by great interest in improving health status, as well as to bring evidence about the effectiveness and safety of these phytochemicals as health accelerators. The pharmacological potentials of preparations from natural origin arise from the enormous diversity of metabolites, including polyphenols, carotenoids, terpenes, alkaloids, lignans, glucosinolates, cyanogenic glycosides, among others; as bioactive compounds, these metabolites have large spectra of physiological and biological functions.1 Advances in complementary medicine research bring evidence on the effectiveness of medicinal plants and bioactive compounds from natural origin in the treatment of diabetes mellitus (DM), gathering information about their antihyperglycemic activities that result from a variety of mechanisms of action, as well as provide clinical evidence about their effectiveness.2,3 In this regard, medicinal plants continue to be recognized as an important source of new drugs obtained directly or indirectly from them; when considering the therapy for diabetes, the main example is metformin.
Metformin (dimethylbiguanide; C4H11N5) is a synthetic derivative of galegine, a bioactive compound from Galega officinalis. Chemically, galegine is an isoprenyl derivative of guanidine, while metformin is a biguanide containing two coupled molecules of guanidine with additional substitutions.4 Metformin is the first-line drug used for the treatment of type 2 DM. Its blood-glucose-lowering effect occurs through the suppression of the hepatic glucose production mainly involving the inhibition of gluconeogenesis; in hepatocytes, metformin partially inhibits the mitochondrial respiratory chain complex I, resulting in decreased levels of adenosine triphosphate (ATP) and accumulation of adenosine monophosphate (AMP), which in turn activates the intracellular energy sensor AMP-activated protein kinase (AMPK) that inhibits the transcription of gluconeogenic genes.4,5
Although metformin as well as other oral antidiabetic drugs alongside insulin are usually effective, DM itself is a progressive disorder characterized by ongoing deterioration of energy metabolism regulation, and most therapies fail in both to maintain the long-term glycemic control and to reverse the course of diabetic complications. This scenario requires the need for gradual intensification of the therapy attempting to recover the tight glycemia management and consequently to reduce the risk of complications.6 One possibility is an increase in the metformin dose, which in turn can contribute to increasing the risk of adverse events. Metformin intolerance occurs in up to 20% of patients, being characterized by gastrointestinal manifestations (abdominal pain, nausea, diarrhea, and vomiting) that have been cited as the main causes of therapy discontinuation.5 Because metformin is excreted by kidneys, caution is also advised in individuals with chronic kidney disease (CKD); the risk of adverse effects increases with CKD, including lactic acidosis and gastrointestinal manifestations.7 Another possibility to improve blood glucose management is the use of strategies based on combined therapies.
In this regard, it has gained attention the combined therapies between natural bioactive compounds and conventional antidiabetic drugs, since they could significantly improve the glycemic control in DM as well as be helpful to mitigate the complications that accompany this disease.8,9 Additionally, some natural bioactive compounds have antioxidant and antiglycation activities; they act by inhibiting the formation of reactive oxygen species (ROS) and advanced glycation end products (AGEs) mainly through scavenging their precursors or removing their initiators, as well as stimulating endogenous systems involved in the detoxification of ROS and AGEs.10,11 Natural compounds are also often capable of lessening dyslipidemia in metabolic dysfunctions, including obesity and DM.12 These actions apparently make them interesting candidates for combined therapies approaches attempting to mitigate the disturbances and complications observed in diabetes.
Lycopene (C40H56) is the major carotenoid found in tomatoes and other red fruits and vegetables; it is a linear polyene hydrocarbon that contains 11 conjugated and two unconjugated double bonds.13 The antioxidant properties of lycopene are associated with its ability to deactivate (quench and scavenge) ROS.14 Supplementations with lycopene or lycopene-rich foods have attracted significant attention due to their multiple benefits to health, offering protection against various metabolic disturbances, including cardiovascular diseases and type 2 DM.14,15 There is also growing evidence about the lycopene ability to mitigate events related to advanced glycation.16,17 For all these reasons, lycopene has emerged as an interesting natural bioactive compound to be used in combination with metformin.
The current study aimed to investigate the effects of lycopene combined with metformin on various biomarkers related to metabolic disturbances, glycoxidative stress, and antioxidant defenses in streptozotocin-induced diabetic rats.
Materials and Methods
Induction of Diabetes Mellitus and Experimental Design
Male Wistar rats (Rattus norvegicus) weighing 140–160 g (6 weeks old) were maintained in polypropylene cages throughout the experimental period, except on day 0 and day 35, where they were kept into individual metabolic cages. The animals were housed under controlled conditions of temperature (23 ± 1°C) and humidity (55 ± 5%) and with a 12 h light/dark cycle. Rats received water and standard chow diet (Presence Nutrição Animal, Paulínia, SP, Brazil) throughout the experimental period. The Committee for Ethics in Animal Experimentation at the School of Pharmaceutical Sciences, Unesp, Araraquara approved the experimental procedures of this study (CEUA/FCF/CAr resolution number 23/2017).
After an acclimation period, experimental type 1 DM was induced by a single intravenous injection of 40 mg/kg streptozotocin (STZ; Sigma Aldrich, St. Louis, MO, USA) dissolved in 0.01 M citrate buffer (pH 4.5), in previously 12 hours fasted rats. Normal, non-diabetic rats received only citrate buffer. For this procedure, all rats were previously anesthetized by isoflurane inhalation.
Three days after the STZ administration, rats with postprandial glycemia levels of approximately 400 mg/dL were used to compose the diabetic groups. This constituted the “day 0” of the experiment, after which began the treatments with insulin, lycopene and metformin, alone or in combination.
Diabetic rats were divided into five experimental groups (10 rats/group) by matching specimens having similar values of body weight and glycemia, as follows: diabetic rats treated with yoghurt (DYOG); diabetic rats treated with 250 mg/kg metformin in yoghurt (DMET); diabetic rats treated with 45 mg/kg lycopene in yoghurt (DLYC); diabetic rats treated with 250 mg/kg metformin + 45 mg/kg lycopene in yoghurt (DML); diabetic rats treated with 4U insulin (DINS). Normal rats were treated with yoghurt (NYOG) and kept as controls.
Tomato extract powder (Lycopersicon esculentum Mill., 10.13% lycopene, PHD Innovation Expertise Indústria de Insumos Farmacêuticos Ltda, São Paulo, SP, Brazil) and metformin (99.56% metformin hydrochloride, Gemini Indústria de Insumos Farmacêuticos Ltda, Anápolis, GO, Brazil) were mixed with commercial plain yoghurt (170 g of yoghurt contains 9.1 g carbohydrates, 6.8 g protein, 7.0 g total fat, 126 kcal, Nestlé®, Brazil), alone or in combination, using a homogenizer (27,000 rpm) for 90 seconds at a controlled ambient temperature (25 °C). All the treatments were administered by half-dose twice a day, at 08:00 h and 17:00 h, for 35 days. Lycopene and/or metformin were administered by gavage (22.5 mg/kg for lycopene and 125 mg/kg for metformin) in 0.5 mL of yoghurt (totalizing 1.0 mL/day). Doses of lycopene and metformin were chosen according to Assis et al18 and Roxo et al19 respectively. Insulin was also given twice a day, as subcutaneous injections (2U insulin per injection, Humulin® N, U-100, Eli Lilly do Brasil Ltda., São Paulo, SP, Brazil).
During the experimental period, body weight was assessed weekly, and postprandial glycemia at days 0, 10, 20 and 35. Postprandial glycemia was considered the glycemia monitored in non-fasted rats fed a standard chow diet, in plasma obtained from blood samples collected 2 hours after the administration of the morning treatments. On day 0 and day 35, food and water intake and urinary volume were monitored for the whole 24 h.
The OGTT was performed on day 29 after the rats were made to fast for 12 h. The blood glucose levels were measured before (0 min; fasting glycemia) and after (15, 30, 60, 90, and 120 min) the glucose challenge administered as oral gavage with glucose (2.5 g/kg) at 9:00 a.m. Glycemia in the OGTT and the postprandial glycemia levels monitored throughout the experimental period were measured in plasma obtained from blood samples collected from the tip of the tail in heparinized tubes (Hemofol®, 5000 UI/mL, Cristália Produtos Químicos Farmacêuticos Ltda, Itirapina, SP, Brazil). Glycemia levels were measured using the glucose oxidase method by commercial kit (Labtest Diagnóstica S.A., Lagoa Santa, MG, Brazil).
After 35 days of treatment, rats were euthanized by decapitation and blood samples were collected for the analysis of plasma levels of glucose, triglycerides, total cholesterol, high-density lipoprotein-cholesterol (HDL-cholesterol) (Labtest Diagnóstica S.A., Lagoa Santa, MG, Brazil) and for the measurement of biomarkers related to glycoxidative damage: thiobarbituric acid reactive substances (TBARS), protein carbonyl groups (PCO), and fluorescent AGEs, as well as the activity of the antioxidant enzyme paraoxonase 1 (PON 1). White adipose tissues (retroperitoneal and epididymal) and skeletal muscles (soleus and extensor digitorum longus, EDL) were immediately removed and weighed. Liver and kidneys were carefully removed and stored at −80 °C for the subsequent analysis of the biomarkers of glycoxidative damage (TBARS, PCO, and fluorescent AGEs), activities of antioxidants enzymes (superoxide dismutase, SOD; catalase, CAT; glutathione peroxidase, GSH-Px; glutathione reductase, GSH-Rd), and levels of non-protein sulfhydryl groups (NPSH).
Determination of Antioxidant Enzymes and Metabolites
PON 1 Activity
The activity of PON 1 was measured in plasma by monitoring the absorbance (405 nm) of p-nitrophenol, according to Assis et al.18 The p-nitrophenol is released from the hydrolysis of paraoxon by the catalytic action of PON 1. The PON 1 activity was expressed in terms of units/liter (unit = μmoL paraoxon hydrolyzed/min).
Sample Preparation for the Analysis of SOD, CAT, GSH-Px, and GSH-Rd
The activities of antioxidant enzymes were measured in liver and kidneys. Liver and kidneys (0.1 g) were homogenized in 1 mL sodium phosphate buffer (10 mmol/L, pH 7.4) at 4 °C. The homogenates were centrifuged at 10,000 g for 10 min at 4 °C, and the supernatants were used for the analysis of the antioxidant enzymes. The protein levels in tissue supernatants were determined according to Lowry et al20 for the correction of the results related to SOD, CAT, GSH-Px, and GSH-Rd activities.
SOD Activity
The SOD activity was measured by monitoring the inhibition of the nitroblue tetrazolium chloride (NBT) reduction.21 Xanthine oxidation by xanthine oxidase generates superoxide anion radical, which reduces the NBT. The SOD enzyme present in the sample catalyzes the dismutation of superoxide anion radicals, inhibiting the NBT reduction, which is monitored spectrophotometrically at 550 nm. The results were expressed in terms of U/mg protein. One unit of SOD is defined as the enzyme amount required to inhibit the rate of NBT reduction by 50%.
CAT Activity
The CAT activity was measured by monitoring the consumption of hydrogen peroxide (H2O2) spectrophotometrically at 230 nm.22 The results were expressed in terms of mmol of H2O2 consumed/min/mg protein.
GSH-Px Activity
The GSH-Px activity was measured by monitoring the oxidation of nicotinamide adenine dinucleotide phosphate, reduced form (NADPH) to NADP+.23 In the presence of H2O2, GSH‐Px catalyzes the oxidation of the metabolite glutathione (GSH). The glutathione in its oxidized form (GSSG) is reduced to GSH by the catalytic action of GSH-Rd, with the concomitant oxidation of NADPH to NADP+, which is monitored spectrophotometrically at 340 nm. The results were expressed in terms of mmol of NADPH oxidized/min/mg protein.
GSH-Rd Activity
The GSH-Rd activity was measured by monitoring the oxidation of NADPH to NADP+.24 The enzyme GSH-Rd reduces the GSSG to GSH, with concomitant oxidation of NADPH to NADP+, which is monitored spectrophotometrically at 340 nm. The results were expressed in terms of mmol of NADPH oxidized/min/mg protein.
NPSH Groups
NPSH groups represent an indirect measurement of the antioxidant metabolite GSH. Liver and kidneys (0.1 g) were homogenized in 1 mL ethylenediaminetetraacetic acid (EDTA) (0.02 mol/L) at 4 °C. Proteins were precipitated by adding trichloroacetic acid (5%) followed by centrifugation at 1574 g for 15 min at 4 °C. The levels of NPSH groups were evaluated in supernatants by the reduction of 5,5-dithiobis-(2-nitrobenzoic acid) monitored spectrophotometrically (412 nm).25 Results were expressed in terms of mmol/mg tissue.
Biomarkers of Glycoxidative Stress
Sample Preparation
The levels of TBARS (biomarkers of lipid peroxidation), PCO (biomarker of protein oxidation), and fluorescent AGEs (biomarkers of advanced glycation) were measured in plasma, liver and kidneys.
For liver and kidneys, samples were prepared by homogenization at 4 °C with the following solutions: (i) TBARS: tissue samples (0.25 g) were homogenized in 1 mL potassium chloride (1.15%); (ii) PCO: tissue samples (0.2 g) were homogenized in 1 mL sodium phosphate buffer (50 mmol/L, pH 6.7 with EDTA 1 mmol/L); (iii) fluorescent AGEs: tissue samples (0.1 g) were homogenized in 1 mL sodium phosphate buffer (10 mmol/L, pH 7.4). Homogenates were centrifuged at 10,000 g for 10 min at 4 °C, and the supernatants were used for the analysis of the glycoxidative stress biomarkers. The protein levels (plasma or tissue supernatants) were measured according to Lowry et al20 for the correction of the results related to PCO and fluorescent AGEs.
TBARS
Lipid peroxidation products were measured by the thiobarbituric acid (TBA) test.26 TBA reacts mainly with malondialdehyde, which generates products (TBARS) whose levels were measured spectrophotometrically (535 nm) in liver and kidneys, or spectrofluorometrically (excitation and emission wavelengths of 510 nm and 553 nm, respectively) in plasma. The results were expressed in terms of µmol/L (plasma) and nmol/g tissue (liver and kidneys).
PCO Groups
The PCO levels were measured by monitoring the generation of 2,4-dinitrophenylhydrazone at 370 nm, after the reaction of the carbonyl groups in the oxidized proteins with 2,4-dinitrophenylhydrazine.27 The results were expressed in terms of nmol/mg protein.
Fluorescent AGEs
The fluorescent AGEs were measured according to Costa et al.28 Briefly, plasma and liver samples (see Sample preparation) were treated with trichloroacetic acid, chloroform, and sodium hydroxide; kidney samples (see Sample preparation) were treated with sodium hydroxide. After centrifugation at 10,000 g for 10 min at 10 °C, supernatants were used for the estimation of the fluorescent AGEs, with excitation and emission wavelengths of 370 nm and 440 nm, respectively. The results were expressed in terms of arbitrary units (AU) of fluorescence/mg protein.
Statistical Analysis
Data were expressed as mean ± standard error of mean (SEM). One-way analysis of variance (ANOVA) followed by Student-Newman-Keuls test was used to compare the inter-group differences. Paired Student’s t-test was used to compare the intra-group changes, relative to day 0. Data were considered statistically different at p<0.05. Statistical analyses were performed using the program GraphPad Prism 6.01 (GraphPad Software, San Diego, California, USA).
Results
Body and Tissue Weights and Physiological Parameters
After 35 days of experiment, DYOG rats had the lowest values of body weight (Table 1), as well as the minor weights of skeletal muscles and white adipose tissues (Table 2); low values of body weight gain were also observed in DYOG rats. These findings reconfirm a feature of this experimental model of type 1 DM (STZ-induced diabetic rats), the catabolic profile due to insulin deficiency. In comparison with NYOG rats, DYOG rats also had polyphagia, polydipsia, and polyuria (Table 1), which are also classical features of this experimental model of diabetes.
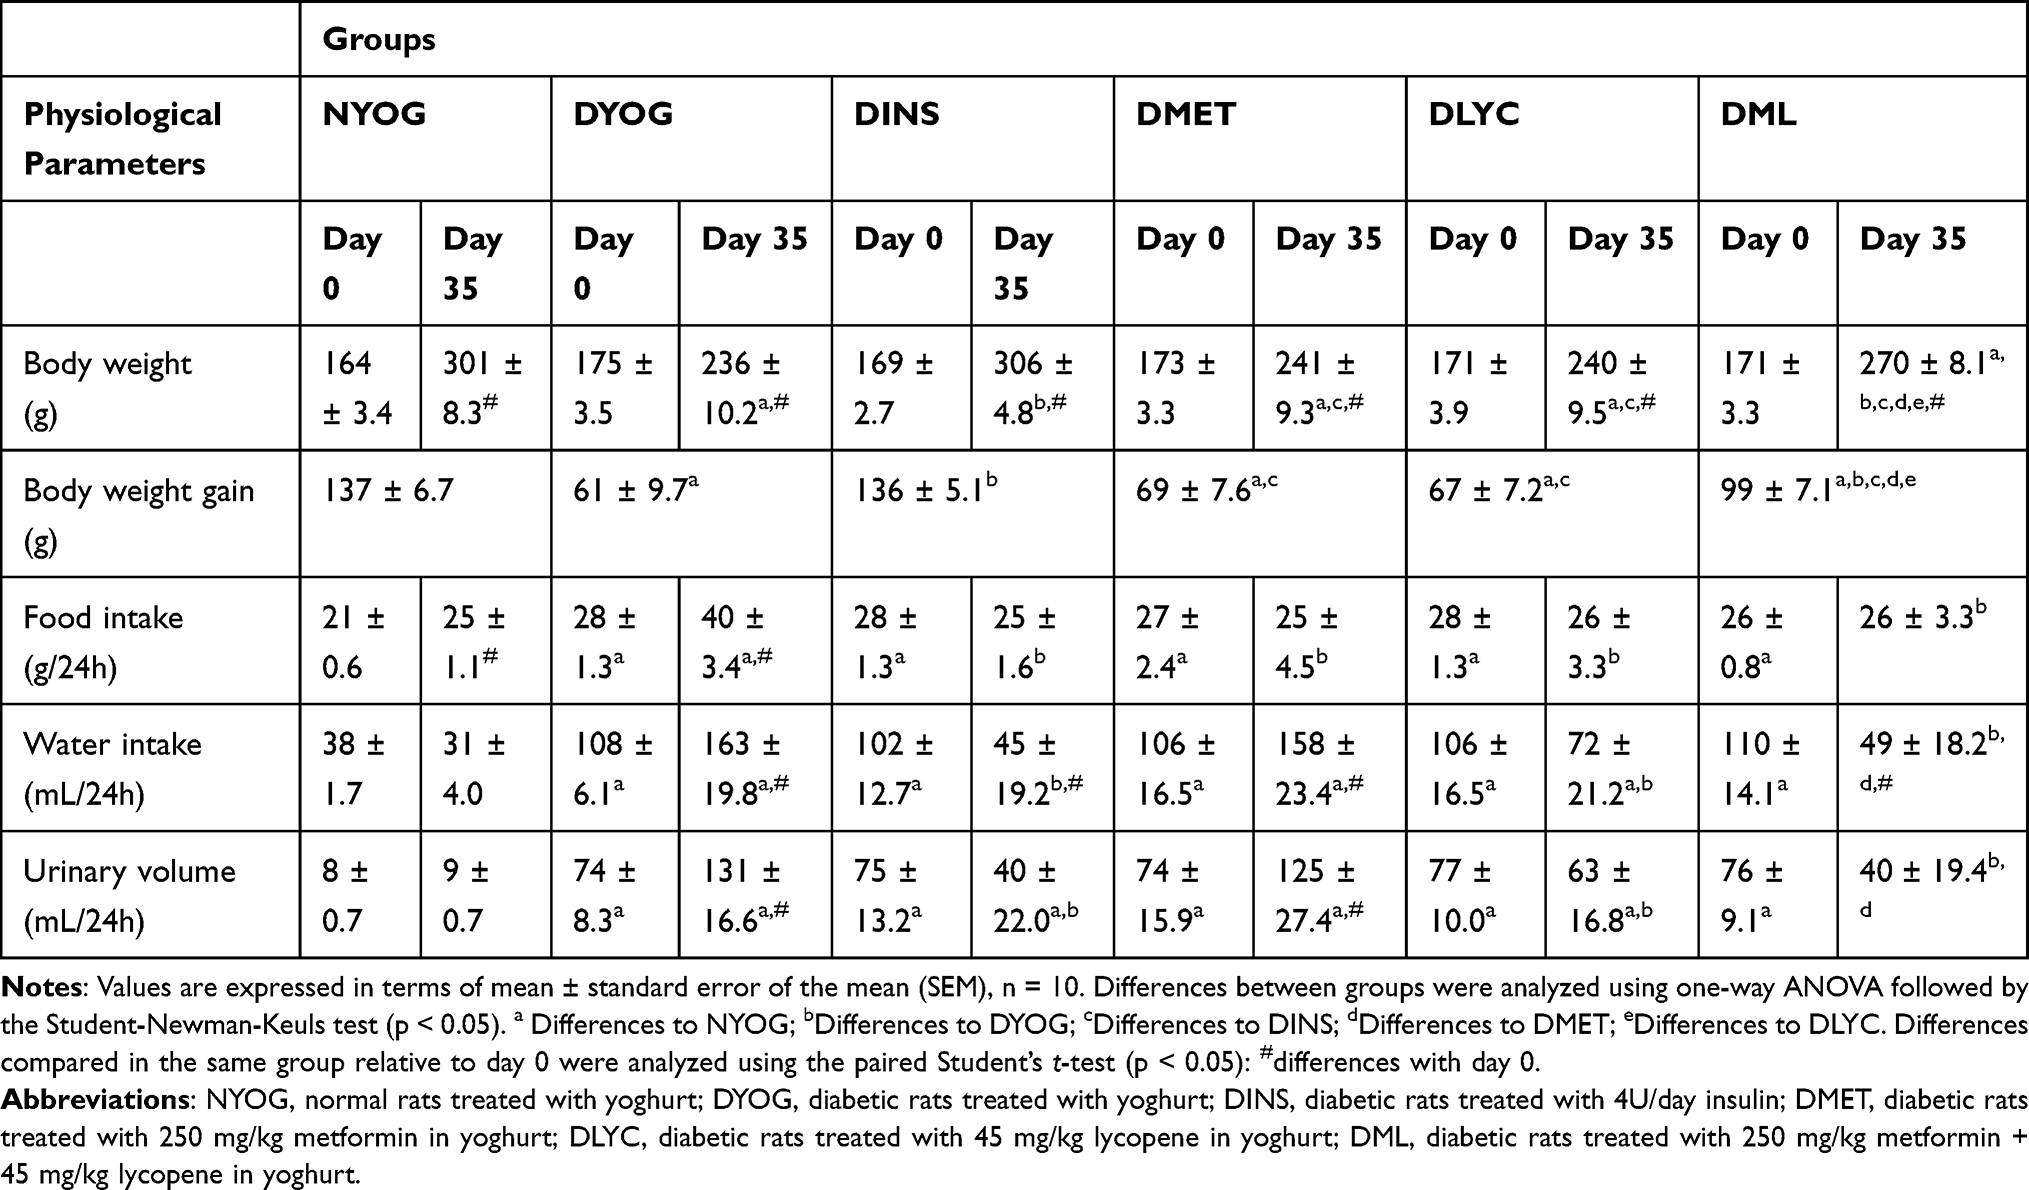 |
Table 1 Physiological Parameters (Body Weight, Body Weight Gain from Day 0 to Day 35, Food Intake, Water Intake, Urinary Volume) of Streptozotocin-Induced Diabetic Rats Before (Day 0) and After (Day 35) Treatments with Yoghurt Enriched with Lycopene, Alone or in Combination with Metformin |
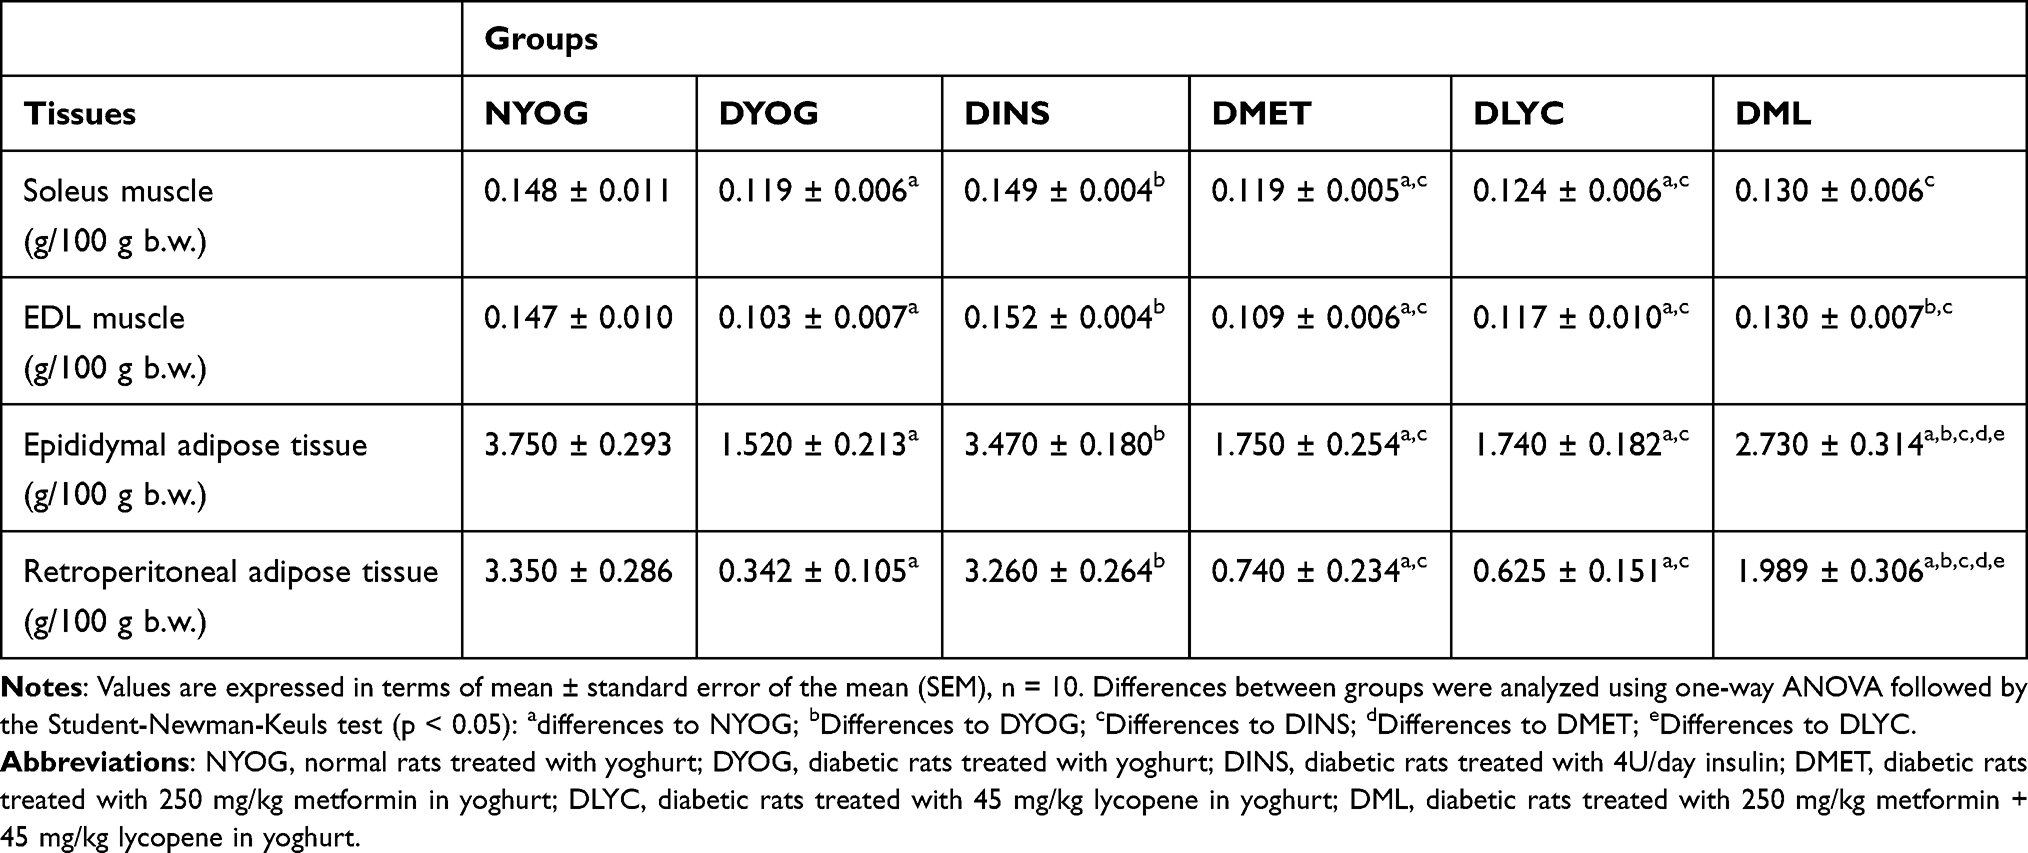 |
Table 2 Weights of Skeletal Muscles (Soleus, EDL) and White Adipose Tissues (Epididymal, Retroperitoneal) of Streptozotocin-Induced Diabetic Rats Treated for 35 Days with Yoghurt Enriched with Lycopene, Alone or in Combination with Metformin |
The treatment of diabetic rats with insulin (DINS group) avoided the loss of weights by tissues. The values of body weight gain, terminal body weight values (Table 1) and weights of adipose tissues and skeletal muscles (Table 2) of DINS group were similar to the corresponding values in NYOG group. The values of food and water intake and urinary volume of DINS rats were significantly decreased after 35 days of treatment (Table 1).
The treatments of diabetic rats with metformin (DMET group) or with lycopene (DLYC group) did not improve the body weight gain (Table 1), as well as did not avoid the loss of weights by skeletal muscles and adipose tissues (Table 2). The treatment with metformin did not reduce the water intake and urinary volume of diabetic rats, but reduced the food intake compared to DYOG rats (Table 1). The treatment with lycopene was more effective than metformin in ameliorating the physiological parameters, since reduced the water intake and urinary volume of diabetic rats, as well as decreased the food intake (Table 1).
Many benefits were reached by combining metformin and lycopene to treat diabetic rats (DML group). The treatment of diabetic rats with metformin + lycopene reduced the loss of weights by EDL muscles and white adipose tissues (Table 2), although with less efficiency compared to the insulin treatment. The improvements in the tissue weights caused a marginal increase in the body weight gain, leading to an increase in the terminal values of body weight of DML rats, which was higher than the values of DMET and DLYC rats but lower than those of DINS rats (Table 1). Rats of DML group had a reduction in the food intake, in a similar way to the corresponding values in rats treated with metformin or lycopene alone (Table 1). The treatment with metformin + lycopene promoted further reductions in the water intake and urinary volume of diabetic rats, and reached values similar to those of DINS rats (Table 1).
Postprandial and Fasting Glycemia and Glucose Tolerance
At day 0, ie, before the beginning of the treatments and 3 days after the STZ administration, all groups composed of diabetic rats started the experiment with medium postprandial glycemia values of approximately 400 mg/dL (Figure 1A). Throughout the experimental period, DYOG rats had significant increases in the glycemia, reaching medium values of 550 mg/dL after 35 days (Figure 1A), evidencing the worsening of DM (Figure 1B). After 29 days of experiment, DYOG rats had fasting glycemia values 4-fold higher than those of NYOG rats (Figure 1C). In addition, after 29 days of experiment, it can be observed that DYOG rats had glucose intolerance (Figure 1E). In the OGTT, 30 minutes after the glucose overload, the hyperglycemia peak developed by the DYOG group was significantly higher (4-fold; Figure 1D) than that of the NYOG group. After 120 minutes, DYOG rats did not correct the glycemia (390.5 ± 15 mg/dL) with the same efficiency as the NYOG rats (79.9 ± 4 mg/dL) (Figure 1D).
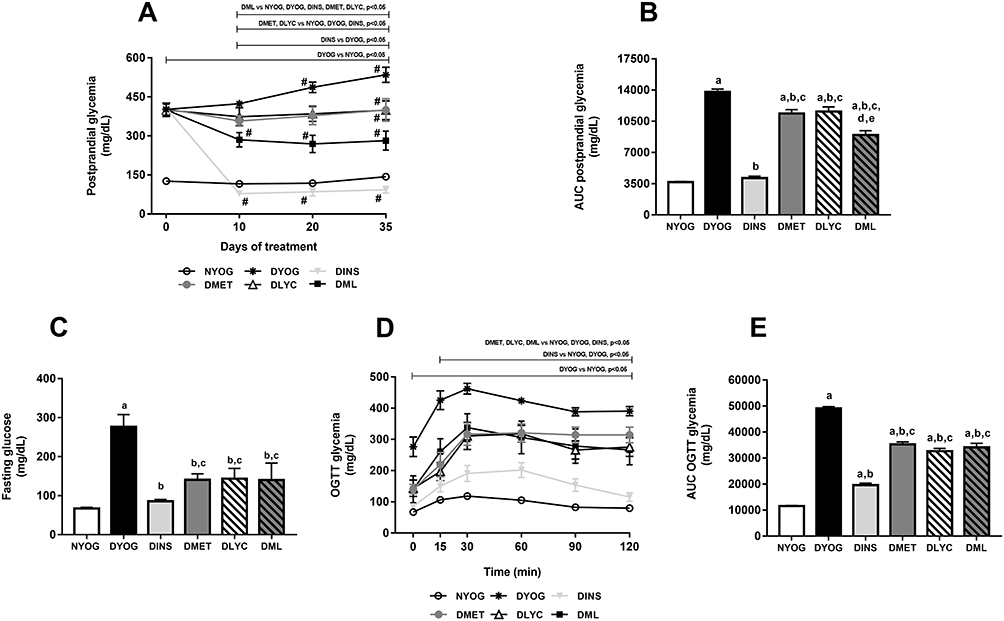 |
Figure 1 Postprandial glycemia, fasting glycemia and glucose tolerance of streptozotocin-induced diabetic rats treated for 35 days with yoghurt enriched with lycopene, alone or in combination with metformin. Temporal responses of postprandial glycemia (A), area under the curve (AUC) of postprandial glycemia (B), fasting glycemia (C), oral glucose tolerance test (OGTT) (D), AUC of glycemia in OGTT (E). Values are expressed in terms of mean ± standard error of the mean (SEM), n = 10. Differences between groups were analyzed using one-way ANOVA followed by the Student-Newman-Keuls test (p < 0.05). aDifferences to NYOG; bDifferences to DYOG; cDifferences to DINS; dDifferences to DMET; eDifferences to DLYC. Differences compared in the same group relative to day 0 were analyzed using the paired Student’s t-test (p < 0.05): #differences with day 0. Abbreviations: NYOG, normal rats treated with yoghurt; DYOG, diabetic rats treated with yoghurt; DINS, diabetic rats treated with 4U/day insulin; DMET, diabetic rats treated with 250 mg/kg metformin in yoghurt; DLYC, diabetic rats treated with 45 mg/kg lycopene in yoghurt; DML, diabetic rats treated with 250 mg/kg metformin + 45 mg/kg lycopene in yoghurt. |
The treatment of diabetic rats with insulin significantly reduced the postprandial glycemia (Figure 1A), whose levels were similar to those of NYOG rats (Figure 1B). Insulin also improved the fasting glycemia (Figure 1C) and the glucose tolerance (Figure 1E) of diabetic rats, since the glycemia values after the glucose challenge were significantly decreased in DINS group (Figure 1D).
The treatments of diabetic rats with metformin or with lycopene, individually, lessened the progressive increase in the postprandial glycemia levels compared to DYOG rats (Figure 1A), showing that both treatments improved the glycemia control, although less efficiently than the treatment with insulin (Figure 1B). The treatments with metformin or lycopene alone also reduced the fasting glycemia levels (Figure 1C) and promoted decreases in the glucose intolerance (Figure 1D and E).
By combining metformin and lycopene, improvements were reached in the glycemia management, mainly the postprandial glycemia. The treatment of diabetic rats with metformin + lycopene promoted a significant reduction in the postprandial glycemia, whose levels were minor than those of DYOG, DMET and DLYC rats (Figure 1A), which represents a synergistic effect on the glycemia reduction (Figure 1B) and demonstrates that the combined therapy was more effective than the isolated treatments. Fasting glycemia levels were decreased in DML rats, whose levels were similar to the corresponding values in DMET and DLYC groups (Figure 1C). In the OGTT, the glycemia profile of diabetic rats treated with metformin + lycopene was improved in comparison to DYOG rats, being the combined therapy as efficiently as the treatments with metformin or lycopene alone (Figure 1D), suggesting maintenance of the effects of the isolated therapies (Figure 1E).
The synergistic effect of metformin + lycopene was observed in the postprandial glycemia of STZ-induced diabetic rats, but not in the glycemia monitored during OGTT. Postprandial hyperglycemia is often assumed in individuals with high glucose excursions during OGTT; however, the relationship between the glucose levels monitored after the OGTT and after the ingestion of a mixed meal remains unclear. According to Meier et al29 a great variety of influencing factors must be considered when glucose excursions post-OGTT are used to access the postprandial hyperglycemia, including: (i) the gastric emptying of liquid meals, such as the glucose solution used in the OGTT, which is more rapid than that of a solid meal; the oral glucose overload generates a non-physiological inflow of glucose into the duodenum and causes a peak glucose excursion greater than that of a mixed meal ingestion; (ii) the relative protein and fat contents of a mixed meal delay the glucose intestinal absorption, producing a shallow pattern of postprandial glucose excursions; (iii) the secretion of gastrointestinal incretin hormones, which is faster and more pronounced after an isolated glucose challenge than after the ingestion of a mixed meal. Collectively, these factors may help explain, at last partially, the different glycemic response profiles between the OGTT and the monitoring of the postprandial glycemia in diabetic rats, the latter favored the observation of the synergistic effects of metformin + lycopene on the glycemia management.
Lipid Profile
After 35 days of experiment, dyslipidemia was observed in DYOG rats, since they had increased plasma levels of triglycerides (Figure 2A) and total cholesterol (Figure 2B). Although the HDL-cholesterol levels were decreased in DYOG rats after 35 days of experiment, the same occurred with normal, NYOG rats, as well as with all groups of treated-diabetic rats (Figure 2C) in comparison with values of day 0, which can be interpreted as a change probably related to the age of the animals.
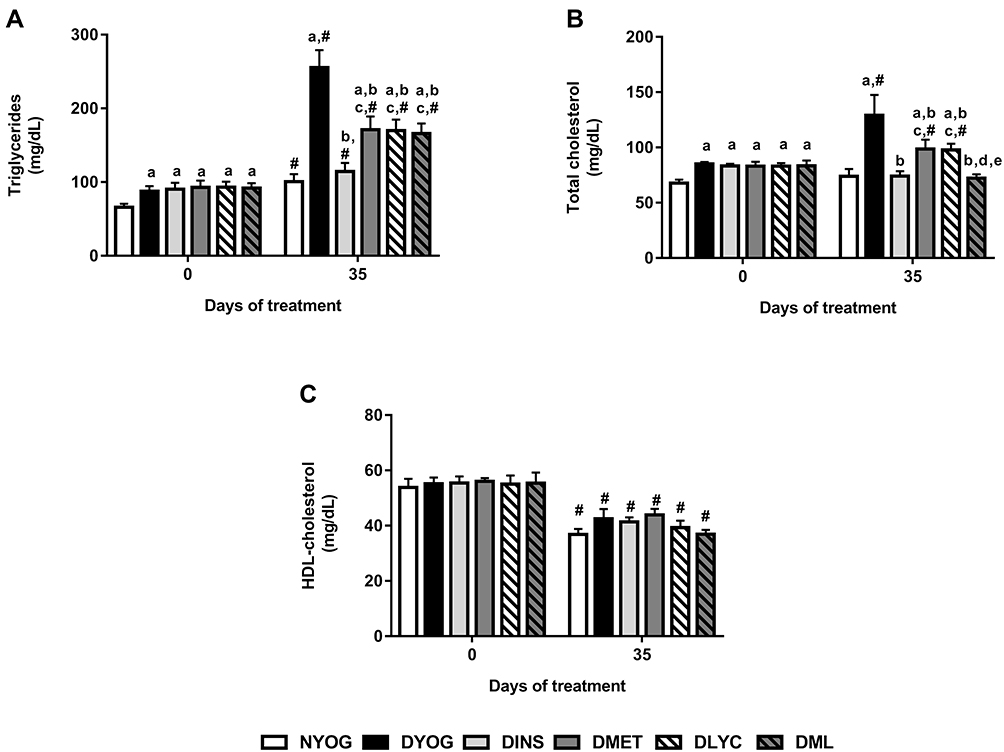 |
Figure 2 Lipid profile of streptozotocin-induced diabetic rats before (day 0) and after (day 35) treatments with yoghurt enriched with lycopene, alone or in combination with metformin. Triglycerides (A), total cholesterol (B), HDL-cholesterol (C). Values are expressed in terms of mean ± standard error of the mean (SEM), n = 10. Differences between groups were analyzed using one-way ANOVA followed by the Student-Newman-Keuls test (p < 0.05); aDifferences to NYOG; bDifferences to DYOG; cDifferences to DINS; dDifferences to DMET; eDifferences to DLYC. Differences compared in the same group relative to day 0 were analyzed using the paired Student’s t-test (p < 0.05): #differences with day 0. Abbreviations: NYOG, normal rats treated with yoghurt; DYOG, diabetic rats treated with yoghurt; DINS, diabetic rats treated with 4U/day insulin; DMET, diabetic rats treated with 250 mg/kg metformin in yoghurt; DLYC, diabetic rats treated with 45 mg/kg lycopene in yoghurt; DML, diabetic rats treated with 250 mg/kg metformin + 45 mg/kg lycopene in yoghurt. |
Once again, the treatment of diabetic rats with insulin showed its effectiveness on improve the metabolic disturbances in STZ-induced diabetic rats, since DINS rats had low levels of triglycerides (Figure 2A) and total cholesterol (Figure 2B), reaching values similar to the corresponding values in NYOG rats.
In comparison with DYOG rats, low plasma levels of triglycerides (Figure 2A) and total cholesterol (Figure 2B) were found in diabetic rats treated with metformin or lycopene, alone, although these levels still remained higher than those of DINS and NYOG rats.
The effects of the combined therapy between metformin and lycopene on plasma lipid levels were interesting: while the treatment with metformin + lycopene reduced the triglycerides levels in a similar extend to the isolated treatments (Figure 2A), its effect on decreasing the total cholesterol levels was better than those of the isolated treatments (Figure 2B), suggesting a synergistic effect, which was sufficient to reduce the total cholesterol levels with the same efficiency as the insulin treatment.
Biomarkers of Glycoxidative Damage and Antioxidant Defenses in Plasma
After 35 days of experiment, DYOG rats had increases in the plasma levels of TBARS (Figure 3A), PCO (Figure 3B), and fluorescent AGEs (Figure 3C), as well as a decrease in the activity of the antioxidant enzyme PON 1 (Figure 3D), suggesting the onset of the glycoxidative stress in STZ-induced diabetic rats. The treatment of diabetic rats with insulin prevented all these changes.
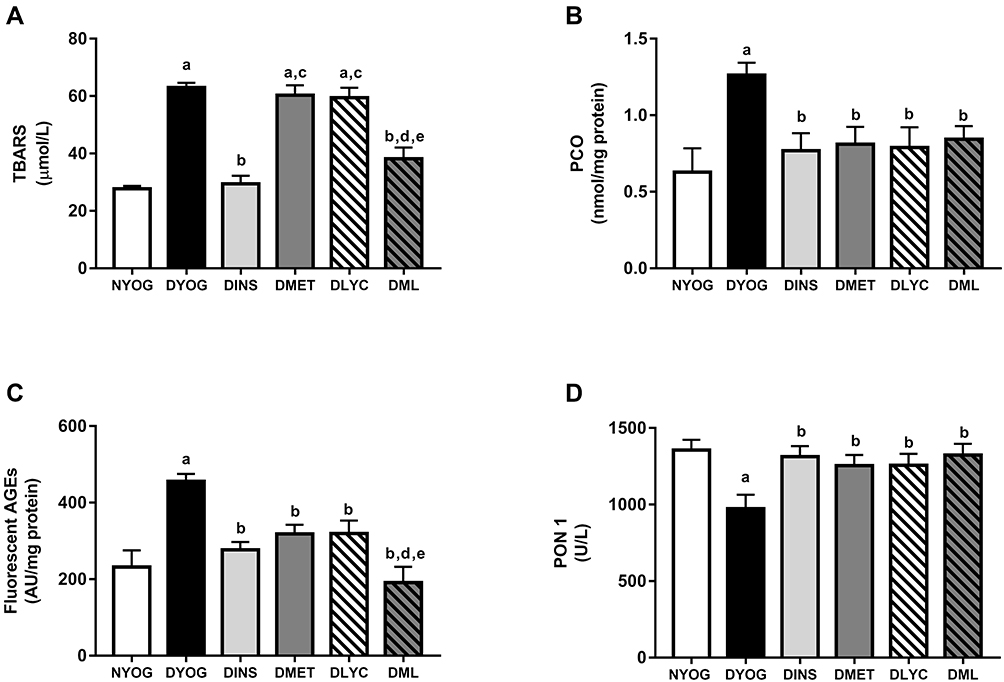 |
Figure 3 Glycoxidative stress biomarkers and antioxidant defenses in plasma of streptozotocin-induced diabetic rats treated for 35 days with yoghurt enriched with lycopene, alone or in combination with metformin. Levels of TBARS (A), PCO (B), fluorescent AGEs (C), PCO (C), activity of PON 1 (D). Values are expressed in terms of mean ± standard error of the mean (SEM), n = 10. Differences between groups were analyzed using one-way ANOVA followed by the Student-Newman-Keuls test (p < 0.05): aDifferences to NYOG; bDifferences to DYOG; cDifferences to DINS; dDifferences to DMET; eDifferences to DLYC. Abbreviations: NYOG, normal rats treated with yoghurt; DYOG, diabetic rats treated with yoghurt; DINS, diabetic rats treated with 4U/day insulin; DMET, diabetic rats treated with 250 mg/kg metformin in yoghurt; DLYC, diabetic rats treated with 45 mg/kg lycopene in yoghurt; DML, diabetic rats treated with 250 mg/kg metformin + 45 mg/kg lycopene in yoghurt. |
Although the treatments of diabetic rats with metformin or lycopene, individually, were not able to reduce the plasma levels of TBARS (Figure 3A), they reduced the plasma levels of PCO (Figure 3B) and AGEs (Figure 3C), and also increased the activity of PON 1 (Figure 3D) in a similar magnitude to that of insulin.
The combined therapy of metformin and lycopene aggregated benefits on lessening the glycoxidative stress in STZ-induced diabetic rats, since the plasma levels of TBARS were decreased in DML rats, a beneficial effect that was not observed when diabetic rats were treated with metformin or lycopene alone (Figure 3A). In addition, a further decrease was observed in the plasma levels of fluorescent AGEs in DML rats, whose levels were lower than those of DMET or DLYC rats (Figure 3C). Lastly, the beneficial effects of metformin or lycopene alone were maintained in the combined therapy, ie, metformin + lycopene reduced the plasma levels of PCO (Figure 3B) and increased the PON 1 activity (Figure 3D).
Antioxidant Defenses in Liver and Kidney
Besides the impairments in the activity of PON 1 in plasma, the levels of enzymes and metabolites that participate in the detoxification of ROS were affected in liver and kidneys of STZ-induced diabetic rats, suggesting the onset of oxidative stress in these tissues. After 35 days of experiment, DYOG rats had decreases in the activities of the antioxidant enzymes SOD (liver and kidney, Figures 4A and 5A, respectively) and CAT (liver and kidney, Figures 4B and 5B, respectively). DYOG rats also had decreases in the hepatic (Figure 4E) and renal (Figure 5E) levels of NPSH, which indirectly estimate the levels of GSH, an antioxidant metabolite. Notably, DYOG rats had increases in the activities of GSH-Px and GSH-Rd in liver (Figure 4C and 4D, respectively) and kidney (Figure 5C and, respectively) compared to the corresponding values in NYOG rats, which could be a compensatory mechanism against oxidative stress. The treatment with insulin avoided all these alterations in the antioxidant defenses in liver and kidneys of diabetic rats (Figures 4 and 5, respectively).
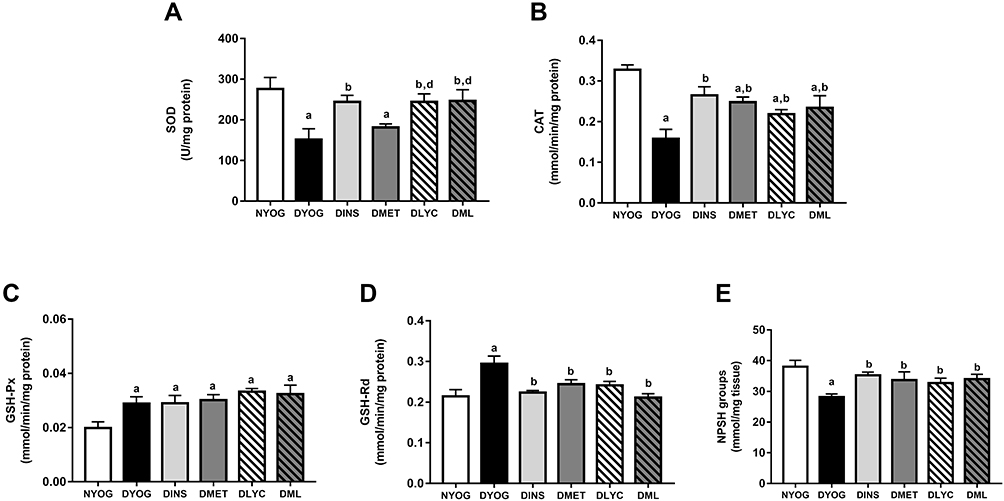 |
Figure 4 Antioxidant defenses in liver of streptozotocin-induced diabetic rats treated for 35 days with yoghurt enriched with lycopene, alone or in combination with metformin. Activities of the enzymes SOD (A), CAT (B), GSH-Px (C), and GSH-Rd (D), levels of NPSH groups (E). Values are expressed in terms of mean ± standard error of the mean (SEM), n = 10. Differences between groups were analyzed using one-way ANOVA followed by the Student-Newman-Keuls test (p < 0.05): aDifferences to NYOG; bDifferences to DYOG; ddifferences to DMET. Abbreviations: NYOG, normal rats treated with yoghurt; DYOG, diabetic rats treated with yoghurt; DINS, diabetic rats treated with 4U/day insulin; DMET, diabetic rats treated with 250 mg/kg metformin in yoghurt; DLYC, diabetic rats treated with 45 mg/kg lycopene in yoghurt; DML, diabetic rats treated with 250 mg/kg metformin + 45 mg/kg lycopene in yoghurt. |
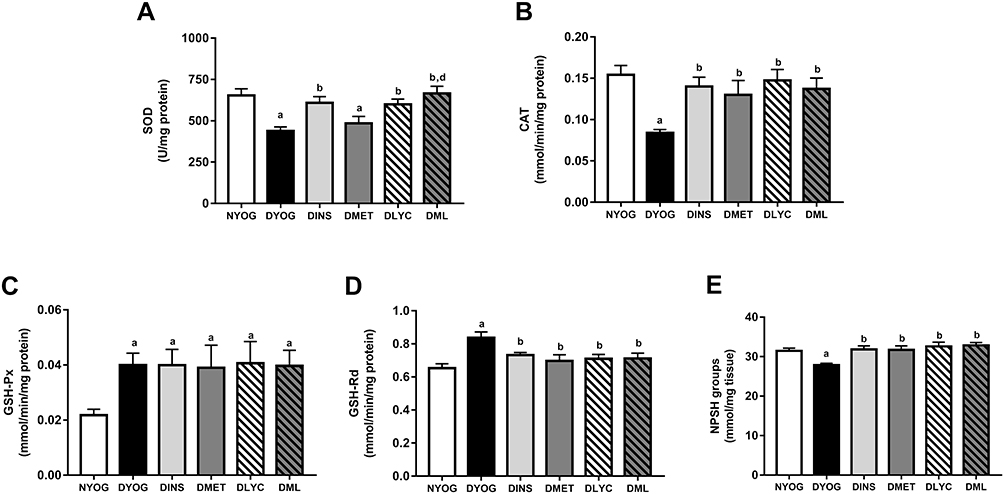 |
Figure 5 Antioxidant defenses in kidney of streptozotocin-induced diabetic rats treated for 35 days with yoghurt enriched with lycopene, alone or in combination with metformin. Activities of the enzymes SOD (A), CAT (B), GSH-Px (C), and GSH-Rd (D), levels of NPSH groups (E). Values are expressed in terms of mean ± standard error of the mean (SEM), n = 10. Differences between groups were analyzed using one-way ANOVA followed by the Student-Newman-Keuls test (p < 0.05): aDifferences to NYOG; bDifferences to DYOG; dDifferences to DMET. Abbreviations: NYOG, normal rats treated with yoghurt; DYOG, diabetic rats treated with yoghurt; DINS, diabetic rats treated with 4U/day insulin; DMET, diabetic rats treated with 250 mg/kg metformin in yoghurt; DLYC, diabetic rats treated with 45 mg/kg lycopene in yoghurt; DML, diabetic rats treated with 250 mg/kg metformin + 45 mg/kg lycopene in yoghurt. |
When considering the efficacies of the isolated treatments with metformin or lycopene, it can be observed that lycopene was better than metformin in mitigating the oxidative stress in diabetic rats. The treatment of diabetic rats with metformin alone did not improve the activity of SOD in liver (Figure 4A) or kidney (Figure 5A), but increased the activity of CAT (liver and kidney, Figures 4B and 5B, respectively) and the levels of NPSH (liver and kidney, Figures 4E and 5E, respectively). On the other hand, the treatment with lycopene alone increased the activities of both enzymes SOD (liver and kidney, Figures 4A and 5A, respectively) and CAT (liver and kidney, Figures 4B and 5B, respectively) in tissues of diabetic rats, as well as caused increases in NPSH levels (liver and kidney, Figures 4E and 5E, respectively).
The combination of metformin and lycopene maintained the best effects of the isolated treatments on counteracting the oxidative stress in liver and kidneys of diabetic rats. The treatment of diabetic rats with metformin + lycopene caused increases in the activity of SOD (liver and kidney, Figures 4A and 5A, respectively), which represents the maintenance of the lycopene effects, as well as increased the activity of CAT (liver and kidney, Figures 4B and 5B, respectively) and the NPSH levels (liver and kidney, Figures 4E and 5E, respectively), these findings indicate the maintenance of the metformin and lycopene effects.
The activities of GSH-Px and GSH-Rd in liver (Figure 4C and D, respectively) and kidneys (Figure 5C and D, respectively) were similar among all treatments (insulin, metformin, lycopene, and metformin + lycopene). It must be highlighted that the activities of GSH-Px in liver and kidneys of diabetic rats under all treatments were increased and similar to the corresponding values of DYOG rats, while the activities of GSH-Rd were decreased by all treatments and reached values similar to those of NYOG rats.
Biomarkers of Oxidative Damage in Liver and Kidney
In agreement with the changes observed in the activities of the antioxidant defenses, the levels of biomarkers related to glycoxidative damage were increased (in different ways) in liver and kidneys of STZ-induced diabetic rats. Interestingly, while in the liver of DYOG rats there were increases in the levels of PCO (biomarker of protein oxidation; Figure 6B) and fluorescent AGEs (biomarkers of advanced glycation; Figure 6C), in the kidneys there were increases in the levels of TBARS (biomarkers of lipid peroxidation; Figure 7A) and PCO (Figure 7B). Conversely, TBARS levels were decreased in the liver of DYOG rats (Figure 6A), while in the kidneys there were decreases in the levels of AGEs (Figure 7C). The treatment with insulin reduced the levels of PCO (Figure 6B) and AGEs (Figure 6C) in liver of diabetic rats, while reduced the levels of TBARS (Figure 7A) and PCO (Figure 7B) in kidneys.
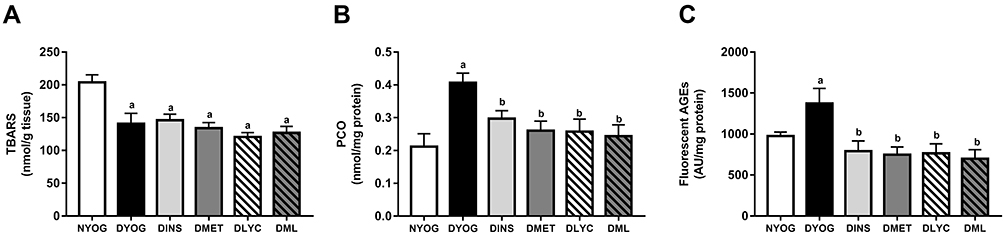 |
Figure 6 Glycoxidative stress biomarkers in liver of streptozotocin-induced diabetic rats treated for 35 days with yoghurt enriched with lycopene, alone or in combination with metformin. Levels of TBARS (A), PCO (B), fluorescent AGEs (C). Values are expressed in terms of mean ± standard error of the mean (SEM), n = 10. Differences between groups were analyzed using one-way ANOVA followed by the Student-Newman-Keuls test (p < 0.05): aDifferences to NYOG; bDifferences to DYOG. Abbreviations: NYOG, normal rats treated with yoghurt; DYOG, diabetic rats treated with yoghurt; DINS, diabetic rats treated with 4U/day insulin; DMET, diabetic rats treated with 250 mg/kg metformin in yoghurt; DLYC, diabetic rats treated with 45 mg/kg lycopene in yoghurt; DML, diabetic rats treated with 250 mg/kg metformin + 45 mg/kg lycopene in yoghurt. |
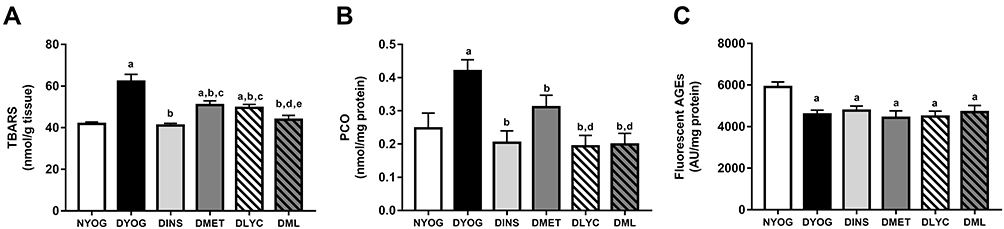 |
Figure 7 Glycoxidative stress biomarkers in kidney of streptozotocin-induced diabetic rats treated for 35 days with yoghurt enriched with lycopene, alone or in combination with metformin. Levels of TBARS (A), PCO (B), fluorescent AGEs (C). Values are expressed in terms of mean ± standard error of the mean (SEM), n = 10. Differences between groups were analyzed using one-way ANOVA followed by the Student-Newman-Keuls test (p < 0.05): aDifferences to NYOG; bDifferences to DYOG; cDifferences to DINS; dDifferences to DMET; eDifferences to DLYC.Abbreviations: NYOG, normal rats treated with yoghurt; DYOG, diabetic rats treated with yoghurt; DINS, diabetic rats treated with 4U/day insulin; DMET, diabetic rats treated with 250 mg/kg metformin in yoghurt; DLYC, diabetic rats treated with 45 mg/kg lycopene in yoghurt; DML, diabetic rats treated with 250 mg/kg metformin + 45 mg/kg lycopene in yoghurt. |
In liver, the treatments with metformin and lycopene, alone, significantly reduced the levels of PCO (Figure 6B) and fluorescent AGEs (Figure 6C). The treatment with metformin + lycopene reduced the hepatic levels of PCO (Figure 6B) and AGEs (Figure 6C), whose levels were similar to those of DINS, DMET and DLYC rats. The treatments with metformin and lycopene, alone or in combination, maintained the hepatic levels of TBARS similar to those of DYOG rats (Figure 6A).
In kidneys, the treatments with metformin or lycopene, individually, reduced the levels of TBARS (Figure 7A) and PCO (Figure 7B), being the lycopene effect on decreasing the PCO better than that of metformin. In this tissue, the combined therapy added benefits on dampening the oxidative stress. The levels of TBARS were further decreased in DML rats (Figure 7A) in comparison with the corresponding values in DMET and DLYC rats, suggesting the reaching of additive effects. Diabetic rats treated with metformin + lycopene had low levels of PCO (Figure 7B) that were similar to those of DLYC rats, suggesting the maintenance of the beneficial effects of lycopene. The levels of fluorescent AGEs were low in kidneys of diabetic rats treated with metformin or lycopene, alone or in combination, and were similar to the AGEs levels of DYOG rats (Figure 7C).
Discussion
A previous study from our laboratory showed that the treatment with lycopene-enriched yoghurt improved various biochemical parameters and biomarkers of oxidative stress in diabetic rats, mainly causing decreases in glycemia and dyslipidemia, as well as decreased biomarkers of oxidative damage and increased the endogenous antioxidant defenses in plasma and liver. Besides, the combination between lycopene and curcumin aggregates benefits to diabetes therapy, maintaining the beneficial effects of the isolated phytochemicals and also favored the reach of additive effects, mainly those related to dampen the oxidative stress.18 These findings motivated the continuation of studies about the benefits of combined therapies with natural bioactive substances, investigating the co-administration with antidiabetic drugs. The first studies by combining curcumin with metformin19 and curcumin with insulin in a minor dose30 were very promising and showed the achievement of best management of glycemia, lipid profile, and diabetic complications resulting from oxidative stress. The present study provides insights regarding the potential of lycopene used in an approach of combined therapy with metformin. The benefits of this combined therapy were mainly centered on the reach of additive effects on the glycemia management, as well as by promoting further decreases in the plasma levels of total cholesterol and biomarkers of glycoxidative stress, including TBARS and AGEs. The treatment of diabetic rats with metformin + lycopene in yoghurt also increased the endogenous antioxidant defenses, including PON 1 (plasma), SOD and CAT (liver and kidneys), these benefits indicate the maintenance of the effects observed with the isolated treatments, mainly the lycopene. In view of these findings, the combined therapy of metformin with lycopene arises as an interesting strategy for the management of DM and to prevent its long-term complications resulting from glycoxidative stress.
Studies have demonstrated the benefits of yoghurt in the attenuation of metabolic dysfunctions, mainly dyslipidemia31 and insulin resistance.32 However, previous studies from our laboratory demonstrated that the treatment of STZ-induced diabetic rats with yoghurt alone did not alter physiological and biochemical parameters33 in normal, non-diabetic rats or in STZ-induced diabetic rats. In addition, the administration of phytochemicals18,28 or antidiabetic drugs19 with yoghurt did not impair their benefits against the symptoms of diabetes. For all these reasons, studies of our laboratory have been used yoghurt as a vehicle for the oral administration of bioactive compounds having low solubilities in water, including lycopene and other natural antioxidants. Furthermore, normal and diabetic rats treated with vehicle (yoghurt) have been considered the control groups for the absence (NYOG group) or presence (DYOG group) of metabolic disturbances due to insulin deficiency. DYOG group also showed various features associated with the onset of glycoxidative stress, including the low activities of antioxidant enzymes (PON 1, SOD, CAT) and increased levels of biomarkers related to oxidative (TBARS, PCO) and glycative (AGEs) damage.
Lycopene has gained significant attention due to its multiple effects against the abnormalities of metabolic syndrome and its complications.13–15 In agreement with this tendency, many benefits were observed when STZ-induced diabetic rats were treated with lycopene, individually. The treatment with lycopene for 35 days avoided the progressive increase in the postprandial glycemia, which could be a consequence, at least in part, of the improvements observed in the glucose tolerance. Supporting this hypothesis, studies have found that supplementations with lycopene34 or with dry tomato peel35 reduced both the glucose intolerance and the insulin resistance in high-fat diet-fed mice. In addition, a recent review by Zhu et al36 supports evidence of the lycopene beneficial effects on maintaining the pancreatic function in in vivo models of metabolic dysfunctions. Evaluating the pancreatic function of STZ-induced diabetic rats treated with lycopene for 30 days, Ozmen et al37 found that lycopene reduced both the vacuolization and the loss of insulin-secreting cells in the Langerhans islets of diabetic rats. Consequently, lycopene-treated rats had increased circulating levels of insulin, along with decreased levels of glycemia. Both studies suggested that the antioxidant potential of lycopene is important to confer protective effects on the pancreatic function. Therefore, the improvements observed in the glycemia management of diabetic rats treated with lycopene may be also a consequence, at least partially, of the beneficial effects of this carotenoid on the pancreatic function, which deserves further attention in future studies.
Lycopene treatment partially attenuated dyslipidemia, as observed in previous studies focusing on the benefits of the consumption of tomato-based products.38 The improvements in the metabolic control caused by the treatment with lycopene also reflected in minor values of urinary volume and water intake, which can be also a consequence of the lycopene beneficial effects on the pancreatic function and insulin sensitivity. Lycopene also showed to be effective on dampening oxidative stress, since low levels of biomarkers related to lipid peroxidation (TBARS; liver and kidneys) and protein oxidative damage (PCO; plasma, liver, and kidneys) were found in lycopene-treated diabetic rats. As a well-known natural antioxidant, lycopene has been cited as an efficient scavenger of ROS, including the hydroxyl radical39 and hypochlorous acid,40 both considered potent oxidants whose levels are often increased in DM and closely associated with pathogenic events.41,42 Therefore, the per se antioxidant power of lycopene may explain its ability to lessen the oxidation of lipids and proteins in STZ-induced diabetic rats. Furthermore, lycopene also stimulated the endogenous antioxidant defenses, including PON 1 (plasma), SOD and CAT (liver and kidneys), as previously observed.43
It is noteworthy that lycopene alone mitigated various metabolic disturbances in STZ-induced diabetic rats in a similar extent to that of metformin alone. Metformin improved dyslipidemia, since caused decreases in triglycerides and total cholesterol levels as well as the treatment with lycopene alone, but the lipid levels remained higher than those of diabetic rats treated with insulin. The mechanisms by which metformin improves the lipid metabolism have been well documented.44 The levels of biomarkers related to oxidative damage were also decreased in liver and kidneys of diabetic rats treated with metformin, as previously observed by others.45,46 However, different from lycopene, metformin alone did not improve the activity of SOD in these tissues, only caused increases in the activity of CAT. It can be inferred that the improvement in the activity of CAT was sufficient to mitigate the oxidative stress in tissues of diabetic rats treated with metformin. Alhaider et al47 suggested that metformin can protect STZ-induced diabetic rats against nephropathy via restoration of antioxidant defenses, increasing the expression of antioxidant enzymes, including CAT. According to our findings, metformin alone also increased the activity of PON 1 in diabetic rats, in a similar extent of the treatments with lycopene or insulin, as previously observed.19 PON 1 is a functional constituent of HDL and exerts a primordial role against lipid peroxidation of membranes and low-density lipoprotein-cholesterol (LDL-cholesterol); PON 1 has peroxidase activity that neutralizes hydrogen peroxide and hydroperoxides of fatty acids and cholesteryl esters.48 It has been shown that PON 1 activity can be affected by post-translational modifications, including glycation.49 Therefore, considering that the treatment with metformin reduced the plasma levels of AGEs, it can be suggested that metformin inhibited the glycation of PON 1, maintaining its activity. Meaney et al50 observed that patients with metabolic syndrome and treated with metformin had increases in the activity of PON 1, when compared with control patients. Authors observed that the increases in the PON 1 activity were independent of increases in the HDL levels, suggesting that metformin caused improvements in the lipoprotein quality, which reinforces the vascular protective effects of metformin on subclinical atherosclerosis. Lastly, the treatment of diabetic rats with metformin reduced the postprandial glycemia levels and the glucose intolerance, similarly to the lycopene effects, but in a lesser extent than the insulin therapy. This decrease in the glycemia may be helpful to explain the low levels of AGEs in plasma and liver, although it is known that metformin also scavenges methylglyoxal (a dicarbonyl compound that acts as a precursor of AGEs) producing imidazolinone metabolites.51 In an attempt to improve the glycemic control of STZ-induced diabetic rats treated with metformin, as well as trying to reach better responses in the mitigation of glycoxidative stress, the present study explored the efficacy of the combination between metformin and lycopene.
It has been proposed that one main benefit by combining natural bioactive compounds with classical therapeutic agents for DM is the potential to aggregate capacity to counteract the metabolic memory. Metabolic memory is a phenomenon related to the detrimental impacts of hyperglycemia that contribute to the development of long-term diabetic complications, which may persist even after the achievement of the glycemic control. The underlying cause of the metabolic memory includes a great variety of modifications in biochemical processes that result in inflammation, epigenetic changes, and the overproduction of ROS and advanced glycation products.52 An early and intensive treatment that attempts to dampen hyperglycemia and to achieve the metabolic control in diabetic individuals is fundamental to minimize the detrimental impacts in tissues. Additionally, it has been proposed that the introduction of therapeutic agents capable of inhibiting the biochemical cascades triggered by advanced glycation, ROS, and inflammation, can be helpful to minimize the diabetic complications.52,53
Considering this, lycopene appears as an interesting option to be used in strategies of combined therapies to contrast the complications of DM resulting from glycoxidative stress. In this regard, the present study provides evidence about the beneficial effects of the combined therapy of metformin and lycopene on diabetes, which can be achieved via two strategies: (i) maintenance of the best effects of the isolated treatments, including the improvement in glucose tolerance, the reduction in plasma triglycerides, and the increase in the activities of PON 1 in plasma and CAT in liver and kidneys (lycopene and metformin effects), the increase in the activity of SOD in liver and kidneys and the decrease in PCO levels in kidneys (lycopene effects); (ii) favoring the reach of synergistic effects, mainly by causing further decrease in postprandial glycemia, as well as leading to decreases in plasma levels of total cholesterol, TBARS and AGEs, and lessening TBARS in tissues (kidneys), in which levels were minor than those of the isolated treatments. Considering these findings, it can be argued that the main benefits achieved by the combined therapy of metformin and lycopene were the improvement in the glycemia management (mainly the postprandial glycemia) and the reach of best efficacies on stimulating the antioxidant defenses.
One important achievement of the combined therapy metformin + lycopene was the management of the postprandial glycemia. It can be noted that, from the 10th day of treatment and until the end of the experiment, the postprandial glycemia levels of diabetic rats treated with metformin and lycopene were minor than values found in animals treated with the bioactives alone. A plausible explanation for the synergistic effects of the combined therapy on decreasing the postprandial glycemia levels is the combination of the well-known metformin effects on reducing the glycemia (mainly involving the inhibition of the hepatic glucose production) and the beneficial effects of lycopene on the insulin peripheral sensitivity34,35 and protecting the pancreatic beta-cell function,36,37 as previously described. This hypothesis reinforces the need for further studies attempting to investigate the insulin sensitivity and the pancreatic function in diabetic rats treated with metformin and lycopene. In addition, the synergistic effects of metformin and lycopene on the postprandial glycemia may help explain the synergistic effects of this combined therapy on decreasing the plasma levels of AGEs and TBARS; a significant decrease in the postprandial glycemia may have contributed to decreasing the post-translational modifications of circulating biomolecules, mainly those related to glycative and oxidative events.
It becomes very interesting to apply the combination of metformin and lycopene in the context of metabolic memory, considering evidence that the postprandial hyperglycemia favors the exacerbated formation of both ROS and AGEs not only in the plasma but also intracellularly.54 Furthermore, postprandial hyperglycemia has been cited as an independent risk factor for cardiovascular diseases, since has toxic effects mediated by oxidative stress that contributes to the onset of endothelial dysfunction.55 In this sense, metformin and lycopene appear to be a promising therapeutic strategy against disturbances that accompany diabetes, with emphasis on cardiovascular diseases, since this combination significantly reduced the postprandial hyperglycemia, as well as caused further decreases in plasma levels of total cholesterol and biomarkers of oxidative (TBARS) and glycative (fluorescent AGEs) stress. Besides, the activity of PON 1 was preserved, which represents an additional protection against the oxidative modifications in LDL that participate in cardiovascular events. Recent studies from our laboratory have observed the benefits of combining natural bioactive compounds with antidiabetic drugs in achieving better glycemia management30 as well as decreasing dyslipidemia and oxidative stress,19 providing insights regarding the potential of combined therapies of natural antioxidants and antidiabetic drugs for the management of DM complications, including cardiovascular events.
It must be highlighted the ability of lycopene, alone or combined with metformin, to decrease the levels of fluorescent AGEs in plasma and liver of STZ-induced diabetic rats, which may be a consequence of its effects on decreasing glycemia. Corroborating our findings, Tabrez et al17 found that the treatment with lycopene reduced the renal AGEs levels in rats under an experimental model of ribose-induced glycation; the authors suggested that this effect may be related to the lycopene ability of scavenge ROS, since the exacerbated formation of AGEs and ROS during conditions of glycoxidative stress occurs as a vicious cycle. Therefore, by combining the metformin effects (decreasing the glycemia and scavenging methylglyoxal) and the lycopene effects (decreasing the glycemia and acting as a potent antioxidant), synergistic effects may be occurring to cause the decrease in plasma AGEs levels. This same study explored the lycopene ability to halt the deleterious effects of AGE-RAGE axis, which deserves to be further explored in the context of the combination with metformin. Zeng et al56 demonstrated that endothelial progenitor cells (which differentiate into endothelial cells and promote angiogenesis) were protected by lycopene against apoptosis and oxidative autophagy induced by AGEs, preserving the function of these cells, which reinforce the protective role of lycopene against cardiovascular complications resulting from advanced glycation events. Lastly, the beneficial consequences of the lycopene effects on PON 1 activity had already been noticed in an interesting clinical study. McEneny et al57 investigated the benefits of lycopene on the PON 1 activity in moderately obese individuals, after interventions for 12 weeks with lycopene-rich foods (224–350 mg lycopene/week) or with lycopene (70 mg lycopene/week). Both treatments were capable of increase the activity of PON 1; authors concluded that lycopene promoted improvements in the HDL functionality, favoring an antiatherogenic phenotype.
In addition to the favorable effects on mitigating the macrovascular complications, the combination between lycopene and metformin has also added benefits to counteract the oxidative stress in liver and kidneys of STZ-induced diabetic rats. In these tissues, the combined therapy maintained the lycopene effects on increasing the activity of SOD, as well as the metformin and lycopene effects on increasing the activity of CAT and the levels of the antioxidant metabolite GSH (in this study represented by NPSH groups). As a consequence, significant decreases in PCO (liver and kidneys) and TBARS (kidneys) were observed in diabetic rats treated with metformin and lycopene. The fluorescent AGEs levels were also significantly decreased in liver of diabetic rats treated with this combined therapy. The treatment with metformin + lycopene did not promote synergistic effects on the levels of glycoxidative stress biomarkers (AGEs and PCO) and antioxidant defenses in liver and kidneys of STZ-induced diabetic rats. However, it is important to emphasize that the levels of these biomarkers in DLYC rats (ie, diabetic rats treated with lycopene alone) were mostly identical to the corresponding values in NYOG and DINS groups, which represent the non-occurrence of oxidative stress due to diabetes (NYOG group) and the most effective therapeutic intervention for rats with type 1 DM (DINS group). Therefore, the maintenance of the lycopene effects seems to be an interesting strategy of the combined therapy, since it seemed to have avoided the oxidative stress onset in the liver and kidneys of diabetic rats.
However, it is interesting to note that the responses found in some biomarkers of glycoxidative stress in liver and kidneys of STZ-induced diabetic rats do not appear to be a consequence of the treatments, but rather a possible compensatory mechanism due to DM itself. In the kidneys, AGEs levels were decreased in diabetic rats, treated or not with insulin, metformin or lycopene. The reduction in the renal AGEs levels in diabetic rats deserves to be further explored, and may be related to increases in the expression/activity of components belonging to systems that detoxify AGEs or their precursors, including AGE-R1 receptor and the glyoxalase system. In the liver, TBARS levels were decreased in all groups having diabetic rats, treated or not. The decrease in the hepatic TBARS levels in diabetic rats may have been a consequence of the increases observed in the activities of GSH-Px and GSH-Rd, enzymes that belong to the glutathione redox system, which should be a compensatory response to the increase in the oxidative damage on lipids,58 considering that GSH-Px has lipid peroxides as substrates. Conversely, this compensatory response of the glutathione redox system also occurred in the kidneys of STZ-induced diabetic rats, however without the subsequent decrease in TBARS levels. Elegant study by De Haan et al59 explored if GSH-Px 1 (an isoform highly expressed in kidneys) has a protective role against the renal injury due to oxidative stress caused by hyperglycemia in STZ-induced diabetic mice. In this study, changes in kidneys of mice deficient in GSH-Px 1 (named Gpx1-/-) or intact animals (named Gpx1+/+) were analyzed, in mice having or not diabetes (induced by STZ). Authors found that DM caused significant increases in the renal levels of ROS (accessed by the fluorescence of 2ʹ,7ʹ-dichlorofluorescein) and malondialdehyde (accessed as TBARS), in a similar extent between Gpx1-/- and Gpx1+/+ mice. Authors concluded that oxidative stress in kidneys was unaltered by the absence of GSH-Px 1, and that this enzyme seems not to have a protective role against the development of diabetic nephropathy in type 1 diabetic animals. Therefore, extrapolating these findings to our study, it can be inferred that the compensatory response that occurred in the glutathione redox system in kidneys of diabetic rats does not have an important contribution in the detoxification of lipid peroxides, as occurred in liver.
Conclusion
Knowing that postprandial hyperglycemia is a contributing factor to the onset of diabetic complications by mechanisms involving the exacerbated formation of ROS and AGEs, the present study provides evidence that the combination of lycopene and metformin arises as an interesting strategy to counteract the impairments related to the metabolic memory, since this combined therapy significantly reduced the postprandial glycemia levels of diabetic rats, in comparison with the isolated treatments. Furthermore, lycopene and metformin attenuated dyslipidemia, reduced plasma AGEs levels, and maintained the activity of PON 1, highlighting the effectiveness of this combined therapy against cardiovascular complications in diabetes. Lastly, lycopene and metformin activated the antioxidant defenses in tissues targeted by the deleterious impacts of ROS and AGEs during diabetes (liver, kidney). The beneficial effects of the combination between lycopene and metformin in diabetes reinforce the promising potential of natural bioactive compounds having antioxidant and anti-AGE properties to be used as a complementary therapeutic option with antihyperglycemic drugs to contrast the diabetic complications resulting from glycoxidative stress.
Ethics Approval
This study was performed according to the national (Brazilian College of Animal Experimentation –COBEA) and institutional (Committee for Ethics in Animal Experimentation of the School of Pharmaceutical Sciences, Unesp, Araraquara) rules considering animal experiments. Animals treatments and protocol employed were approved by the Committee for Ethics in Animal Experimentation from the School of Pharmaceutical Sciences, Unesp, Araraquara (CEUA/FCF/CAr resolution number 23/2017).
Acknowledgments
During this study I. D. Figueiredo received scholarship from the Coordenação de Aperfeiçoamento de Pessoal de Nível Superior (CAPES), Brazil – Finance Code 001. Data presented in this study were from the MSc thesis of I. D. Figueiredo.
Author Contributions
All authors contributed to data analysis, drafting or revising the article, have agreed on the journal to which the article will be submitted, gave final approval of the version to be published, and agree to be accountable for all aspects of the work.
Disclosure
The authors declare that they have no conflicts of interest.
References
1. Durazzo A, D’addezio L, Camilli E, et al. From plant compounds to botanicals and back: a current snapshot. Molecules. 2018;23(8):e1844. doi:10.3390/molecules23081844
2. Salehi B, Ata A, Anil Kumar N, et al. Antidiabetic potential of medicinal plants and their active components. Biomolecules. 2019;9(10):e551. doi:10.3390/biom9100551
3. Payab M, Hasani-Ranjbar S, Shahbal N, et al. Effect of the herbal medicines in obesity and metabolic syndrome: a systematic review and meta‐analysis of clinical trials. Phytother Res. 2020;34(3):526–545. doi:10.1002/ptr.6547
4. Rena G, Hardie DG, Pearson ER. The mechanisms of action of metformin. Diabetologia. 2017;60(9):1577–1585. doi:10.1007/s00125-017-4342-z
5. Foretz M, Guigas B, Viollet B. Understanding the glucoregulatory mechanisms of metformin in type 2 diabetes mellitus. Nat Rev Endocrinol. 2019;15(10):569–589. doi:10.1038/s41574-019-0242-2
6. Cahn A, Cefalu WT. Clinical considerations for use of initial combination therapy in type 2 Diabetes. Diabetes Care. 2016;39(Suppl 2):137–145. doi:10.2337/dcS15-3007
7. Akhter MS, Uppal P. Toxicity of metformin and hypoglycemic therapies. Adv Chronic Kidney D. 2020;27(1):18–30. doi:10.1053/j.ackd.2019.08.004
8. Prabhakar PK, Kumar A, Doble M. Combination therapy: a new strategy to manage diabetes and its complications. Phytomedicine. 2014;21(2):123–130. doi:10.1016/j.phymed.2013.08.020
9. Venkatakrishnan K, Chiu HF, Wang CK. Popular functional foods and herbs for the management of type-2-diabetes mellitus: a comprehensive review with special reference to clinical trials and its proposed mechanism. J Funct Foods. 2019;57:425–438. doi:10.1016/j.jff.2019.04.039
10. Lobo V, Patil A, Phatak A, Chandra N. Free radicals, antioxidants and functional foods: impact on human health. Pharmacogn Rev. 2010;4(8):118–126. doi:10.4103/0973-7847.70902
11. Yeh WJ, Hsia SM, Lee WH, Wu CH. Polyphenols with antiglycation activity and mechanisms of action: a review of recent findings. J Food Drug Anal. 2017;25(1):84–92. doi:10.1016/j.jfda.2016.10.017
12. Zhang Y, Li X, Zou D, et al. Treatment of type 2 diabetes and dyslipidemia with the natural plant alkaloid berberine. J Clin Endocrinol Metab. 2008;93(7):2559–2565. doi:10.1210/jc.2007-2404
13. Grabowska M, Wawrzyniak D, Rolle K, et al. Let food be your medicine: nutraceutical properties of lycopene. Food Funct. 2019;10(6):3090–3102. doi:10.1039/C9FO00580C
14. Przybylska S. Lycopene–a bioactive carotenoid offering multiple health benefits: a review. Int J Food Sci Tech. 2020;55(1):11–32. doi:10.1111/ijfs.14260
15. Banihani SA. Tomato (Solanum lycopersicum L.) and type 2 diabetes. Int J Food Prop. 2018;21(1):99–105. doi:10.1080/10942912.2018.1439959
16. Pierine DT, Navarro ME, Minatel IO, et al. Lycopene supplementation reduces TNF-α via RAGE in the kidney of obese rats. Nutr Diabetes. 2014;4:e142. doi:10.1038/nutd.2014.39
17. Tabrez S, Al‐Shali KZ, Ahmad S. Lycopene powers the inhibition of glycation‐induced diabetic nephropathy: a novel approach to halt the AGE‐RAGE axis menace. Biofactors. 2015;41(5):372–381. doi:10.1002/biof.1238
18. Assis RP, Arcaro CA, Gutierres VO, et al. Combined effects of curcumin and lycopene or bixin in yoghurt on inhibition of LDL oxidation and increases in HDL and paraoxonase levels in streptozotocin-diabetic rats. Int J Mol Sci. 2017;18:e332. doi:10.3390/ijms18040332
19. Roxo DF, Arcaro CA, Gutierres VO, et al. Curcumin combined with metformin decreases glycemia and dyslipidemia, and increases paraoxonase activity in diabetic rats. Diabetol Metab Syndr. 2019;11(1):33. doi:10.1186/s13098-019-0431-0
20. Lowry OH, Rosebrough NJ, Farr AL, Randall RJ. Protein measurement with the Folin phenol reagent. J Biol Chem. 1951;193(1):265–275.
21. Beauchamp C, Fridovich I. Superoxide dismutase: improved assays and assay applicable to acrylamide gels. Anal Biochem. 1971;44(1):276–287. doi:10.1016/0003-2697(71)90370-8
22. Beers RF
23. Rush JWE, Sandiford SD. Plasma glutathione peroxidase in healthy young adults: influence of gender and physical activity. Clin Biochem. 2003;36(5):345–351. doi:10.1016/S0009-9120(03)00039-0
24. Carlberg I, Mannervik B. Glutathione reductase. Method Enzymol. 1985;113:484–490. doi:10.1016/S0076-6879(85)13062-4
25. Sedlak J, Lindsay RH. Estimation of total, protein-bound, and nonprotein sulfhydryl groups in tissue with Ellman’s reagent. Anal Biochem. 1968;25(1):192–205. doi:10.1016/0003-2697(68)90092-4
26. Kohn HI, Liversedge M. On a new aerobic metabolite whose production by brain is inhibited by apomorphine, emetine, ergotamine, epinephrine, and menadione. J Pharmacol Exp Ther. 1944;82(3):292–300.
27. Levine RL, Williams JA, Stadtman ER, Shacter E. Carbonyl assays for determination of oxidatively modified proteins. Methods Enzymol. 1944;233:346–357. doi:10.1016/s0076-6879(94)33040-9
28. Costa MC, Lima TFO, Arcaro CA, et al. Trigonelline and curcumin alone, but not in combination, counteract oxidative stress and inflammation and increase glycation product detoxification in the liver and kidney of mice with high-fat diet-induced obesity. J Nutr Biochem. 2020;76:108303. doi:10.1016/j.jnutbio.2019.108303
29. Meier JJ, Baller B, Menge BA, Gallwitz B, Schmidt WE, Nauck MA. Excess glycaemic excursions after an oral glucose tolerance test compared with a mixed meal challenge and self-measured home glucose profiles: is the OGTT a valid predictor of postprandial hyperglycaemia and vice versa? Diabetes Obes Metab. 2009;11(3):213–222. doi:10.1111/j.1463-1326.2008.00922.x
30. Gutierres VO, Assis RP, Arcaro CA, et al. Curcumin improves the effect of a reduced insulin dose on glycemic control and oxidative stress in streptozotocin‐diabetic rats. Phytother Res. 2019;33(4):976–988. doi:10.1002/ptr.6291
31. Sadrzadeh-Yeganeh H, Elmadfa I, Djazayery A, Jalali M, Heshmat R, Chamary M. The effects of probiotic and conventional yoghurt on lipid profile in women. Br J Nutr. 2010;103(12):1778–1783. doi:10.1017/S0007114509993801
32. Balakumar M, Prabhu D, Sathishkumar C, et al. Improvement in glucose tolerance and insulin sensitivity by probiotic strains of Indian gut origin in high-fat diet-fed C57BL/6J mice. Eur J Nutr. 2018;57(1):279–295. doi:10.1007/s00394-016-1317-7
33. Gutierres VO, Pinheiro CM, Assis RP, Vendramini RC, Pepato MT, Brunetti IL. Curcumin-supplemented yoghurt improves physiological and biochemical markers of experimental diabetes. Br J Nutr. 2012;108(3):440–448. doi:10.1017/S0007114511005769
34. Zeng Z, He W, Jia Z, Hao S. Lycopene improves insulin sensitivity through inhibition of STAT3/Srebp-1c-mediated lipid accumulation and inflammation in mice fed a high-fat diet. Exp Clin Endocrinol Diabetes. 2017;125(9):610–617. doi:10.1055/s-0043-101919
35. Zidani S, Benakmoum A, Ammouche A, Benali Y, Bouhadef A, Abbeddou S. Effect of dry tomato peel supplementation on glucose tolerance, insulin resistance, and hepatic markers in mice fed high-saturated-fat/high-cholesterol diets. J Nutr Biochem. 2017;40:64–171. doi:0.1016/j.jnutbio.2016.11.001
36. Zhu R, Chen B, Bai Y, et al. Lycopene in protection against obesity and diabetes: a mechanistic review. Pharmacol Res. 2020;159:104966. doi:10.1016/j.phrs.2020.104966
37. Ozmen O, Topsakal S, Haligur M, Aydogan A, Dincoglu D. Effects of caffeine and lycopene in experimentally induced diabetes mellitus. Pancreas. 2016;45(4):579–583. doi:10.1097/MPA.0000000000000489
38. Li H, Chen A, Zhao L, et al. Effect of tomato consumption on fasting blood glucose and lipid profiles: a systematic review and meta‐analysis of randomized controlled trials. Phytother Res. 2020;34(8):1956–1965. doi:10.1002/ptr.6660
39. Prasad AK, Mishra PC. Modeling the mechanism of action of lycopene as a hydroxyl radical scavenger. J Mol Model. 2014;20(5):2233. doi:10.1007/s00894-014-2233-5
40. Pennathur S, Maitra D, Byun J, et al. Potent antioxidative activity of lycopene: a potential role in scavenging hypochlorous acid. Free Radic Biol Med. 2010;49(2):205–213. doi:10.1016/j.freeradbiomed.2010.04.003
41. Bondeva T, Wolf G. Reactive oxygen species in diabetic nephropathy: friend or foe? Nephrol Dial Transpl. 2014;29(11):1998–2003. doi:10.1093/ndt/gfu037
42. Ghoshal K, Das S, Aich K, Goswami S, Chowdhury S, Bhattacharyya M. A novel sensor to estimate the prevalence of hypochlorous (HOCl) toxicity in individuals with type 2 diabetes and dyslipidemia. Clin Chim Acta. 2016;458:144–153. doi:10.1016/j.cca.2016.05.006
43. Ali MM, Agha FG. Amelioration of streptozotocin‐induced diabetes mellitus, oxidative stress and dyslipidemia in rats by tomato extract lycopene. Scand J Clin Lab Inv. 2009;69(3):371–379. doi:10.1080/00365510802658473
44. Van Stee MF, De Graaf AA, Groen AK. Actions of metformin and statins on lipid and glucose metabolism and possible benefit of combination therapy. Cardiovasc Diabetol. 2018;17(1):94. doi:10.1186/s12933-018-0738-4
45. Corremans R, Vervaet BA, D’haese PC, Neven E, Verhulst A. Metformin: a candidate drug for renal diseases. Int J Mol Sci. 2018;20(1):42. doi:10.3390/ijms20010042
46. Karise I, Ornel Las F, Barbosa-Da-Silva S, et al. Liver and Metformin: lessons of a fructose diet in mice. Biochim Open. 2017;4:19–30. doi:10.1016/j.biopen.2017.01.002
47. Alhaider AA, Korashy HM, Sayed-Ahmed MM, Mobark M, Kfoury H, Mansour MA. Metformin attenuates streptozotocin-induced diabetic nephropathy in rats through modulation of oxidative stress genes expression. Chem-Biol Interact. 2011;192(3):233–242. doi:10.1016/j.cbi.2011.03.014
48. Levy D, Reichert CO, Bydlowski SP. Paraoxonases activities and polymorphisms in elderly and old-age diseases: an overview. Antioxidants. 2019;8(5):118. doi:10.3390/antiox8050118
49. Mastorikou M, Mackness B, Liu Y, Mackness M. Glycation of paraoxonase‐1 inhibits its activity and impairs the ability of high‐density lipoprotein to metabolize membrane lipid hydroperoxides. Diabetic Med. 2008;25(9):1049–1055. doi:10.1111/j.1464-5491.2008.02546.x
50. Meaney E, Sierra‐Vargas P, Meaney A, et al. Does metformin increase paraoxonase activity in patients with the metabolic syndrome? Additional data from the MEFISTO study. Clin Transl Sci. 2012;5(3):265–268. doi:10.1111/j.1752-8062.2012.00391.x
51. Kinsky OR, Hargraves TL, Anumol T, et al. Metformin scavenges methylglyoxal to form a novel imidazolinone metabolite in humans. Chem Res. 2016;29(2):227–234. doi:10.1021/acs.chemrestox.5b00497
52. Ceriello A, Ihnat MA, Thorpe JE. The “metabolic memory”: is more than just tight glucose control necessary to prevent diabetic complications? J Clin Endocrinol Metab. 2009;94(2):410–415. doi:10.1210/jc.2008-1824
53. Testa R, Bonfigli AR, Prattichizzo F, La Sala L, De Nigris V, Ceriello A. The “metabolic memory” theory and the early treatment of hyperglycemia in prevention of diabetic complications. Nutrients. 2017;9(5):437. doi:10.3390/nu9050437
54. Ceriello A. The emerging challenge in diabetes: the “metabolic memory”. Vasc Pharmacol. 2012;57(5–6):133–138. doi:10.1016/j.vph.2012.05.005
55. Ceriello A. Postprandial hyperglycemia and diabetes complications: is it time to treat? Diabetes. 2005;54(1):1–7. doi:10.2337/diabetes.54.1.1
56. Zeng YC, Peng LS, Zou L, et al. Protective effect and mechanism of lycopene on endothelial progenitor cells (EPCs) from type 2 diabetes mellitus rats. Biomed Pharmacother. 2017b;92:86–94. doi:10.1016/j.biopha.2017.05.018
57. McEneny J, Wade L, Young IS, et al. Lycopene intervention reduces inflammation and improves HDL functionality in moderately overweight middle-aged individuals. J Nutr Biochem. 2013;24(1):163–168. doi:10.1016/j.jnutbio.2012.03.015
58. Gunawardena HP, Silva R, Sivakanesan R, Ranasinghe P, Katulanda P. Poor glycaemic control is associated with increased lipid peroxidation and glutathione peroxidase activity in type 2 diabetes patients. Oxid Med Cell Longev. 2019;2019:9471697. doi:10.1155/2019/9471697
59. De Haan JB, Stefanovic N, Nikolic-Paterson D, et al. Kidney expression of glutathione peroxidase-1 is not protective against streptozotocin-induced diabetic nephropathy. Am J Physiol Renal Physiol. 2005;289(3):544–551. doi:10.1152/ajprenal.00088.2005
 © 2020 The Author(s). This work is published and licensed by Dove Medical Press Limited. The
full terms of this license are available at https://www.dovepress.com/terms
and incorporate the Creative Commons Attribution
- Non Commercial (unported, 3.0) License.
By accessing the work you hereby accept the Terms. Non-commercial uses of the work are permitted
without any further permission from Dove Medical Press Limited, provided the work is properly
attributed. For permission for commercial use of this work, please see paragraphs 4.2 and 5 of our Terms.
© 2020 The Author(s). This work is published and licensed by Dove Medical Press Limited. The
full terms of this license are available at https://www.dovepress.com/terms
and incorporate the Creative Commons Attribution
- Non Commercial (unported, 3.0) License.
By accessing the work you hereby accept the Terms. Non-commercial uses of the work are permitted
without any further permission from Dove Medical Press Limited, provided the work is properly
attributed. For permission for commercial use of this work, please see paragraphs 4.2 and 5 of our Terms.