Back to Archived Journals » Reports in Medical Imaging » Volume 15
Lung Perfusion Assessment in Pulmonary Embolism: Novel Semi-Automatic Lung Perfusion Software in Computed Tomography Pulmonary Angiography Compared to Traditional Lung Perfusion Scintigraphy
Authors Lastella G, Esposito A ![]() , Scarabelli A, Plensich GG, Stellato E, Avola E
, Scarabelli A, Plensich GG, Stellato E, Avola E ![]() , Giannitto C, Castellani M
, Giannitto C, Castellani M ![]() , Cuzzocrea M, Bonomo L, Carrafiello G
, Cuzzocrea M, Bonomo L, Carrafiello G
Received 27 December 2021
Accepted for publication 4 July 2022
Published 3 August 2022 Volume 2022:15 Pages 31—41
DOI https://doi.org/10.2147/RMI.S355965
Checked for plagiarism Yes
Review by Single anonymous peer review
Peer reviewer comments 2
Editor who approved publication: Professor Tarik Massoud
Giulia Lastella,1 Andrea Esposito,2 Alice Scarabelli,3 Guido Giovanni Plensich,3 Elvira Stellato,3 Emanuele Avola,3 Caterina Giannitto,4 Massimo Castellani,5 Marco Cuzzocrea,6 Luca Bonomo,7 Gianpaolo Carrafiello5
1Unit of Radiology, Ospedale Città di Sesto San Giovanni, ASST Nord Milano, Sesto San Giovanni, Italy; 2Unit of Radiology, Ospedale Treviglio-Caravaggio, ASST Bergamo Ovest, Treviglio, Italy; 3Postgraduation School in Radiodiagnostics, University of Milan, Milan, Italy; 4Unit of Radiology, Istituto Clinico Humanitas, Rozzano, Italy; 5Unit of Nuclear Medicine, IRCCS Fondazione Cà Granda, Maggiore Policlinico Hospital, Milan, Italy; 6Clinic for Nuclear Medicine and Molecular Imaging, Imaging Institute of Southern Switzerland, Ente Ospedaliero Cantonale, Bellinzona, Switzerland; 7Clinica di Radiologia, Ente Ospedaliero Cantonale, Lugano, Switzerland
Correspondence: Andrea Esposito, Unit of Radiology, Ospedale Treviglio-Caravaggio, ASST Bergamo Ovest, Treviglio, Italy, Tel +393475476654, Email [email protected]
Purpose: To compare the diagnostic performance of lung perfusion colormaps derived from computed tomography pulmonary angiography (cmCTPA) by novel semi-automatic post-processing software, with lung perfusion scintigraphy (LPS), for detection of lung perfusion defects (LPDs) in pulmonary embolism (PE).
Patients and Methods: Consecutive patients from January 2016 to April 2020 who underwent both computed tomography pulmonary angiography (CTPA) and LPS within 7 days of each other, to rule out PE, were retrospectively enrolled. cmCTPA images were obtained from CTPA images using semi-automatic post-processing software (Pulmonary Artery Analysis, Intellispace Portal Release 11, Philips). The diagnosis of LPD was assessed on LPS images by two nuclear medicine physicians in consensus; CTPA and cmCTPA images were evaluated by two radiologists in consensus, blind to the LPS results. The spatial location of the LPD was assessed according to Boyden’s nomenclature. Agreement between LPS and cmCTPA in the diagnosis of LPD was tested using Cohen’s kappa.
Results: Fifty-three patients were enrolled. The sensitivity, specificity, positive predictive value, and negative predictive value (NPV) of cmCTPA were, respectively, 100%, 40%, 73%, and 100%; disease prevalence was 67%, accuracy was 77%, and positive and negative likelihood ratios were 1.67 and 0, respectively. An almost perfect agreement was found between cmCPTA and LPS in 13 segments (72%) and a substantial agreement was found in the remaining five segments (28%).
Conclusion: cmCTPA, owing to its NPV (100%) and its overall high agreement in the number and location of LPDs compared to LPS, may have an upcoming role in the evaluation of lung perfusion in PE.
Keywords: nuclear medicine, pulmonary embolism, perfusion imaging, computed tomography angiography, image processing, computer-assisted
Introduction
A pulmonary embolism (PE) is an embolic occlusion in the pulmonary arterial system,1,2 most commonly caused by the migration of a thrombus from the lower extremities veins into the pulmonary arteries. PE can be life threatening3 when it involves the pulmonary trunk or main pulmonary arteries, with a mortality estimated to be 15% if untreated.4–6
The diagnosis of PE is usually determined by a combination of clinical evaluation, D-dimer test, and different imaging techniques.7 Clinical symptoms are usually non-specific and several clinical algorithms, such as the Geneva score,8 Wells score,9 and simplified revised Geneva score,10 have been proposed, to determine a pretest probability of PE.3 The D-dimer test has high sensitivity and low specificity:11,12 if the D-dimer test is negative, PE is excluded; if D-dimer is increased, PE is possible and further imaging techniques are required.
Lung perfusion scintigraphy (LPS) was the first established non-invasive imaging modality for the diagnosis of PE.13,14 On LPS, a PE can be observed as a wedge-shaped perfusion defect, and LPS is considered the reference standard for the assessment of lung perfusion defects (LPDs), through the evaluation of the regional distribution of pulmonary blood flow.15 LPS has a sensitivity of 92% and a specificity of 87%, but a limited accuracy, owing to the high rate of intermediate or indeterminate findings (negative predictive value [NPV] 88% and positive predictive value [PPV] 92%).16 LPS is currently required in young patients or in pregnancy, becaue of the low implied dose of ionizing radiation,17 to study pulmonary perfusion before lobectomy or lung transplantation, and to assess chronic PE and chronic thromboembolic pulmonary hypertension.14
LPS also has a primary role in patients with a high suspicion of PE and a negative computed tomography pulmonary angiography (CTPA).
CTPA is an imaging technique useful in the detection of PE. On CTPA, a PE can be assessed as a filling defect in the pulmonary arterial system, even in asymptomatic patients.18 According to the large Prospective Investigation of Pulmonary Embolism Diagnosis II trial (PIOPED II), CTPA has a sensitivity of 83% and a specificity of 96%, an NPV of 95% and a PPV of 86%,19 and it is considered the reference standard in the identification of endoluminal arterial defects.3
Owing to continuous technological improvements, CTPA has, for instance, benefitted from the use of dual-energy CT in the evaluation of pulmonary perfusion.20 Moreover, with post-processing quantitative and qualitative software, CTPA has an upcoming role in the assessment of the perfusion state of the lungs in all makes of CT scanner.
The purpose of our study is to compare the diagnostic accuracy of lung perfusion cmCTPA obtained by novel semi-automatic post-processing software, with LPS, in the detection of LPDs in PE.
Materials and Methods
Patient Population
Consecutive patients from January 2016 to April 2020 who underwent both CTPA with a baseline CT and LPS within 7 days of each other to rule out PE were included in this single-center retrospective study. Exclusion criteria were: 1) chronic pulmonary disease (such as chronic obstructive pulmonary disease, cystic fibrosis, or idiopathic pulmonary fibrosis); 2) extended consolidation, due to active pneumonia or lung cancer; and 3) unsatisfactory image quality.
Clinical and biochemical information prothrombin time ratio and partial thromboplastin time ratio were also obtained and registered. All scans were rendered anonymous.
LPS Protocol
LPS was performed after the intravenous injection of a standard dose of 350,000 99mTc-labeled aggregates of human albumin (Maasol; GE Healthcare, Little Chalfont, UK), with an administered activity of 111 MBq, in supine patients, after three to five respiratory cycles. Images of the lungs were acquired in eight standard projections (anterior, posterior, left lateral, right lateral, left oblique anterior, right oblique anterior, left oblique posterior, and right oblique posterior; matrix 256×256; zoom 1.45; 700 K counts for projection) through a dual-head gamma camera (Symbia; Siemens Medical Solutions, Erlangen, Germany), with a low-energy, high-resolution (LEHR) collimator.
LPS images were stored on the Picture Archive and Communication System (PACS; Fuji by Fujifilm Company Ltd, Tokyo, Japan).
LPS Image Analysis
Lung perfusion images were visually assessed, in consensus, by two nuclear medicine physicians, with 25 and 7 years of experience.
The diagnosis of LPD on LPS was based on the European Association of Nuclear Medicine (EANM) guidelines14 and the modified Prospective Investigation of Pulmonary Embolism Diagnosis II trial (PIOPED II) criteria.15 The spatial location of the LPD was assessed by the two readers according to Boyden’s nomenclature, which divides the two lungs into lobes and then 18 segments.21,22
The evaluators indicated the absence (0) or the presence (1) of segmental localization of each LPD. No further qualitative evaluation could be made because LPS does not provide a qualitative assessment of the LPD, permitting only an evaluation of the presence or the absence of an LPD.
CTPA Protocol
All patients underwent CTPA with a 128-slice scanner (Somatom Definition Flash; Siemens AG, Forchheim, Germany) or a 64-slice scanner (Somatom Sensation; Siemens AG, Forchheim, Germany). Acquisition was performed in the supine position, during a full-inspiration breath-hold, using the following parameters: 128×0.625 mm or 64×0.625 mm, tube voltage of 120 kVp, and tube current of 180–200 mAs. The whole lung parenchyma, from the lung apex to the diaphragmatic sulci, was scanned in the craniocaudal direction.
Contrast enhancement was obtained after an organo-iodine-based contrast injection (Iopamidol, Iopamiro 370 mg/mL; Bracco Imaging Italia srl, Milan, Italy), administered as 1.35 mL/kg, with a flow rate of 3–3.5 mL/s. As in the bolus tracking method, a region of interest was placed over the main pulmonary artery and the scan started 6 seconds after a predetermined threshold of 100 HU was reached.23
Image data sets were reconstructed with 1 mm slice thickness and standard reconstruction kernels: sharp kernel (B70f) for the standard lung window (1350 width, −600 center) and medium-soft kernel (B30f) for the soft-tissue window (350 width, 50 center). CTPA scan images were stored on the Picture Archive and Communication System (PACS; Fuji by Fujifilm Company Ltd, Tokyo, Japan).
Two thoracic radiologists, with 25 and 4 years of experience, evaluated in consensus, the absence (0) or the presence (1) of PE and the pulmonary artery affected by the defect.
cmCTPA Image Analysis
Lung perfusion analysis was assessed 6 months after the first evaluation, by the same two thoracic radiologists who had previously judged the CTPA images, visualized on a clinical workstation (Intellispace Portal Release 11; Philips Medical Systems, Best, the Netherlands), blind to LPS results. For the cmCTPA images, licensed pulmonary dedicated post-processing software (Pulmonary Artery Analysis, Intellispace Portal Release 11; Philips Medical Systems, Best, the Netherlands) was used.
The Pulmonary Artery Analysis (PAA) software evaluated contrast-enhanced CTPA images and automatically generated HU-based cmCTPA as secondary images derived from CTPA, where higher HU values were correlated to well-perfused areas. This process provided axial colormaps derived from both lungs, derived from but not directly related to HU in CTPA, according to their perfusion, to assess LPDs in PE, with a color range from red–orange (indicating a well-perfused segment) to violet (indicating a non-perfused segment).
Moreover, from axial cmCTPA images, maximum-intensity projection (MIP) cmCTPA images were reconstructed by a radiology resident, after a period of 10 hours of training with the software applicator, in about 5 minutes for each patient. The MIP images were reconstructed with a slice thickness of 80–100 mm to simultaneously evaluate, in coronal view, the anterior and posterior region of both lungs and, in sagittal view, each lobe. MIP sagittal and coronal derived colormaps permitted a more objective and reproducible comparison of cmCTPA with frontal and lateral LPS images. Axial images were also evaluated by the two radiologists, to confirm the absence (0) or presence (1) of segmental localization of each LPD.
Statistical Analysis
Statistical analysis was performed using Python 3.7.6. Quantitative variables were expressed as medians with interquartile ranges (IQRs). Qualitative variables were expressed as raw numbers and percentages.
The diagnostic performance of cmCTPA in the diagnosis of LPD was assessed according to its sensitivity, specificity, disease prevalence, accuracy, positive predictive value (PPV), and negative predictive value (NPV); these were calculated along with their 95% confidence intervals (CIs), and expressed as percentages using LPS images as the reference standard. Confidence intervals for sensitivity, specificity, disease prevalence, and accuracy are “exact” Clopper–Pearson confidence intervals; confidence intervals for the likelihood ratios were calculated using the “log method” as in the Altman method;24 and confidence intervals for the PPV and NPV were the standard logit confidence intervals given by Mercaldo et al.25 Agreement between LPS and cmCTPA in the diagnosis of LPD was tested using Cohen’s kappa. Linearly weighted kappa and raw concordance, namely the percentage of cases where the two methods showed perfect agreement, were thus calculated. Kappa agreements were then characterized according to the Landis and Koch criteria as slight (kappa = 0.00–0.20), fair (kappa = 0.21–0.40), moderate (kappa = 0.41–0.60), substantial (kappa = 0.61–0.80), or almost perfect (kappa = 0.81–1.00).26
Results
Patient Characteristics
From 223 patients, 53 patients (18 men, 34%), with a median age of 66 years (IQR 48–82 years), were included.
Out of these, 14 patients (Group A, five men, 36%, median age 69 years, IQR 48–82 years, 252 segments) presented PE on CTPA and LPD on LPS, 17 patients (Group B, four men, 24%, median age 59 years, IQR 49–78 years, 306 segments) had no evident PE on CTPA but LPD on LPS, eight patients (Group C, six men, 75%, median age 67 years, IQR 64–71 years, 144 segments) presented PE on CTPA but no LPD on LPS, and 13 patients (Group D, three men, 23%, median age 73 years, IQR 44–82 years, 252 segments) had no evident PE on CTPA and no LPD on LPS.
In Figures 1 and 2, two cases of perfusion defect detected by cmCTPA are shown.
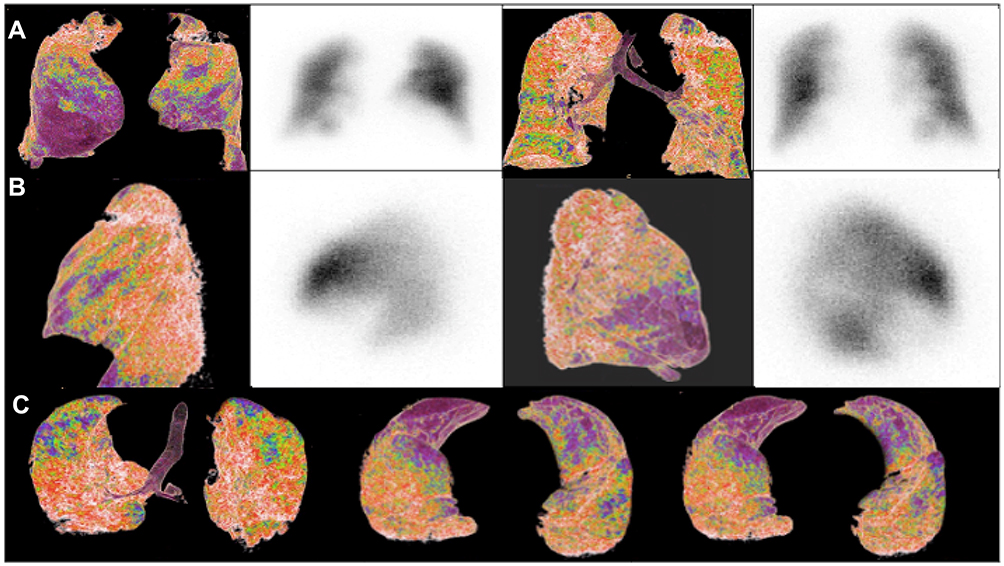 |
Figure 1 A comparison of lung perfusion in a patient with positive LPS and positive CTPA, with cmCTPA on the left and LPS on the right. (A) Coronal view on cmCTPA and LPS (anterior and posterior projections); (B) sagittal view on cmCTPA and LPS (left and right lobes); (C) axial view from apex to base on cmCTPA images. The figure shows a lung perfusion defect (LPD) in the middle lobe and lingula (violet areas), confirmed by LPS. |
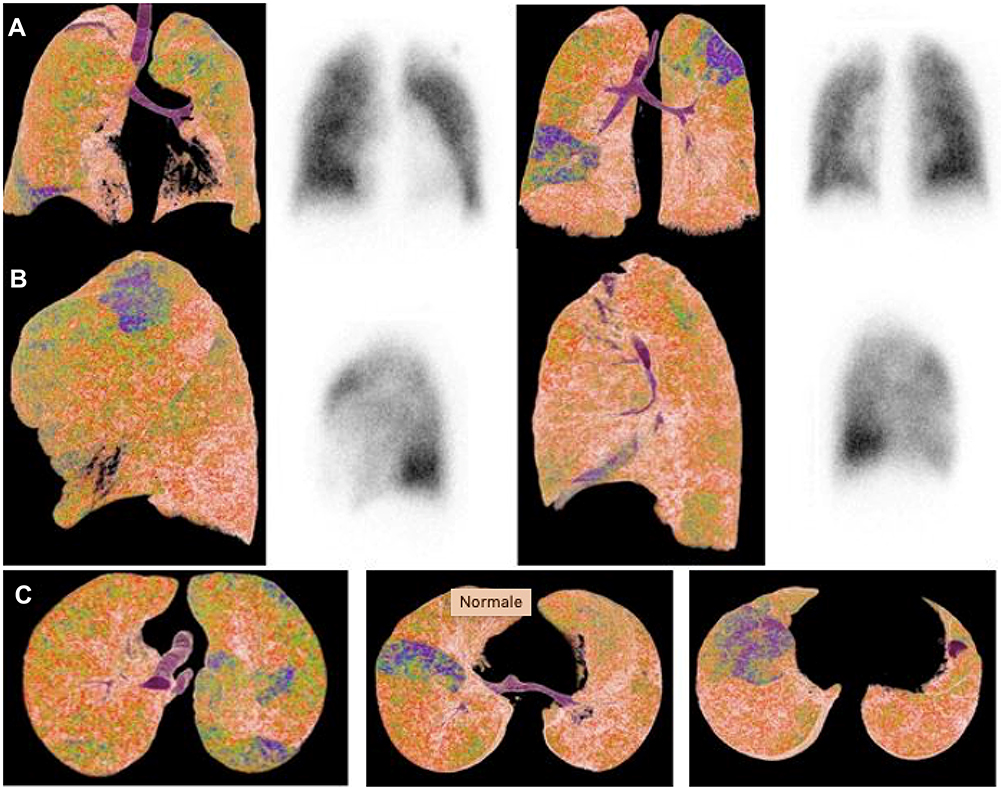 |
Figure 2 A comparison of lung perfusion in a patient with positive CTPA and negative LPS, with cmCTPA on the left and LPS on the right. (A) Coronal view on cmCTPA and LPS (from left to right: anterior and posterior projections); (B) sagittal view on cmCTPA and LPS (left and right lobes); (C) axial view from apex to base on cmCTPA images. The CTPA showed a perfusion defect in the upper left lobe in the posterior segment and lower right lobe (violet areas), while the LPS did not show any perfusion defect. |
Demographic and laboratory values of these cohorts of patients are presented in Table 1.
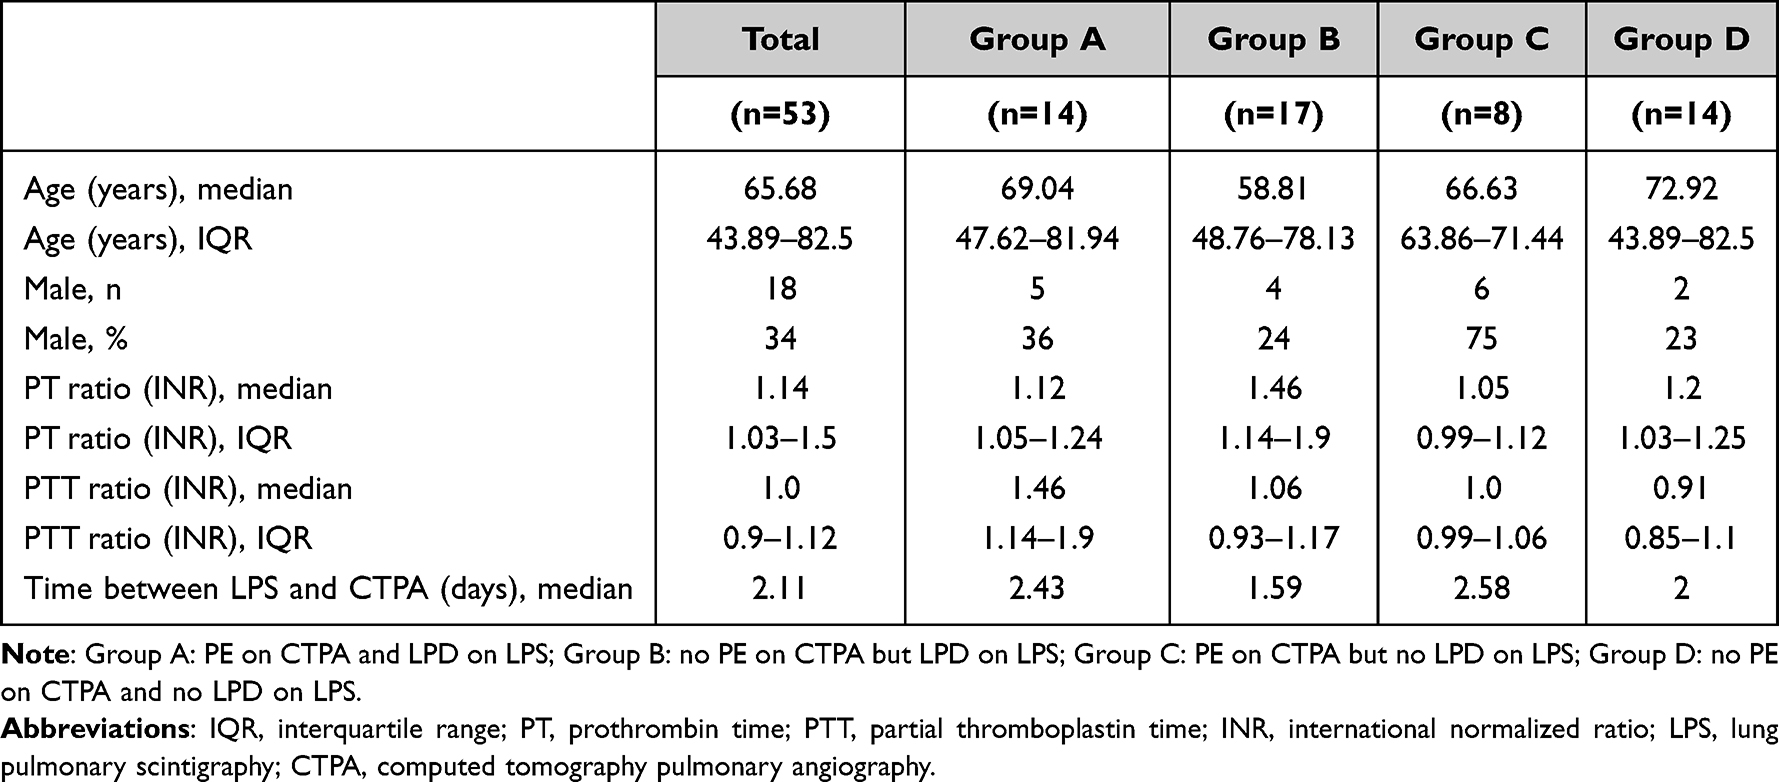 |
Table 1 Demographic and Biochemical Data in Different Cohorts of Patients |
A total of 954 segments, according to Boyden’s classification22,23, were analyzed, in both LPS and cmCTPA images, assessing lung perfusion.
Perfusion Analysis
The results for lung perfusion are presented in Table 2.
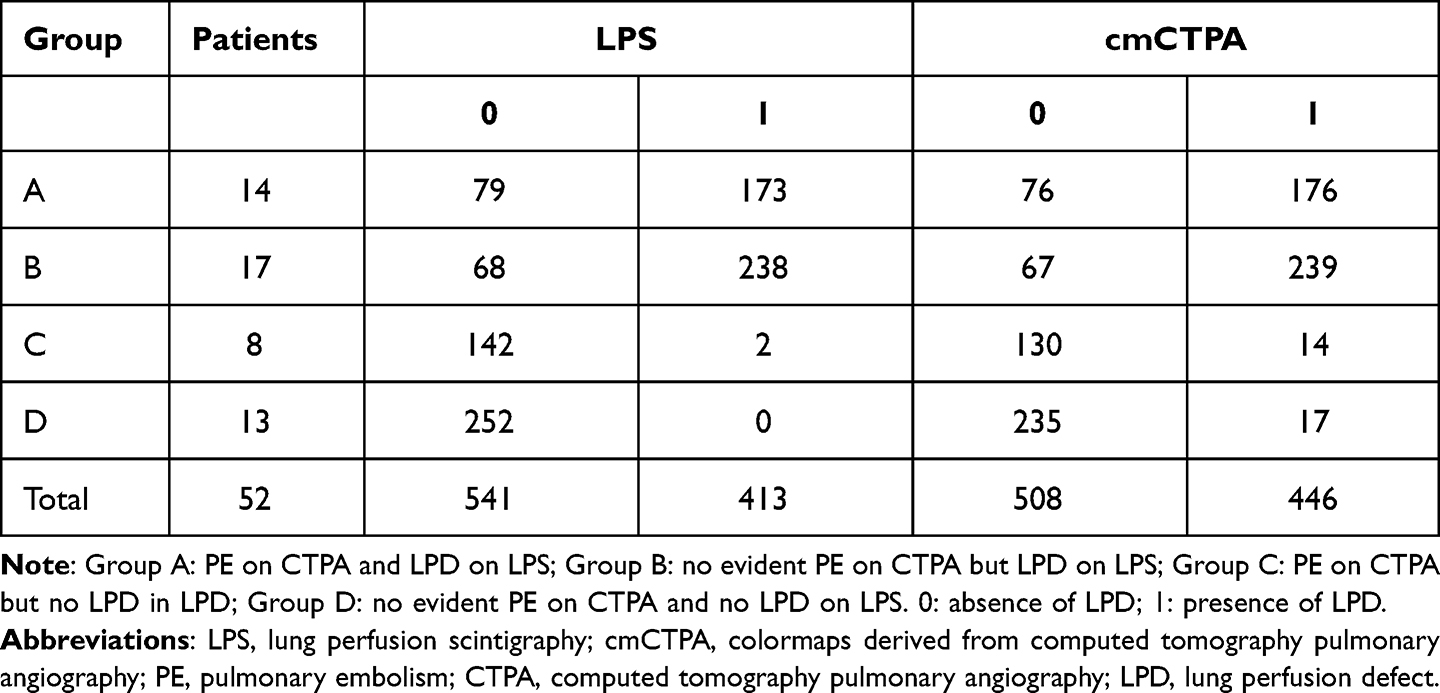 |
Table 2 Distribution of Lung Perfusion in Each Cohort of Patients |
Considering lung perfusion, on LPS images, a total of 413 segments (43%) presented LPDs; 541 segments (57%) were well perfused.
On cmCTPA images, a total of 446 segments (47%) presented LPDs; 508 segments (53%) were well perfused.
Statistical analyses are shown in Tables 3 and 4.
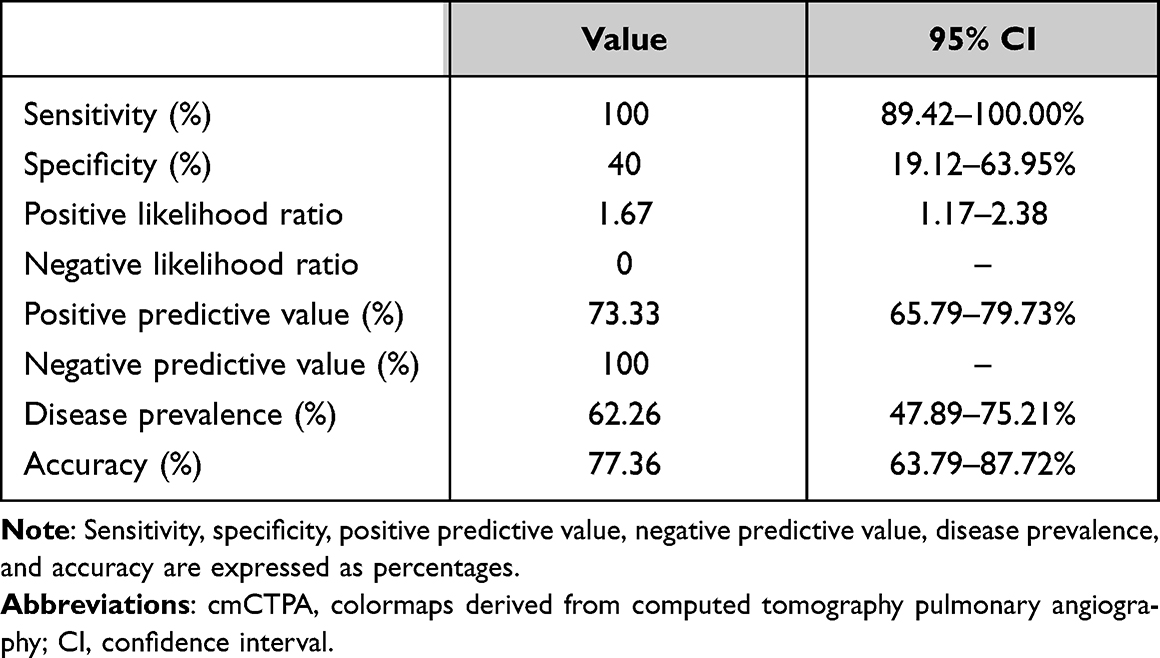 |
Table 3 Diagnostic Performance of cmCTPA in the Diagnosis of Lung Perfusion Defect Compared to Lung Perfusion Scintigraphy |
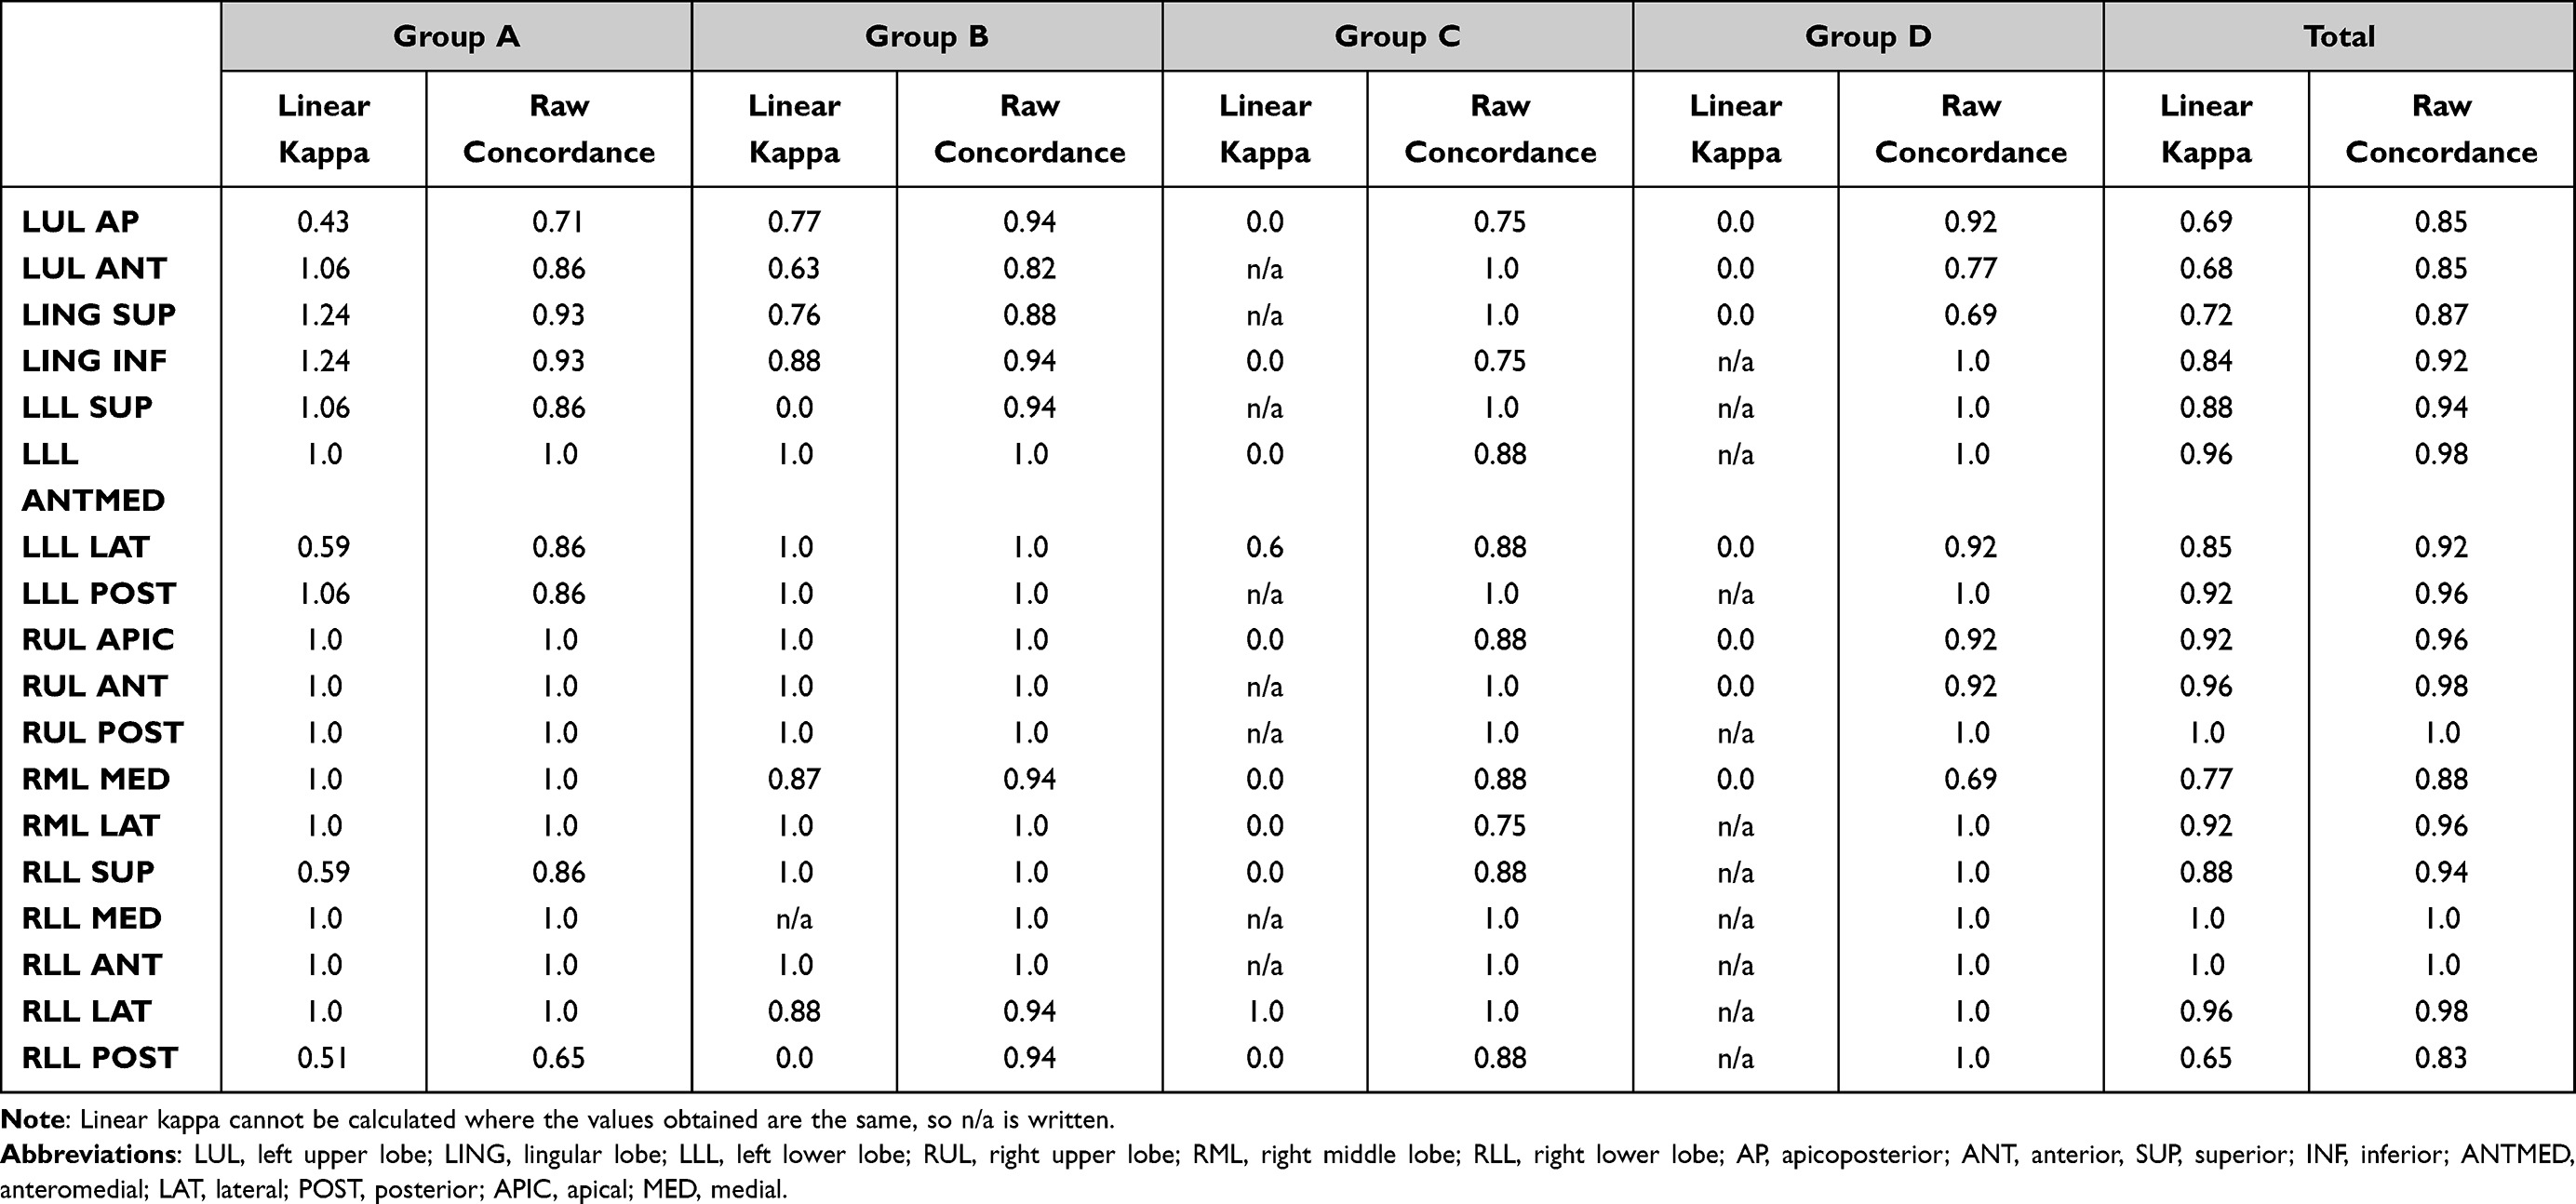 |
Table 4 Linear Kappa and Raw Concordance of Each Segment in Each Cohort |
The sensitivity, specificity, PPV, and NPV of cmCTPA were, respectively, 100%, 40%, 73%, and 100%; disease prevalence was 67%, accuracy was 77%, and positive and negative likelihood ratios were 1.67 and 0, respectively.
The linear kappa for the evaluation of the total patients ranged from 0.65 to 1.0; raw concordance ranged from 0.83 to 1. Linear kappa could not be calculated where the values obtained were the same. An almost perfect agreement was found between the two modalities in 13 segments (72%), while a substantial agreement was found in the remaining five segments (28%). No segments had slight, fair, or moderate concordance.
Discussion
LPS was the first established non-invasive imaging modality for the diagnosis of PE,13,14 through the evaluation of the regional distribution of pulmonary blood flow15 assessed as LPDs. However, it cannot identify endoluminal defects of the pulmonary arterial system.
CTPA is an imaging technique that is useful in the detection of PE, assessed as a filling defect in the pulmonary arterial system, but it cannot evaluate LPD.
CmCTPA are obtained using novel semi-automatic post-processing software, directly from CTPA images, which provides lung perfusion colormaps. Potentially, cmCTPA evaluation could increase the information provided by CTPA, but its diagnostic performance has not previously been evaluated.
Our study found a sensitivity of 100% of cmCTPA compared with LPS as the reference standard, with an NPV of 100%, so the absence of LPDs on cmCTPA is always retrieved as well-perfused segments on LPS and it can rule out PE.
For concordance, an overall high level of agreement in the number and location of LPDs has been observed between cmCTPA and LPS. A high level of agreement has also been retrieved where cmCTPA did not find any endoluminal pulmonary arterial defects. Lower concordance was found in anti-gravitational segments, eg the lingular and anterior segments of the inferior lobes, owing to a physiological iodate-based contrast gradient in CTPA due to gravity.
In our statistical analysis, low or negative values of linear kappa obtained in some patients could be explained by a high influence of unbalanced distribution; raw concordance is less influenced, varies less, and is more reliable. However, in most of the segments, high values of linear kappa and raw concordance reflected a good or almost perfect concordance between the two modalities.
Moreover, in patients with negative LPS and positive CTPA, cmCTPA was able to detect an LPD in the precise segment where CTPA had shown an endoluminal pulmonary arterial defect, so CTPA was able to detect the endoluminal defect in the feeding artery of the segment with an LPD on cmCTPA; no mismatch was retrieved between the two modalities in these cases.
In clinical practice, cmCTPA could be useful to rule out PE, increasing the performance of CTPA.
cmCTPA could play a role in assessing areas of hypoperfusion in patients in emergency units; Grasselli et al27 observed bilateral areas of hypoperfusion in coronavirus disease 2019 (COVID-19) intubated patients with increased D-dimer level and a clinical suspicion of PE. A more precise assessment of lung perfusion with cmCTPA could help in diagnosis and treatment.
LPS will continue to have a primary role in mismatch.28,29 Macroaggregates injected during LPS have better distribution than in CTPA, which reflects the normal intrapulmonary blood distribution and remains the reference standard for LPDs. Macroaggregates are retained in the pulmonary parenchymal capillaries for a longer period because of their large size,30,31 causing microembolization, and give a more precise evaluation of pulmonary perfusion compared with iodate-based contrast medium, which has a passive and faster distribution.
This is a preliminary study that evaluates the diagnostic performance of cmCTPA compared to LPS. Wildberger et al32 have already evaluated LPD on cmCTPA, but theirs was only a preliminary study, without comparison with a reference standard, and so without clinical relevance. Ierardi et al33 demonstrated a role for cmCTPA in a COVID-19 patient, but the data need to be confirmed by multicenter studies with a larger cohort of patients. Si-Mohamed et al20 compared and found a strong correlation in lung perfusion between dual-energy computed tomography (DE-CT) and single-photon emission computed tomography (SPECT), especially regarding iodine-based maps and colormaps obtained from CT images, but this method requires a more sophisticated scanner. DE-CT is another tomographic technique where acquisition is assessed with dual tubes, and several studies34–36 have shown that the evaluation of peripheral perfusion defects can be visualized with an accuracy comparable to that of SPECT. However, DE-CT has not been widely used owing to its cost, reduced spread, and technology that requires long technical training. As an alternative, cmCTPA offers the possibility to study lung perfusion with all makes of CT scanner, with a standard angiographic phase. Because of the compatibility between all of the machines, the easy software interface, and the fast image processing, the rapid spread of this software is desirable.
Tamara et al37 demonstrated the good correlation between the results of lung subtraction iodine mapping (LSIM) and LPS for identifying segmental pulmonary perfusion defects in patients with chronic thromboembolic pulmonary hypertension (CTEPH), and the significantly higher diagnostic accuracy of LSIM compared to CTPA, using LPS as the reference standard. Similarly to their study, we provided a new tool for obtaining both morphological and functional information, which could reduce the total radiation exposure and cost by obviating the need for LPS.
LPS, still considered the reference standard for LPD evaluation, is a planar technique that cannot be perfectly overlapped on to cmCTPA images, which are derived from tomographic images, and therefore only a qualitative comparison can be made. A segmental localization of LPDs requires a global evaluation of images in all planes, owing to an overlap of different lobes in each planar image.
SPECT is a novel diagnostic tool used in nuclear medicine, rather than planar LPS, for diagnosing PE, which has a high diagnostic value38 with a high NPV. Regarding comparison with CTPA, Blachere et al,39 Grenier et al,40 and Mayo et al41 have demonstrated that positive predictive value and negative predictive value were higher in CTPA, with a concordance between SPECT and CTPA of 95%. They found a higher sensitivity with SPECT, a higher specificity with CTPA, and an equally high accuracy with both methods. Furthermore, CTPA is more easily available, but has some contraindications, while SPECT is less widely available, has no definitive contraindications, and could have a possible role in detecting right ventricular dysfunction.19,38 Currently, head-to-head comparisons between ventilation/perfusion SPECT and CTPA are limited, and further studies should be performed to better assess which is the leading tool with the higher diagnostic accuracy.
Our study has several limitations. First, the main limitation is the absence in our cohorts of underlying pulmonary disease that could influence cmCTPA. Pathological parenchyma, with substitution of normal alveoli with emphysema, bullae, or fibrotic branches, such as in chronic obstructive pulmonary disease or idiopathic pulmonary fibrosis, creates a chronic baseline state of hypoperfusion in the pulmonary parenchyma, which has a corresponding pattern on LPS, called an “inhomogeneous distribution of macroaggregates”.42 In this condition, an LPD due to PE could pass undiagnosed if evaluated through cmCTPA. Even in chronic severe hypoperfusion due to chronic PE, a superimposed new LPD could be difficult to find.
Moreover, in a consolidated lung, pulmonary perfusion evaluated with cmCTPA can hardly be assessed. cmCTPA images are derived from densitometric lung values and the presence of a hyperattenuated area, as in consolidation, can strongly influence the cmCTPA evaluation. However, these promising results suggest that cmCTPA should be evaluated in other cohorts of patients, to enable a better assessment of this novel lung perfusion post-processing software.
Second, we enrolled only 53 patients in 4 years, and this fact undermines the statistical power of the results shown, so further studies in larger patient populations are required to confirm these preliminary findings. Third, our tool, cmCTPA, has low sensitivity on the lingular and anterior segments of the inferior lobes, owing to a physiological iodate-based contrast gradient in CTPA due to gravity.43 Fourth, ventilation imaging was not included for analysis in this study. Although ventilation imaging is necessary for the diagnosis of and treatment decisions in PE, the purpose of our study was to assess the diagnostic accuracy of cmCTPA for the evaluation of pulmonary perfusion. A final drawback of our study was the time interval, of 7 days, between the LPS and CTPA examinations.
Further studies are suggested, to compare cmCTPA with SPECT imaging, which is not yet considered the reference standard.44
Conclusion
cmCTPA, owing to its NPV (100%) and its overall high agreement in the number and location of LPDs compared to LPS, may have an upcoming role in the evaluation of lung perfusion in PE.
Ethics Statement
This study was approved by the institutional review board of IRCCS Fondazione Cà Granda Maggiore Policlinico Hospital. This study was conducted in accordance with the Declaration of Helsinki, was accepted by the Ethics Committee of IRCCS Fondazione Cà Granda Maggiore Policlinico Hospital, and complied with the Health Insurance Portability and Accountability Act. The patients provided written informed consent for publication of their data and accompanying images.
Disclosure
The authors report no conflicts of interest in this work.
References
1. Essien EO, Rali P, Mathai SC. Pulmonary embolism. Med Clin North Am. 2019;103:549–564. doi:10.1016/j.mcna.2018.12.013
2. Doherty S. Pulmonary embolism: an update. Aust Fam Physician. 2017;46:816–820.
3. Kruger PC, Eikelboom JW, Douketis JD, et al. Pulmonary embolism: update on diagnosis and management. Med J Aust. 2019;211(2):82–87. doi:10.5694/mja2.50233
4. Horlander KT, Mannino DM, Leeper KV. Pulmonary embolism mortality in the United States, 1979–1998: an analysis using multiple-cause mortality data. Arch Intern Med. 2003;163(14):1711–1717. doi:10.1001/archinte.163.14.1711
5. Gouveia M, Pinheiro L, Costa J, Borges M. Embolia pulmonar em Portugal: epidemiologia e mortalidade intra-hospitalar pulmonary embolism in Portugal: epidemiology and in-hospital mortality. Acta Med Port. 2016;29:432–440. doi:10.20344/amp.6367
6. Tapson VF, Agarwal R, Varma S. Acute pulmonary embolism. East J Med. 2009;14:57–68.
7. Kline JA. Diagnosis and exclusion of pulmonary embolism. Thromb Res. 2018;163:207–220. doi:10.1016/j.thromres.2017.06.002
8. Le Gal G, Righini M, Roy PM, et al. Prediction of pulmonary embolism in the emergency department: the revised geneva score. Ann Intern Med. 2006;144:165–171. doi:10.7326/0003-4819-144-3-200602070-00004
9. Wells PS, Anderson DR, Rodger M, et al. Derivation of a simple clinical model to categorize patients probability of pulmonary embolism: increasing the models utility with the SimpliRED D-dimer. Thromb Haemost. 2000;83:416–420. doi:10.1055/s-0037-1613830
10. Shen JH, Chen HL, Chen JR, et al. Comparison of the wells score with the revised Geneva score for assessing suspected pulmonary embolism: a systematic review and meta-analysis. J Thromb Thrombolysis. 2016;41:482–492. doi:10.1007/s11239-015-1250-2
11. Di Nisio M, Squizzato A, Rutjes AWS, et al. Diagnostic accuracy of D-dimer test for exclusion of venous thromboembolism: a systematic review. J Thromb Haemost. 2007;5:296–304. doi:10.1111/j.1538-7836.2007.02328.x
12. Stein PD, Hull RD, Patel KC, et al. D-Dimer for the exclusion of acute venous thrombosis and pulmonary embolism. Ann Intern Med. 2004;140:589–602. doi:10.7326/0003-4819-140-8-200404200-00005
13. Konstantinides SV, Torbicki A, Agnelli G, et al. ESC Guidelines on the diagnosis and management of acute pulmonary embolism. Eur Heart J. 2014;2014(35):3033–3080.
14. Bajc M, Neilly JB, Miniati M, et al. EANM guidelines for ventilation/perfusion scintigraphy: part 1. Pulmonary imaging with ventilation/perfusion single photon emission tomography. Eur J Nucl Med Mol Imaging. 2009;36(8):1356–1370. doi:10.1007/s00259-009-1170-5
15. Sostman HD, Stein PD, Gottschalk A, et al. Acute pulmonary embolism: sensitivity and specificity of ventilation-perfusion scintigraphy in PIOPED II study. Radiology. 2008;246(3):941–946. doi:10.1148/radiol.2463070270
16. Miniati M, Pistolesi M, Marini C, et al. Value of perfusion lung scan in the diagnosis of pulmonary embolism: results of the prospective investigative study of acute pulmonary embolism diagnosis (PISA-PED). Am J Respir Crit Care Med. 1996;154:1387–1393. doi:10.1164/ajrccm.154.5.8912753
17. Koukouraki SI, Hatzidakis AA, Mitrouska I, et al. Does lung perfusion scintigraphy continue to have a role in the clinical management of patients suspected of pulmonary embolism in the CT pulmonary angiography era? Ann Nucl Med. 2018;32(10):709–714. doi:10.1007/s12149-018-1295-3
18. Richman PB, Courtney DM, Friese J, et al. Prevalence and significance of nonthromboembolic findings on chest computed tomography angiography performed to rule out pulmonary embolism: a multicenter study of 1025 emergency department patients. Acad Emerg Med. 2004;11:642–647. doi:10.1111/j.1553-2712.2004.tb02407.x
19. Stein PD, Fowler SE, Goodman LR, et al. Multidetector computed tomography for acute pulmonary embolism. N Engl J Med. 2006;354(22):2317–2327. doi:10.1056/NEJMoa052367
20. Si-Mohamed S, Moreau-Triby C, Tylski P, et al. Head-to-head comparison of lung perfusion with dual-energy CT and SPECT-CT. Diagn Interv Imaging. 2020;101:299–310. doi:10.1016/j.diii.2020.02.006
21. Jardin M, Remy J. Segmental bronchovascular anatomy of the lower lobes: CT analysis. Am J Roentgenol. 1986;147:457–468. doi:10.2214/ajr.147.3.457
22. Boyden EA. Segmental anatomy of the lungs. A study pattern of the segmental bronchi and related pulmonary vessels. Reviews. 1955;66:158–159.
23. Kerl JM, Lehnert T, Schell B, et al. Intravenous contrast material administration at high-pitch dual-source CT pulmonary angiography: test bolus versus bolus-tracking technique. Eur J Radiol. 2012;81:2887–2891. doi:10.1016/j.ejrad.2011.09.018
24. Altman DG, Machin D, Bryant TN, Gardner MJ. Statistics with Confidence. London, UK: BMJ Books; 2000.
25. Mercaldo ND, Lau KF, Zhou XH. Confidence intervals for predictive values with an emphasis to case-control studies. Stat Med. 2007;26:2170–2183. doi:10.1002/sim.2677
26. Cohen J. Weighted kappa: nominal scale agreement with provision for scaled disagreement or partial credit. Psychol Bull. 1968;70:213–220. doi:10.1037/h0026256
27. Grasselli G, Tonetti T, Protti A, et al. Pathophysiology of COVID-19-associated acute respiratory distress syndrome: a multicentre prospective observational study. Lancet Respir Med. 2020;8:1201–1208. doi:10.1016/S2213-2600(20)30370-2
28. Chen SW, Mouratidis B. Comparison of lung scintigraphy and CT angiography in the diagnosis of pulmonary embolism. Australas Radiol. 2002;46:47–51. doi:10.1046/j.1440-1673.2001.00993.x
29. Robinson PJA. Ventilation-perfusion lung scanning and spiral computed tomography of the lungs: competing or complementary modalities? Eur J Nucl Med. 1996;23:1547–1553. doi:10.1007/BF01254484
30. Wagner HN, Sabiston DC, McAfee JG, Tow D, Stern HS. Diagnosis of massive pulmonary embolism in man by radioisotope scanning. N Engl J Med. 1964;271(8):377–384. doi:10.1056/NEJM196408202710801
31. Taplin GV, Johnson DE, Dore EK, et al. Lung photoscans with macroaggregates of human serum radioalbumin: experimental basis and initial clinical trials. Health Phys. 1964;10:1219–1227. doi:10.1097/00004032-196412000-00043
32. Wildberger JE, Niethammer MU, Klotz E, et al. Multi-slice CT for visualization of pulmonary embolism using perfusion weighted color maps. Rofo. 2001;173(4):289–294. doi:10.1055/s-2001-12473
33. Ierardi AM, Angileri SA, Arrichiello A, et al. Pulmonary embolism in COVID-19: ventilation and perfusion computed tomography. IDCases. 2020;21:e00805. doi:10.1016/j.idcr.2020.e00805
34. Goo HW, Goo JM. Dual-energy CT: new horizon in medical imaging. Korean J Radiol. 2017;18:555–569. doi:10.3348/kjr.2017.18.4.555
35. Fink C, Johnson TR, Michaely HJ, et al. Dual-energy CT angiography of the lung in patients with suspected pulmonary embolism: initial results. RoFo. 2008;180:879–883.
36. Lu GM, Wu SY, Yeh BM, et al. Dual-energy computed tomography in pulmonary embolism. Br J Radiol. 2010;83:707–718. doi:10.1259/bjr/16337436
37. Tamura M, Yamada Y, Kawakami T, et al. Diagnostic accuracy of lung subtraction iodine mapping CT for the evaluation of pulmonary perfusion in patients with chronic thromboembolic pulmonary hypertension: correlation with perfusion SPECT/CT. Int J Cardiol. 2017;243:538–543. doi:10.1016/j.ijcard.2017.05.006
38. Mortensen J, Gutte H. SPECT/CT and pulmonary embolism. Eur J Nucl Med Mol Imaging. 2014;41(S1):81–90. doi:10.1007/s00259-013-2614-5
39. Blachere H, Latrabe V, Montaudon M, et al. Pulmonary embolism revealed on helical CT angiography: comparison with ventilation-perfusion radionuclide lung scanning. AJR Am J Roentgenol. 2000;174(4):1041–1047. doi:10.2214/ajr.174.4.1741041
40. Grenier PA, Beigelman C, Coleman RE. Ventilation-perfusion scintigraphy in the PIOPED study. Part II. Evaluation of the scintigraphic criteria and interpretations. J Nucl Med. 1993;34(7):1119–1126.
41. Mayo JR, Remy-Jardin M, Muller NL, et al. Pulmonary embolism: prospective comparison of spiral CT with ventilation-perfusion scintigraphy. Radiology. 1997;205:447–452. doi:10.1148/radiology.205.2.9356627
42. Hess S, Frary EC, Gerke O, et al. State-of-the-Art imaging in pulmonary embolism: ventilation/perfusion single-photon emission computed tomography versus computed tomography angiography - controversies, results, and recommendations from a systematic review. Semin Thromb Hemost. 2016;42:833–845. doi:10.1055/s-0036-1593376
43. Fujita Y, Kent M, Wisner E. Combined assessment of pulmonary ventilation and perfusion with single-energy computed tomography and image processing. Acad Radiol. 2021;28(5):636–646. doi:10.1016/j.acra.2020.04.004
44. Bhatia KD, Ambati C, Dhaliwal R, et al. SPECT-CT/VQ versus CTPA for diagnosing pulmonary embolus and other lung pathology: pre-existing lung disease should not be a contraindication. J Med Imaging Radiat Oncol. 2016;60:492–497. doi:10.1111/1754-9485.12471
 © 2022 The Author(s). This work is published and licensed by Dove Medical Press Limited. The
full terms of this license are available at https://www.dovepress.com/terms
and incorporate the Creative Commons Attribution
- Non Commercial (unported, 3.0) License.
By accessing the work you hereby accept the Terms. Non-commercial uses of the work are permitted
without any further permission from Dove Medical Press Limited, provided the work is properly
attributed. For permission for commercial use of this work, please see paragraphs 4.2 and 5 of our Terms.
© 2022 The Author(s). This work is published and licensed by Dove Medical Press Limited. The
full terms of this license are available at https://www.dovepress.com/terms
and incorporate the Creative Commons Attribution
- Non Commercial (unported, 3.0) License.
By accessing the work you hereby accept the Terms. Non-commercial uses of the work are permitted
without any further permission from Dove Medical Press Limited, provided the work is properly
attributed. For permission for commercial use of this work, please see paragraphs 4.2 and 5 of our Terms.