
Back to Journals » Blood and Lymphatic Cancer: Targets and Therapy » Volume 15
LRG1 Drives AML Progression by Disrupting Myeloid Progenitor Regulation
Authors Guo R, Wu P, Yao S, Liu F
Received 28 July 2025
Accepted for publication 11 November 2025
Published 17 December 2025 Volume 2025:15 Pages 235—246
DOI https://doi.org/10.2147/BLCTT.S556618
Checked for plagiarism Yes
Review by Single anonymous peer review
Peer reviewer comments 2
Editor who approved publication: Dr Wilson Gonsalves
Rongxia Guo,1,* Peng Wu,2,* Shuxin Yao,3 Fumei Liu1
1Department of Laboratory Medicine, Zhongnan Hospital of Wuhan University, Wuhan, People’s Republic of China; 2Department of Laboratory Medicine, Guangdong Provincial People’s Hospital (Guangdong Academy of Medical Sciences), Southern Medical University, Guangzhou, People’s Republic of China; 3Frontier Science Center for Immunology and Metabolism, School of Medicine, Medical Research Institute, Wuhan University, Wuhan, People’s Republic of China
*These authors contributed equally to this work
Correspondence: Rongxia Guo, Email [email protected]
Background: Acute myeloid leukemia (AML) remains clinically challenging due to its molecular heterogeneity and poor outcomes, highlighting the urgent need for novel biomarkers and therapeutic targets.
Purpose: This study aims to identify and characterize the role of leucine-rich α-2-glycoprotein 1 (LRG1) in AML, evaluating its potential as both a prognostic biomarker and a therapeutic target.
Methods: We conducted an integrated basic and clinical investigation of LRG1 in AML. Methods included analysis of LRG1 expression in patient samples versus controls and pre- versus post-treatment, assessment of its clinical correlations with mutations and subtypes, and evaluation of its prognostic impact. Functional validation was performed using LRG1 knockdown models to assess effects on colony formation, apoptosis, and differentiation. Single-cell RNA profiling was utilized to identify LRG1-enriched cell populations and explore its role in microenvironmental crosstalk.
Results: Integrated analysis revealed significantly elevated LRG1 expression in AML patients compared to controls (P< 0.001), with levels decreasing post-treatment (P< 0.001). High LRG1 expression correlated with FLT3 mutations (P< 0.01), M3-M5 AML subtypes (M0&M1&M2 VS M3, P< 0.001; M0&M1&M2 VS M4, P< 0.01; M0&M1&M2 VS M5, P< 0.001; M3 VS M5, P< 0.05; M4 VS M5, P< 0.05), and worse survival (P< 0.01). Functionally, LRG1 knockdown impaired colony formation (P< 0.001), increased apoptosis (P< 0.001), and disrupted differentiation (P< 0.01). Single-cell profiling identified LRG1 enrichment in hematopoietic stem and progenitor cells (HSPCs) and myeloid progenitors, where it facilitated microenvironmental crosstalk via Macrophage Migration Inhibitory Factor (MIF), Galactoside-binding lectin (GALECTIN), and Cyclophilin A (CypA) signals.
Conclusion: Our findings establish LRG1 as a robust prognostic biomarker and a key functional regulator of AML maintenance through myeloid progenitor dysregulation, presenting it as a promising target for new therapeutic strategies.
Keywords: AML, hematopoietic dysregulation, LRG1, microenvironmental crosstalk
Introduction
Acute myeloid leukemia (AML) remains one of the most challenging hematologic malignancies, characterized by heterogeneous molecular alterations and clinical outcomes.1,2 The treatment landscape for AML has evolved significantly with the introduction of novel targeted therapeutics, moving beyond traditional cytotoxic chemotherapy. Agents such as FLT3 inhibitors (eg, midostaurin, gilteritinib) have improved outcomes for patients with FLT3-mutated AML.3 The B-cell lymphoma 2 (BCL-2) inhibitor venetoclax, in combination with hypomethylating agents, has become a cornerstone of therapy for older or unfit patients.4 Despite these advances in therapeutic strategies, the five-year survival rate for AML patients remains unsatisfactory, particularly in elderly populations and those with high-risk genetic abnormalities primary and acquired resistance remain common, and outcomes for many AML subtypes are still poor.5 This clinical challenge underscores the urgent need to identify novel biomarkers and therapeutic targets that can improve risk stratification and treatment outcomes.
The leukemic microenvironment has emerged as a critical determinant of disease progression and therapeutic resistance.6,7 Recent studies have highlighted the importance of secreted proteins in mediating crosstalk between leukemic cells and their microenvironment, facilitating disease maintenance and progression.8,9 Among these, leucine-rich α-2-glycoprotein 1 (LRG1) has attracted increasing attention due to its reported involvement in angiogenesis, inflammation, and tumor progression.10–12 However, its precise role in hematologic malignancies, particularly AML, remains poorly understood.
Preliminary evidence suggests LRG1 may play a role in hematopoietic regulation. Elevated serum LRG1 levels have been observed in myelodysplastic syndromes (MDS) and have been correlated with disease progression to AML.13 Furthermore, LRG1 has been implicated in the maintenance of cancer stem cells in solid tumors through modulation of Transforming Growth Factor Beta (TGF-β) signaling,14 a pathway known to be dysregulated in AML.15 These findings prompted us to investigate whether LRG1 might contribute to AML pathogenesis through similar or distinct mechanisms.
Although prior in vitro studies have implicated LRG1 in AML cell proliferation and apoptosis.16,17 These investigations were primarily confined to in vitro models and lacked exploration of its broader clinical relevance, mechanistic depth, and therapeutic potential. In this study, we present the first comprehensive analysis of LRG1 as an independent prognostic biomarker and a critical regulator of leukemic stemness and AML microenvironmental remodeling, using an integrated approach that combines in vitro models with single-cell RNA sequencing (scRNA-seq).
In this study, we presented a comprehensive analysis of LRG1 in AML, combining clinical correlation studies with functional characterization and single-cell transcriptomic profiling. The primary aim of this study was to define the clinical prognostic value of LRG1 expression in a well-characterized AML cohort, independent of established risk factors. Secondly, we sought to elucidate the functional role of LRG1 in maintaining leukemic stemness and promoting survival, specifically investigating its modulation of both cell-intrinsic signaling pathways and extrinsic interactions with the bone marrow microenvironment. Our goal was to evaluate the potential of LRG1 as a novel therapeutic target in AML.
Methods and Materials
Patients
Peripheral blood samples were collected from AML patients and healthy controls after obtaining informed consent, following protocols approved by the Medical Ethics Committees of School of Medicine, Zhongnan hospital, Wuhan University. Peripheral blood (total blood) was collected from participants into thylenediaminetetraacetic acid (EDTA) tubes. Peripheral Blood Mononuclear Cells (PBMCs) were isolated using Ficoll-Paque density gradient centrifugation within 2 hours of collection. Then the RNA was extracted immediately and stored at -80°C for analysis. To analyze the LRG1 expression using quantitative Real-Time Polymerase Chain Reaction (qRT-PCR), 5 AML patients and 5 healthy controls were included. For single-cell RNA sequencing (scRNA-seq) analysis, publicly available datasets (GSE116256) were downloaded from the Gene Expression Omnibus (GEO) database. Bone marrow aspirates of 5 healthy control donors, 16 AML patients at diagnosis, and 19 matched samples during treatment were analyzed using scRNA-seq and the details on healthy subjects and patients, please refer to the literature of Peter van Galen et al.18 As for the analysis of other public datasets, a total of 200 patients was included and the details about patients, please refer to the TCGA publicly available datasets.
Cell Culture
The human AML cell line Molm13 and the control human embryonic kidney 293T (HEK293T) cell line were cultured in Roswell Park Memorial Institute 1640 medium (RPMI-1640 medium) (for Molm13) and Dulbecco Modified Eagle’s Medium (DMEM) (for 293T), supplemented with 10% fetal bovine serum (FBS) and 1% penicillin-streptomycin. The HEK293T cell line and Molm-13 cell line were purchased from the Beyotime.
Knockdown
LRG1 knockdown was performed using three independent short hairpin RNA (shRNA) constructs (shLRG1#1-3) targeting LRG1 mRNA, with a non-targeting shRNA (shControl) as the negative control. The sequences for all shRNA constructs and qRT-PCR primers are provided in Supplementary Tables S1 and Table S2. Lentiviral particles were produced in HEK293T cells and transduced into Molm13 cells. Knockdown efficiency was validated by qRT-PCR 72 hours post-transduction. Total RNA from cells was purified using TRIzol (Life Technologies) following the instructions of manufacturer. 1 mg purified total RNA was retrotranscribed using the ReverTra Ace qRT-PCR Kit (TOYOBO). The levels of specific RNAs were measured using Bio-Rad qRT-PCR machine and Fast SybrGreen PCR master mix following the manufacturer’s instructions. The 2-ΔΔCt method was used to normalize expression.
Functional Assays
Cells were counted at day 0, day 2, day 4, and day 6 under microscope. Apoptosis was assessed by Annexin V-FITC/propidium iodide (PI) staining and analyzed by flow cytometry. Cells were seeded in methylcellulose medium (MethoCult™ H4434, StemCell Technologies) and colonies (>50 cells) were counted after 10–14 days. CD11b expression was analyzed by flow cytometry after 2 days of culture. For cell cycle assay, cells were fixed, stained with DAPI, and analyzed by flow cytometry.
scRNA-Seq
scRNA-seq data (GSE116256) were processed using the Seurat R package. Quality control included filtering cells with <200 or >6,000 detected genes and >15% mitochondrial reads. Data normalization, dimensionality reduction (PCA), and clustering (UMAP) were performed. Cell populations were annotated using canonical markers (eg, CD34 for Hematopoietic Stem and Progenitor Cells (HSPCs), Myeloperoxidase (MPO) for myeloid progenitors (MP)). Differentially expressed genes (DEGs) were identified (Wilcoxon test, adjusted p < 0.05), and Gene Ontology (GO) enrichment analysis was conducted using clusterProfiler. Multiple testing correction was applied to both the scRNA-seq and differential expression gene (DEG) analyses to control the false discovery rate (FDR). Specifically, for the identification of DEGs, p-values were adjusted using the Benjamini-Hochberg procedure to calculate FDR. Genes with an FDR-adjusted p-value of < 0.05 were considered statistically significant.
CellChat
Intercellular signaling pathways were inferred using CellChat, focusing on ligand-receptor interactions. Signaling strengths were compared between heathy people and AML patients, with emphasis on Macrophage Migration Inhibitory Factor (MIF), Galactoside-binding lectin (GALECTIN), and Cyclophilin A (CypA) pathways.
Survival
For survival analysis, we defined low and high LRG1 expression based on percentile ranks of the expression levels. Specifically, we utilized the R software (version 4.2.1) and the DESeq2 package (version 1.36.0) for our analysis. The division was made as follows: the low expression group includes samples in the 0–50% percentile range, while the high expression group includes samples in the 50–100% percentile range. The reference group for our analysis is the low expression group. The analysis framework involved extracting data for the LRG1 gene (ENSG00000171236.10) from selected public datasets and performing differential expression analysis on the raw count matrix using the DESeq2 package. The “survminer” package and the “ggplot2” package were used for visualizing the survival results.
Statistics
Statistical analyses were performed using R software. The normality of all data distributions was assessed using the Shapiro–Wilk test. Continuous variables are presented as mean ± standard deviation (SD) for normally distributed data. Comparisons between two groups were conducted using the two-tailed, unpaired Student’s t-test for normally distributed data. A p-value < 0.05 was considered statistically significant. Significance levels are denoted as *p < 0.05, **p < 0.01, ***p < 0.001, and ****p < 0.0001. The R package “survival” was used to compare the survival rate of the two groups. Log rank test and univariate Cox regression analysis were used for obtaining the p-values and hazard ratios (HR, with 95% confidence intervals [CI]) of Kaplan–Meier curves.
Results
LRG1 is Highly Expressed in AML Patients
To investigate the relationship between LRG1 and AML, we analyzed the expression of LRG1 at mRNA level using single cell sequencing data of GSE116256.18 The results showed that the expression of LRG1 is higher in cells from AML patients than healthy people (p<0.001) (Figure 1A). Moreover, after drug treatment, the expression of LRG1 was significantly decreased (p<0.001) (Figure 1B). These data indicated that LRG1 level is positively associated with AML. To confirm this phenotype, we harvested the peripheral blood from AML patients and healthy people and detected the mRNA of LRG1, respectively. The results showed that LRG1 is significantly elevated in AML patients compared to healthy people (p<0.05) (Figure 1C), which is consistent with the results of single cell sequencing analysis (Figure 1A). We also used the Molm13, a well-known AML cell line, to further clarify the LRG1 expression, the result showed that LRG1 expression is dramatically higher in Molm13 compared to 293T (p<0.001) (Figure 1D). Briefly, LRG1 is highly expressed in AML patients and AML related cell lines.
 |
Figure 1 LRG1 expression in healthy individuals and AML patients under different conditions. (A) LRG1 expression levels in healthy controls (Ctl) and AML patients. Data are presented as relative mRNA expression. Unpaired Student’s t-test was used for statistical comparisons. *** means P < 0.001. (B) LRG1 expression in healthy individuals (Ctl), AML patients, and AML patients treated with a drug. Statistical significance is indicated. Unpaired Student’s t-test was used for statistical comparisons. *** means P < 0.001. (C) Comparison of LRG1 mRNA expression between healthy people and AML patients. Statistical significance is indicated. Unpaired Student’s t-test was used for statistical comparisons. * means P < 0.05. (D) Relative mRNA expression of LRG1 in 293T and Molm13 cell lines. Statistical significance is indicated. Unpaired Student’s t-test was used for statistical comparisons. *** means P < 0.001. |
LRG1 Expression is Independent of Age and Sex
We divided AML patients into two groups with a cut-off of 60 years of age and there was no significant difference in LRG1 expression between the two groups (Figure 2A). Also, aging-related genes (Figure 2B) were not associated with LRG1 expression (Figure 2C). Besides, we analyzed the relationship between LRG1 and sex in AML patients. The results showed that LRG1 expression was not related to sex and the sex-related genes (Figure 2C) had no correlation with LRG1 expression (Figure 2D). In a word, LRG1 expression is independent of age and sex.
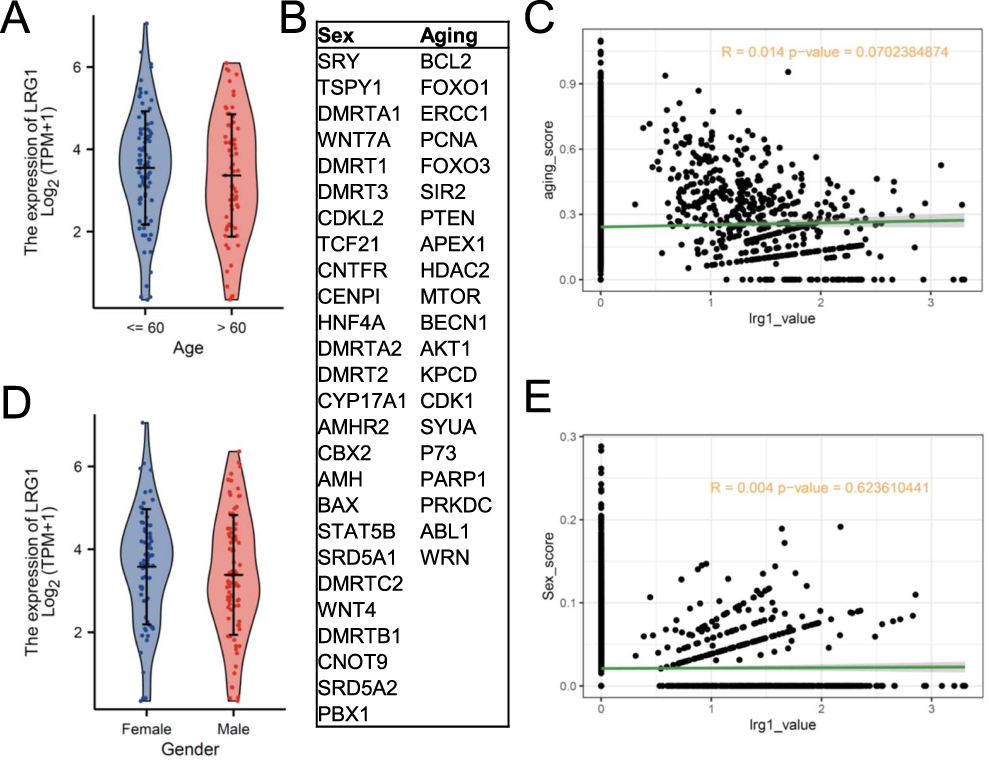 |
Figure 2 Analysis of LRG1 expression in relation to sex and aging. (A) Expression levels of LRG1 stratified by age (Age: <=60(115); >60(85)). (B) List of key genes associated with sex (eg, SRY, DMRT1, AMH) and aging (eg, BCL2, FOXO1, SIR2). (C) Correlation analysis between aging-related metrics and LRG1 expression. (D) Expression levels of LRG1 stratified by sex (Female (91); Male (109)). (E) Correlation analysis between sex-related metrics and LRG1 expression. |
High Expression of LRG1 is Associated with Poor Outcome
To explore whether LRG1 expression affect the prognosis of AML patients, overall survival (OS) analysis was conducted and the results showed that the high LRG1 expression group displayed poor OS compared to low expression group (p<0.01) (Figure 3A), which is consistent with the results of Figure 1B. What’s more, we found that LRG1 expression is higher in FLT3 mutation AML patients compared to FLT3 non-mutation patients (p<0.01) (Figure 3B). Moreover, LRG1 expression is significantly elevated in the M3, M4, M5 phases of AML compared to M0, M1, and M2 phases (M0&M1&M2 VS M3, P<0.001; M0&M1&M2 VS M4, P<0.01; M0&M1&M2 VS M5, P<0.001; M3 VS M5, P<0.05; M4 VS M5, P<0.05) (Figure 3C). In conclusion, these findings revealed that high expression of LRG1 is associated with poor outcome.
 |
Figure 3 Association between LRG1 expression and clinical outcomes in AML patients. (A) Kaplan-Meier survival curves comparing overall survival in patients stratified by high (36) vs low (34) LRG1 expression levels. (B) Comparison of LRG1 mRNA expression between FLT3 mutant (58) and FLT3 non-mutant (135). Statistical significance is indicated. Unpaired Student’s t-test was used for statistical comparisons. ** means P < 0.01. (C) Expression profiles of LRG1 across different phases of AML. M0&M1&M2 (19/44/44); M3 (21); M4 (42); M5 (22); M6 (3); M7 (3). Unpaired Student’s t-test was used for statistical comparisons. * means P < 0.05. ** means P < 0.01. *** means P < 0.001. |
LRG1 is Required for the Maintenance of AML
To further make sure the role of LRG1 in AML, LRG1 was knocked-down in the Molm13 and function assays were conducted to clarify whether LRG1 could affect the maintenance of AML (Figure 4A and B). As shown in Figure 4C, cells with low expression of LRG1 displayed less cells compared to control group. The apoptosis assay showed that LRG1 knockdown significantly accelerated cell death (P<0.01) (Figure 4D and E). Also, LRG1 knockdown impaired the colony-forming ability of cells (P<0.001) (Figure 4F and G). What’s more, we also detected the effect of LRG1 knockdown on myeloid differentiation. The results showed that cells with LRG1 knockdown significantly damaged the myeloid differentiation (P<0.01) (Figure 4H and I). Moreover, cell cycle was performed and the results showed that LRG1 knockdown had little effect on cell proliferation (Figure 4J and K). In a word, LRG1 knockdown obviously damaged the myeloid differentiation, accelerated AML cell apoptosis and reduced colony forming ability, demonstrating that LRG1 is required for the maintenance of AML.
 |
Figure 4 Functional characterization of LRG1 knockdown in AML cell lines. (A) Schematic overview of the experimental design to evaluate the role of LRG1 in AML cell maintenance. (B) LRG1 knockdown efficiency in Molm13 cells using three pairs of independent primers (shLRG1#1-3) compared to control (shControl). Unpaired Student’s t-test was used for statistical comparisons. ** means P < 0.01. *** means P < 0.001. (C) Cell numbers of control group and LRG1 knockdown groups at day 0, day 2, day 4, day 6 after culture. (D) Apoptosis analysis by Annexin V/PI staining showing the percentage of apoptotic cells (early and late) upon LRG1 knockdown. Unpaired Student’s t-test was used for statistical comparisons. **P < 0.01, ****P < 0.0001. (E) Representative flow cytometry plots of apoptosis. (F) Colony-forming number of control group and LRG1 knockdown groups. P-values are indicated for each comparison. Unpaired Student’s t-test was used for statistical comparisons. (G) Representative pictures of colony-forming unit assay. (H) The expression of CD11b in control group and LRG1 knockdown groups after culture. Unpaired Student’s t-test was used for statistical comparisons. (I) Representative flow cytometry results analyzing CD11b expression. (J) Representative flow cytometry results of cell cycle. (K) Comparison of cell cycle between control group and LRG1 knockdown groups. Unpaired Student’s t-test was used for statistical comparisons. |
LRG1 is Mainly Expressed in HSPCs and Myeloid Progenitor Cells
To explore which population LRG1 is expressed on, we analyzed the single cell sequencing data from AML patients and healthy people. After rigorous quality control, unbiased graph-based clustering was performed and 8 main population were identified (Figure 5A) using the specific makers displayed in Figure 5B. CD34 means HSPCs,19 MPO means MPs,20 Ficolin-1 (FCN1) means monocytes (Monos),21 Fragment constant epsilon Receptor I Alpha chain (FCER1A) means dendritic cells (DCs),22 Hemoglobin subunit delta (HBD) means erythroid cells (Erys),23 Granulysin (GNLY) means natural kill cells (NKs),24 CD3D means T cells,25 and CD79A represents B cells26 (Figure 5B). To verify the identified populations, heatmap was performed to show the differentially expressed genes (DEGs) in each cell type with all QC-passed cells (Figure 5C) and GO analysis was performed using DEGs (Figure 5D). What’s more, cell ratio was analyzed and the results showed that the ratios of HSPCs, MPs, Monos, and DCs cells were significantly higher than that in control group (Figure 5E). After defining the cell type, the expression of LRG1 was analyzed, and LRG1 was mainly expressed on HSPCs (P<0.0001), MPs (P<0.0001) and DCs (P<0.0001) of AML sample as shown in Figure 5F, indicating that LRG1 is mainly expressed in HSPCs, MPs and DCs and LRG1 expression in AML is significantly higher than that in healthy people.
 |
Figure 5 LRG1 is mainly expressed in HSPCs, MPs and DCs. (A) The uniform manifold approximation and projection (UMAP) of all QC-passed cells. HSPCs: hematopoietic stem and progenitor cells. B_cells: B cells. DCs: dendritic cells. Erys: erythroid cells. MP: myeloid progenitors. Monos: monocytes. NK: natural kill cell. T_cells: T cells. (B) Expression of cell population-specific genes. FCN1: Ficolin-1. FCER1A: Fragment constant epsilon Receptor I Alpha chain. GNLY: Granulysin. HBD: Hemoglobin subunit delta. MPO: Myeloperoxidase. (C) Heatmap showing the differentially expressed genes (DEGs) per cell type. (D) Gene ontology (GO) analysis of DEGs for each cell type. (E) Proportions of each cluster in different samples. (F) LRG1 expression in each cell type between healthy people and AML patients. Unpaired Student’s t-test was used for statistical comparisons. ns indicates no statistically significant difference (p > 0.05). **** means P < 0.0001. |
Cells with High LRG1 Expression Showed More Signal Supporting AML Maintenance
To investigate why cells with high LRG1 expression have a survival advantage, we analyzed the outgoing signaling patterns of cells from heathy people and AML patients. Our analysis revealed significant upregulation of multiple inflammatory pathways—including MIF, GALECTIN, CypA, B cell-activating factor (BAFF), and A proliferation-inducing ligand (APRIL)—in AML-derived HSPCs and MPs (Figure 6A). Among these, we focused on MIF, GALECTIN, and CypA due to their established roles in immune modulation and myeloid activation, which aligned closely with our functional findings.27–29 Specifically, LRG1-high cells in AML exhibited enhanced interactions with multiple immune cell types (B cells, DCs, erythroids, monocytes, NK cells, and T cells) compared to LRG1-low cells (Figure 6B). Moreover, GO analysis of differentially expressed genes demonstrated significant enrichment of “myeloid leukocyte activation” in LRG1-high cells (Figure 6C), and key genes related to myeloid differentiation were upregulated in these cells (p<0.001) (Figure 6D–F). Notably, CypA—a secreted immunophilin known to promote inflammatory cell recruitment—emerged as a candidate mediator of the observed cell-cell communication. Based on these results, we propose that high-LRG1 AML cells promote a pro-survival microenvironment through enhanced inflammatory signaling—particularly via MIF, GALECTIN, and CypA—which facilitates the recruitment and interaction of supportive immune and stromal cells, thereby contributing to leukemic maintenance.
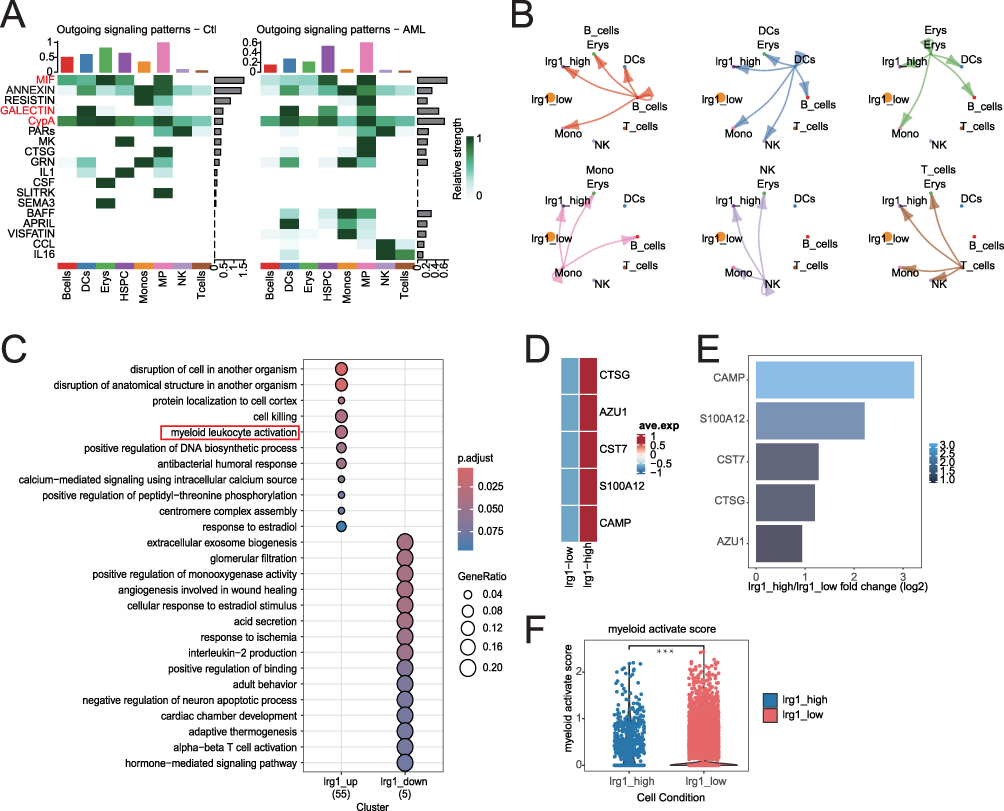 |
Figure 6 Dysregulated cell-cell communication and myeloid activation in AML associated with LRG1 expression subgroups. (A) Outgoing signaling patterns in control (Ctl, left) and AML (right) samples, showing relative interaction strengths of key signaling molecules. The signaling pathways (MIF, GALECTIN, CyPA) highlighted in red represent those that were upregulated in both HSPC and MP cell populations of AML. (B) Cell-type-specific signaling strengths (relative values) between LRG1-high and LRG1-low subgroups. 0 was used as a cutoff, cells were categorized into two groups: the high LRG1 expression group (expression level > 0) and the low LRG1 expression group (expression level ≤ 0). (C) Enriched biological pathways for differentially expressed genes in LRG1_up (55 genes) and LRG1_down (5 genes) clusters. The red box highlights the signal pathway that are in agreement with the functional results. 0 was used as a cutoff, cells were categorized into two groups: the LRG1_up group (expression level > 0) and the LRG1_down group (expression level ≤ 0). (D) Expression of myeloid-associated genes in LRG1_high group and LRG 1_low groups. 0 was used as a cutoff, cells were categorized into two groups: the high LRG1 expression group (expression level > 0) and the low LRG1 expression group (expression level ≤ 0). (E) Log2 fold change in expression of myeloid-associated genes in LRG1_high and LRG1_low groups. 0 was used as a cutoff, cells were categorized into two groups: the high LRG1 expression group (expression level > 0) and the low LRG1 expression group (expression level ≤ 0). (F) Myeloid activation scores are significantly elevated in LRG1_high cells. Unpaired Student’s t-test was used for statistical comparisons. ***P < 0.001. 0 was used as a cutoff, cells were categorized into two groups: the high LRG1 expression group (expression level > 0) and the low LRG1 expression group (expression level ≤ 0). |
Discussion
Our study identified LRG1 as a key player in AML, demonstrating significantly elevated expression in AML patients compared to healthy individuals, with levels declining post-treatment—a pattern consistent with a potential disease progression biomarker. Notably, high LRG1 expression correlated with adverse clinical features, including shortened overall survival, FLT3 mutations (a known poor prognostic marker),30 and advanced AML subtypes (M3-M5), suggesting its involvement in aggressive disease biology. Functional studies further supported its pathogenic role. LRG1 knockdown disrupted myeloid differentiation, enhanced apoptosis, and diminished clonogenic potential in AML cells, collectively implicating LRG1 as a critical regulator of leukemogenesis.
The landscape of AML research has been profoundly reshaped by the application of single-cell RNA sequencing (scRNA-seq) technologies, which have provided unprecedented resolution in dissecting the cellular heterogeneity and molecular mechanisms underlying disease progression and relapse. Recent studies have moved beyond bulk tissue analysis to delineate the transcriptomic profiles of distinct cellular subpopulations within the leukemic microenvironment. For instance, investigations have focused on characterizing leukemia stem cells (LSCs) and their evolving signaling networks during disease progression,18 and developing innovative methods like MutaSeq to precisely identify and track leukemic and pre-leukemic stem cells by combining single-cell transcriptomics with clonal lineage tracing.31 Longitudinal single-cell profiling has further illuminated the dynamic responses of AML to chemotherapy, revealing how LSCs persist and how the microenvironment is remodeled post-treatment.32 These advanced profiling studies have collectively identified a range of novel cellular biomarkers and potential therapeutic targets associated with specific AML subtypes, patient prognosis, and treatment resistance. Building upon this foundational work, our study further investigated the role of the less-explored biomarker LRG1, seeking to define its functional impact on AML pathogenesis and its potential clinical utility within the refined cellular framework established by these recent discoveries.
Single-cell transcriptomic profiling uncovered a distinct expression pattern of LRG1 in AML, with predominant localization in HSPCs, MPs, and DCs, which were critical for leukemic propagation. Strikingly, LRG1 high AML cells demonstrated extensive crosstalk with both immune and stromal compartments, accompanied by marked enrichment of myeloid activation pathways. This observation suggested LRG1 may orchestrate a pro-leukemic niche through both autocrine and paracrine mechanisms. Further analysis revealed enhanced activity of multiple pro-survival signaling axes in LRG1 high cells, including MIF, GALECTIN, and notably CypA. The prominent involvement of CypA, a known mediator of inflammatory cell recruitment,33 provides a plausible mechanistic link between LRG1 expression and the establishment of an immune-permissive microenvironment conducive to AML progression.
Notably, our findings established LRG1 as a clinically robust biomarker, as its expression pattern remained consistent regardless of age or sex variables - a critical feature for reliable prognostic application across heterogeneous AML cohorts.34 The significant correlation between elevated LRG1 expression and FLT3 mutations suggests LRG1 may functionally contribute to the aggressive phenotype characteristic of FLT3-mutated AML. Furthermore, the pronounced enrichment of myeloid differentiation-associated genes in LRG1-high-expressing cells provides compelling evidence for its role in maintaining leukemic stemness, reinforcing its position as a key mediator of AML pathogenesis.
Despite these findings, our study has several limitations. First, the functional validation was primarily performed in cell lines and future studies should confirm these results in primary patient samples and in vivo models. Second, to strengthen the clinical context, a direct comparison of LRG1 with other emerging AML biomarkers (eg, CD123, TIM-3, IL1RAP) is warranted to delineate its independent or complementary prognostic value. Third, the precise molecular mechanisms by which LRG1 modulates the MIF, GALECTIN and CypA signaling pathways remain to be fully elucidated. Finally, our clinical cohort was of limited size and retrospective in nature; larger prospective studies are needed to validate the prognostic utility of LRG1.
In conclusion, our findings suggest that LRG1 may act as a regulator of AML maintenance and a promising prognostic biomarker. Future studies should explore the mechanistic basis of LRG1-mediated signaling crosstalk in the leukemic niche and evaluate its therapeutic potential as a target in AML. More specifically, further research is warranted to: (1) elucidate the precise molecular mechanisms by which LRG1 modulates the MIF, GALECTIN and CypA signaling pathways; (2) validate the efficacy of targeting LRG1, either alone or in combination with existing agents (eg, FLT3 or BCL-2 inhibitors), in pre-clinical AML models such as patient-derived xenografts (PDX); (3) investigate the potential of LRG1 as a liquid biopsy marker for dynamic disease monitoring; and (4) explore the structure-function relationship of LRG1 to inform the development of neutralizing antibodies or small-molecule inhibitors. Given its impact on cell survival, differentiation, and microenvironment interactions, targeting LRG1 may offer a novel strategy to disrupt AML progression and improve patient outcomes.
Data Sharing Statement
The data sets used in this study are available from the corresponding author on reasonable request. Single cell sequencing data is accessible with the accession number GSE116256. The other mRNA data of AML analyzed in this study was obtained from The Cancer Genome Atlas (TCGA) (https://portal.gdc.cancer.gov/) database. Further information and requests for reagents may be directed to and will be fulfilled by the Lead Contact, Rongxia Guo ([email protected]).
Ethical Compliance
This study involving human participants was conducted in accordance with the ethical principles of the Declaration of Helsinki. The study protocol was reviewed and approved by the Institutional Ethics Committee of Zhongnan Hospital, Wuhan university. Written informed consent was obtained from all individual participants prior to their enrollment in the study.
Consent for Publication
All authors contributed to the review of the manuscript and agree with to publish.
Author Contributions
Dr Peng Wu is co-first author. All authors made a significant contribution to the work reported, whether that is in the conception, study design, execution, acquisition of data, analysis and interpretation, or in all these areas; took part in drafting, revising or critically reviewing the article; gave final approval of the version to be published; have agreed on the journal to which the article has been submitted; and agree to be accountable for all aspects of the work.
Funding
This work is supported by the grants from the National Natural Science Foundation (NSFC) (82301997 to R.G., 82502118 to P.W.).
Disclosure
The authors declare no competing financial interests.
References
1. Döhner H, Estey E, Grimwade D, et al. Diagnosis and management of AML in adults: 2017 ELN recommendations from an international expert panel. Blood. 2017;129(4):424–447. doi:10.1182/blood-2016-08-733196
2. Döhner H, Weisdorf DJ, Bloomfield CD. Acute Myeloid Leukemia. N Engl J Med. 2015;373(12):1136–1152. doi:10.1056/NEJMra1406184
3. Larrosa-Garcia M, Baer MR. FLT3 Inhibitors in Acute Myeloid Leukemia: current Status and Future Directions. Mol Cancer Ther. 2017;16(6):991–1001. doi:10.1158/1535-7163.MCT-16-0876
4. DiNardo CD, Jonas BA, Pullarkat V, et al. Azacitidine and Venetoclax in Previously Untreated Acute Myeloid Leukemia. N Engl J Med. 2020;383(7):617–629. doi:10.1056/NEJMoa2012971
5. De Kouchkovsky I, Abdul-Hay M. ‘Acute myeloid leukemia: a comprehensive review and 2016 update’. Blood Cancer J. 2016;6(7):e441. doi:10.1038/bcj.2016.50
6. Tettamanti S, Pievani A, Biondi A, Dotti G, Serafini M. Catch me if you can: how AML and its niche escape immunotherapy. Leukemia. 2022;36(1):13–22. doi:10.1038/s41375-021-01350-x
7. Witkowski MT, Kousteni S, Aifantis I. Mapping and targeting of the leukemic microenvironment. J Exp Med. 2020;217(2). doi:10.1084/jem.20190589
8. Ciantra Z, Paraskevopoulou V, Aifantis I. The rewired immune microenvironment in leukemia. Nature Immunology. 2025;26(3):351–365. doi:10.1038/s41590-025-02096-9
9. Skroblyn T, Joedicke JJ, Pfau M. CXCR4 mediates leukemic cell migration and survival in the testicular microenvironment. The Journal of Pathology. 2022;258(1):12–25. doi:10.1002/path.5924
10. Camilli C, Hoeh AE, De Rossi G, Moss SE, Greenwood J. LRG1: an emerging player in disease pathogenesis. Journal of Biomedical Science. 2022;29(1):6. doi:10.1186/s12929-022-00790-6
11. Hong Q, Zhang L, Fu J, et al. LRG1 Promotes Diabetic Kidney Disease Progression by Enhancing TGF-β-Induced Angiogenesis. Journal of the American Society of Nephrology: JASN. 2019;30(4):546–562. doi:10.1681/ASN.2018060599
12. Ruan Z, Cao G, Qian Y, et al. Single-cell RNA sequencing unveils Lrg1’s role in cerebral ischemia‒reperfusion injury by modulating various cells. J Neuroinflammation. 2023;20(1):285. doi:10.1186/s12974-023-02941-4
13. Majek P, Pecankova K, Cermak J, Dyr JE. Plasma Protein Biomarker Candidates for Myelodysplastic Syndrome Subgroups. Biomed Res Int. 2015;2015:209745. doi:10.1155/2015/209745
14. Wang X, Abraham S, McKenzie JAG, et al. LRG1 promotes angiogenesis by modulating endothelial TGF-β signalling. Nature. 2013;499(7458):306–311. doi:10.1038/nature12345
15. Wang D, Sun Z, Zhu X, Zheng X, Zhou Y. GARP-mediated active TGF-β1 induces bone marrow NK cell dysfunction in AML patients with early relapse post-allo-HSCT. Blood. 2022;140(26):2788–2804. doi:10.1182/blood.2022015474
16. Wu ZJ, Sun Q, Gu DL, Wang LQ, Li JY, Jin H. Expression of circ-KEL in acute myeloid leukemia and its regulatory mechanisms in leukemic cells. Zhonghua xueyexue zazhi. 2021;42(3):230–237. doi:10.3760/cma.j.issn.0253-2727.2021.03.009
17. Xiao S, Zhu H. Leucine-Rich Alpha-2-Glycoprotein1 Gene Interferes with Regulation of Apoptosis in Leukemia KASUMI-1 Cells. Med Sci Monitor. 2018;24:8348–8356. doi:10.12659/MSM.911249
18. van Galen P, Hovestadt V, Mh WI, et al. Single-Cell RNA-Seq Reveals AML Hierarchies Relevant to Disease Progression and Immunity. Cell. 2019;176(6):1265–1281.e1224. doi:10.1016/j.cell.2019.01.031
19. Zhou Y, Cai X, Zhang X, et al. Mesenchymal stem/stromal cells from human pluripotent stem cell-derived brain organoid enhance the ex vivo expansion and maintenance of hematopoietic stem/progenitor cells. Stem Cell Res Ther. 2024;15(1):68. doi:10.1186/s13287-023-03624-w
20. Scholz W, Platzer B, Schumich A, et al. Initial human myeloid/dendritic cell progenitors identified by absence of myeloperoxidase protein expression. Exp Hematol. 2004;32(3):270–276. doi:10.1016/j.exphem.2003.12.007
21. Munthe-Fog L, Hummelshoj T, Honoré C, et al. Variation in FCN1 affects biosynthesis of ficolin-1 and is associated with outcome of systemic inflammation. Genes Immun. 2012;13(7):515–522. doi:10.1038/gene.2012.27
22. García-González PA, Schinnerling K, Sepúlveda-Gutiérrez A, et al. Dexamethasone and Monophosphoryl Lipid A Induce a Distinctive Profile on Monocyte-Derived Dendritic Cells through Transcriptional Modulation of Genes Associated With Essential Processes of the Immune Response. Front Immunol. 2017;8:1350. doi:10.3389/fimmu.2017.01350
23. Acuto S, Urzi G, Schimmenti S, Maggio A, O’Neill D, Bank A. An element upstream from the human delta-globin-encoding gene specifically enhances beta-globin reporter gene expression in murine erythroleukemia cells. Gene. 1996;168(2):237–241. doi:10.1016/0378-1119(96)83098-8
24. Bai Q, Li R, He X, et al. Single-cell landscape of immune cells during the progression from HBV infection to HBV cirrhosis and HBV-associated hepatocellular carcinoma. Front Immunol. 2023;14:1320414. doi:10.3389/fimmu.2023.1320414
25. McAuley GE, Yiu G, Chang PC, et al. Human T cell generation is restored in CD3δ severe combined immunodeficiency through adenine base editing. Cell. 2023;186(7):1398–1416.e1323. doi:10.1016/j.cell.2023.02.027
26. Mason DY, Cordell JL, Brown MH, et al. CD79a: a novel marker for B-cell neoplasms in routinely processed tissue samples. Blood. 1995;86(4):1453–1459. doi:10.1182/blood.V86.4.1453.bloodjournal8641453
27. Bernhagen J, Krohn R, Lue H, et al. MIF is a noncognate ligand of CXC chemokine receptors in inflammatory and atherogenic cell recruitment. Nat Med. 2007;13(5):587–596. doi:10.1038/nm1567
28. Liu FT, Rabinovich GA. Galectins as modulators of tumour progression. Nat Rev Cancer. 2005;5(1):29–41. doi:10.1038/nrc1527
29. Satoh K, Matoba T, Suzuki J, et al. Cyclophilin A mediates vascular remodeling by promoting inflammation and vascular smooth muscle cell proliferation. Circulation. 2008;117(24):3088–3098. doi:10.1161/CIRCULATIONAHA.107.756106
30. Daver N, Schlenk RF, Russell NH, Levis MJ. Targeting FLT3 mutations in AML: review of current knowledge and evidence. Leukemia. 2019;33(2):299–312. doi:10.1038/s41375-018-0357-9
31. Velten L, Story BA, Hernández-Malmierca P. Identification of leukemic and pre-leukemic stem cells by clonal tracking from single-cell transcriptomics. Nature Communications. 2021;12(1):1366. doi:10.1038/s41467-021-21650-1
32. Naldini MM, Casirati G, Barcella M. Longitudinal single-cell profiling of chemotherapy response in acute myeloid leukemia. Nature Communications. 2023;14(1):1285. doi:10.1038/s41467-023-36969-0
33. Nigro P, Pompilio G, Capogrossi MC. Cyclophilin A: a key player for human disease. Cell Death Dis. 2013;4(10):e888. doi:10.1038/cddis.2013.410
34. Li JF, Cheng WY, Lin XJ. Aging and comprehensive molecular profiling in acute myeloid leukemia. Proceedings of the National Academy of Sciences of the United States of America. 2024;121(10):e2319366121. doi:10.1073/pnas.2319366121
 © 2025 The Author(s). This work is published and licensed by Dove Medical Press Limited. The
full terms of this license are available at https://www.dovepress.com/terms
and incorporate the Creative Commons Attribution
- Non Commercial (unported, 4.0) License.
By accessing the work you hereby accept the Terms. Non-commercial uses of the work are permitted
without any further permission from Dove Medical Press Limited, provided the work is properly
attributed. For permission for commercial use of this work, please see paragraphs 4.2 and 5 of our Terms.
© 2025 The Author(s). This work is published and licensed by Dove Medical Press Limited. The
full terms of this license are available at https://www.dovepress.com/terms
and incorporate the Creative Commons Attribution
- Non Commercial (unported, 4.0) License.
By accessing the work you hereby accept the Terms. Non-commercial uses of the work are permitted
without any further permission from Dove Medical Press Limited, provided the work is properly
attributed. For permission for commercial use of this work, please see paragraphs 4.2 and 5 of our Terms.