Back to Journals » Cancer Management and Research » Volume 10
Low tumor purity is associated with poor prognosis, heavy mutation burden, and intense immune phenotype in colon cancer
Authors Mao Y ![]() , Feng Q, Zheng P, Yang L, Liu T, Xu Y, Zhu D, Chang W, Ji M, Ren L, Wei Y, He G, Xu J
, Feng Q, Zheng P, Yang L, Liu T, Xu Y, Zhu D, Chang W, Ji M, Ren L, Wei Y, He G, Xu J
Received 22 April 2018
Accepted for publication 28 June 2018
Published 17 September 2018 Volume 2018:10 Pages 3569—3577
DOI https://doi.org/10.2147/CMAR.S171855
Checked for plagiarism Yes
Review by Single anonymous peer review
Peer reviewer comments 2
Editor who approved publication: Dr Antonella D'Anneo
Yihao Mao,1,* Qingyang Feng,1,2,* Peng Zheng,1,* Liangliang Yang,1,* Tianyu Liu,1 Yuqiu Xu,1 Dexiang Zhu,1,2 Wenju Chang,1,2 Meiling Ji,1,2 Li Ren,1,2 Ye Wei,1,2 Guodong He,1,2 Jianmin Xu1,2
1Department of General Surgery, Zhongshan Hospital, Fudan University, Shanghai 200030, China; 2Shanghai Engineering Research Center of Colorectal Cancer Minimally Invasive, Shanghai 200030, China
*These authors contributed equally to this work
Purpose: Tumor purity is defined as the proportion of cancer cells in the tumor tissue. The impact of tumor purity on colon cancer (CC) prognosis, genetic profile, and microenvironment has not been thoroughly accessed.
Materials and methods: Clinical and transcriptomic data from three public datasets, GSE17536/17537, GSE39582, and TCGA, were retrospectively collected (n=1,248). Tumor purity of each sample was inferred by a computational method based on transcriptomic data. Survival-related analyses were performed on microarray dataset containing GSE17536/17537 and GSE39582 (n=794), whereas TCGA dataset was utilized for subsequent genomic analysis (n=454).
Results: Right-sided CC patients showed a significantly lower tumor purity. Low purity CC conferred worse survival, and tumor purity was identified as an independent prognostic factor. Moreover, high tumor purity CC patients benefited more from adjuvant chemotherapy. Subsequent genomic analysis found that the mutation burden was negatively associated with tumor purity, with only APC and KRAS significantly more mutated in high purity CC. However, no somatic copy number alteration event was correlated with tumor purity. Furthermore, immune-related pathways and immunotherapy-associated markers (programmed cell death protein 1 [PD-1], programmed death-ligand 1 [PD-L1], cytotoxic T-lymphocyte-associated protein 4 [CTLA-4], Lymphocyte-activation gene 3 [LAG-3] and T-cell immunoglobulin and mucin-domain containing-3 [TIM-3]) were highly enriched in low purity samples. Notably, the relative proportion of M2 macrophages and neutrophils, which indicated worse survival in CC, was negatively associated with tumor purity.
Conclusion: Tumor purity exhibited potential value for CC prognostic stratification as well as adjuvant chemotherapy benefit prediction. The relative worse survival in low purity CC may attribute to higher mutation frequency in key pathways and purity-related microenvironmental changing.
Keywords: adjuvant chemotherapy, colon cancer, prognosis, tumor microenvironment, tumor purity
Introduction
Colorectal cancer (CRC) was estimated to be the third most commonly diagnosed cancer in the USA for both men and women in 2018, and nearly 70% were colon cancer (CC) cases.1 Increasing evidence suggested that tumor microenvironment (TME), a collection of cancer cells and neighboring tumor-associated noncancerous cells, plays a pivotal role in tumor biology.2,3 Numerous researchers supported that tumor-associated stroma takes part in tumor progression, metastasis, and response to chemotherapy.4
Tumor purity is the percentage of tumor cells in TME. Previous studies investigated the relationship between the proportion of cancer cells and prognosis. Using TCGA data, a pan-cancer analysis of tumor purity found that high tumor purity predicted better survival in kidney renal clear cell carcinoma and lower grade glioma.5 In CC, several studies proposed that stroma percentage conferred worse survival.6–10 However, previous studies used visual or computer-assisted estimation of tumor and stroma proportion based on H&E-stained slides, which may introduce human error and subjective bias. In addition, current understanding of the purity-related genomic alterations and microenvironmental changing was still limited.
In our study, we inferred tumor purity of CC patients in public datasets by a computational method based on transcriptomic data. The relationship between tumor purity, clinicopathological characteristics, and prognosis in CC was further investigated. Moreover, gene mutations, somatic copy number alterations (SCNAs), biological pathways, and immune cell infiltration associated with tumor purity in CC were thoroughly explored, which may provide a deeper understanding and help clinical management of CC.
Materials and methods
Study population
Public datasets selection criterion was as follows: 1) transcriptomic data (microarray data or RNA-Seq data) were available; 2) the basic clinicopathological information (stage and survival information) was available; 3) the sample size was larger than 100. Therefore, three datasets were included in our research (GSE17536/17537, GSE39582, and TCGA).11–14 Furthermore, patients with no matched transcriptomic data or at stage 0 were excluded. Finally, 1,248 patients were enrolled in our study (Figure S1). All patients were pathologically diagnosed with primary CC and staged according to the American Joint Committee on Cancer (AJCC) staging system. The clinicopathological information was collected from the corresponding data portal: Gene Expression Omnibus (GEO) repository (https://www.ncbi.nlm.nih.gov/gds/) and Genomic Data Commons (GDC) Data Portal (https://portal.gdc.cancer.gov/). The DNA mismatch repair (MMR) status was determined by immunohistochemistry (IHC) staining. Due to the heterogeneous distribution of RNA-Seq-derived purity values and shorter follow-up time of TCGA dataset, survival-related analyses were performed on microarray dataset containing GSE17536/17537 and GSE39582 (n=794), whereas TCGA dataset was utilized for subsequent genomic analysis (n=454) (Figure S1). Detailed clinicopathological characteristics of enrolled patients from three datasets were described in Table S1.
Tumor purity calculation
The MINiML formatted family files containing metadata and Affymetrix HG133plus2 microarray data of GSE17536/17537 and GSE39582 were downloaded from GEO repository. TCGA level 3 RNA-Seq version 2 RSEM data were obtained from GDC Data Portal. ESTIMATE was a widely used R library for tumor purity prediction.15,16 The expression profile of 141 stroma-related genes and 141 immune-related genes was analyzed, and tumor purity was estimated by combining stromal and immune scores. By running ESTIMATE on TCGA RNA-Seq and Affymetrix HG133plus2 microarray data, tumor purity of each CC sample can be estimated as described before.16 The result was averaged if a sample had more than one matched transcriptomic profile. The RNA-Seq data of 48 CC cell lines and Affymetrix microarray data of 61 CC cell lines were obtained from Cancer Cell Line Encyclopedia (CCLE, http://www.broadinstitute.org/ccle) for validation of ESTIMATE algorithm.17
Genomic analysis
TCGA level 3 RNA-Seq version 2 RSEM data, segmented SCNA data (minus germline CNV), and TCGA level 3 mutation data of version 2016_01_28 were downloaded from GDC Data Portal. Mutation data were analyzed and summarized using maftools.18 Differential mutations between groups were accessed applying Fisher’s exact tests. KEGG pathway analyses were performed using DAVID 6.8 for differential mutated genes.19,20 SCNA events were detected by Genomic Identification of Significant Targets in Cancer (GISTIC) 2.0 using the segmented Affymetrix SNP 6.0 microarray data.21 SCNAs between groups were compared by Fisher’s exact tests. An R package, edgeR, was utilized to perform differential expression analysis.22 Gene set enrichment analysis (GSEA) was performed by the GSEA desktop application v.3.0 using Molecular Signatures Database (MSigDB) v6.1 with 1,000 permutations.23,24 The estimation of immune cell proportions for each sample was performed by CIBERSORT algorithm on TCGA RNA-Seq data or Affymetrix HG133plus2 microarray data using LM22 as a reference expression signature with 100 permutations.
Statistical analysis
All statistical analyses were performed using SPSS 22.0 (SPSS Inc., Chicago, IL, USA) and R software, version 3.4.3 (The R Foundation for Statistical Computing, http://www.r-project.org/). Variables between groups were compared by the Student’s t-tests or one-way ANOVA with post hoc pairwise Bonferroni tests. Correlations between continuous variables were evaluated by Spearman correlation analyses. The cutoff value of high and low purity group was calculated by X-tile.25 Kaplan–Meier analyses and logrank tests were used to evaluate the relationship between groups and overall survival (OS). Univariate and multivariate Cox regression analyses were performed to identify independent prognostic factors; factors with P<0.1 in univariate Cox regression analyses were further evaluated in the multivariate Cox regression models. A two-sided P<0.05 was regarded as statistically significant.
Ethics statement
GSE17536/17537, GSE39582, and TCGA are public datasets. Therefore, ethics committee approval was not needed. Neither patient informed consent nor permission to use these data was required to perform the current analyses.
Results
Tumor purity and clinicopathological features
Tumor purity of each CC sample was calculated by ESTIMATE algorithm. Among 1,248 patients, tumor purity ranged from 0.195 to 0.984 with the median purity of 0.765. The distribution of purity of three datasets was presented in Figure 1A. Purity values calculated from microarray data of 61 CC cell lines and RNA-Seq data of 48 CC cell lines were used as references. The microarray-derived purity of CC cell lines ranged from 0.890 to 1.000 with the median purity of 0.997 (Figure 1B) and the RNA-Seq-derived purity of CC cell lines ranged from 0.989 to 1.000 with the median purity of 0.998 (Figure 1C), which validated the robustness of ESTIMATE algorithm for both microarray and RNA-Seq data. Baseline clinicopathological characteristics of three datasets were shown in Table S1. Microarray (GSE17536/17537 and GSE39582) and TCGA datasets were analyzed separately because of their heterogeneous distribution. Furthermore, the correlation between purity and clinicopathological features was evaluated in Figure 1B, C and Table S2. Right-sided CC samples exhibited lower purity compared with left-sided ones in both microarray and TCGA datasets (P<0.001 and P=0.008, respectively) (Figure 1B, C and Table S2).
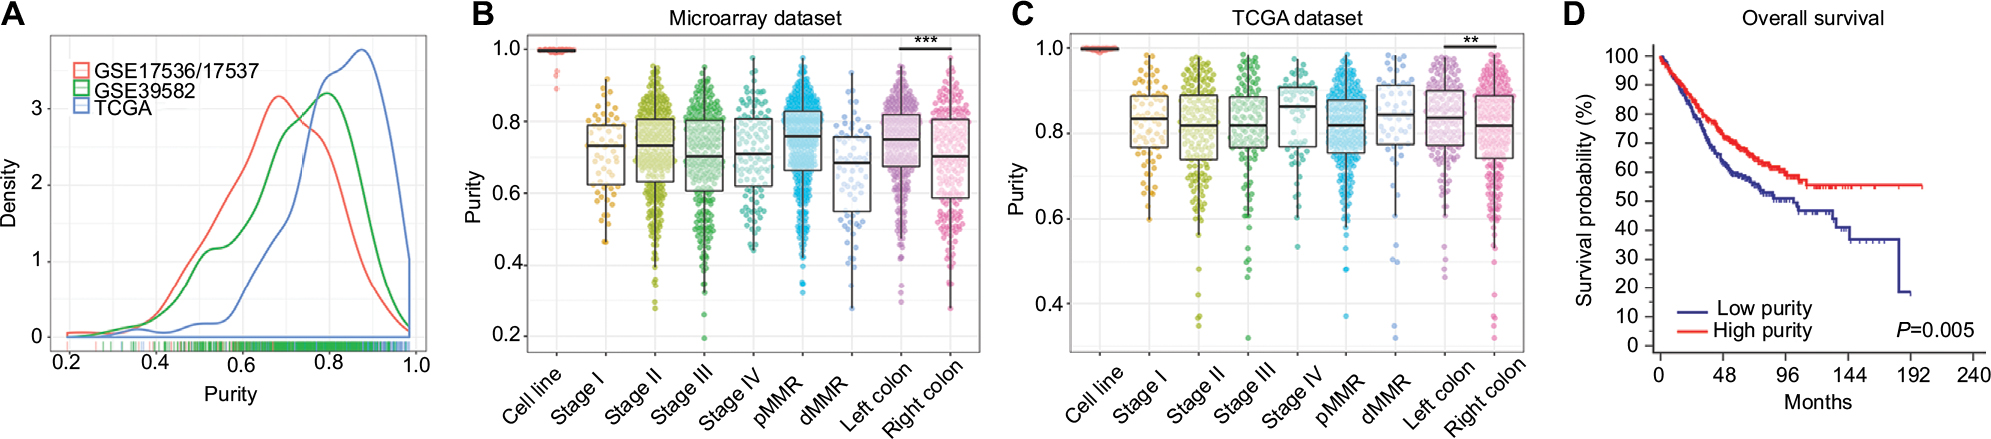 | Figure 1 (A) The distribution of tumor purity in three datasets. (B) The distribution of tumor purity among TNM stages, MMR status, and primary locations in microarray dataset. (C) The distribution of tumor purity among TNM stages, MMR status, and primary locations in TCGA dataset. (D) Kaplan–Meier analysis of overall survival showed low purity colon cancer (separated by X-tile) that conferred worse prognosis in microarray dataset. Notes: ***P<0.001, **P=0.008. Abbreviations: TNM, tumor node metastasis; MMR, DNA mismatch repair; dMMR, MMR-deficient; pMMR, MMR-proficient. |
Lower purity conferred worse prognosis in CC
Due to the relative short median follow-up time (18.3 months), TCGA dataset was excluded from subsequent survival analyses. In microarray set, CC samples were divided into low and high purity groups by X-tile.25 As accessed by Kaplan–Meier survival analyses and logrank tests, the high purity group conferred prognostic benefit (P=0.005) (Figure 1D). In further univariate Cox regression analyses, age, tumor node metastasis (TNM) stage, and tumor purity were associated with OS (all P<0.05). In multivariate Cox regression analysis, tumor purity was identified as an independent prognostic indicator of OS (P=0.010, HR=0.307, 95% CI=0.125–0.755) (Table 1).
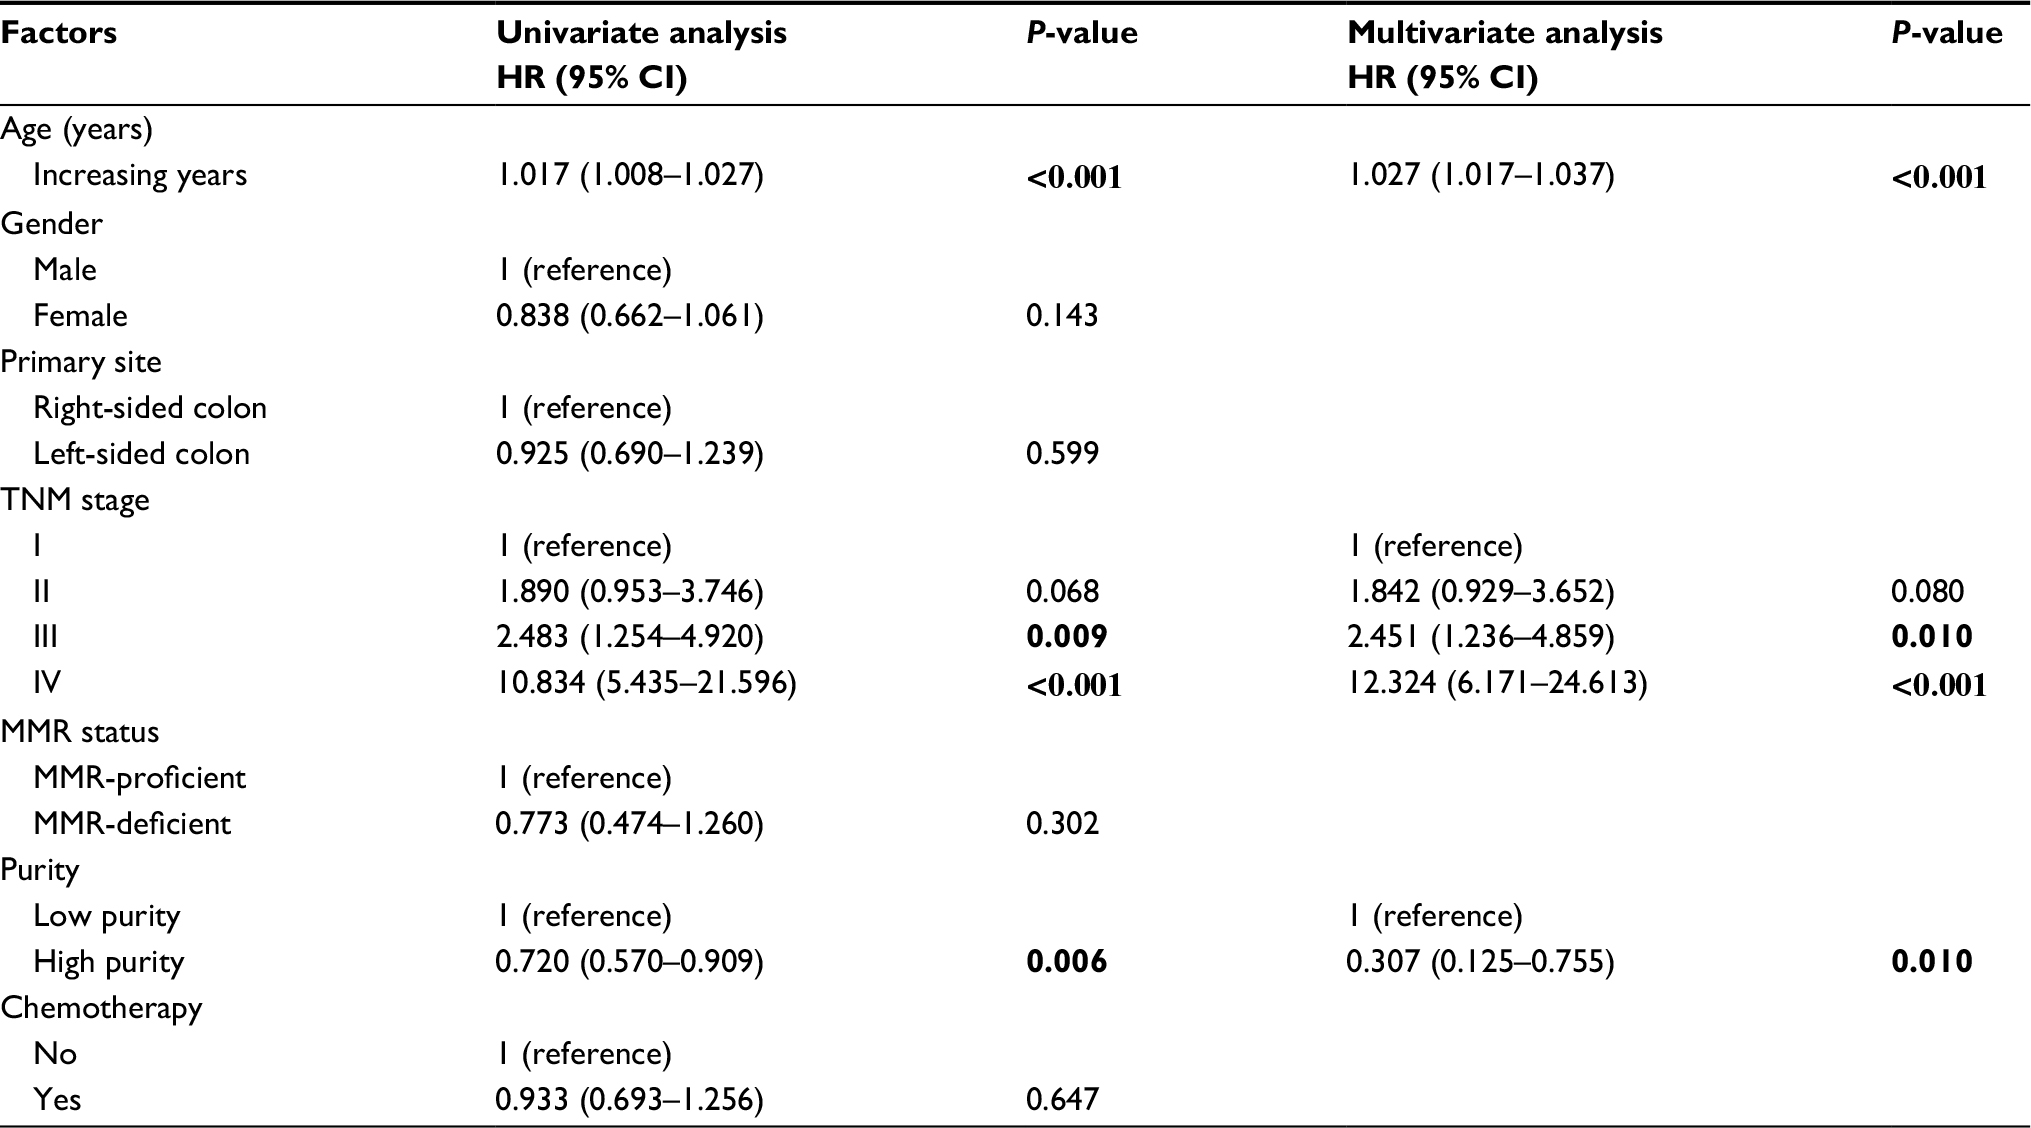 | Table 1 Univariate and multivariate Cox regression analyses for OS in microarray dataset Notes: Bold values present p values where p<0.05 Abbreviations: OS, overall survival; TNM, tumor node metastasis; MMR, DNA mismatch repair. |
Subgroup analyses revealed that low tumor purity indicated impaired survival in male (P=0.003), stage III, and stage IV patients (both P<0.05) (Figure 2). Interestingly, patients who underwent adjuvant chemotherapy with high tumor purity had significant survival benefit compared with low tumor purity patients (P=0.030, HR=0.608, 95% CI=0.386–0.957). Subsequent multivariate Cox regression analyses adjusted for TNM stage identified purity as an independent predictor for chemotherapy benefit (P=0.041, HR=0.621, 95% CI=0.393–0.980) (Table S3).
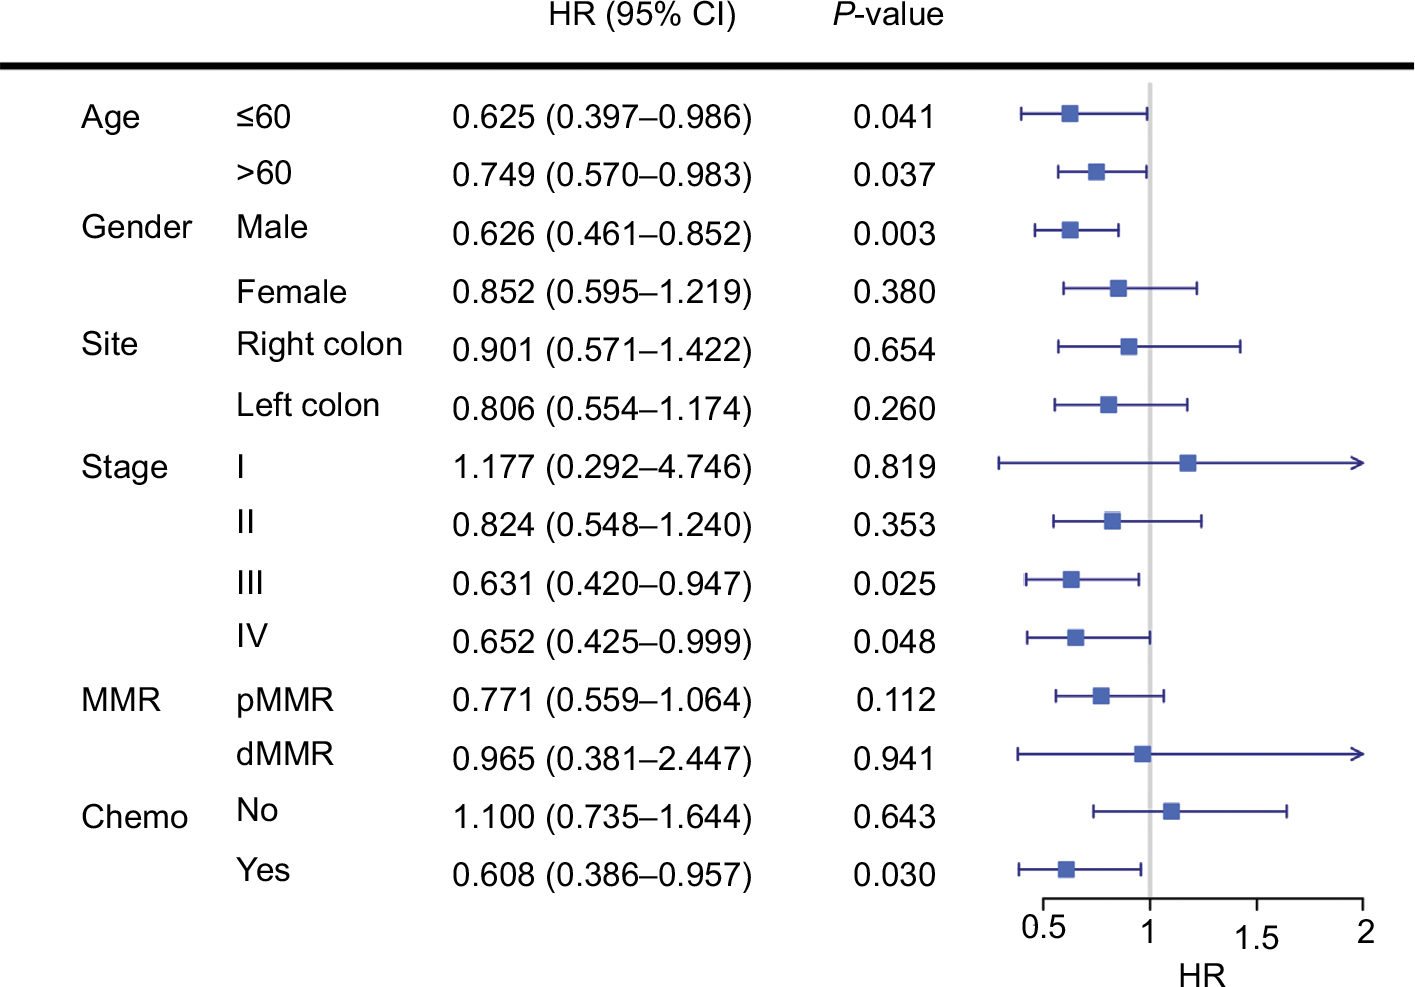 | Figure 2 Subgroup analyses revealed that low tumor purity indicated impaired survival in male, stage III, and stage IV CC patients, and patients with adjuvant chemotherapy. Abbreviations: MMR, DNA mismatch repair; dMMR, MMR-deficient; pMMR, MMR-proficient; Chemo, adjuvant chemotherapy. |
Tumor purity and genomic profile
To unveil the possible mechanisms affecting tumor purity, genomic data including mutation profile and SCNA data of TCGA dataset were further analyzed. The relationship between mutation profile and purity was evaluated in 394 TCGA patients with available somatic mutation data. Parallel analyses were conducted between three kinds of subgroups (first vs second half, first vs third tertile, first vs fourth quarter). Linear regression analysis showed that tumor purity was negatively correlated with somatic mutations (R=–0.206, P<0.001) (Figure S2). More mutations were detected in low purity samples (mean mutation number: first vs second half: 577.0 vs 269.4; first vs third tertile: 596.5 vs 217.7; first vs fourth quarter: 707.0 vs 178.2).
The summary of overall mutation profile of TCGA dataset was illustrated in Figure S3. APC, TP53, TTN, and KRAS ranked as top mutated genes as described before.14 The most frequently mutated genes among low and high purity groups were presented in Figure 3A, S4A, and S5A. Most genes including DNAH7, KMT2D, RYR3, BRAF, and IGF2R, were found significantly more mutated in low purity group (all P<0.05). Notably, only APC and KRAS mutations were more frequently detected in high purity group (both P<0.05) (Figure 3, S4B and S5B).
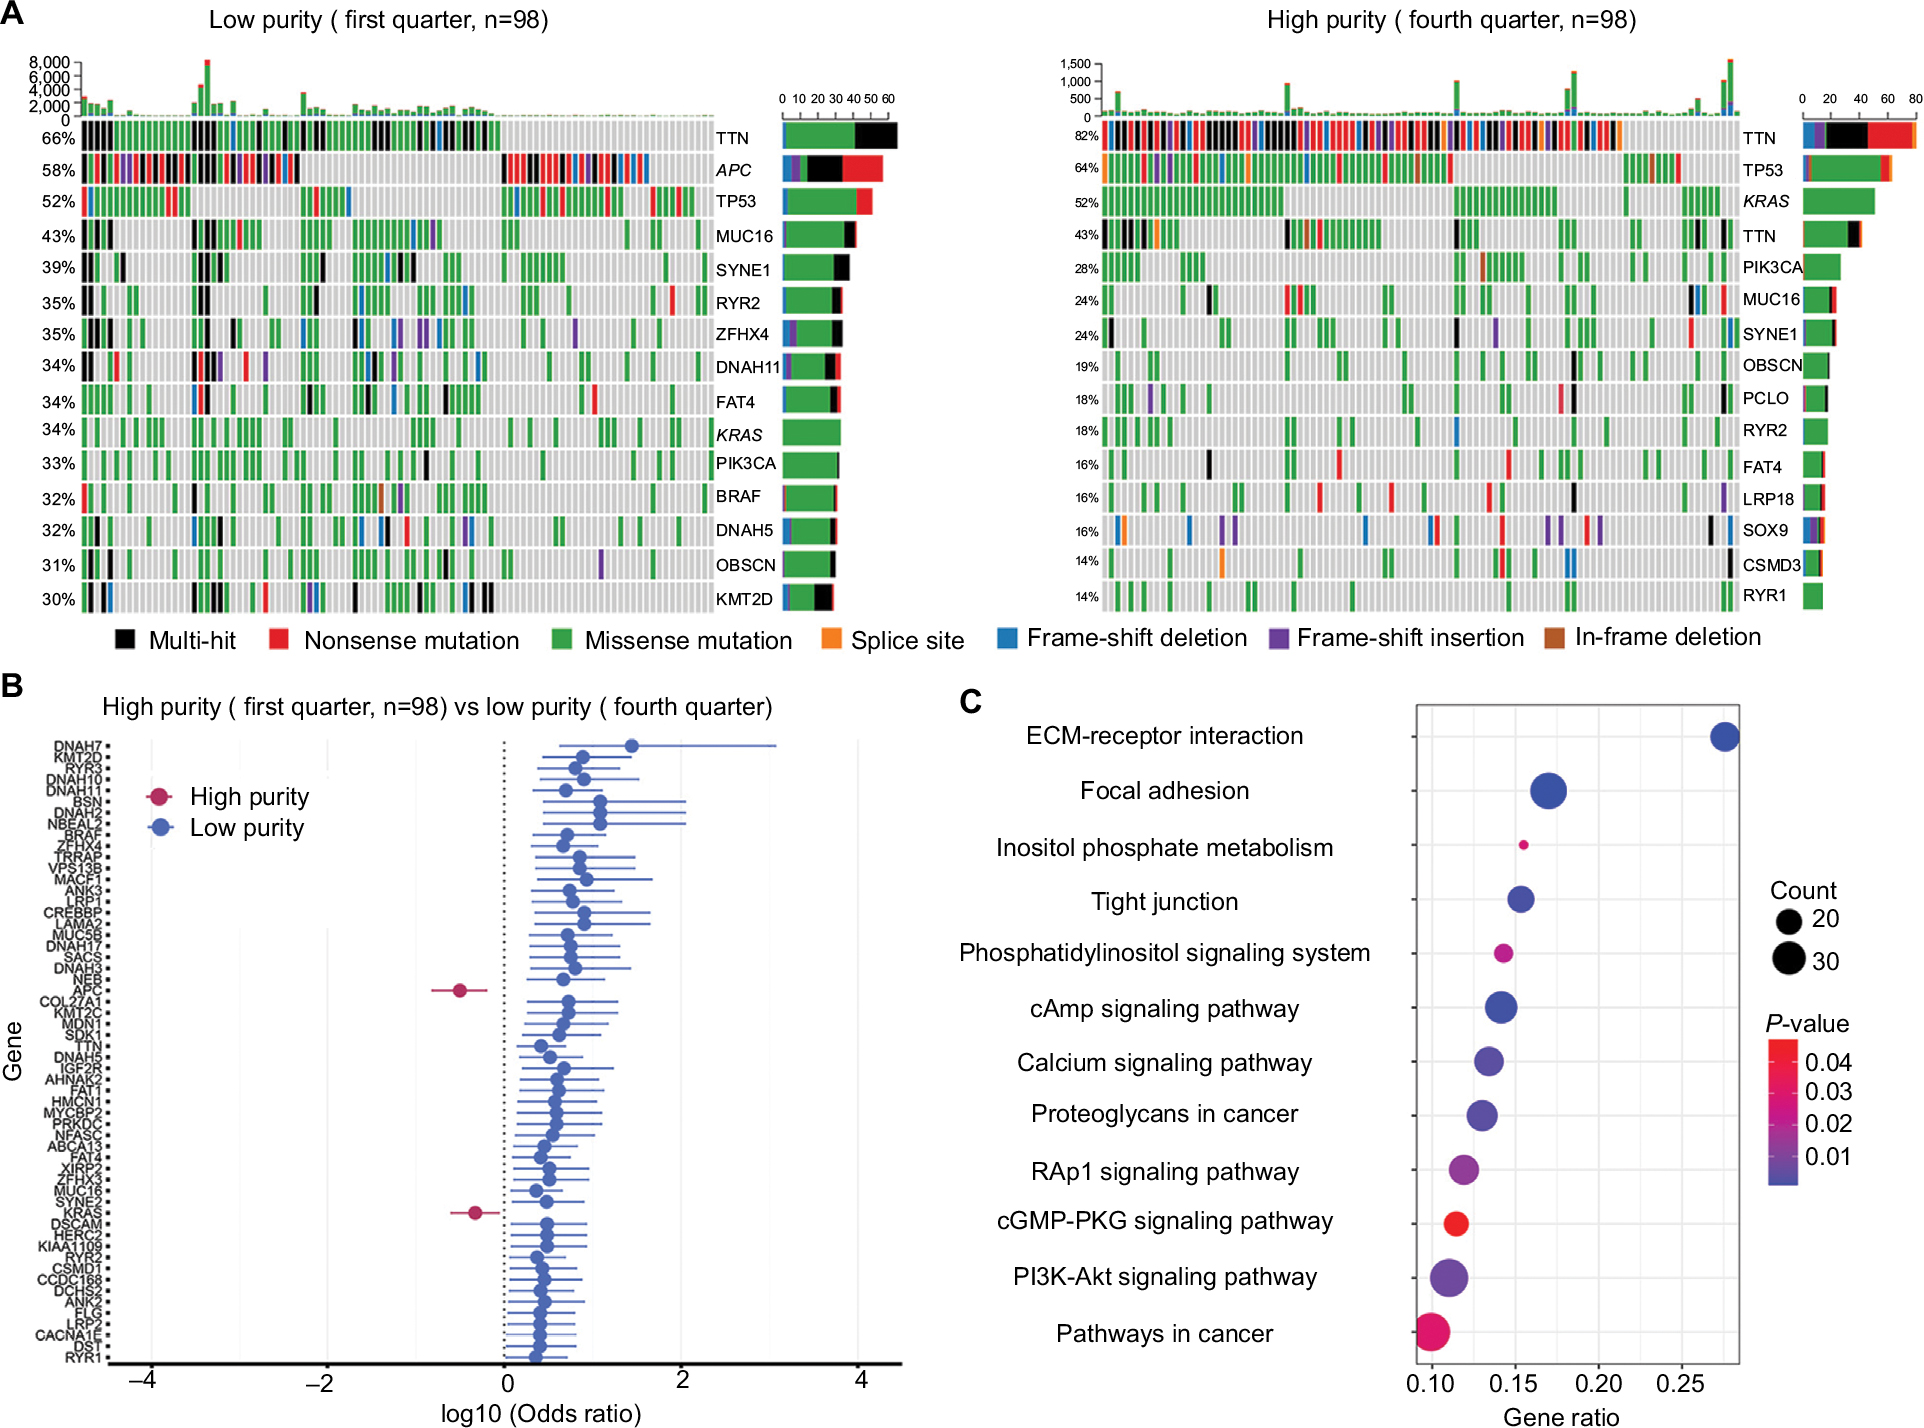 | Figure 3 Mutation profile between low and high purity groups (first vs fourth quarter) in TCGA dataset. Notes: (A) Mutation profile of low and high purity groups. (B) Differentially mutated genes between low and high purity groups. (C) Highly mutated pathways in low purity group. Abbreviation: ECM, extracellular matrix. |
By performing KEGG analysis on significantly highly mutated genes in low purity groups, we further investigated pathways involving tumor purity. Pathways related to extracellular matrix (ECM)–receptor interaction, focal adhesion, and calcium signaling were significantly more mutated in low purity group in all parallel analyses (Figures 3, S4C, and S5C). Moreover, more mutations were enriched in PI3K-Akt signaling pathway in CC patients with low tumor purity, which is a classic oncogenic pathway promoting CC progression.26
The relationship between SCNAs and purity was also explored. SCNAs, including amplification, deletions, and total SCNA events, were not associated with tumor purity (P=0.547, P=0.0648, and P=0.0683, respectively) (Figure S6). The alteration pattern between low and high purity groups was similar (Figure S7). Parallel comparisons of SCNAs among subgroups (first vs second half, first vs third tertile, first vs fourth quarter) revealed no differential cytoband amplification or deletions using Fisher’s exact tests, which indicated that SCNAs might be irrelevant with CC purity.
Tumor purity-related immune microenvironment
To explore the underlying mechanism of purity’s prognostic value, we performed differential expression analysis on TCGA RNA-Seq data between low and high purity groups divided by median purity. Notably, the expression level of immunotherapy-associated markers (PD-1, PD-L1, CTLA-4, LAG-3, and TIM-3) was inversely correlated with tumor purity in all three datasets (Figures 4, S8, and S9), which was similar to a previous pan-cancer analysis.27 Genes with false discovery rate <0.05 in differential expression analysis were further accessed using GSEA. Multiple immune-related pathways were highly enriched in low purity group (Table S4), including positive regulation of inflammatory response, positive regulation of leukocyte-mediated immunity, lymphocyte migration, and adaptive immune response (Figure 5A). Therefore, low purity CC exhibited intensive immune phenotype.
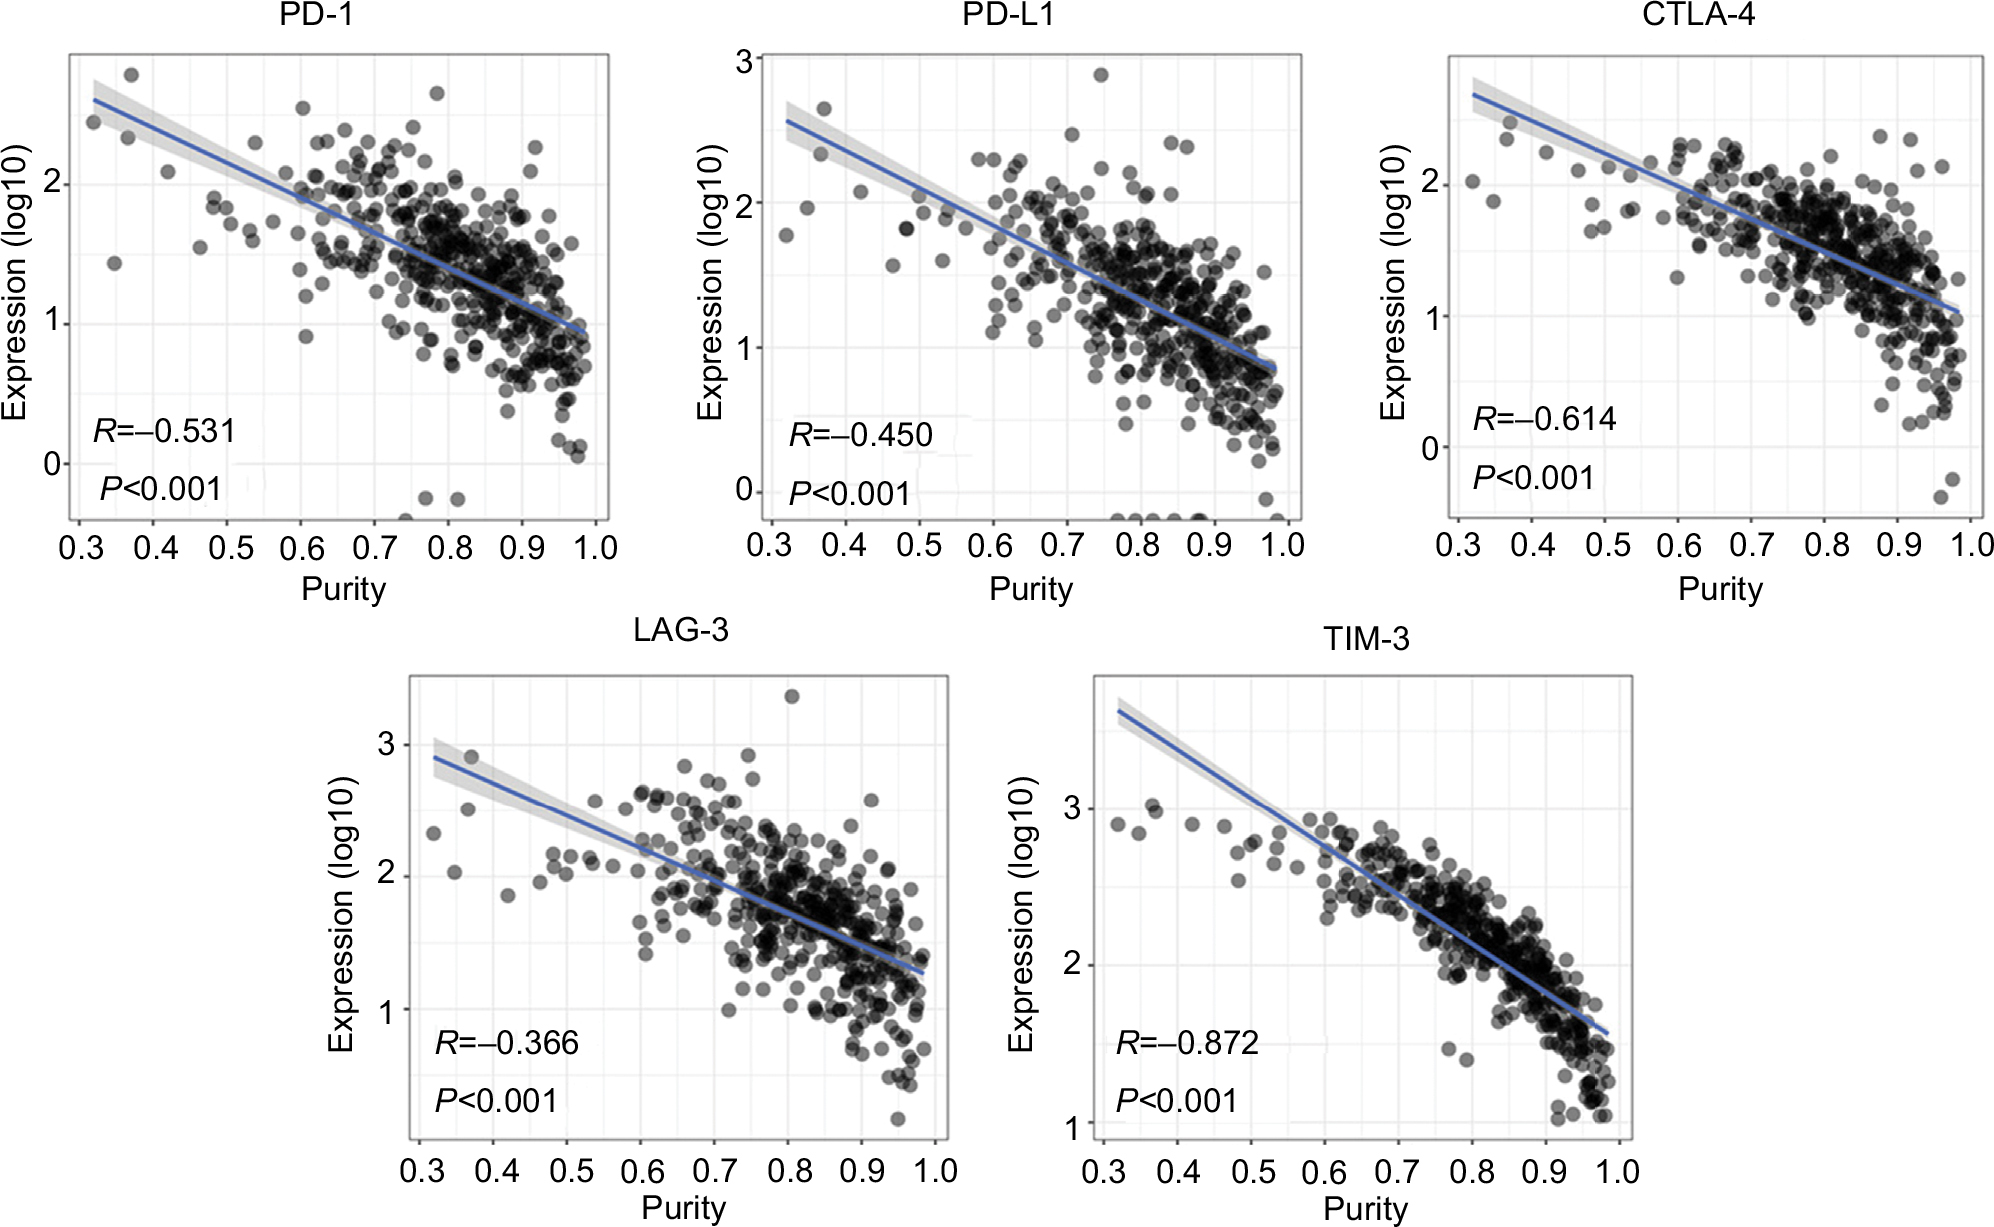 | Figure 4 The expression level of immunotherapy-associated genes was inversely correlated with tumor purity in TCGA dataset. |
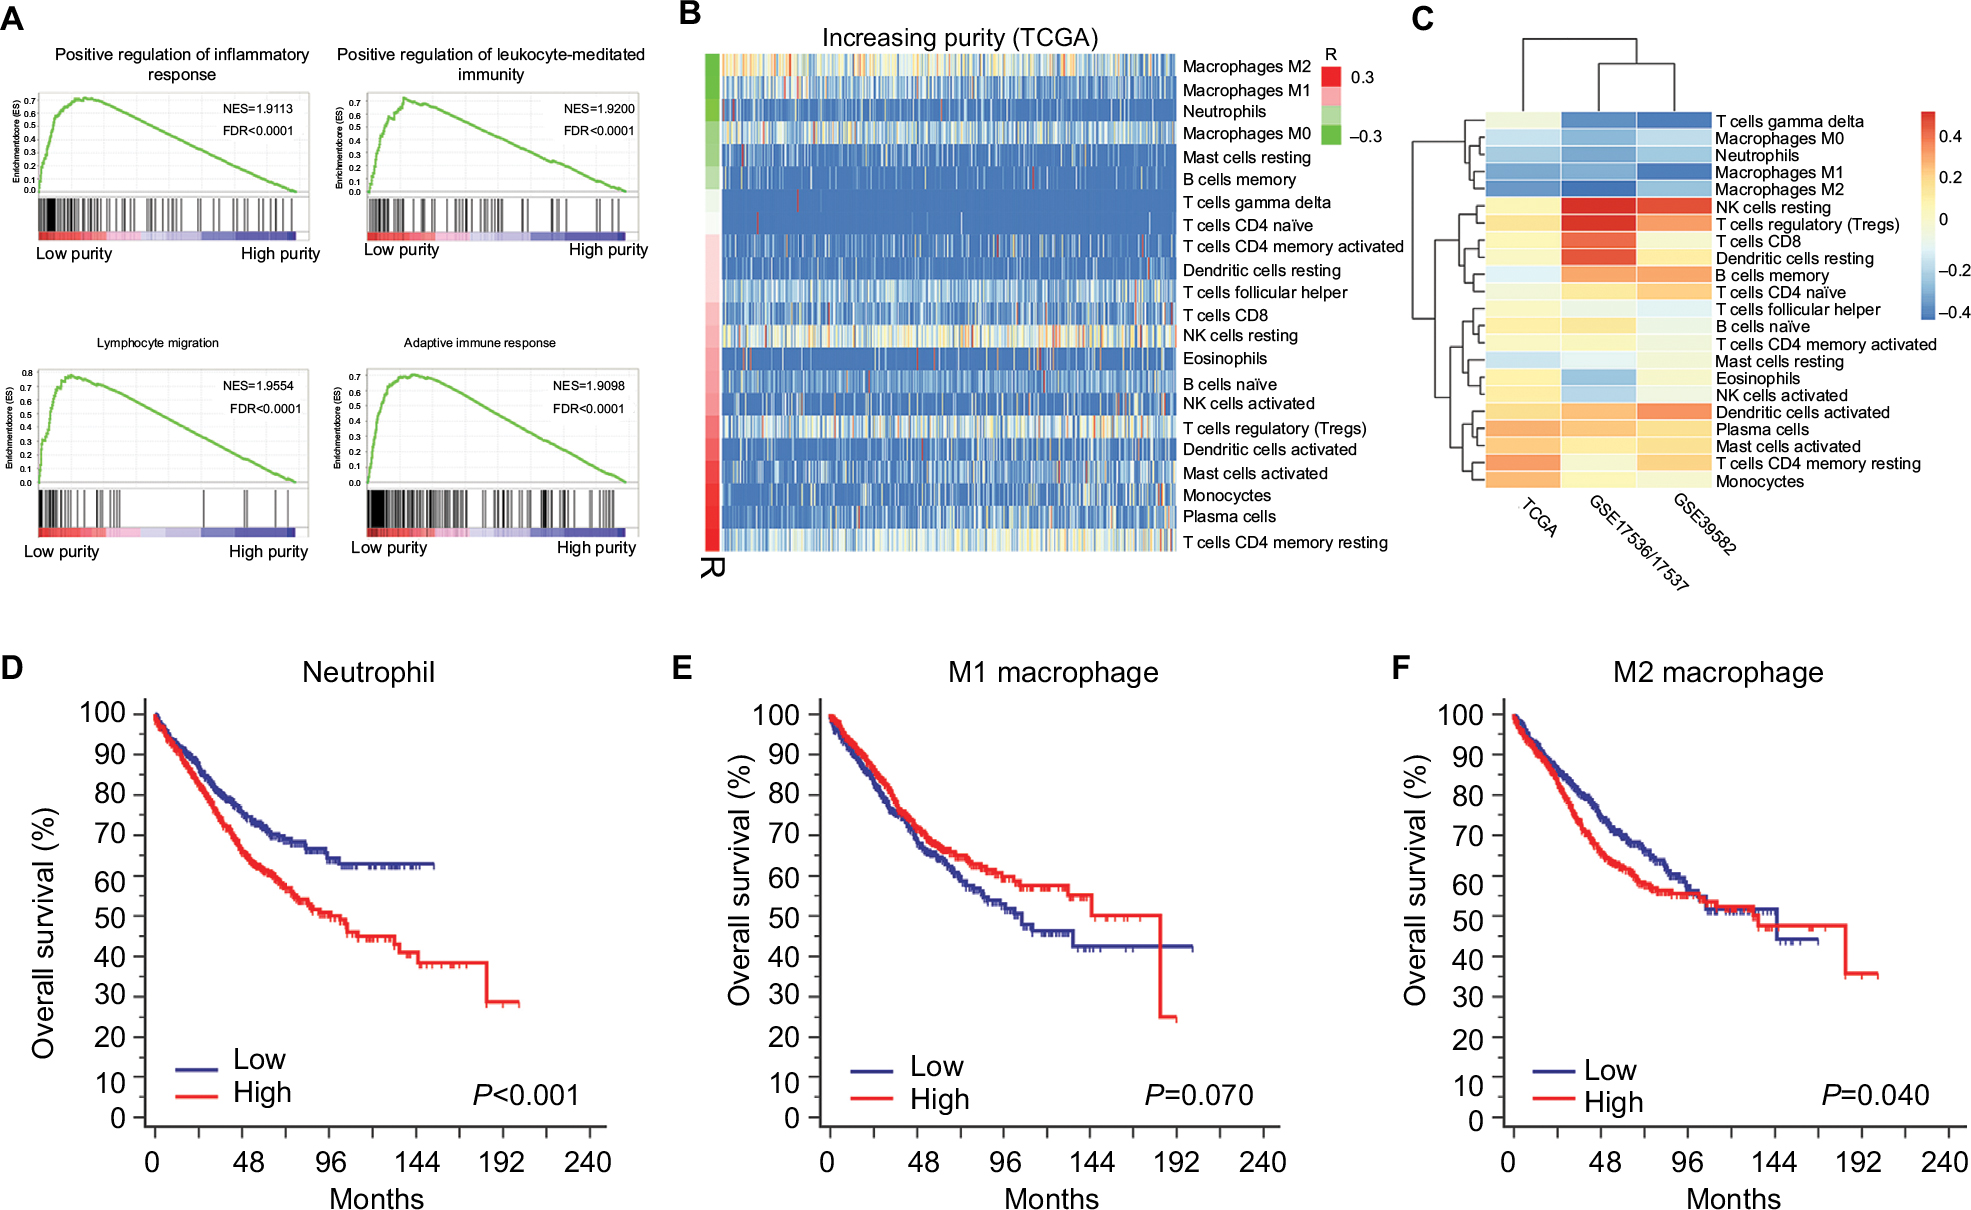 | Figure 5 Microenvironment changing associated with tumor purity. Notes: (A) Immune-related pathways were highly enriched in low purity group. (B) The distribution of relative proportion of immune cells sorted by increasing purity in TCGA dataset. The left color bar indicated the correlation coefficients. (C) The correlation coefficients of immune cells and tumor purity in TCGA, GSE17536/17537, and GSE39582. (D) High relative proportion of neutrophils indicated poor overall survival. (E) The relative proportion of M1 macrophages was not significantly associated with overall survival. (F) High relative proportion of M1 macrophages predicted poor prognosis. Abbreviations: NES, normalized enrichment score; FDR, false discovery rate. |
As immune cells composed the major nontumor proportion of microenvironment, we tried to figure out which types of tumor-infiltrating immune cells were related to tumor purity and immune phenotype. We applied CIBERSORT algorithm on RNA-Seq and microarray data to estimate the relative proportion of 22 immune cells of leukocytes for each CC sample. The association of different cell types and purity was plotted in Figures 5B, S10, and S11. Heatmap illustrating the correlation coefficients of immune cells and tumor purity was shown in Figure 5C. The absolute value of coefficients >0.2 across three datasets was applied as a threshold for filtration. Among 22 immune cell types, M1 macrophages, M2 macrophages, and neutrophils were negatively correlated with tumor purity in all three independent datasets (all R<–0.2) (Table S5). Next, samples from combined dataset were divided into low and high groups according to the corresponding median proportion of immune cells. By performing Kaplan–Meier survival analyses and logrank tests, the relative proportion of M1 macrophages was not significantly associated with OS (P=0.070) (Figure 5E). However, the relative proportion of neutrophils and M2 macrophages was identified as indicators for poor prognosis (Figure 5D, F) (P<0.001 and P=0.040, respectively), which may partially explain the worse prognosis in low purity CC.
Discussion
In line with previous studies, we found that low tumor purity, aka high stroma infiltrates, was negatively associated with shorter survival.6–10 However, we applied a computational method for purity speculation rather than histopathological way. In recent years, numerous computational tools for tumor purity estimation were proposed based on different types of genetic data.28–30 A comparative study showed a high concordance between methods.5 ESTIMATE algorithm was selected in our research for its compatibility of RNA-Seq data and microarray data.
Left-sided and right-sided CC harbors distinct biological and clinical characteristics.31 Right-sided CC was reported to be more frequently hypermutated with more immune infiltrates.32 We found that the right-sided CC patients exhibited lower tumor purity in both microarray and TCGA datasets, which might explain the higher mutation rate and more intense immune phenotype in right-sided CC. The association between MMR status and purity was found to be contradictory in microarray and TCGA datasets, which needed further investigation.
Previous histopathological based researchers suggested that stroma percentage was negatively associated with adjuvant chemotherapy benefit.8,9 We further validated this finding by a computational approach. Subgroup analyses and Cox regression analyses indicated tumor purity as an independent prognostic factor in CC patients receiving adjuvant chemotherapy. Researchers targeting TME developed fast recently, especially checkpoint blockade immunotherapy that shows therapeutic potential in dMMR CRC patients.33,34 Interestingly, immunotherapy-associated markers (PD-1, PD-L1, CTLA-4, LAG-3, and TIM-3) were highly expressed in low purity CC. Therefore, addition of TME-targeted therapy to current 5-FU-based adjuvant chemotherapy may be an option to improve oncologic outcomes for low purity population.35
Gene level association of tumor purity was also interpreted in this study. The mutation burden in low purity CC was significantly heavier than high purity ones, which was consistent with the previous reports in pan-cancer analysis and glioma.5,16 Notably, only APC and KRAS mutations showed increased frequency in high purity CC. KEGG analysis revealed that pathways related to ECM were highly mutated in low purity CC samples. The abnormality of ECM contributes to cancer progression, invasion, and metastasis.36 Mutations were also differentially enriched in the PI3K-Akt pathway in low purity group, which is a crucial pathway in CC progression and chemotherapy resistance.37 The increasing mutations in above pathways may contribute to impaired survival in low purity CC patients.
Frequent SCNA events were observed in CC, which may lead to gene expression alterations and promote cancer progression.14,38 Unlike glioma, where increased SCNA events were detected in high purity tumors, SCNAs in CC were not significantly associated with purity.16 In line with our findings, a recent report showed that for microsatellite stable CC, stroma proportion was not correlated with SCNA events.39 As high stromal proportion may disturb the measurement of SCNAs, the correlation between tumor purity and SCNAs needs to be further investigated.
GSEA revealed that immune-related pathways were highly enriched in low purity tumors. Furthermore, tumor purity was found negatively correlated to the relative proportion of neutrophils, M1 macrophages, and M2 macrophages in all three independent datasets. Among three types of immune cells, the relative proportion of neutrophils and M2 macrophages presented negative prognostic value, which may explain the worse survival in low purity CC. The adverse association between neutrophils and M2 macrophages infiltration and CC prognosis has long been noticed. Unlike the protumoral effect of M2 macrophages that was accepted as a general idea, the role of neutrophil infiltration in CRC prognosis remains uncertain, both beneficial and harmful effect of neutrophils was observed in previous studies.40–45 Heterogeneous markers including CD66b, CD177, or myeloperoxidase were used for neutrophil identification, which may bias the conclusions.42–45 CIBERSORT, which utilizes clusters of genes for cell separation from RNA mixtures, may be more suitable for immune cell quantification than traditional IHC staining of limited markers.
Several limitations of our study need to be noticed. Purity estimation in our investigation was only calculated by one computational method based on transcriptomic data; further validation using multiple algorithms based on mutation, CNA or DNA methylation data may be needed. Moreover, due to the retrospective setting of this study, prospective researchers are required to further access our conclusions.
Conclusion
In summary, we systematically evaluated the role of tumor purity in CC prognosis, gene profile, and microenvironment. Tumor purity was identified as an adverse independent prognostic factor in CC, as well as an independent predictor of adjuvant chemotherapy benefit. Low purity CC exhibited heavier mutation burden but with lower APC and KRAS mutation frequency. Nevertheless, SCNA was not significantly correlated with tumor purity. Immune-related pathways were highly enriched in low purity group. Furthermore, M2 macrophages and neutrophils, which indicated worse survival in CC, were negatively associated with purity. The role of tumor purity in CC needs further investigation for better prognostic stratification and clinical management.
Acknowledgments
This study was supported by the Grant of National Natural Science Foundation of China (81472228, 81602040), the Youth Grant of Zhongshan Hospital (2016ZSQN50), and Clinical Science and Technology Innovation Project of Shanghai (SHDC12016104).
Disclosure
The authors report no conflicts of interest in this work.
References
Siegel RL, Miller KD, Jemal A. Cancer statistics, 2018. CA Cancer J Clin. 2018;68(1):7–30. | ||
Hanahan D, Weinberg RA. Hallmarks of cancer: the next generation. Cell. 2011;144(5):646–674. | ||
Quail DF, Joyce JA. Microenvironmental regulation of tumor progression and metastasis. Nat Med. 2013;19(11):1423–1437. | ||
Junttila MR, de Sauvage FJ. Influence of tumour micro-environment heterogeneity on therapeutic response. Nature. 2013;501(7467):346–354. | ||
Aran D, Sirota M, Butte AJ. Systematic pan-cancer analysis of tumour purity. Nat Commun. 2015;6:8971. | ||
Mesker WE, Junggeburt JM, Szuhai K, et al. The carcinoma-stromal ratio of colon carcinoma is an independent factor for survival compared to lymph node status and tumor stage. Cell Oncol. 2007;29(5):387–398. | ||
West NP, Dattani M, McShane P, et al. The proportion of tumour cells is an independent predictor for survival in colorectal cancer patients. Br J Cancer. 2010;102(10):1519–1523. | ||
Huijbers A, Tollenaar RA, v Pelt GW, et al. The proportion of tumor-stroma as a strong prognosticator for stage II and III colon cancer patients: validation in the VICTOR trial. Ann Oncol. 2013;24(1):179–185. | ||
Park JH, Richards CH, McMillan DC, Horgan PG, Roxburgh CS. The relationship between tumour stroma percentage, the tumour microenvironment and survival in patients with primary operable colorectal cancer. Ann Oncol. 2014;25(3):644–651. | ||
Danielsen HE, Hveem TS, Domingo E, et al. Prognostic markers for colorectal cancer; estimating ploidy and stroma. Ann Oncol. 2018;29(3):616–623. | ||
Marisa L, de Reyniès A, Duval A, et al. Gene expression classification of colon cancer into molecular subtypes: characterization, validation, and prognostic value. PLoS Med. 2013;10(5):e1001453. | ||
Freeman TJ, Smith JJ, Chen X, et al. Smad4-mediated signaling inhibits intestinal neoplasia by inhibiting expression of β-catenin. Gastroenterology. 2012;142(3):562–571.e2. | ||
Smith JJ, Deane NG, Wu F, et al. Experimentally derived metastasis gene expression profile predicts recurrence and death in patients with colon cancer. Gastroenterology. 2010;138(3):958–968. | ||
Cancer Genome Atlas Network. Comprehensive molecular characterization of human colon and rectal cancer. Nature. 2012;487(7407):330–337. | ||
Yoshihara K, Shahmoradgoli M, Martínez E, et al. Inferring tumour purity and stromal and immune cell admixture from expression data. Nat Commun. 2013;4:2612. | ||
Zhang C, Cheng W, Ren X, et al. Tumor purity as an underlying key factor in glioma. Clin Cancer Res. 2017;23(20):6279–6291. | ||
Barretina J, Caponigro G, Stransky N, et al. The Cancer Cell Line Encyclopedia enables predictive modelling of anticancer drug sensitivity. Nature. 2012;483(7391):603–607. | ||
Mayakonda A, Koeffler HP. Maftools: efficient analysis, visualization and summarization of MAF files from large-scale cohort based cancer studies. bioRxiv. 2016. | ||
Huang W, Sherman BT, Lempicki RA. Systematic and integrative analysis of large gene lists using DAVID bioinformatics resources. Nat Protoc. 2009;4(1):44–57. | ||
Huang W, Sherman BT, Lempicki RA. Bioinformatics enrichment tools: paths toward the comprehensive functional analysis of large gene lists. Nucleic Acids Res. 2009;37(1):1–13. | ||
Mermel CH, Schumacher SE, Hill B, Meyerson ML, Beroukhim R, Getz G. GISTIC2.0 facilitates sensitive and confident localization of the targets of focal somatic copy-number alteration in human cancers. Genome Biol. 2011;12(4):R41. | ||
Robinson MD, McCarthy DJ, Smyth GK. edgeR: a Bioconductor package for differential expression analysis of digital gene expression data. Bioinformatics. 2010;26(1):139–140. | ||
Mootha VK, Lindgren CM, Eriksson KF, et al. PGC-1alpha-responsive genes involved in oxidative phosphorylation are coordinately downregulated in human diabetes. Nat Genet. 2003;34(3):267–273. | ||
Subramanian A, Tamayo P, Mootha VK, et al. Gene set enrichment analysis: a knowledge-based approach for interpreting genome-wide expression profiles. Proc Natl Acad Sci U S A. 2005;102(43):15545–15550. | ||
Camp RL, Dolled-Filhart M, Rimm DL. X-tile: a new bio-informatics tool for biomarker assessment and outcome-based cut-point optimization. Clin Cancer Res. 2004;10(21):7252–7259. | ||
Yuan TL, Cantley LC. PI3K pathway alterations in cancer: variations on a theme. Oncogene. 2008;27(41):5497–5510. | ||
Rhee JK, Jung YC, Kim KR, et al. Impact of tumor purity on immune gene expression and clustering analyses across multiple cancer types. Cancer Immunol Res. 2018;6(1):87–97. | ||
Carter SL, Cibulskis K, Helman E, et al. Absolute quantification of somatic DNA alterations in human cancer. Nat Biotechnol. 2012;30(5):413–421. | ||
Zheng X, Zhao Q, Wu HJ, et al. MethylPurify: tumor purity deconvolution and differential methylation detection from single tumor DNA methylomes. Genome Biol. 2014;15(8):419. | ||
Li Y, Xie X. Deconvolving tumor purity and ploidy by integrating copy number alterations and loss of heterozygosity. Bioinformatics. 2014;30(15):2121–2129. | ||
Lee MS, Menter DG, Kopetz S. Right versus left colon cancer biology: integrating the consensus molecular subtypes. J Natl Compr Canc Netw. 2017;15(3):411–419. | ||
Gallois C, Pernot S, Zaanan A, Taieb J. Colorectal cancer: why does side matter? Drugs. 2018;78(8):789–798. | ||
Halama N, Zoernig I, Berthel A, et al. Tumoral immune cell exploitation in colorectal cancer metastases can be targeted effectively by anti-CCR5 therapy in cancer patients. Cancer Cell. 2016;29(4):587–601. | ||
Zou W, Wolchok JD, Chen L. PD-L1 (B7-H1) and PD-1 pathway blockade for cancer therapy: Mechanisms, response biomarkers, and combinations. Sci Transl Med. 2016;8(328):328rv4. | ||
Wu T, Dai Y. Tumor microenvironment and therapeutic response. Cancer Lett. 2017;387:61–68. | ||
Lu P, Weaver VM, Werb Z. The extracellular matrix: a dynamic niche in cancer progression. J Cell Biol. 2012;196(4):395–406. | ||
Papadatos-Pastos D, Rabbie R, Ross P, Sarker D. The role of the PI3K pathway in colorectal cancer. Crit Rev Oncol Hematol. 2015;94(1):18–30. | ||
Tsafrir D, Bacolod M, Selvanayagam Z, et al. Relationship of gene expression and chromosomal abnormalities in colorectal cancer. Cancer Res. 2006;66(4):2129–2137. | ||
Alonso MH, Aussó S, Lopez-Doriga A, et al. Comprehensive analysis of copy number aberrations in microsatellite stable colon cancer in view of stromal component. Br J Cancer. 2017;117(3):421–431. | ||
Noy R, Pollard JW. Tumor-associated macrophages: from mechanisms to therapy. Immunity. 2014;41(1):49–61. | ||
Ostuni R, Kratochvill F, Murray PJ, Natoli G. Macrophages and cancer: from mechanisms to therapeutic implications. Trends Immunol. 2015;36(4):229–239. | ||
Droeser RA, Hirt C, Eppenberger-Castori S, et al. High myeloperoxidase positive cell infiltration in colorectal cancer is an independent favorable prognostic factor. PLoS One. 2013;8(5):e64814. | ||
Galdiero MR, Bianchi P, Grizzi F, et al. Occurrence and significance of tumor-associated neutrophils in patients with colorectal cancer. Int J Cancer. 2016;139(2):446–456. | ||
Rao HL, Chen JW, Li M, et al. Increased intratumoral neutrophil in colorectal carcinomas correlates closely with malignant phenotype and predicts patients’ adverse prognosis. PLoS One. 2012;7(1):e30806. | ||
Zhou G, Peng K, Song Y, et al. CD177+ neutrophils suppress epithelial cell tumourigenesis in colitis-associated cancer and predict good prognosis in colorectal cancer. Carcinogenesis. 2018;39(2):272–282. |
 © 2018 The Author(s). This work is published and licensed by Dove Medical Press Limited. The
full terms of this license are available at https://www.dovepress.com/terms
and incorporate the Creative Commons Attribution
- Non Commercial (unported, 3.0) License.
By accessing the work you hereby accept the Terms. Non-commercial uses of the work are permitted
without any further permission from Dove Medical Press Limited, provided the work is properly
attributed. For permission for commercial use of this work, please see paragraphs 4.2 and 5 of our Terms.
© 2018 The Author(s). This work is published and licensed by Dove Medical Press Limited. The
full terms of this license are available at https://www.dovepress.com/terms
and incorporate the Creative Commons Attribution
- Non Commercial (unported, 3.0) License.
By accessing the work you hereby accept the Terms. Non-commercial uses of the work are permitted
without any further permission from Dove Medical Press Limited, provided the work is properly
attributed. For permission for commercial use of this work, please see paragraphs 4.2 and 5 of our Terms.