Back to Journals » Cancer Management and Research » Volume 10
Low STYK1 expression indicates poor prognosis in gastric cancer
Authors Fang J, Wang H, Fang X, Li N, Hu H ![]() , Bian M, Yang P
, Bian M, Yang P
Received 30 July 2018
Accepted for publication 18 October 2018
Published 6 December 2018 Volume 2018:10 Pages 6669—6676
DOI https://doi.org/10.2147/CMAR.S181910
Checked for plagiarism Yes
Review by Single anonymous peer review
Peer reviewer comments 3
Editor who approved publication: Professor Harikrishna Nakshatri
Jian Fang,1,* Hao Wang,2,* Xiao Fang,3 Na Li,1 Hailiang Hu,1 Maohong Bian,1 Peng Yang1
1Department of Blood Transfusion, The First Affiliated Hospital of Anhui Medical University, Hefei 230022, Anhui, China; 2Department of General Surgery and Translational Medicine Center, Nanjing Medical University Affiliated Wuxi Second Hospital, Wuxi 214002, Jiangsu, China; 3Department of Orthopaedics, Hefei Orthopaedics Hospital, Hefei 230000, Anhui, China
*These authors contributed equally to this work
Background: The expression of serine threonine tyrosine kinase 1 (STYK1), a member of the receptor protein tyrosine kinase (RPTK) family, is abnormal in several cancers. However, the molecular mechanism of STYK1 regulation of gastric cancer (GC) progression is unknown.
Materials and methods: We evaluated STYK1 expression in GC tissues and the corresponding normal tissues. Specimens from 93 patients with GC were examined with immunohistochemical staining. The relationship between STYK1 protein expression and the patients’ clinicopathological features was assessed. Kaplan–Meier and Cox proportional regression analyses were used to evaluate the association between STYK1 expression and survival.
Results: STYK1 expression was decreased in GC tissues. Low STYK1 expression was significantly associated with poor tumor differentiation (P=0.023), advanced clinical stage (P=0.021), and poor overall survival (OS; P=0.034). Univariate and multivariate analyses revealed that STYK1expression was an independent prognostic indicator (HR =0.53, 95% CI =0.29–0.95, P=0.039; HR =0.51, 95% CI =0.24–0.91, P=0.030, respectively).
Conclusion: Downregulated STYK1 expression correlated significantly with poor tumor differentiation, advanced clinical stage, and poor OS in GC. STYK1 might be a diagnostic and prognostic indicator in patients with GC.
Keywords: gastric cancer, STYK1, prognosis, overall survival
Introduction
Gastric cancer (GC) is a common malignancy of the human digestive system and the third leading cause of cancer-related death worldwide, caused an estimated 700,000 deaths in 2012.1 Around the world, about 8% of all patients are newly diagnosed with GC each year; although the 1-year survival rate for GC is 80%, the 5-year survival rate is 50%, and the recurrence rate is over 60%.2,3 Invasion and distant metastasis are the most lethal biological characteristics of GC and an important cause of death in patients with GC.4,5 Therefore, it is critical to identify specific molecular markers and therapeutic targets for the early diagnosis and treatment of patients with GC.
Serine threonine tyrosine kinase 1 (STYK1), also known as novel oncogene with kinase domain (NOK), is a member of the receptor protein tyrosine kinase (RPTK) family.6 STYK1 expression is high in a wide range of cancers, including gallbladder carcinoma,7 lung cancer,8 colorectal cancer,9 nasopharyngeal carcinoma,10 ovarian cancer,11pancreatic cancer,12 and hepatocellular carcinoma.13 These data indicate that increased levels of STYK1 expression are associated with progression in the aforementioned cancers. So far, however, the expression and possible role of STYK1 in GC are unknown. In the present study, we sought to define the relationship between STYK1expression and the clinical outcomes and clinicopathological features of GC.
Materials and methods
Data resources
GC tissues and the normal or adjacent tissue expression profiles of the GSE49051, GSE79973, and GSE54129 data sets were obtained from the Gene Expression Omnibus (GEO) database (www.ncbi.nlm.nih.gov/geo).14 The GSE49051 data set contains three GC tissue samples and three noncancerous samples; GSE79973 contains 10 pairs of GC tissues and adjacent noncancerous mucosa; GSE54129 contains 111 human GC tissues and 21 noncancerous gastric tissues.
Identification of differentially expressed genes (DEGs)
We used GeneSpring 13.1 software to screen the DEGs between the GC tissues and noncancerous samples. All raw data in the expression profiles were preprocessed via robust multi-array average (RMA) normalization.15 The cutoff values for DEG selection were expressed as fold change ≥2 and P<0.05.
Bioinformatics analysis
STYK1 mRNA expression levels were analyzed using the databases of Oncomine (http://www.Oncomine.com) and The Cancer Genome Atlas (TCGA; http://cancergenome.nih.gov)16 downloaded from the University of California Santa Cruz (UCSC) Cancer Genomics Browser. Oncomine is an online cancer microarray database;17 the UCSC Cancer Genomics Browser is an online interactive genome browser hosted by the University of California, Santa Cruz, CA, USA, that offers access to genome sequence data (https://genome-cancer.ucsc.edu).18
Patients and tissue samples
We collected 93 samples of tumor tissues and the adjacent normal tissues at the Second People’s Hospital of Wuxi, Jiangsu, China, between January 2012 and December 2015. All patients had been diagnosed and confirmed with GC by histology. The tumor stages had been determined according to the Cancer Staging Manual (seventh edition) of the American Joint Committee on Cancer (AJCC). The follow-up period was defined as the interval from the date of surgery to the date of death or last follow-up. Written informed consent was obtained from patients, and the School of the Second People’s Hospital of Wuxi Ethics Committee approved this study; this procedure was conducted in accordance with the Declaration of Helsinki.
Immunohistochemistry
Tissue blocks were fixed in 10% buffered formalin, embedded in paraffin, and serially sectioned at 5 µm thickness. Endogenous peroxidase activity was suppressed by 10-minute incubation with 3% hydrogen peroxide. The slides were then blocked with 5% BSA (Boster Bioengineering, Wuhan, China). The tissue sections were treated with primary antibodies against STYK1 (1:300) and then incubated overnight in a humidified chamber at 4°C. The sections were visualized with 3,3′-diaminobenzidine (DAB) and counterstained with hematoxylin for microscopic examination. The STYK1 protein expression levels in the tumor cell cytoplasm were scored as the staining intensity and the percentage of positive stained cells. The scoring system was as follows: 0, no positive cells; 1–3, positive cells with yellowish, light-brown, and dark-brown staining, respectively. The percentage of positive cells was scored as follows: 0, no positive cells; 1, ≤10% positive cells; 2, 11–50% positive cells; 3, >50% positive cells. STYK1 expression was scored by multiplying the percentage of positive tumor cells and the staining intensity and ranged from 0 to 9.
Western blotting
Whole-cell lysates were separated by SDS–PAGE (Bio-Rad Laboratories Inc., Hercules, CA, USA) and transferred to polyvinylidene difluoride (PVDF) membranes (EMD Millipore, Billerica, MA, USA). The membranes were blocked with 5% nonfat dry milk powder for 2 hours at room temperature and then incubated with primary antibodies against STYK1 and GAPDH (Santa Cruz Biotechnology Inc., Dallas, TX, USA) at 4°C overnight. The membranes were visualized using the appropriate secondary antibody (Abcam, Cambridge, MA, USA) at room temperature for 1 hour.
Statistical analyses
All statistical analyses were performed using SPSS 22.0 (IBM Corporation, Armonk, NY, USA). Significant differences among groups were measured by Student’s t-test or one-way ANOVA. The correlation between STYK1 expression and clinicopathological factors was estimated using Fisher’s exact test. Overall survival (OS) curves were plotted according to the Kaplan–Meier method, with the log-rank test applied for comparison estimated by Fisher’s exact test. Cox proportional hazards regression analysis was used for univariate and multivariate analyses of prognostic values. P<0.05 was defined as statistically significant.
A total of 93 patients were enrolled in the survival analysis. Follow-up surveys were made by telephone to obtain updated patient information and survival data. The survey was completed in April 2015, with 5 years of follow-up records obtained for each patient. OS time was defined as the time from the date of surgery to death (for non-censored events) or to the end of the survey period (for censored events). OS was assessed using a Kaplan–Meier method and univariate and Cox regression analyses. We used Kaplan–Meier plotter (www.kmplot.com)19 to evaluate the prognostic value of STYK1 mRNA expression; the patients were divided into two groups based on the median STYK1 mRNA expression (high and low) and assessed using a Kaplan–Meier survival plot.
Results
Identification of STYK1 in GC
We analyzed DEGs in the GSE49051,20 GSE79973,21 and GSE54129 data sets between GC tissues and noncancerous samples, which involved 10,433 genes (Figure 1A–C). Venn diagram analysis showed 252 DEGs, including STYK1 (Figure 1D).
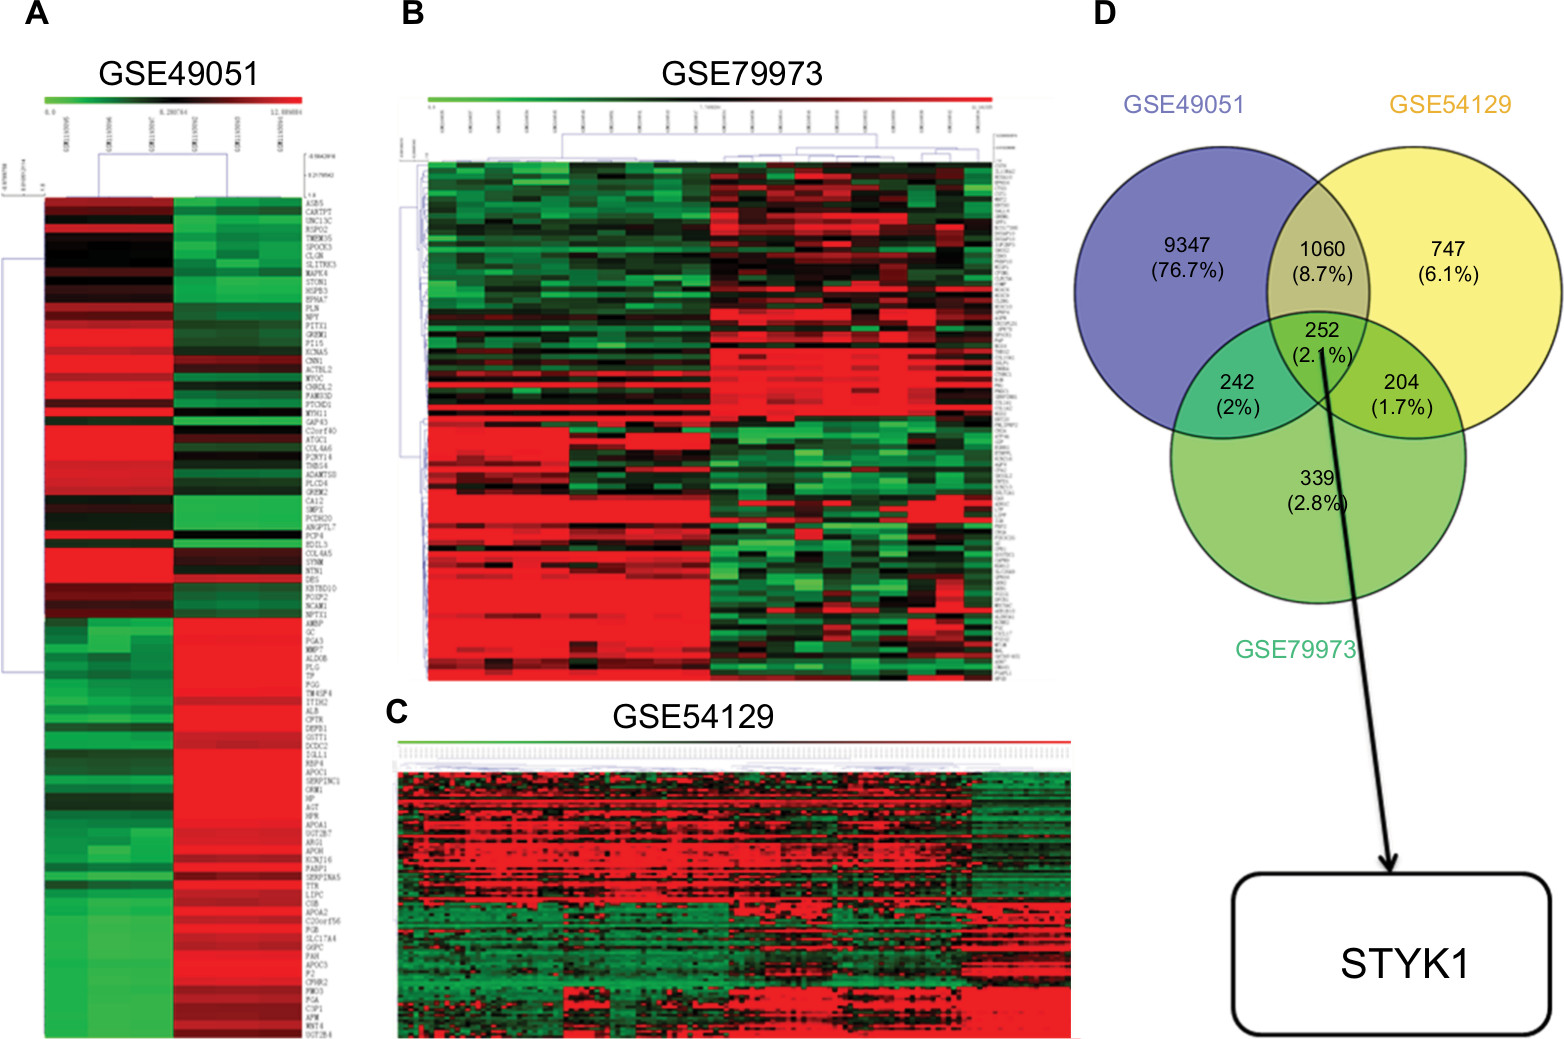 | Figure 1 The results of hierarchical clustering analysis for DEGs between GC tissues and noncancerous tissues. Notes: (A) GSE49051. (B) GSE79973. (C) GSE54129. (D) Venn diagram analyzing the intersection of the three data sets. Abbreviations: DEGs, differentially expressed genes; GC, gastric cancer. |
Correlation of STYK1 expression with prognosis in human cancer
We identified six studies7–10,12,13 from public databases (PubMed, Embase, Cochrane Library, Wiley Online Library, Medline). The meta-analysis results indicated that the pooled HR was 2.21 (95% CI =1.81–2.71) for the high vs low STYK1 expression group (P<0.00001; Figure 2). The result suggests that high STYK1 expression may predict poor prognosis among human cancers, except GC.
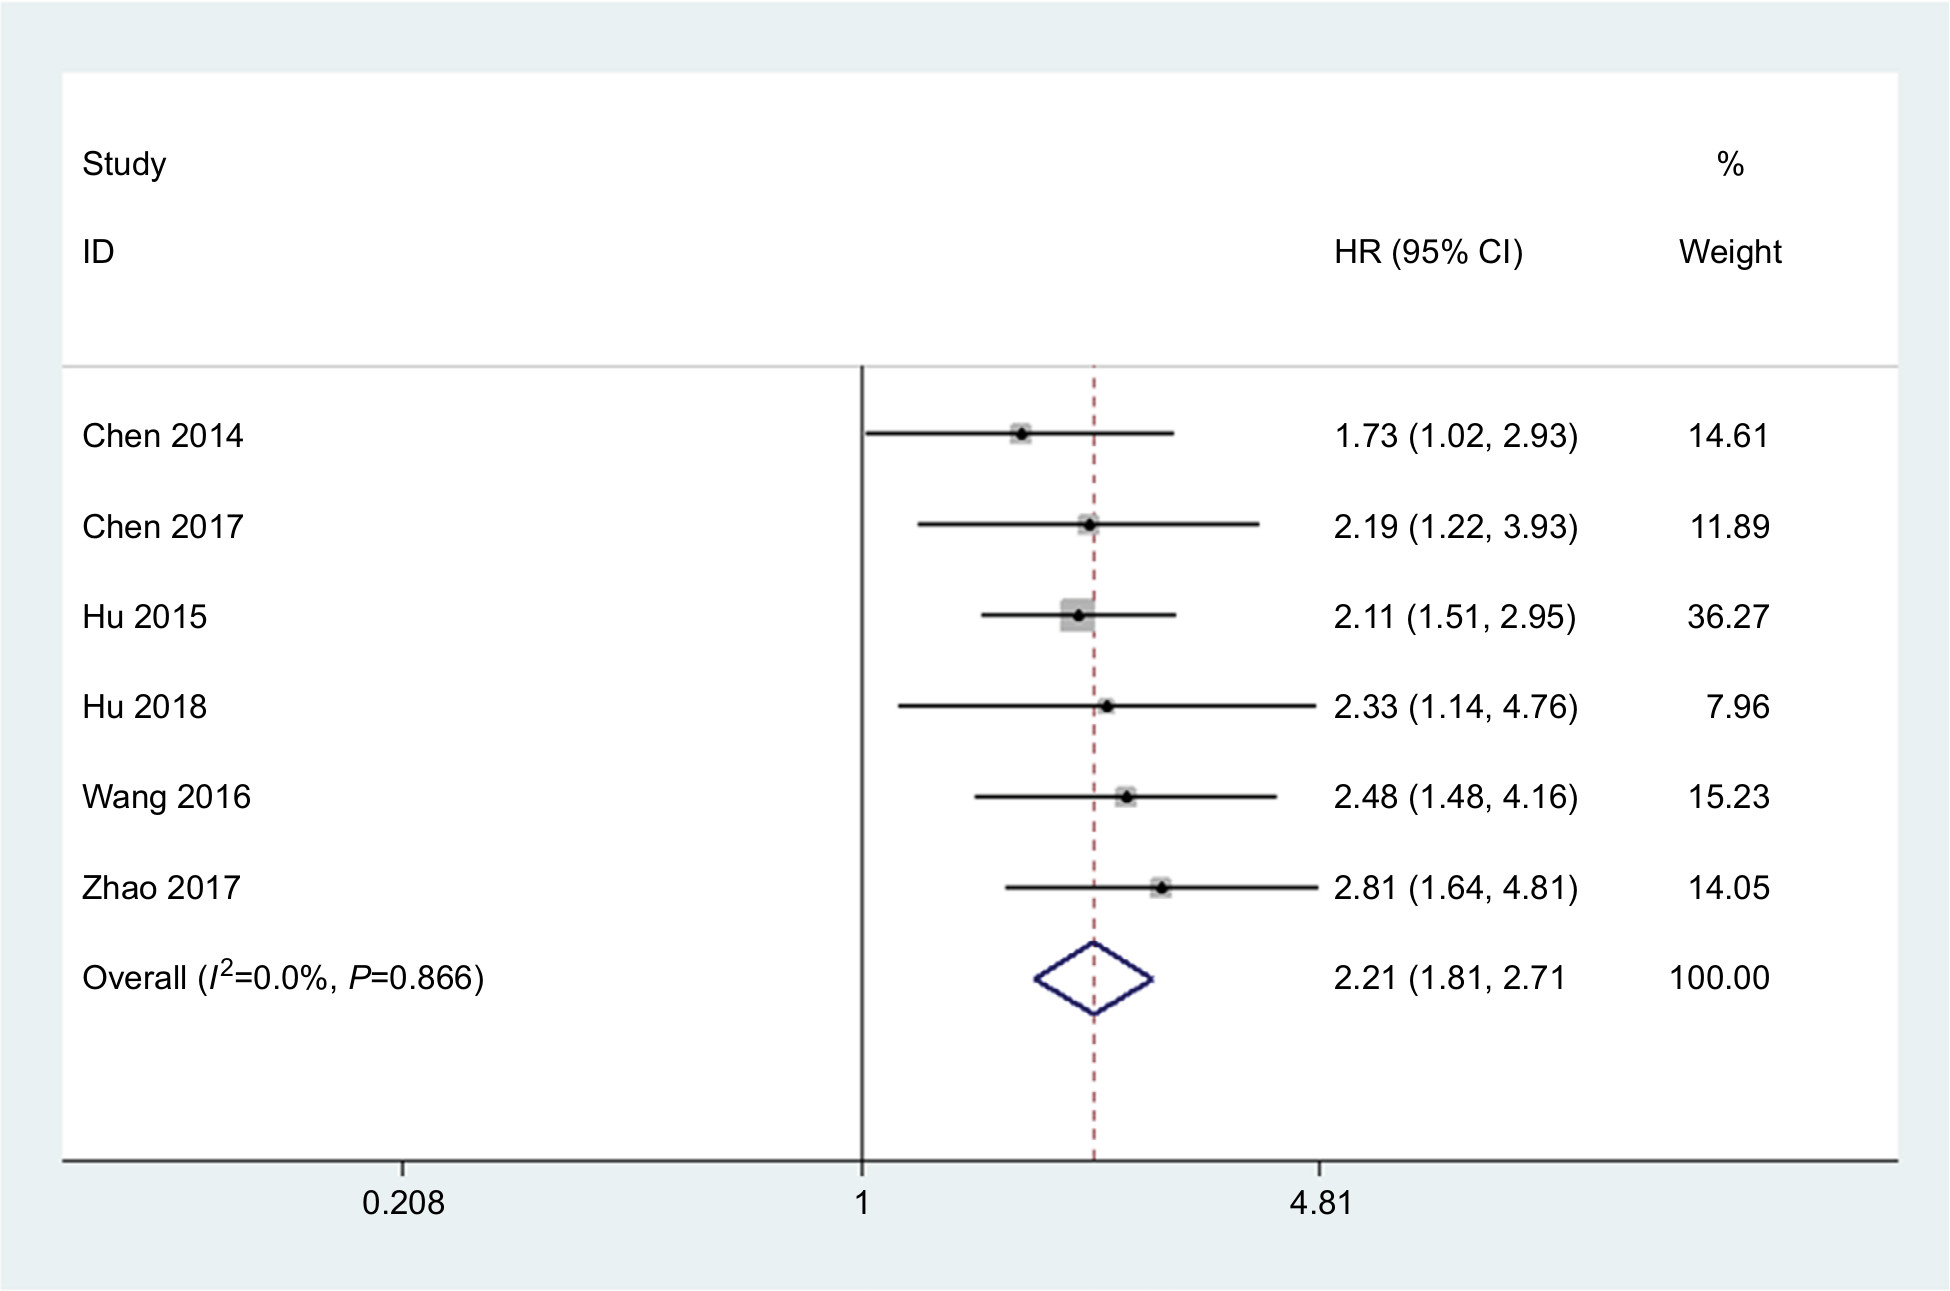 | Figure 2 STYK1 expression is increased in various cancers other than GC. Note: The HR of STYK1 expression in gallbladder carcinoma, lung cancer, colorectal cancer, nasopharyngeal carcinoma, pancreatic cancer, and hepatocellular carcinoma pooled by meta-analysis is shown. Abbreviation: GC, gastric cancer. |
STYK1 expression was decreased in GC tissues
To determine STYK1 expression in GC, we analyzed STYK1 mRNA expression levels using Oncomine. We found that normal tissue had higher STYK1 mRNA expression levels than tumor tissues, which included diffuse gastric adenocarcinoma, gastric adenocarcinoma, gastric intestinal-type adenocarcinoma, gastric mixed adenocarcinoma, and gastrointestinal stromal tumor (Figure 3A–D). We also verified STYK1 expression with TCGA database: the result also showed that tumor tissues had decreased STYK1 expression compared to normal tissues (Figure 3E).
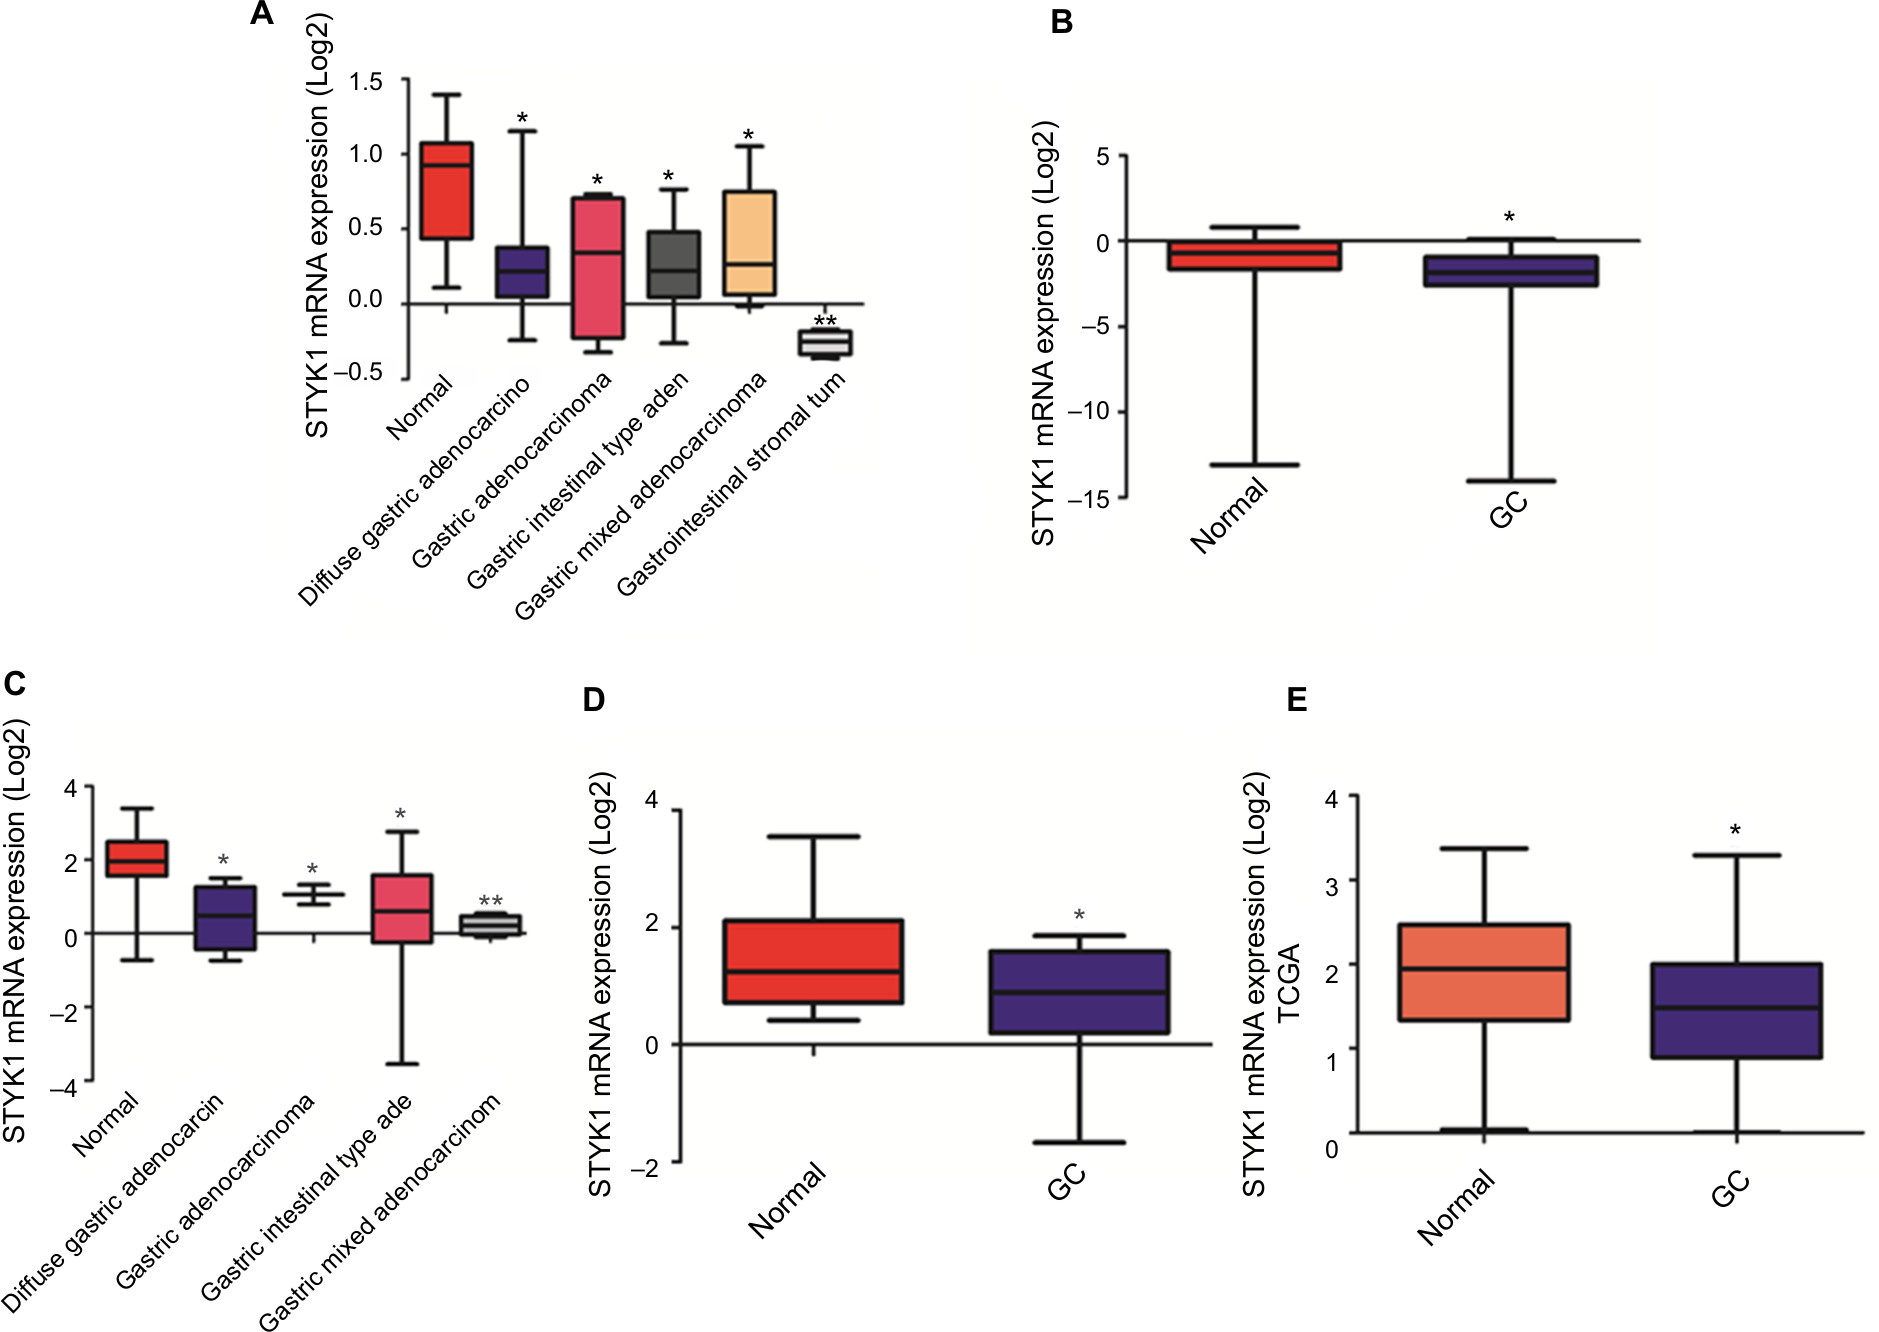 | Figure 3 Analysis of STYK1 mRNA expression in GC tissues and normal tissues based on public databases. Notes: (A) Cho gastric statistics, (B) Cui gastric statistics, (C) D’Errico gastric statistics, (D) Wang gastric statistics. All data are from Oncomine. (E) STYK1 expression analysis based on TCGA database. *P<0.05; **P<0.01. Abbreviations: GC, gastric cancer; TCGA, The Cancer Genome Atlas. |
To verify the accuracy of the Oncomine and TCGA database results, STYK1 protein expression levels were analyzed by immunohistochemical staining in 93 paired tumor tissues and the corresponding normal tissues. The tumor tissues had decreased STYK1 protein expression, which is consistent with the Oncomine database analysis (Figure 4A). Furthermore, we determined STYK1 protein expression in the GC cell lines, HGC-27, SGC-7901, MKN-28, and BGC-823, and in the GES-1 normal gastric mucosal epithelial cell line by Western blotting. All the four GC cell lines had decreased STYK1 protein expression levels compared to the GES-1 cell line (Figure 4B). These results suggest that STYK1 protein expression is downregulated in GC tissues.
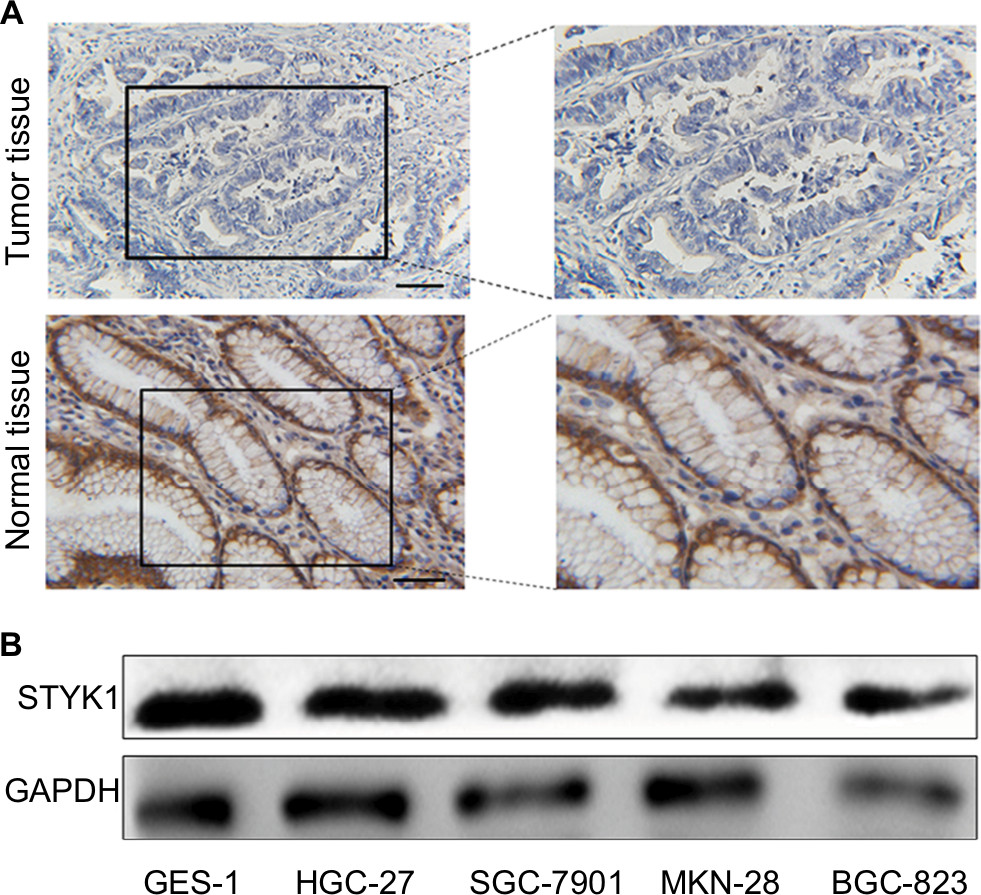 | Figure 4 STYK1 protein expression in primary GC tissues and GC cell lines. Notes: (A) Representative immunohistochemical staining of STYK1 in GC tissues (0 points) and adjacent normal tissues (9 points). Scale bar: 100 μm, magnification for left panel ×40; right panel ×100. (B) Western blot of STYK1 protein expression in four GC cell lines and one normal GES-1. Abbreviations: GC, gastric cancer; GES-1, gastric mucosal epithelial cell line. |
Relationship between STYK1 protein expression and patients’ clinicopathological features
To investigate the association between STYK1 protein levels and the clinicopathological features of GC, we analyzed the correlation between STYK1 protein expression and the clinicopathological features of 93 patients with GC. Table 1 summarizes that the patients could be classified into two subgroups (low and high STYK1 expression). Low STYK1 expression was significantly associated with poor tumor differentiation (P=0.023) and advanced clinical stage (P=0.021). However, there were no obvious correlations between STYK1 protein expression and sex (P=0.709), age (P=0.219), tumor size (P=0.071), and lymph node metastasis (P=0.168).
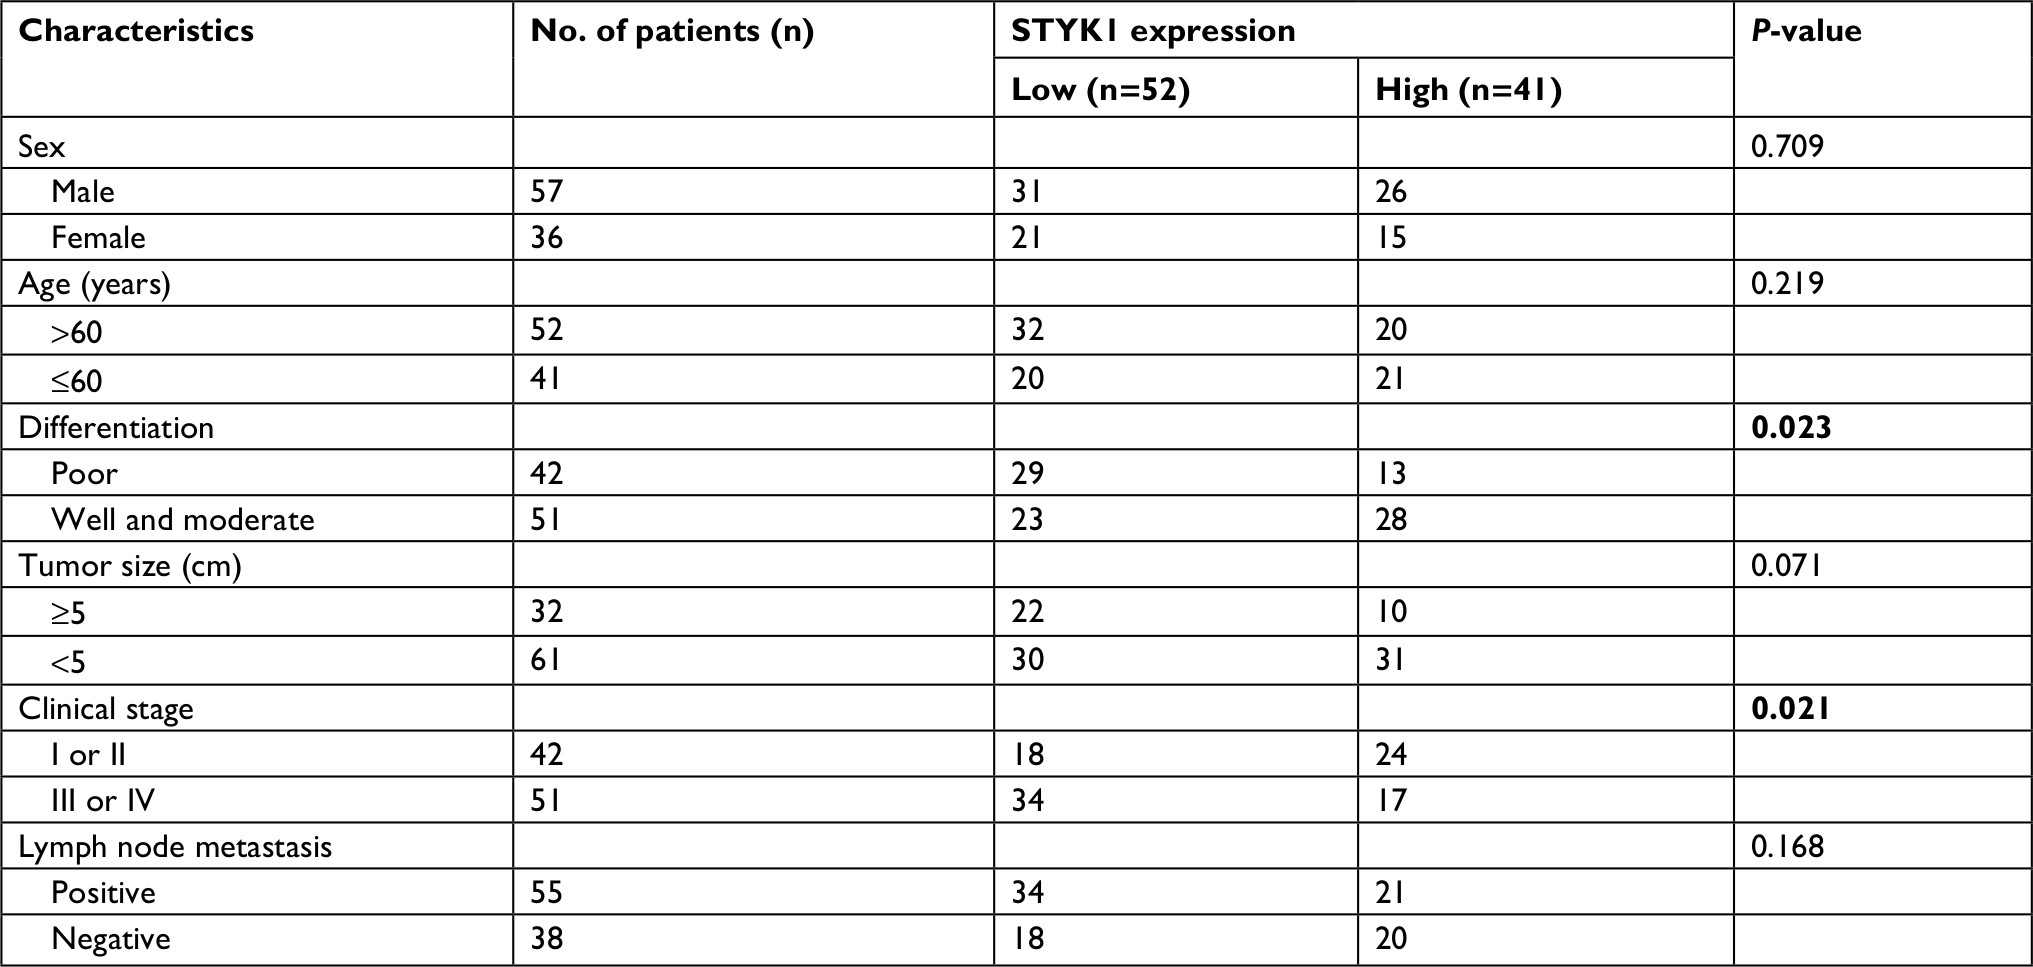 | Table 1 The correlation of STYK1 expression with the clinical features of GC Notes: The significance of bold figures indicate P<0.05. Abbreviation: GC, gastric cancer. |
Prognostic value of STYK1 protein expression
To elucidate the relationship between STYK1 expression and the clinical outcome of patients with GC, we used Kaplan–Meier plotter (www.kmplot.com) to evaluate STYK1 mRNA expression and the survival of patients with GC. The Kaplan–Meier analysis indicated that low STYK1 mRNA expression correlated with poor OS and progression-free survival (PFS; Figure 5A and B). Then, we used Kaplan–Meier analysis to analyze the correlation between STYK1 expression and the survival of the 93 patients and obtained similar results (P=0.034; Figure 5C). Finally, univariate and multivariate analyses revealed that STYK1 expression was an independent prognostic indicator in patients with GC (HR =0.53, 95% CI =0.29–0.95, P=0.039; HR =0.51, 95% CI =0.24–0.91, P=0.030, respectively; Table 2).
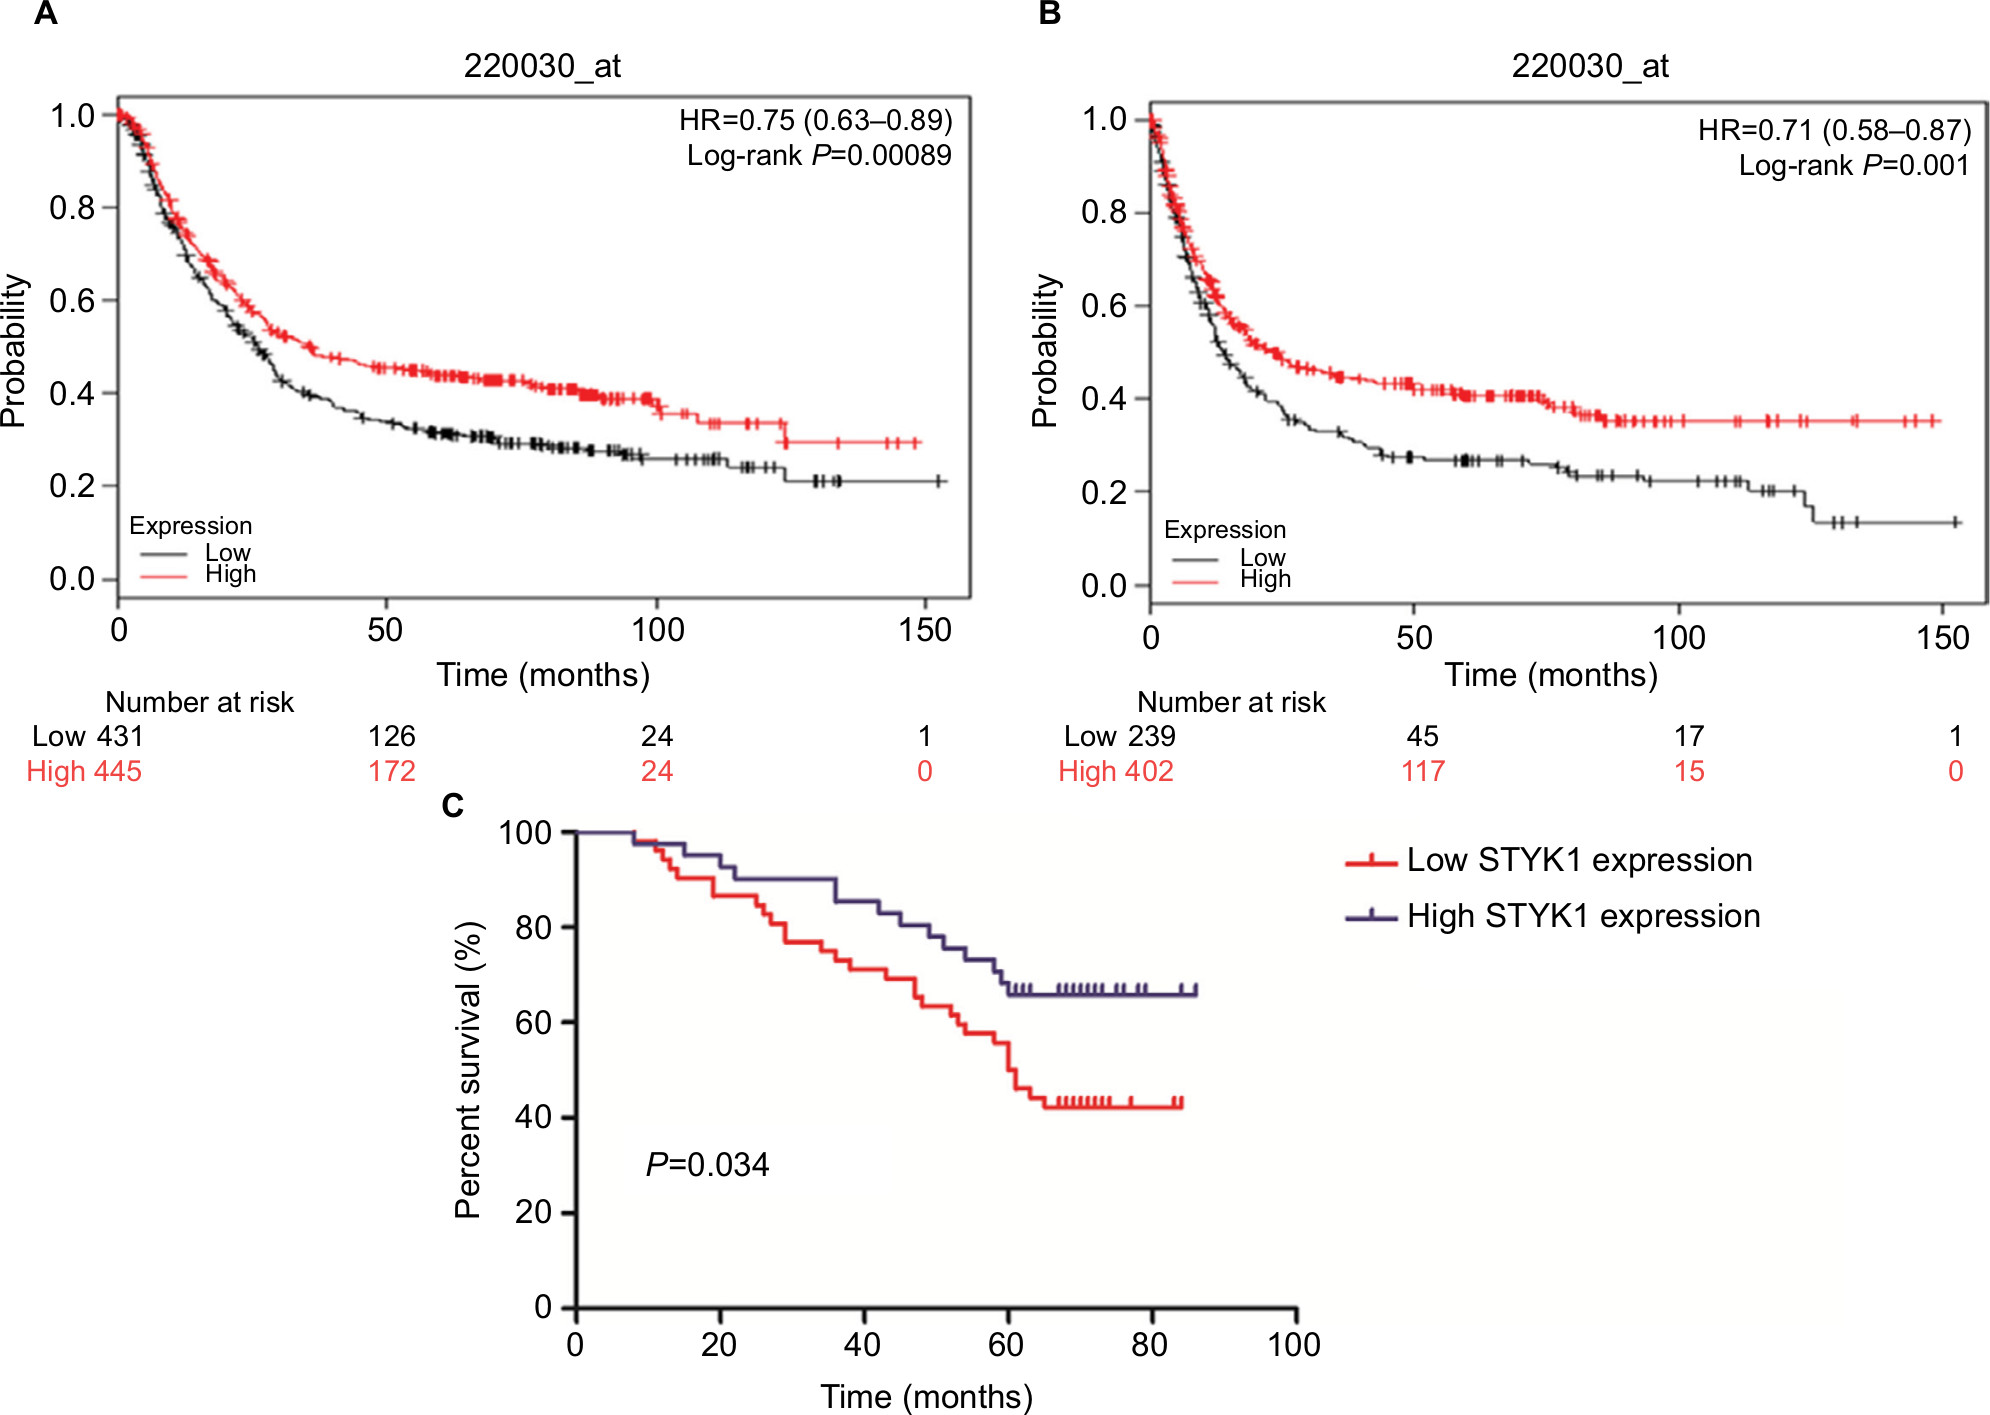 | Figure 5 Prognostic significance of STYK1 protein expression in patients with GC. Notes: Kaplan–Meier plotter analysis of the effect of STYK1 mRNA expression levels on the OS (A) and PFS (B) in patients with GC. (C) Kaplan–Meier analysis of the correlation between STYK1 expression and survival in 93 patients with GC. Abbreviations: GC, gastric cancer; PFS, progression-free survival. |
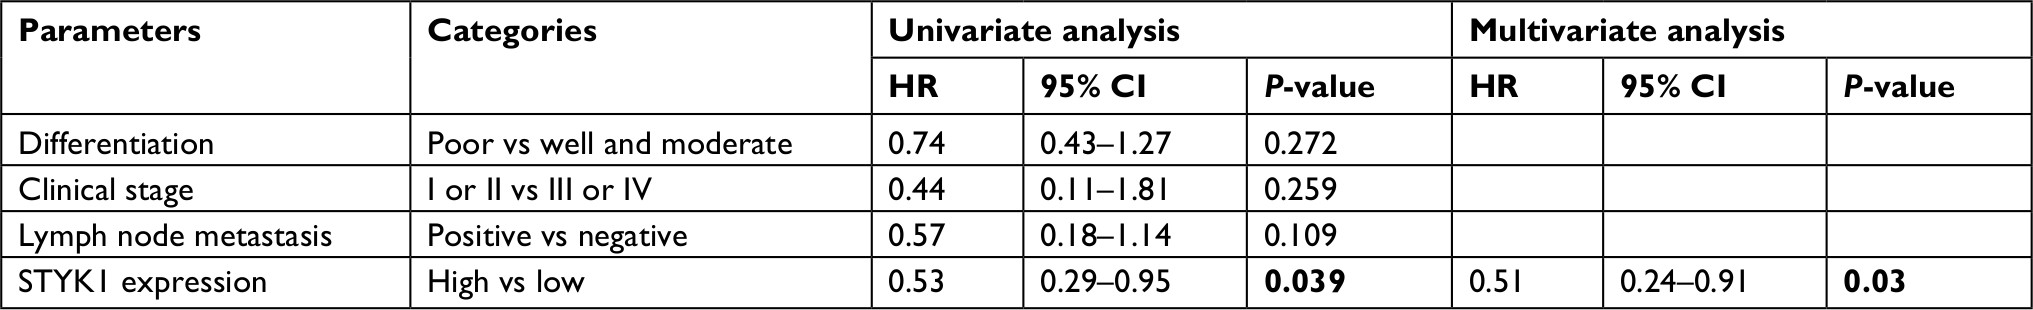 | Table 2 Univariate and multivariate analyses of prognostic factors for OS in GC Notes: The significance of bold figures indicate P<0.05. Abbreviations: GC, gastric cancer; OS, overall survival. |
Discussion
PTKs play a significant role in cellular regulation such as cell proliferation, migration, and invasion.22 STYK1 is a member of the RPTK family. Previous studies have suggested that STYK1 plays a different role in the progression of various cancers. Hu et al7 and Wang et al13 reported that STYK1 promotes cancer cell epithelial–mesenchymal transition (EMT) and tumor metastasis by activating the PI3K–AKT pathway in gallbladder carcinoma and hepatocellular carcinoma. Chung et al23 indicated that STYK1 overexpression could have potential as a kinase in castration-resistant prostate cancer cells and could be a possible approach for the development of novel castration-resistant prostate cancer therapies. Chen et al12 reported that STYK1 repressed E-cadherin expression and promoted EMT, mediated by the p38 MAPK signaling pathway, and showed that STYK1 might be a prognostic marker in patients with pancreatic cancer. In addition, Nirasawa et al24 suggested that STYK1 is a novel drug resistance factor and could be a predictor of the therapeutic response in acute leukemia. These studies all demonstrate that high STYK1 expression plays important roles in various cancers and affects the prognosis of patients with cancer. In the present study, we first used three GEO data sets (GSE49051, GSE79973, GSE54129) to determine the differential expression of STYK1 in GC, and immunohistochemistry and Western blotting confirmed that STYK1 protein expression was decreased in GC tissues and cell lines, respectively. Furthermore, low STYK1 expression was associated with poor prognosis in patients with GC. To the best of our knowledge, this study is the first to suggest that STYK1 expression may be an independent prognostic factor in patients with GC. However, the reason for the low STYK1 expression in GC and the specific regulatory mechanism in GC progression remains unclear. STYK1 has been identified as a new member of the RPTK-like protein family.25 RPTKs are key players in the regulation of numerous fundamental cellular processes such as growth, adhesion, differentiation, and migration.26 In GC cells, the MAPK–ERK and PI3K–AKT signaling pathways affect RPTK activity.27 Therefore, we speculated that the effect of other regulatory factors in GC leads to PI3K–AKT signaling pathway feedback acting on STYK1, thereby reducing its expression. Naturally, the detailed mechanism requires verification in further well-designed experiments.
Conclusion
Our study demonstrates that downregulated STYK1 correlates significantly with poor tumor differentiation, advanced clinical stage, and poor survival. The findings also demonstrate that STYK1 might be a diagnostic and prognostic indicator in patients with GC.
Acknowledgment
This study was supported by the Natural Science Foundation of Anhui Province (grant number 1808085 MH273).
Disclosure
The authors report no conflicts of interest in this work.
References
Torre LA, Bray F, Siegel RL, Ferlay J, Lortet-Tieulent J, Jemal A. Global cancer statistics, 2012. CA Cancer J Clin. 2015;65(2):87–108. | ||
Tsai MM, Wang CS, Tsai CY, et al. Potential Diagnostic, Prognostic and Therapeutic Targets of MicroRNAs in Human Gastric Cancer. Int J Mol Sci. 2016;17(6):E945. | ||
Ertao Z, Jianhui C, Kang W, et al. Prognostic value of mixed lineage kinase domain-like protein expression in the survival of patients with gastric caner. Tumour Biol. 2016;37(10):13679–13685. | ||
Fock KM. Review article: the epidemiology and prevention of gastric cancer. Aliment Pharmacol Ther. 2014;40(3):250–260. | ||
Geiger TR, Peeper DS. Metastasis mechanisms. Biochim Biophys Acta. 1796;2009(2):293–308. | ||
Liu L, Yu XZ, Li TS, et al. A novel protein tyrosine kinase NOK that shares homology with platelet- derived growth factor/fibroblast growth factor receptors induces tumorigenesis and metastasis in nude mice. Cancer Res. 2004;64(10):3491–3499. | ||
Hu YP, Wu ZB, Jiang L, et al. STYK1 promotes cancer cell proliferation and malignant transformation by activating PI3K-AKT pathway in gallbladder carcinoma. Int J Biochem Cell Biol. 2018;97:16–27. | ||
Chen P, Li WM, Lu Q, et al. Clinicopathologic features and prognostic implications of NOK/STYK1 protein expression in non-small cell lung cancer. BMC Cancer. 2014;14:402. | ||
Hu L, Chen HY, Cai J, et al. Serine threonine tyrosine kinase 1 is a potential prognostic marker in colorectal cancer. BMC Cancer. 2015; 15:246. | ||
Zhao Y, Yang L, He J, Yang H. STYK1 promotes Warburg effect through PI3K/AKT signaling and predicts a poor prognosis in nasopharyngeal carcinoma. Tumour Biol. 2017;39(7):101042831771164. | ||
Jackson KA, Oprea G, Handy J, Kimbro KS. Aberrant STYK1 expression in ovarian cancer tissues and cell lines. J Ovarian Res. 2009; 2(1):15. | ||
Chen L, Ma C, Bian Y, et al. Aberrant expression of STYK1 and E-cadherin confer a poor prognosis for pancreatic cancer patients. Oncotarget. 2017;8(67):111333–111345. | ||
Wang Z, Qu L, Deng B, et al. STYK1 promotes epithelial-mesenchymal transition and tumor metastasis in human hepatocellular carcinoma through MEK/ERK and PI3K/AKT signaling. Sci Rep. 2016;6:33205. | ||
Edgar R, Domrachev M, Lash AE. Gene Expression Omnibus: NCBI gene expression and hybridization array data repository. Nucleic Acids Res. 2002;30(1):207–210. | ||
Rich JN, Hans C, Jones B, et al. Gene expression profiling and genetic markers in glioblastoma survival. Cancer Res. 2005;65(10):4051–4058. | ||
Cancer Genome Atlas Network. Comprehensive molecular portraits of human breast tumours. Nature. 2012;490(7418):61–70. | ||
Rhodes DR, Yu J, Shanker K, et al. ONCOMINE: a cancer microarray database and integrated data-mining platform. Neoplasia. 2004;6(1):1–6. | ||
Kent WJ, Sugnet CW, Furey TS, et al. The human genome browser at UCSC. Genome Res. 2002;12(6):996–1006. | ||
Győrffy B, Surowiak P, Budczies J, Lánczky A. Online survival analysis software to assess the prognostic value of biomarkers using transcriptomic data in non-small-cell lung cancer. PLoS One. 2013;8(12):e82241. | ||
Sun T, du W, Xiong H, Yu Y, Weng I, Ren L. Correction: TMEFF2 Deregulation Contributes to Gastric Carcinogenesis and Indicates Poor Survival Outcome. Clin Cancer Res. 2015;21(15):3572. | ||
He J, Jin Y, Chen Y, et al. Downregulation of ALDOB is associated with poor prognosis of patients with gastric cancer. Onco Targets Ther. 2016;9:6099–6109. | ||
Carrasco-García E, Saceda M, Martínez-Lacaci I. Role of receptor tyrosine kinases and their ligands in glioblastoma. Cells. 2014;3(2):199–235. | ||
Chung S, Tamura K, Furihata M, et al. Overexpression of the potential kinase serine/threonine/tyrosine kinase 1 (STYK 1) in castration-resistant prostate cancer. Cancer Sci. 2009;100(11):2109–2114. | ||
Nirasawa S, Kobayashi D, Kondoh T, et al. Significance of serine threonine tyrosine kinase 1 as a drug resistance factor and therapeutic predictor in acute leukemia. Int J Oncol. 2014;45(5):1867–1874. | ||
Lemmon MA, Schlessinger J. Cell Signaling by Receptor Tyrosine Kinases. Cell. 2010;141(7):1117–1134. | ||
Zwick E, Bange J, Ullrich A. Receptor tyrosine kinase signalling as a target for cancer intervention strategies. Endocr Relat Cancer. 2001;8(3):161–173. | ||
Wang Y, Appiah-Kubi K, Lan T, et al. PKG II inhibits PDGF-BB triggered biological activities by phosphorylating PDGFRβ in gastric cancer cells. Cell Biol Int. 2018;42(10):1358–1369. |
 © 2018 The Author(s). This work is published and licensed by Dove Medical Press Limited. The
full terms of this license are available at https://www.dovepress.com/terms
and incorporate the Creative Commons Attribution
- Non Commercial (unported, 3.0) License.
By accessing the work you hereby accept the Terms. Non-commercial uses of the work are permitted
without any further permission from Dove Medical Press Limited, provided the work is properly
attributed. For permission for commercial use of this work, please see paragraphs 4.2 and 5 of our Terms.
© 2018 The Author(s). This work is published and licensed by Dove Medical Press Limited. The
full terms of this license are available at https://www.dovepress.com/terms
and incorporate the Creative Commons Attribution
- Non Commercial (unported, 3.0) License.
By accessing the work you hereby accept the Terms. Non-commercial uses of the work are permitted
without any further permission from Dove Medical Press Limited, provided the work is properly
attributed. For permission for commercial use of this work, please see paragraphs 4.2 and 5 of our Terms.