Back to Journals » OncoTargets and Therapy » Volume 10
Low PLCE1 levels are correlated with poor prognosis in hepatocellular carcinoma
Authors Cheng Y, Xing SG, Jia WD, Huang M, Bian NN
Received 2 November 2016
Accepted for publication 23 November 2016
Published 19 December 2016 Volume 2017:10 Pages 47—54
DOI https://doi.org/10.2147/OTT.S126401
Checked for plagiarism Yes
Review by Single anonymous peer review
Peer reviewer comments 3
Editor who approved publication: Dr William C. Cho
Ya Cheng,1,2,* Song-Ge Xing,2,3,* Wei-Dong Jia,1,2 Mei Huang,1,2 Na-Na Bian2
1Department of General Surgery, Affiliated Provincial Hospital, Anhui Medical University, 2Anhui Province Key Laboratory of Hepatopancreatobiliary Surgery, 3CAS Key Laboratory of Innate Immunity and Chronic Disease, Innovation Center for Cell Signaling Network, School of Life Science, University of Science and Technology of China, Hefei, People’s Republic of China
*These authors contributed equally to this work
Background: Previous reports show that phospholipase C epsilon-1 (PLCE1) expression is positively correlated with esophageal squamous cell carcinoma and gastric cardia adenocarcinomas; however, the expression of PLCE1 in hepatocellular carcinoma (HCC) and its correlation with clinical outcome still remain unclear. The aim of this study was to explore the expression of PLCE1 in HCC tissue and to determine whether PLCE1 was a prognostic factor for HCC patients.
Materials and methods: PLCE1 levels in 20 paired HCC tissues and corresponding paracarcinomatous tissues was investigated by quantitative real-time polymerase chain reaction and Western blot assays. In addition, protein levels of PLCE1 in one normal liver epithelial cell and four HCC cell lines were examined using Western blot assay. Moreover, immunohistochemistry was applied to determine the expression of PLCE1 in HCC and corresponding surrounding tissues from 90 patients. Statistical analyses were used to examine the association between PLCE1 levels and clinicopathological features.
Results: We found that the expression of PLCE1 in tumor tissues was significantly lower than those in paracarcinomatous tissues at both mRNA and protein levels (P<0.05). We also determined that PLCE1 protein expression levels were lower in HCC cell lines than normal liver epithelial cells (P<0.05). Notably, immunohistochemical assay showed that PLCE1 expression was significantly low in HCC tissues compared with the adjacent normal liver tissues (40% vs 18.9%; P<0.05). Besides, PLCE1 levels were negatively correlated with tumor capsulae, vascular invasion, Edmondson grade, alpha-fetoprotein, and tumor-node-metastasis stage (P<0.05). Univariate analysis revealed that lower level expression of PLCE1 was significantly associated with poorer overall survival (OS) rate (P<0.001) and disease-free survival rate (P<0.001). Multivariate analysis revealed that low PLCE1 level was an independent poor prognostic factor of OS and recurrence-free survival (P<0.001 and P=0.003, respectively).
Conclusion: In brief, our results revealed that decreased PLCE1 expression was associated with tumor progression in HCC and may function as a promising biomarker for HCC prognosis.
Keywords: PLCE1, hepatocellular carcinoma, prognosis, immunohistochemistry
Introduction
Hepatocellular carcinoma (HCC) is the second most cause of cancer-related mortality in males and the sixth lethal among females.1 It has a gloomy prognosis with a 5-year survival rate of 11%.2 One of the most important factors for the low survival rate is that the vast majority of HCC patients are detected at an advanced stage, where radical resections are not feasible because of tumor metastasis. Therefore, the examination of identified biomarkers, especially for early stage cancer, is imperative to improve the prognosis of HCC patients.
A novel susceptibility locus (rs2274223: A5780G), located at exon 26 of phospholipase C epsilon-1 (PLCE1) has been reported by three large-scale and independent genome-wide association studies in the People’s Republic of China (PRC) and is strongly correlated with the risk factor for esophageal and gastric cancers in Chinese population.3–5 PLCE1 is located in chromosome 10q23, and it is a unique member of the phospholipase family, which encodes a phospholipase that catalyzes the hydrolysis of phosphatidyl-inositol 4,5-bisphosphate to generate two secondary messengers: inositol 1,4,5-triphosphate and diacylglycerol; these secondary messengers subsequently regulate cell growth, differentiation, and gene expression.6,7 Recently, increasing studies have reported that PLCE1 may play an essential role in carcinogenesis and progression of numerous human cancers, including cancers of the esophagus, stomach, intestine, head and neck, skin, bladder, and colorectal.8–14 However, less information has been reported about the expression of PLCE1 in HCC. In this study, the expression of PLCE1 in HCC and in surrounding nontumor tissue were detected by Western blotting and quantitative real-time polymerase chain reaction (qRT-PCR) assays. In addition, protein levels of PLCE1 in one normal liver epithelial cell and four HCC cell lines were examined using Western blot assay. Moreover, immunohistochemical (IHC) staining of PLCE1 in tumor tissues were performed for 90 patients with HCC, and we explored the association between PLCE1 levels, clinicopathological features, and postoperative survival.
Materials and methods
Patients and specimens
We obtained the tumor tissues and paracarcinomatous specimens from 90 patients with HCC who had undergone curative hepatectomy from 2006 to 2011 at the Affiliated Provincial Hospital of Anhui Medical University, Hefei, PRC. Patients who had undergone preoperative any other anticancer therapy were eliminated from this study. Additionally, we also obtained the tumor and paracarcinomatous tissues from 20 patients for analyzing the expression of PLCE1 by Western blotting and qRT-PCR assays. The clinical data and pathological features, such as age, gender, tumor size, tumor capsula, tumor nodule, vascular invasion, cirrhosis, HBsAg status, Edmondson grade, alpha-fetoprotein (AFP), Child–Pugh grade, and tumor-node-metastasis (TNM) stage, were collected by retrospective medical records. Tumor differentiation was defined according to the Edmondson grading system, and tumor pathological stage were defined according to the seventh edition TNM classification of The American Joint Committee on Cancer;15 we also used Child–Pugh classification to estimate liver function.
Moreover, overall survival (OS) time was calculated from the surgery date to the death or last observation date. Disease-free survival (DFS) time was defined as the period from the surgery day to the date of first diagnosed recurrence. If recurrence was not verified, the survivors were censored on the death date or the last date of follow-up. Every patient had signed the informed consent for their specimens to be used in this study, and the study protocol was approved by the Research Ethics Committee of Anhui Provincial Hospital, and was in accordance with the Declaration of Helsinki.
Quantitative real-time PCR
Total RNA gathered from snap-frozen tissue samples was isolated using Trizol (Life Technologies) according to the manufacturer’s protocol. We designed specific primers for PLCE1 (Primer Designing Tool, NCBI, Bethesda, MD, USA) as follows: forward: 5′-GCCACCAACCAATTTACTGATGA-3′ and reverse: 5′-TAGTAACAAGGGTTCCAGTGC-3′. 18S RNA was used as the internalized control, and the sequences were shown as follows: forward: 5′-CGCTACTACCGATTGGATGG-3′ and reverse: 5′-AGTTCGACCGTCTTCTCAGC-3′. PLCE1 level was determined by SYBR Green-based RT-PCR performed on a PikoReal RT-PCR system (Thermo Fisher Scientific) in the following conditions: a first denaturation step with 95°C for 10 minutes, followed by 40 amplification cycles involving denaturation for 15 seconds at 95°C, then annealing for 30 seconds at 60°C, and finally elongation for 30 seconds at 72°C. We performed melting-curve analysis to monitor PCR product purity, and the data of relative gene expression were analyzed using the 2−ΔΔCt method.
Western blot
We used radioimmunoprecipitation assay lysis buffer (Beyotime Institute of Biotechnology, Shanghai, PRC) to lyse snap-frozen tumor and corresponding paracarcinomatous tissues, and the bicinchoninic acid protein assay was employed to estimate protein concentration. The same amount of protein samples were separated by 10% sodium dodecyl sulfate–polyacrylamide gel electrophoresis and transferred to the polyvinylidene difluoride membranes (Millipore, Billerica, MA, USA). Membranes were incubated overnight at 4°C with rabbit primary antibodies anti-PLCE1 (1:300, Abcam PLC, Cambridge, UK) and human antibody of β-actin (1:5,000, Zhongshan Golden Bridge Biotechnology Co Ltd, Beijing, PRC). Following a wash with Tris-buffered saline/0.1% Tween for three times, each time for 5 minutes, we incubated the membranes with secondary antibodies at room temperature for 2 hours. The blots were captured and visualized by Alpha-EaseFC imaging system (Alpha Innotech, San Leandro, CA, USA). Using the Alpha-EaseFC software, the integrated density value (IDV) of each band was detected by drawing a rectangle outlining the band. A total IDV by summation of each band IDV was employed when a protein had double bands. Results were normalized to the internal control, β-actin.
Cell culture
HCC cell lines SK-Hep1, PLC, HepG2, and Hep3B, as well as the immortalized normal liver epithelial cell THLE3 obtained from ATCC were cultured in Dulbecco’s Modified Eagle’s Medium (Gibco, Invitrogen Corporation, Carlsbad, CA, USA), while THLE3 cells were cultured in bronchial epithelial growth medium (Lonza/Clonetics Corporation, Walkersville, MD, USA). The cells were maintained at 37°C with 5% CO2 in a humidified atmosphere.
Immunohistochemistry
Serial tissue sections (4 μm thick) were deparaffinized with xylene, then rehydrated through grade alcohols and subjected to autoclave antigen retrieval in ethylenediaminetetraacetic acid buffer (pH 8.0) at 100°C for 5 minutes. Endogenous peroxidase activity was blocked by 3% hydrogen peroxide for 10 minutes. Next, tissue sections were incubated at 4°C overnight with anti-PLCE1 rabbit polyclonal antibody (Abcam PLC) at a dilution of 1:100 in phosphate-buffered saline (PBS) with 1% bovine serum albumin, then washed with PBS and incubated with horseradish peroxidase-conjugated secondary antibody (Zhongshan Golden Bridge Biotechnology) for 30 minutes. Immunoreactivity was visualized with chromogen 3,3′-diaminobenzidine. Next, all sections were counterstained with hematoxylin and then dehydrated in grade alcohols, and finally mounted with neutral balsam. Under the same conditions, PBS was used as the negative control for the primary antibody, and a known immunopositive section served as the positive control. We consulted a previously reported method to evaluate semiquantitatively tumor expression of PLCE116 as follows: the percentage of staining cell scores: 0, no staining; 1 point, <10%; 2 points, 10%–30%; and 3 points, >30%. The staining intensity scores: 0 point, negative; 1 point, weak intensity; 2 points, moderate intensity; and 3 points, strong intensity. Sum scores with ≥3 points were considered positive, whereas sum scores with <3 points were regarded as negative. All scores were assessed independently by two pathologists, and the variability of the interobserver was <3%.
Statistical analysis
All data analyses were carried out with SPSS 22.0 software (SPSS Inc, Chicago, IL, USA). Data were presented as mean ± standard deviation. Differences of PLCE1 mRNA and protein levels between HCC tissues and corresponding paracarcinomatous tissues samples were examined with the independent Student t-test. Categorical variables were analyzed by the χ2 test or Fisher’s exact test, and the Kaplan–Meier method was used to determine survival analysis, whereas the differences among survival rates were evaluated by the log-rank test. Cox proportional hazard model was used to evaluate the prognostic factors, which were significant in univariate analyses. P-values <0.05 were served as statistically significant.
Results
PLCE1 is downregulated in HCC tissues
To investigate whether PLCE1 could function as a new prognostic factor for HCC patients, we first determined its levels in 20 paired HCC tissues and paracarcinomatous tissues using qRT-PCR and Western blot assay. qRT-PCR assay revealed that PLCE1 levels were significantly lower in tumor sample tissues than that in adjacent nontumor tissues (0.51±0.49 vs 1.46±1.10, P<0.05), and 85% of samples (17/20 paired) have shown that tumor tissues have a lower expression (Figure 1). Western blot assay suggested that PLCE1 levels in tumor sample tissues and adjacent paracarcinomatous tissues samples were 0.93±0.39 and 1.22±0.40, respectively (Figure 2A and B). And 18 paired samples (18/20) were remarkably lower in the HCC tumor samples, which showed a similar pattern to qRT-PCR assay. In addition, we analyzed PLCE1 expression in HCC cells and normal liver cells. Western blot assay found that PLCE1 was downregulated in all four HCC cell lines compared with THLE3 (Figure 2C). Besides, IHC assay showed that PLCE1 was mainly located in the cytoplasm and cytomembrane of cancer cells and PLCE1 levels were downregulated in HCC tissues (40%, 36/90) compared with adjacent normal liver tissues (18.9%, 17/90; Figure 3). These findings suggested that PLCE1 was downregulated in HCC tissues and cells.
 | Figure 1 Real-time polymerase chain reaction analysis of PLCE1 expression in 20 pairs of hepatocellular carcinomas and matched adjacent nontumorous tissues. |
 | Figure 2 Western blotting analysis of PLCE1 expression in tissues from HCC tumorous tissues or cell lines and adjacent nontumorous tissues or normal liver epithelial cells. |
 | Figure 3 Representative immunohistochemical staining of PLCE1 in HCC and matched adjacent noncancerous liver tissues. |
The relationship between PLCE1 levels and clinicopathological features
Among 90 patients in this study, 77 were males and 13 were females, and the mean age was 52 (range 19–80) years. Statistical analyses suggested that downregulation expression of PLCE1 was significantly positively correlated with tumor capsula statues, Edmondson grade, vascular invasion, AFP, and TNM stage. But there was no association between PLCE1 levels and age, gender, hepatitis B surface antigen status, cirrhosis, or Child–Pugh grade (Table 1).
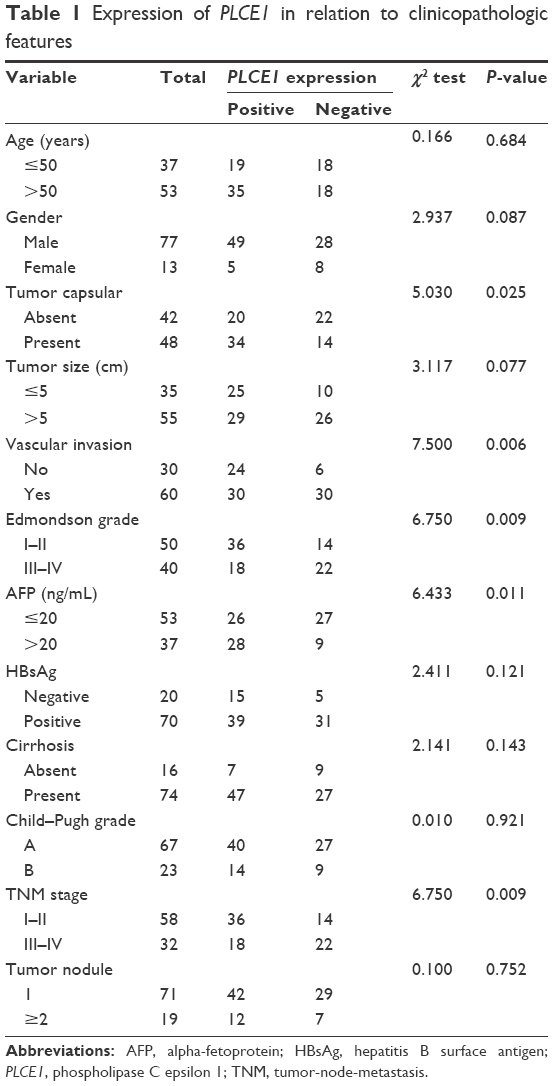 | Table 1 Expression of PLCE1 in relation to clinicopathologic features |
PLCE1 is a favorable prognostic factor for HCC patients
Follow-up data of this study were gathered for all the patients. Median follow-up was 31 months (range 2–120 months). Kaplan–Meier curve with univariate analysis (log-rank) showed that the OS time of the patients who had the negative tumor score of PLCE1 expression was shorter than those who had the score positive (15 months, 95% confidence interval [CI]: 11.080–18.920 vs 51 months, 95% CI: 36.200–65.800; P<0.001). Similarly, compared with the parents with positive PLCE1 expression (28 months, 95% CI: 23.202–32.798), the parents who had negative score of PLCE1 expression had a shorter DFS time (9 months, 95% CI: 7.831–10.169; P<0.001; Table 2; Figure 4). Univariate analysis also demonstrated tumor size, tumor capsulae, serum AFP, vascular invasion, Edmondson grade, and TNM stage had markedly prognostic value on OS, and tumor size, tumor capsulae, vascular invasion, Edmondson grade, and TNM stage had markedly prognostic value on disease-free survival. Furthermore, we used multivariate analysis to determine whether PLCE1 was an independent prognostic factor for HCC and found that PLCE1 level, tumor capsulae, serum AFP, and vascular invasion were the independent prognostic factor for OS, whereas PLCE1 expression, vascular invasion, TNM stage, and tumor capsulae were the independent prognostic factor for RFS (Table 3).
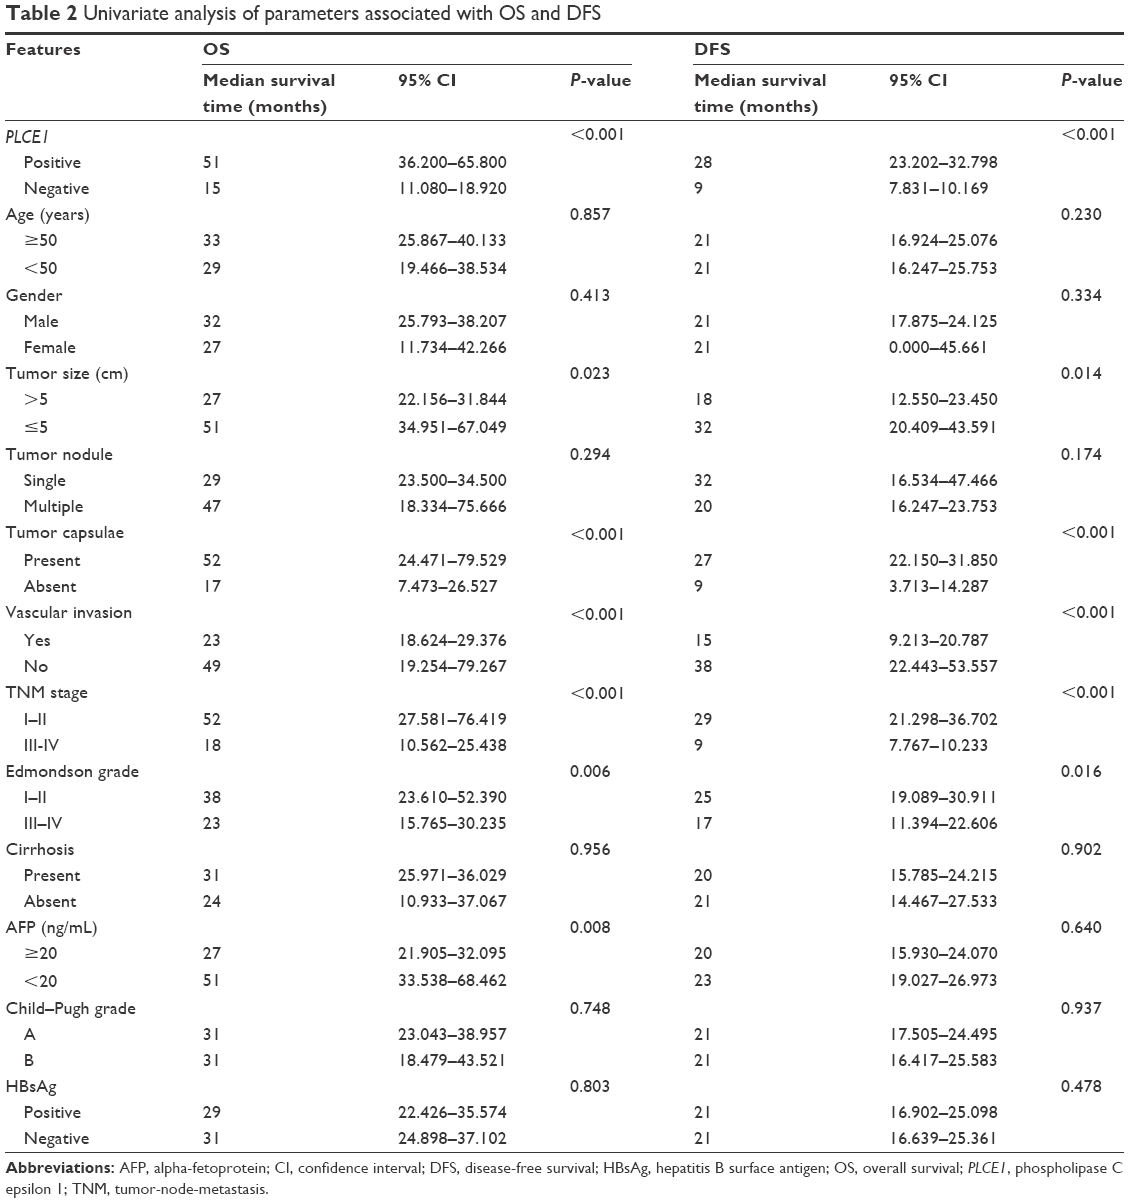 | Table 2 Univariate analysis of parameters associated with OS and DFS |
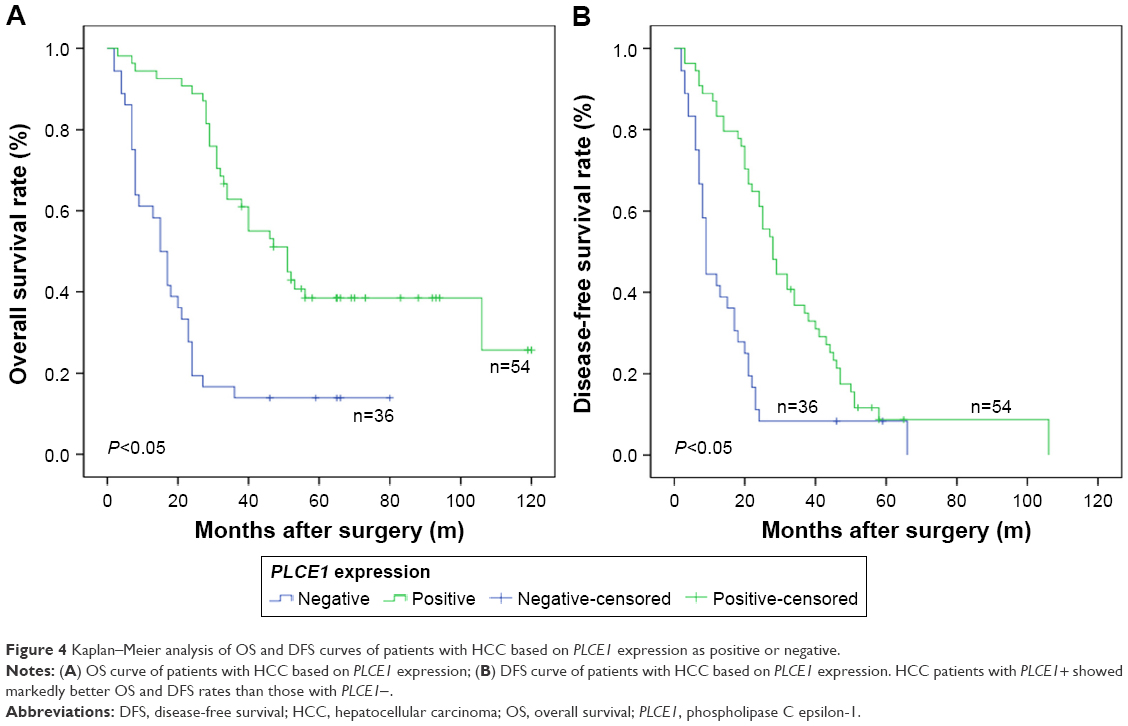 | Figure 4 Kaplan–Meier analysis of OS and DFS curves of patients with HCC based on PLCE1 expression as positive or negative. |
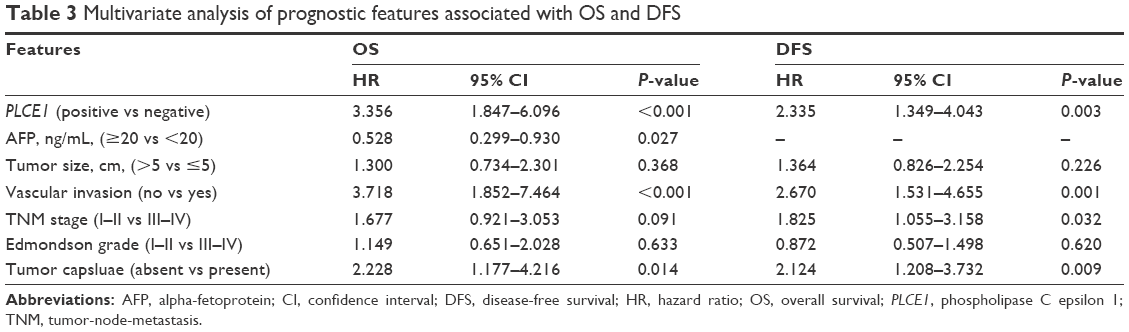 | Table 3 Multivariate analysis of prognostic features associated with OS and DFS |
Discussion
PLCE1 had different functions compared with the other molecules of the PLC family,17 which served as a vital effector of Ras family proteins that regulate cell growth, differentiation, apoptosis, and angiogenesis.18 Therefore, recent studies had demonstrated that the abnormal expression of PLCE1 in human tissues may be related to initiation and development of cancer. For example, through their semi-quantitative analysis study, Chen et al had indicated that the overexpression of PLCE1 was significantly correlated with esophageal squamous cell carcinoma and non-small cell lung cancer (NSCLC),13,19 whereas in the study of Wang et al, PLCE1 can serve as a cancer suppressor gene in colon cancer, which inhibited the proliferation of tumor cells.20 Furthermore, Li et al found that knockdown of PLCE1 can markedly increase the expression of p53 in esophageal cancer cells, indicating that overexpression of PLCE1 may promote the formation and development of tumor cells.21 Otherwise, an animal examination showed that knockdown of PLCE1 generated the resistance of intestinal tumor formation.8 However, there are few explorations about the expression of PLCE1 and its clinical significance in HCC.
In this study, our IHC analysis showed that protein levels of PLCE1 were markedly low in HCC tissues compared with paracarcinomatous tissues, and the negative expression of PLCE1 in HCC tissues was significantly associated with tumor capsulae, AFP, vascular invasion, Edmondson grade, and TNM stage in comparison to the positive expression in HCC samples. Moreover, PLCE1 in 20 paired HCC samples were examined by qRT-PCR and Western blot, and the results were consistent with those in IHC examination. Therefore, our data suggested that low expression of PLCE1 in HCC was unfavorable for clinical outcome and may be a potential valuable prognostic factor.
The regulatory mechanism of PLCE1 in cancer is not clear until now. Bunney et al found that PLCE1 contains several Ras-binding domains for small G-protein of the Ras family and is the downstream of the Ras superfamily guanosine triphosphatases (GTPases), which was responsible for regulating cell growth, differentiation, apoptosis, and angiogenesis.22 Li et al reported that PLCE1 serves cancerogenic function in intestinal carcinogenesis through augmentation of inflammatory signaling pathways and angiogenesis.8 It is reported that PLCE1 may function as a Ras receptor, which plays an important role in promoting apoptosis of tumor cells, thereby serving as a tumor resister.20 On the basis of these findings and our results, we speculated that PLCE1 may function as a suppressor in HCC by altering the motility of some matters in Ras-signaling pathway. However, the concrete mechanism of cancerogenic function by PLCE1 in HCC requires further research.
Present researches have indicated the prognostic significance of PLCE1 in other malignancies. Yu et al reported that PLCE1-positive expression was significantly related to the lower 5-year survival rate in gastric cancer.23 Moreover, Chen et al reported that the low expression of miR-1976 (which can regulate mRNA expression directly by targeting the 3′-untranslated region [UTR] of PLCE1) is correlated with poor clinical prognosis in NSCLC parents.19 In our study, we demonstrated that HCC parents with negative PLCE1 expression had a markedly shorter OS and RFS than those with positive PLCE1 expression by log-rank test. Moreover, using the Cox proportional hazard regression model, we demonstrate PLCE1 as an independent factor for the prognosis of HCC patients who had undergone surgical resection.
In summary, we provided that the first evidence of PLCE1 is downregulated in HCC cells and demonstrated that PLCE1 is related to aggressive clinicopathological features. In addition, we also found that negative expression of PLCE1 is an independent prognostic predictor of poor OS and RFS for HCC parents who had undergone surgical resection. Our results suggest that PLCE1 may be a mark that can predict the outcome and recurrence of HCC parents who receive radical resection. However, further investigations need to explore the exact mechanism of decreased expression of PLCE1 in HCC.
Acknowledgments
This study was supported by National Natural Science Foundation of China (No 81172364) and Anhui Science and Technology Public Relations Projects (No 1301042199).
Disclosure
The authors report no conflicts of interest in this work.
References
Jemal A, Bray F, Center MM, et al. Global cancer statistics. CA Cancer J Clin. 2011;61(2):69–90. | ||
Blechacz B, Mishra L. Hepatocellular carcinoma biology. Recent Results Cancer Res. 2013;190:1–20. | ||
Wang LD, Zhou FY, Li XM, et al. Corrigendum: genome-wide association study of esophageal squamous cell carcinoma in Chinese subjects identifies susceptibility loci at PLCE1 and C20orf54. Nat Genet. 2010;42:759–763. | ||
Abnet CC, Freedman ND, Hu N, et al. A shared susceptibility locus in PLCE1 at 10q23 for gastric adenocarcinoma and esophageal squamous cell carcinoma. Nat Genet. 2010;42(9):764–767. | ||
Wu C, Hu Z, He Z, et al. Genome-wide association study identifies three new susceptibility loci for esophageal squamous-cell carcinoma in Chinese populations. Nat Genet. 2011;43(7):679–684. | ||
Wing MR, Bourdon DM, Harden TK. PLC-epsilon: a shared effector protein in Ras-, Rho-, and G alpha beta gamma-mediated signaling. Mol Interv. 2003;3(5):273–280. | ||
Thatcher JD. The inositol trisphosphate (IP3) signal transduction pathway. Sci Signal. 2010;3(119):tr3. | ||
Li M, Edamatsu H, Kitazawa R, Kitazawa S, Kataoka T. Phospholipase Cepsilon promotes intestinal tumorigenesis of Apc(Min/+) mice through augmentation of inflammation and angiogenesis. Carcinogenesis. 2009;30(8):1424–1432. | ||
Bai Y, Edamatsu H, Maeda S, et al. Crucial role of phospholipase Cepsilon in chemical carcinogen-induced skin tumor development. Cancer Res. 2004;64(24):8808–8810. | ||
Ou L, Guo Y, Luo C, Wu X, Zhao Y, Cai X. RNA interference suppressing PLCE1 gene expression decreases invasive power of human bladder cancer T24 cell line. Cancer Genet Cytogenet. 2010;200(2):110–119. | ||
Wang X, Zbou C, Qiu G, Fan J, Tang H, Peng Z. Screening of new tumor suppressor genes in sporadic colorectal cancer patients. Hepatogastroenterology. 2008;55(88):2039–2044. | ||
Bourguignon LY, Gilad E, Brightman A, Diedrich F, Singleton P. Hyaluronan-CD44 interaction with leukemia associated RhoGEF and epidermal growth factor receptor promotes Rho/Ras co-activation, phospholipase C epsilonCa2+ signaling, and cytoskeleton modification in head and neck squamous cell carcinoma cells. J Biol Chem. 2006;281(20):14026–14040. | ||
Chen YZ, Cui XB, Hu JM, et al. Overexpression of PLCE1 in Kazakh esophagea squamous cell carcinoma: implications in cancer metastasis and aggressiveness. APMIS. 2013;121(10):908–918. | ||
Chen J, Wang W, Zhang T, et al. Differential expression of phospholipase C epsilon 1 is associated with chronic atrophic gastritis and gastric cancer. PLoS One. 2012;7(10):e47563–e47563. | ||
Edge SB, Compton CC. The American Joint Committee on Cancer: the 7th edition of the AJCC cancer staging manual and the future of TNM. Ann Surg Oncol. 2010;17(6):1471–1474. | ||
Wang W, Li GY, Zhu JY, et al. Overexpression of AGGF1 is correlated with angiogenesis and poor prognosis of hepatocellular carcinoma. Med Oncol. 2015;32(4):131. | ||
Shibatohge M, Kariya K, Liao Y, et al. Identification of PLC210, a Caenorhabditis elegans phospholipase C, as a putative effector of Ras. J Biol Chem. 1998;273(11):6218–6222. | ||
Song C, Hu CD, Masago M, et al. Regulation of a novel human phospholipase C, PLCepsilon, through membrane targeting by Ras. J Biol Chem. 2001;276(4):2752–2757. | ||
Chen G, Hu J, Huang Z, Yang L, Chen M. MicroRNA-1976 functions as a tumor suppressor and serves as a prognostic indicator in non-small cell lung cancer by directly targeting PLCE1. Biochem Biophys Res Commun. 2016;473(4):1144–1151. | ||
Wang X, Zhou C, Qiu G, et al. Phospholipase C epsilon plays a suppressive role in incidence of colorectal cancer. Med Oncol. 2011;29(2):1051–1058. | ||
Li Y, An J, Huang S, et al. PLCE1 suppresses p53 expression in esophageal cancer cells. Cancer Invest. 2014;32(6):236–240. | ||
Bunney TD, Baxendale RW, Katan M. Regulatory links between PLC enzymes and Ras superfamily GTPases: signalling via PLCepsilon. Adv Enzyme Regul. 2009;49(1):54–58. | ||
Yu S, Wu F, Guo K, Shao Q, Tao H. Expression of phospholipase C epsilon-1 in gastric cancer and its association with prognosis. Zhonghua wei chang wai ke za zhi. 2014;17(4):378–382. |
 © 2016 The Author(s). This work is published and licensed by Dove Medical Press Limited. The
full terms of this license are available at https://www.dovepress.com/terms
and incorporate the Creative Commons Attribution
- Non Commercial (unported, 3.0) License.
By accessing the work you hereby accept the Terms. Non-commercial uses of the work are permitted
without any further permission from Dove Medical Press Limited, provided the work is properly
attributed. For permission for commercial use of this work, please see paragraphs 4.2 and 5 of our Terms.
© 2016 The Author(s). This work is published and licensed by Dove Medical Press Limited. The
full terms of this license are available at https://www.dovepress.com/terms
and incorporate the Creative Commons Attribution
- Non Commercial (unported, 3.0) License.
By accessing the work you hereby accept the Terms. Non-commercial uses of the work are permitted
without any further permission from Dove Medical Press Limited, provided the work is properly
attributed. For permission for commercial use of this work, please see paragraphs 4.2 and 5 of our Terms.