Back to Journals » Risk Management and Healthcare Policy » Volume 13
Long-Term Projections of Patients Undertaking Renal Replacement Therapy Under the Universal Coverage Scheme in Thailand
Authors Thammatacharee N, Suphanchaimat R ![]()
Received 30 July 2019
Accepted for publication 18 December 2019
Published 16 January 2020 Volume 2020:13 Pages 27—34
DOI https://doi.org/10.2147/RMHP.S225388
Checked for plagiarism Yes
Review by Single anonymous peer review
Peer reviewer comments 2
Editor who approved publication: Professor Marco Carotenuto
Noppakun Thammatacharee, 1, 2 Rapeepong Suphanchaimat 2, 3
1Health Systems Research Institute, Nonthaburi, Thailand; 2International Health Policy Program (IHPP), the Ministry of Public Health, Nonthaburi, Thailand; 3Division of Epidemiology, Department of Disease Control, The Ministry of Public Health, Nonthaburi, Thailand
Correspondence: Noppakun Thammatacharee
Health Systems Research Institute, 4th Floor, National Health Building, 88/39 Tiwanon 14 Road, Taradkwan, Muang District, Nonthaburi 11000, Thailand
Tel +66 2832 9212
Fax +66 2832 9202
Email [email protected]
Introduction: The increasing number of patients with end-stage renal disease and the cost of their treatment may potentially place a large burden on overall healthcare spending and human resources for health. We projected the number of patients with end-stage renal disease to better estimate arrangements needed in the future.
Materials and Methods: We used a dataset containing information about patients who registered with the three modalities of the renal replacement therapy (RRT) program from 2009 to 2017: continuous automated peritoneal dialysis (CAPD), hemodialysis (HD) and kidney transplant (KT). An autoregressive integrated moving average model was used to predict the number of patients who would enroll in the RRT program from 2018 to 2027.
Results: From 2009 to 2017, there was a constant increase in the volume of CAPD patients, although a slight drop in some periods was observed. HD patients outnumbered CAPD patients during the inception period of the program. After mid-2013, the trend in HD patients accelerated to the same pace as CAPD patients. By the end of 2017, the number of patients increased to 20,000 for CAPD and 15,000 for HD. The number of KT patients was extremely small relative to CAPD and HD patients. The program enrolled patients receiving a kidney transplant at a constant rate of approximately 200 per year after 2013. The predicted numbers of patients on RRT corresponded to an annual growth rate of 7.2– 7.4% for CAPD and HD and 4.8% for KT.
Conclusion: Despite the expected increased volume of patients, the year-by-year growth rate of patients in all RRT modalities seemed to diminish over time. This phenomenon is likely explained by the intensive implementation of policies to address risk factors of non-communicable diseases among Universal Coverage Scheme (UCS) beneficiaries.
Keywords: dialysis, kidney transplant, universal health coverage, ARIMA
Introduction
Access to treatment for end-stage renal disease varies greatly across the world. This variation is explained not only due to the rising prevalence of end-stage renal disease globally but also because of widening inequities in access to treatment known as renal replacement therapy (RRT).1–3 It is estimated that, worldwide, only half of those in need receive RRT. Globally, only 7% of people on RRT live in low- and middle-income countries (LMIC), yet 4–12% of people in LMIC need treatment. In these countries, the low percentage of people accessing treatment is a consequence of the high cost of dialysis and transplantation.4
Universal health coverage (UHC) as part of the Sustainable Development Goals (SDG) is one of the contributory factors to health equity in any society.5 The two explicit objectives of UHC are to ensure equitable access to health services and financial risk protection, and are key to protecting the well-being of populations, including through the prevention of and reduction in premature deaths from non-communicable diseases (NCDs).6 Thailand achieved UHC in 2002. The Universal Coverage Scheme (UCS), one of the public insurance arrangements providing coverage to over 47 million Thai citizens (75% of the population), is among the core components of Thai UHC.5,7 The success of the UCS is remarkable. The incidence of catastrophic health expenditures substantially declined compared with the incidence in pre-UHC periods. The achievement in financial risk protection was coupled with a marked reduction in unmet needs and an increase in access to care (both outpatient and inpatient services). The increase in outpatient utilization was greatest among the most economically deprived populations, which is an indicator of societal equity.8
The UCS benefit package is comprehensive, ranging from general outpatient and inpatient care to high-cost care, such as advanced surgery and HIV/AIDS treatment. RRT was initially excluded from the benefit package when the UCS was launched due to fiscal constraints and an unprepared system. This included an inadequate number and distribution of dialysis personnel and facilities. Six years later in 2008, civil society organizations and patient groups pressured the National Health Security Office (NHSO), the payer of health services for the UCS, to expand the benefit package to include RRT.9
The RRT program has achieved its aim to boost healthcare access and provide financial protection for patients. However, the growing numbers of patients suffering from chronic kidney disease and the advancement of treatment and management technologies have added to the financial burden on Thailand’s national health-care budget. The number of patients enrolled in the RRT program and the associated costs have been continuously growing. In 2014, the total cost of the RRT program amounted to 4% of the total UCS budget, yet patients receiving RRT accounted for only 0.07% of the general UCS population.10
RRT requires high investment in health professionals and equipment. Therefore, knowing the estimated numbers of patients in advance is beneficial for human resource and facility planning. At the time of this study, there was no existing literature that systematically estimated the volume of RRT patients in developing countries. To fill this gap, the objective of this study was to estimate the number of UCS beneficiaries enrolling in the Thai RRT program in the future. The term RRT in this case includes continuous ambulatory peritoneal dialysis (CAPD), hemodialysis (HD) and kidney transplantation (KT). It is hoped that the findings from this study will be of help to policymakers, academic researchers and health-care providers involved in the RRT program, either in terms of budget planning or resource preparation.
Methods
Study Design and Data Sources
This study employed a time-series cross-sectional design. Data were obtained from the Disease Management System of the NHSO, which comprises all RRT patients over the entire country. The mean age of the patients was about 52.9 years. The ratio of male to female patients was approximately 1:1.11 The dataset contained information of approximately 56,000 patients who registered with the RRT program between 1 January 2009 and 31 December 2017 (a 9-year time span). Key variables were selected as follows: the encrypted identification number of an individual, modality of treatment (CAPD, HD, and KT), and date of enrolment in and exit from the program.
Study Population
All patients registered with and retained in the dialysis program (CAPD and HD) during the studied period were included. There are a few noteworthy points regarding the population scope. First, patients with acute or temporary dialysis were excluded from the analysis. Second, CAPD and HD patients in this sense meant the number of accumulated patients (new plus old dialysis patients) in a given year. Lastly, unlike the dialysis patients, for this study, KT patients referred to only new patients or patients undergoing a kidney transplant operation within a particular period, whereas those living with transplanted kidneys were excluded. Additionally, KT patients were patients who were fully supported by the NHSO for the overall process until they received the transplant. Those who were partially funded, for example with only for medication costs but not treatment costs, were excluded.
Data Analysis
The analysis was divided into two parts: (1) descriptive statistics; and (2) an autoregressive integrated moving average (ARIMA) model. The ARIMA model, one of the most widely used time-series approaches in health research,12,13 was used to predict the number of patients enrolled in the RRT program from 2018 to 2027. This model predicts future behavior of a variable of interest by taking previous observations into account. This study followed the three main steps of ARIMA modeling: (1) model identification; (2) estimation and testing; and (3) forecasting.14
For “model identification” and “model estimation and testing”, the patient-level data were collapsed into a monthly unit and the analysis unit was changed into patient-months. Then, unit root tests were performed to statistically measure the stationary patterns. Autocorrelation function (ACF) and partial autocorrelation (PACF) plots were used to identify the number of autoregressive (AR) and moving average (MA) terms in each model. The results from the original series (autoregressive moving average [ARMA]) were compared against the differenced series (ARIMA). The Durbin–Watson test was used to detect serial correlation and autocorrelation in the residuals. Akaike’s information criterion (AIC) was applied to check the goodness of fit of the model. The authors also checked cumulative periodograms of all models to assess whether the residuals of the models were aligned with the white noise patterns. Once the final model was obtained, model forecasting was performed. Note that sensitivity analysis was also performed in order to assess the change of the results if the ARIMA structure (AR or MA terms) were changed. Figure 1 depicts the overall flow of the analysis.
 |
Figure 1 Flow of the forecasting model. Abbreviations: ACF, autocorrelation function; PACF, partial autocorrelation function; AIC, Akaike’s information criterion. |
Results
Descriptive Statistics: Overall Patient Profiles
Historical data for CAPD, HD, and KT patients were plotted against time, from the beginning of 2009 to the end of 2017. Although there was a slight drop in the number of CAPD patients in some periods, a constant increase in the volume of CAPD patients was observed. HD patients outnumbered CAPD patients during the inception period of the program (around 2009–2011), with a relatively slow-rising trend. After mid-2013, the trend of HD patients accelerated at the same pace as that of CAPD patients. By the end of 2017, the numbers of these patients increased to 20,000 for CAPD and 15,000 for HD (Figure 2A). By contrast, the volume of KT patients was extremely small compared with PD and HD patients. A fluctuating trend was noticed, although in general, the number of KT patients rose. At the end of 2017, approximately 25 patients successfully underwent kidney transplantation (Figure 2B).
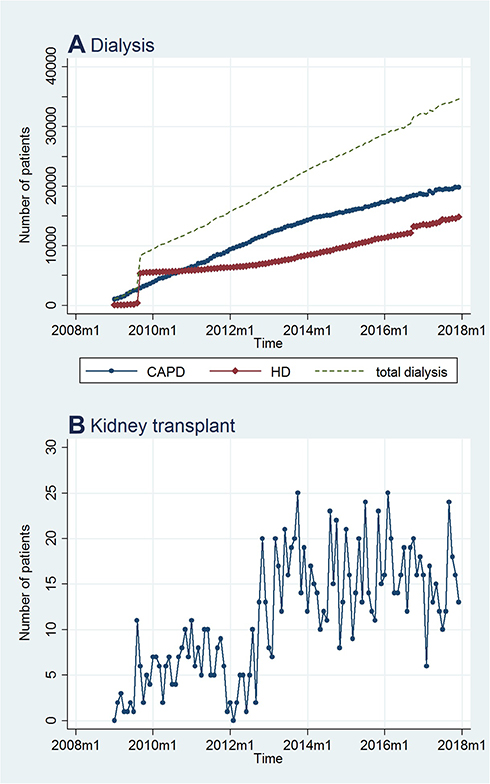 |
Figure 2 Historical plots of patients by RRT modality over time: (A) dialysis; (B) kidney transplant. Abbreviations: CAPD, continuous ambulatory peritoneal dialysis; HD, hemodialysis; KT, kidney transplant. |
Model Identification
In CAPD and KT, ACF plots of the original series decayed very slowly (Figure 3A and I), and the ACF of the differenced series (Figure 3C and K) showed a cut-off at lag 1. PACF plots of both original and differenced series were infinite and dominated by dampened sine waves (Figure 3B, D, J and L). All these features indicated the moving average model with differenced series, the so-called ARIMA model (0,1,1). In HD, the ACF of the original series decayed to zero, while the PACF showed a significant spike at lag 1 then a cut-off (Figure 3E and F). Both ACF and PACF of the differenced series showed nonsignificant lags, as there were no lag spikes out of the 95% confidence bands (Figure 3G and H). This observation indicated that one AR term or one differencing might be necessary. After testing, the model with one differencing returned the best statistical values and was selected for HD forecasting, resulting in the final model being ARIMA (0,1,0).
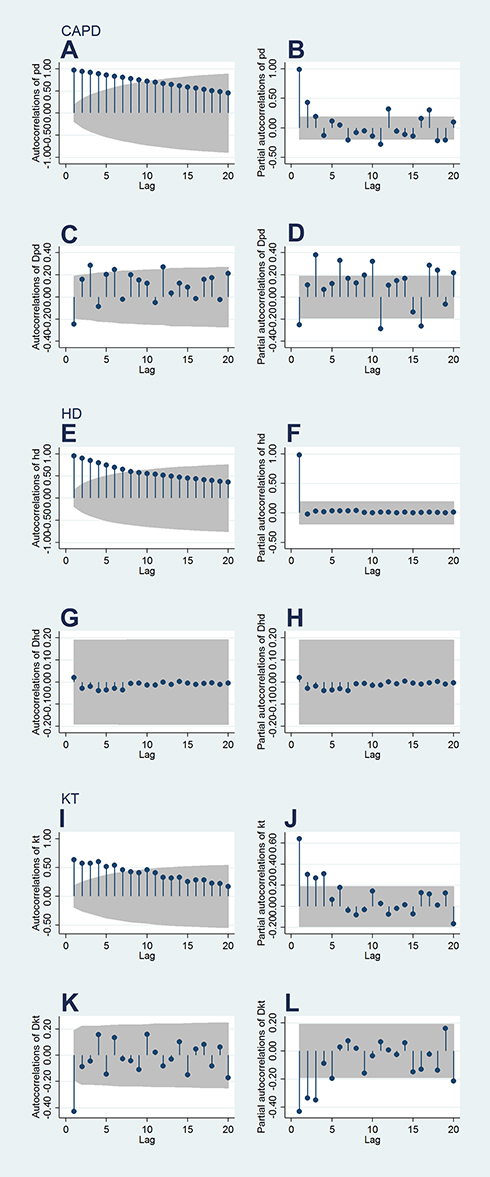 |
Figure 3 Autocorrelation and partial autocorrelation plots of CAPD (A–D), HD (E–H) and KT (I–L). Note: Shaded areas represent 95% confidence bands.Abbreviations: pd, continuous automated peritoneal dialysis; Dpd, differenced series of continuous automated peritoneal dialysis; hd, hemodialysis; Dhd, differenced series of hemodialysis; kt, kidney transplant; Dkt, differenced series of kidney transplant. |
Estimation
PD Model and KT Model: ARIMA (0,1,1)
The equation is Ŷt = μ + Yt-1 – θ1et-1, where Ŷ denotes the forecast value at time t, μ is a constant (PD model =175.58 and KT model=0.13), and θ is the moving average parameter (PD model = −0.17 and KT model= −0.75). The term et-1 is the error term at time t-1.
Hemodialysis: ARIMA (0,1,0)
The equation is Ŷt = μ + φYt-1, where Ŷt represents the expected number of patients at time t. The term μ is a constant (137.85), and φ denotes the autoregressive coefficient.
Forecasting
With the models above (ARIMA (0,1,1) for PD and KT and ARIMA (0,1,0) for HD), forecasting Figures 4 and 5 represent the actual historical and predicted numbers of RRT patients according to the selected models. The forecast values for all RRT modalities at the end of each year from 2018 to 2027 are given in Table 1. In 2027, the quantity of CAPD patients is predicted to be as large as approximately 40,000, and HD patients are predicted to number approximately 31,000. In addition, approximately 40 patients are predicted to undergo KT each year. Overall, however, the growth rate for CAPD, HD, and KT is predicted to decrease. The CAPD and HD growth rate is predicted to fall from approximately 10.6–11.9% to 5.4–5.5% from 2018 to 2027. For KT, the growth rate in 2027 is predicted to be approximately 2.5%. The annual growth rate for CAPD, HD, and KT over the following decade is predicted to be approximately 7.2%, 7.4%, and 4.8%, respectively.
 |
Figure 4 Actual and predicted number of CAPD (A) and HD (B) patients. Abbreviations: RRT, renal replacement therapy; CAPD, continuous ambulatory peritoneal dialysis; HD, hemodialysis. |
 |
Figure 5 Actual and predicted number of KT patients. Abbreviations: RRT, renal replacement therapy; KT, kidney transplant. |
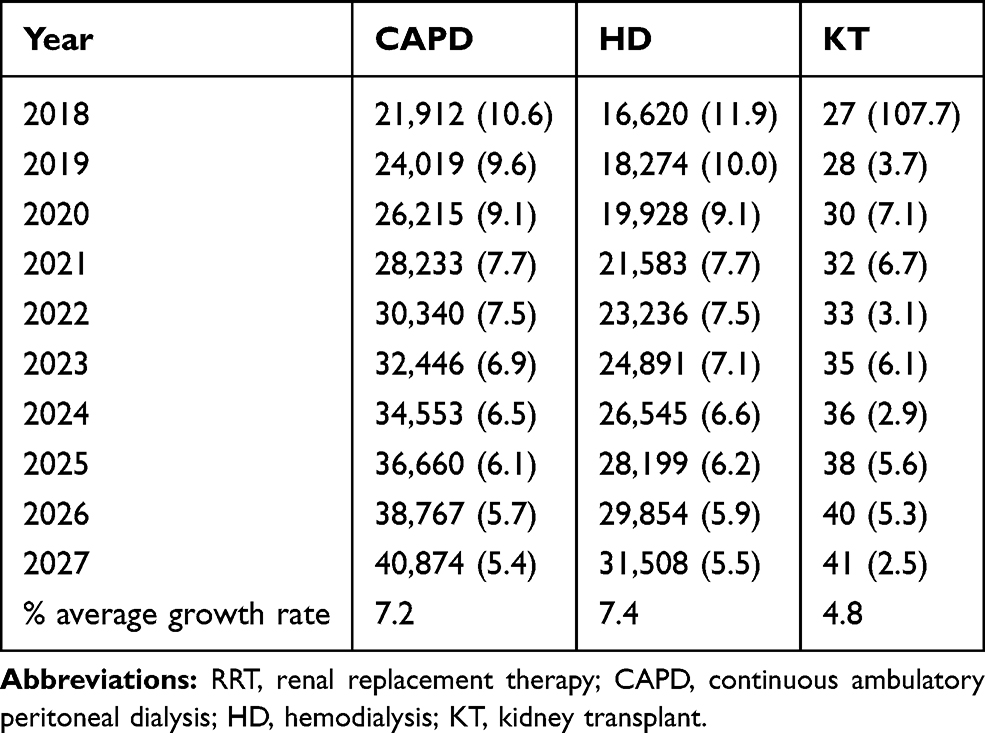 |
Table 1 Forecasted Total Number of Patients by RRT Modality from 2018 to 2027 and the Percentage Growth Rates (in Parenthesis) |
Sensitivity Analysis
ARIMA models of CAPD, HD, and KT were varied to demonstrate how the number of MA term or differencing affected the number of predicted patients. We found just slight differences in the CAPD and HD models (0.10% and 0.01%, respectively). This indirectly suggested that the findings from the main analysis were robust. However, a much larger difference in the KT model (36%). The predicted number of patients in various models of CAPD, HD, and KT is shown in the supplementary file.
Discussion
Overall, this study predicted that the number of dialysis patients and new KT patients would gradually increase at an annual rate of approximately 7.3% and 4.8%, respectively, over the next ten-year period. However, the future growth rate showed a decelerating trend relative to the status quo. Findings in international literature that focus on hemodialysis were quite similar. For instance, a study in the Aboriginal population in the northern part of Australia suggested that the number of HD patients would grow at a decreasing rate, with an average annual growth rate of approximately 12% (projected between 2001 and 2004). In countries where RRT has long been included in the national insurance benefit package, the growth in the prevalence of RRT patients is much smaller than the growth identified in this study. An obvious case is the study by Quin et al in Ontario, which predicted that the annual growth rate would be approximately 5.5% (projected between 2005 and 2011).15 Gilbertson et al from the US also presented quite similar findings of 3.8% annual growth rate based on a projection between 2010 and 2015.16
The above findings can be viewed as a positive sign for the UCS in Thailand; the volume of RRT patients may not be growing too quickly and the future public health-care expenses of RRT may not be too severe. An explanation of this positive outlook is that the NHSO has implemented a number of effective disease prevention and health screening programs to cope with NCD risk factors for a long time. This will likely lead to a reduction in new end-stage renal disease (ESRD) patients.10 A national survey in 2008 by Ingsathit et al found that age, diabetes, hypertension, and hyperuricemia were strongly associated with chronic kidney disease.17 Previous findings showed that early recognition of proteinuria and strict control of blood sugar and blood pressure were effective strategies to slowdown the progression of ESRD.18 Some concrete examples of NHSO initiatives to tackle NCD and ESRD risk factors include a massive screening program for diabetes and hypertension that was provided to all Thai adults aged over 30 years and a proteinuria screening program for diabetes patients that has been implemented in recent years. A fee schedule is also used as a financing mechanism to boost the implementation of these programs, and the number of patients receiving care from these initiatives is now set as an indicator to measure facility performance.10
There are some limitations in this study. First, like all prediction models, the forecast was based on previous values, and the longer the time horizon, the less accurate the model is.19 However, the real-world healthcare system is extremely dynamic and greatly influenced by both supply and demand. For instance, on the supply side, the recent change in reimbursement policy for erythropoietin in HD patients might result in a marked increase in the number of HD patients relative to the growth in PD patients. On the demand side, the rapid growth in unhealthy food and beverage businesses and advertisements in Thailand might lead to a growing incidence of new NCD cases.20 This observation is supported by the sharp growth in soft drink sales in Thailand, from 2.7 billion liters in 2010 to 3.4 billion liters in 2015.21 The national health exam survey in 2018 also flagged the increasing prevalence of diabetes and hypertension in the Thai population. These factors likely affect the precision of the model. This issue also points to a future research priority. A more comprehensive model that takes into account all relevant factors should be further explored.
Second, the dataset encompassed only UCS patients that are able to access RRT. Thailand’s UHC has been operated by the main three insurance schemes. The UCS covers approximately three-quarters of the Thai population, while the Social Security Scheme (SSS) and the Civil Servant Benefit Scheme (CSMBS) cover the rest of the population.5 In other words, RRT patients in the SSS and the CSMBS have not been investigated. Even when focusing only on UCS, some patients were not able to access RRT due to certain reasons (such as lack of family support to take of care of them or fear of RRT) and were not covered in this study. Therefore, generalizing the findings of this study to the population at risk should be done with caution, not to mention generalizing the findings to whole of the Thai population.
Third, this study performed only univariate analysis of the RRT forecasting model. In reality, the volume of predicted RRT patients will likely depend on many factors; for instance the socio-economic status and underlying diseases of the patients (demand-side factor), and geographical distribution of the facilities that can provide RRT (supply-side factor), which are not routinely collected in the RRT registry. In addition, the long-term forecasted value is likely to be imprecise given changes in government policies (such as the policy to encourage organ donation). These points can be viewed as a sensitivity analysis additional to the present study and warrant further data collection and re-orientation of the study design. Last but not least, this study did not touch on the qualitative aspects of the RRT programs such as patient satisfaction and quality of care. Future investigation on these topics is recommended.
Conclusion
This study predicted that in 2027 the cumulative number of patients with CAPD and HD will be greater than 40,000 and 30,000, respectively, while the number of new KT cases will be approximately 40 cases per year. This finding corresponds to the annual growth rate of 7.2–7.4% for CAPD and HD and 4.8% for KT. Despite the expected increasing volume, the year-by-year growth rate seemed to diminish over time for all RRT modalities. This phenomenon can be explained by the intensive implementation of various policies to address NCD risk factors among UCS beneficiaries. Future research that applies prediction models that are able to capture a wider range of health system determinants is recommended.
Ethics Approval
This study obtained ethics approval from the Institute for the Development of Human Research Protections (IHRP) of Thailand; approval date 25 February 2015.
Acknowledgments
The authors thank the NHSO in particular for providing data on the RRT patients. Advice from Prof Supon Limwattananon and Prof Anne Mills is immensely appreciated.
Author Contributions
Both authors contributed to the study concept and design, methodology, data interpretation, data analysis, drafting and revising the article (including the final draft), gave final approval of the version to be published, and agree to be accountable for all aspects of the work. NT had full access to all of the data in the study and took responsibility for the accuracy of the data analysis.
Disclosure
The authors declare no conflicts of interest.
References
1. Coresh J, Jafar T. Disparities in worldwide treatment of kidney failure. Lancet. 2015;385(9981):1926–1928. doi:10.1016/S0140-6736(14)61890-0
2. Grassmann A, Gioberge S, Moeller S, et al. ESRD patients in 2004: global overview of patient numbers, treatment modalities and associated trends. Nephrol Dial Transplant. 2005;20(12):2587–2593. doi:10.1093/ndt/gfi159
3. Liyanage T, Ninomiya T, Jha V, et al. Worldwide access to treatment for end-stage kidney disease: a systematic review. Lancet. 2015;385(9981):1975–1982. doi:10.1016/S0140-6736(14)61601-9
4. Jha V. Current status of end-stage renal disease care in India and Pakistan. Kidney Int Suppl. 2013;3:157–160. doi:10.1038/kisup.2013.3
5. Tangcharoensathien V, Mills A, Palu T. Accelerating health equity: the key role of universal health coverage in the sustainable development goals. BMC Med. 2015;13:101. doi:10.1186/s12916-015-0342-3
6. World Health Organization. The world health report: health systems financing: the path to universal coverage; 2010. Available from: http://whqlibdoc.who.int/whr/2010/9789241564021_eng.pdf?ua=1.
7. Evans TG, Chowdhury AMR, Evans DB, et al. Thailand’s Universal Coverage Scheme: Achievements and Challenges. An Independent Assessment of the First 10 Years (2001–2010). Nonthaburi, Thailand: Health Insurance System Research Office; 2012:120.
8. Limwattananon S, Prakongsai P, Tangcharoensathien V. The Equity Impact of Universal Coverage: Health Care Finance, Catastrophic Health Expenditure, Utilization and Government Subsidies in Thailand, in Consortium for Research on Equity in Health Systems (CREHS) Report. Nonthaburi, Thailand: International Health Policy Program; 2011.
9. Dhanakijcharoen P, Sirivongs D, Aruyapitipan S, et al. The “PD first” policy in Thailand: three-years experiences (2008–2011). J Med Assoc Thai. 2011;94(Suppl 4):S153–61.
10. National Health Security Office. NHSO Annual Report. Bangkok: NHSO; 2017.
11. The Nephrology Society of Thailand. Thailand Renal Replacement Therapy Report. Chuasuwan A, Praditpornsilpa K, editors. Bangkok: Nephrology Society of Thailand; 2014.
12. Linden A, Adams JL, Roberts N. Evaluating disease management program effectiveness: an introduction to time-series analysis. Dis Manag. 2003;6(4):243–255. doi:10.1089/109350703322682559
13. Li Q, Gao NN, Han ZY, et al. Application of an autoregressive integrated moving average model for predicting the incidence of hemorrhagic fever with renal syndrome. Am J Trop Med Hyg. 2012;87(2):364–370. doi:10.4269/ajtmh.2012.11-0472
14. Makridakis, S, Wheelwright, SC, Hyndman, RJ. Forecasting: Methods and Applications,
15. Quinn RR, Laupacis A, Hux JE, et al. Forecasting the need for dialysis services in ontario, Canada to 2011. Health Policy. 2009;4(4):e151–e161.
16. Gilbertson DT, Liu J, Xue JL, et al. Projecting the number of patients with end-stage renal disease in the United States to the year 2015. J Am Soc Nephrol. 2005;16(12):3736–3741. doi:10.1681/ASN.2005010112
17. Ingsathit A, Thakkinstian A, Chaiprasert A, et al. Prevalence and risk factors of chronic kidney disease in the Thai adult population: Thai SEEK study. Nephrol Dial Transplant. 2010;25(5):1567–1575. doi:10.1093/ndt/gfp669
18. James MT, Hemmelgarn BR, Tonelli M. Early recognition and prevention of chronic kidney disease. Lancet. 2010;375(9722):1296–1309. doi:10.1016/S0140-6736(09)62004-3
19. Soyiri IN, Reidpath DD. Evolving forecasting classifications and applications in health forecasting. Int J Gen Med. 2012;5:381–389. doi:10.2147/IJGM.S31079
20. Jaichuen N, Vandevijvere S, Kelly B, et al. Unhealthy food and non-alcoholic beverage advertising on children’s, youth and family free-to-air and digital television programmes in Thailand. BMC Public Health. 2018;18(1):737. doi:10.1186/s12889-018-5675-3
21. Cetthakrikul N, Jaichuen N, Pulkerd S, et al. Assessment of the stated policies of prominent food companies related to obesity and non-communicable disease (NCD) prevention in Thailand. Global Health. 2019;15(1):12. doi:10.1186/s12992-019-0458-x
 © 2020 The Author(s). This work is published and licensed by Dove Medical Press Limited. The
full terms of this license are available at https://www.dovepress.com/terms
and incorporate the Creative Commons Attribution
- Non Commercial (unported, 3.0) License.
By accessing the work you hereby accept the Terms. Non-commercial uses of the work are permitted
without any further permission from Dove Medical Press Limited, provided the work is properly
attributed. For permission for commercial use of this work, please see paragraphs 4.2 and 5 of our Terms.
© 2020 The Author(s). This work is published and licensed by Dove Medical Press Limited. The
full terms of this license are available at https://www.dovepress.com/terms
and incorporate the Creative Commons Attribution
- Non Commercial (unported, 3.0) License.
By accessing the work you hereby accept the Terms. Non-commercial uses of the work are permitted
without any further permission from Dove Medical Press Limited, provided the work is properly
attributed. For permission for commercial use of this work, please see paragraphs 4.2 and 5 of our Terms.