Back to Journals » Journal of Inflammation Research » Volume 15
Long-Term Exposure to Sulfur Dioxide Before Sensitization Decreased the Production of Specific IgE in HDM-Sensitized Allergic Rhinitis Mice
Authors Ye M, Liu H, Li H ![]() , Liu Q, Zhou Z, Wang T, Tan G
, Liu Q, Zhou Z, Wang T, Tan G
Received 4 January 2022
Accepted for publication 12 April 2022
Published 18 April 2022 Volume 2022:15 Pages 2477—2490
DOI https://doi.org/10.2147/JIR.S352397
Checked for plagiarism Yes
Review by Single anonymous peer review
Peer reviewer comments 3
Editor who approved publication: Professor Ning Quan
Maoyu Ye,1 Honghui Liu,1 Honglei Li,2 Qian Liu,1 Zheng Zhou,1 Tiansheng Wang,1 Guolin Tan1
1Department of Otolaryngology-Head Neck Surgery, Third Xiangya Hospital, Central South University, Changsha, People’s Republic of China; 2Department of Otolaryngology-Head Neck Surgery, People’s Hospital of Deyang City, Deyang, People’s Republic of China
Correspondence: Guolin Tan; Honghui Liu, Department of Otolaryngology - Head and Neck Surgery, Third Xiangya Hospital, Central South University, Changsha, People’s Republic of China, Email [email protected]; [email protected]
Background: Exposure to atmospheric pollutants is closely associated with the occurrence of allergic rhinitis (AR). However, the role of sulfur dioxide (SO2) in promoting allergic inflammation in AR is poorly understood. Our study aims to investigate the effect of SO2 on allergic inflammation in house dust mite (HDM)-sensitized mice.
Methods: Thirty mice were randomly divided into five groups: the control, AR model, AR model exposed to SO2, AR model with long-term SO2 exposure, and SO2-treated control groups. Nasal symptom score was recorded. The serum HDM specific IgE (sIgE) was measured by enzyme-linked immunosorbent assay. Expression of Th1/Th2/Th17 cytokines in nasal mucosa was detected by immunohistochemistry and quantitative PCR. Expression of a low-affinity sIgE receptor (CD23) on B lymphocytes in nasal mucosa was assessed by immunofluorescence.
Results: SO2 increased not only nasal symptom score but also the number of infiltrating eosinophils and expression of Th1/Th2/Th17 cytokines in nasal mucosa of HDM-sensitized AR mice. Furthermore, SO2 increased the serum sIgE level in AR mice. However, long-term SO2 exposure decreased the serum sIgE level in AR mice. Moreover, long-term SO2 exposure decreased CD23+ B lymphocytes in the nasal mucosa.
Conclusion: SO2 exposure aggravated nasal symptom, serum sIgE level, eosinophil infiltration, and Th1/Th2/Th17 inflammation in AR mice. However, the serum sIgE level could be lowered by long-term SO2 exposure. This inhibitory effect of SO2 on IgE production may be suppressed by CD23+ B lymphocytes.
Keywords: allergic rhinitis, air pollution, sulfur dioxide, inflammation
Introduction
Chronic rhinitis is defined as inflammation of the nasal mucosa and characterized by the presence of two or more of the following specific symptoms for at least twelve weeks: nasal obstruction, rhinorrhea, sneezing and nasal itching. It is a very common disease with an increasing incidence, especially in developed countries, and affects 20–40% of the population worldwide.1,2
According to the Allergic Rhinitis and its Impact on Asthma (ARIA) guidelines, chronic rhinitis can be classified as allergic rhinitis (AR) and nonallergic rhinitis (NAR) based on the history of clinical symptoms, skin prick test (SPT) results, and serum allergen-specific immunoglobulin E (sIgE) levels.3 AR is a chronic inflammatory condition of the nasal mucosa characterized by an amplified T helper (Th) 2 response and eosinophil inflammation resulting from IgE sensitization to allergens. Sensitized individuals have positive SPT results and serum sIgE level. In contrast, NAR is a highly heterogeneous group of disorders with the same symptoms as AR but with negative SPT results and undetectable serum sIgE. Due to a lack of solid diagnostic criteria for NAR, it may be more reasonable to call it “allergic-like rhinitis”. Although there have been studies on the pathophysiology underlying the local production of sIgE in rhinitis,4 the pathogenesis remains unclear.
Increasing evidence shows that air pollution is positively associated with the occurrence of allergic respiratory diseases. Exposure to traffic-related air pollutants during pregnancy or the first year of life is highly related to the risk of AR in children.4 Inhalation of PM2.5 induces eosinophilic inflammation in nasal mucosa of healthy mice, and the oxidative stress response triggered by pollutants aggravates nasal inflammation.5,6 SO2, a chemical component of air pollution, exacerbates acute respiratory symptom in asthmatic children.7 The prevalence of AR and asthma is significantly increased in children who were exposed to SO2 for a long period of time.8 Recently, most studies have focused on lower respiratory disease, such as asthma. However, the effect of SO2 on upper respiratory diseases, especially AR, remains unclear. The effect of SO2 on sIgE production in AR is unknown.
In this study, the AR mouse model treated with long-term SO2 exposure was developed. The effect of SO2 on nasal symptom, IgE production, eosinophil infiltration, and Th1/Th2/Th17 inflammatory response in AR mice was evaluated. Furthermore, the underlying mechanism of SO2 on IgE production was investigated. This study may provide direct evidence of SO2 on immune regulation in AR.
Methods
Experimental Animals
Thirty six-week-old healthy female C57 mice (20.36 ± 1.34 g), free of murine-specific pathogens, were used in this study. The mice were housed in a controlled environment with a 12-hour light-and-dark cycle, and given free access to food and water in the Experimental Animal Center of Central South University. All experimental animals used in this study were handled according to a protocol approved by the institutional animal care and use committee of Central South University (Ethic no. 2018sydw0113, Date 2018/4/20). The study was carried out in compliance with the ARRIVE guidelines (https://arriveguidelines.org).
Reagents
HDMs were purchased from Greerlabs (Lenoir, NC, USA). SO2 was provided by Saizhong Special Gas (Changsha, China). HDM-specific IgE enzyme-linked immunosorbent assay kit was purchased from Chondrex (Woodinville, USA). The anti-IL-5 antibody was purchased from Thermo Fisher Scientific (MA, USA), and the anti-IL-13 antibody was purchased from Abcam (Cambridge, UK). The RNeasy RNA extraction kit was purchased from Qiagen (Hilden, Germany). TRIzol was purchased from Thermo Fisher Scientific (MA, USA). The reverse transcription kit and SYBR Green-based qPCR kit was purchased from NovoProtein (NJ, USA). The anti-CD23 antibody, mouse anti-CD19 antibody, anti-IL-4 antibody, anti-IL-2 antibody and anti-IFN-γ antibody were purchased from Bioss (Beijing, China).
Establishment of AR Model and Protocol for SO2 Exposure
An AR mouse model was established as described previously,9 but with some modifications. As shown in Figure 1, thirty mice were randomly divided into 5 groups: (1) the normal saline (NS) control group, which was challenged with NS; (2) the AR group that was sensitized with HDM; (3) the AR-SO2-day15 group that was exposed to SO2 and challenged with HDM simultaneously beginning on day 15; (4) the AR-SO2-day1 group, with long-term SO2 exposure, that was exposed to SO2 before HDM challenge beginning on day 1; and (5) the SO2-treated control group, which was challenged with NS and exposed to SO2 before HDM challenge beginning on day 1. Details are described as follows. (1) NS control group: mice were treated with an equal volume of NS instead of HDMs. (2) AR group: mice were sensitized by intranasal administration of 1 μg HDM extract in 40 μL NS on day 15 (stage 2). Then, the mice were challenged intranasally challenged with 10 μg HDM extract in 40 μL NS once daily on days 22–26 (stage 3) and every two days on days 27–40 (stage 4). Finally, the mice were intranasally rechallenged with 10 μg HDM extract once daily on days 41–45 (stage 5). (3) AR-SO2-day15 group: models were established in two steps. First, AR was induced as described above. Then, the AR model mice were exposed to 120–150 mg/m3 SO2 three hours per day after topical challenge by dynamic fumigation technique for each exposure. (4) AR-SO2-day1 group: mice were exposed to SO2 for three hours per day on days 1–14 (stage 1) before AR induction and then treated the same way as mice in the AR-SO2-day15 group. (5) SO2-treated control group: HDMs were substituted with an equal volume of NS and then treated the same way as the AR-SO2-day1 group.
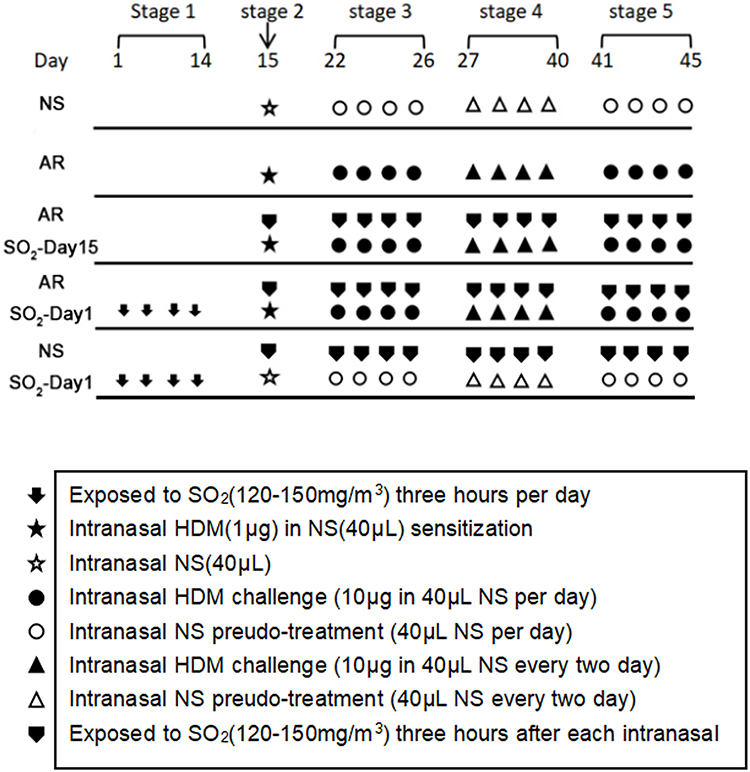 |
Figure 1 The experimental protocol for HDM sensitization and SO2 exposure. Mice in the AR group, AR-SO2-day15 group and AR-SO2-day1 group were intranasally sensitized with HDM challenge. In addition, SO2 exposure was initiated beginning on day 15 and day 1 in the AR-SO2-day15 group and AR-SO2-day1 group, respectively. The NS control group and SO2-treated control group were challenged with normal saline instead of HDM, while the SO2-treated control group was also exposed to SO2 beginning on day 1. |
Protocol for SO2 exposure. SO2 gas (purity 99.99%) was injected into the poisoning box by high-pressure liquefaction and mixed with fresh air at the entrance of the box to obtain different concentrations of SO2 gas. An electric fan was placed on the top of the box to render the concentration in the box uniform. The gas in the tank was collected from a hole in order to monitor the concentration of the gas; the concentration was measured in real time with a portable SO2 detection instrument and maintained at the desired concentration by adjusting the SO2 gas flow rate. During the period of exposure, the mice did not eat or drink water. Twenty-four hours after the final intranasal HDM challenge, all mice were sacrificed. Symptom scores were performed before sacrifice. Nasal mucosa tissue samples were collected within a few minutes after sacrifice for further investigation.
Evaluation of Allergic Symptoms
Allergic symptoms, such as sneezing and nasal itching, were observed and measured within 10 minutes after the last challenge with HDM. Symptom score was calculated as described previously.10 Briefly, sneezing and nasal itching were graded from one to three based on the degree of severity. For sneezing, a score of 1 indicated fewer than 3 sneezes within 10 minutes after the last HDM challenge, a score of 2 indicated 4–10 sneezes within 10 minutes after the last HDM challenge, and a score of 3 indicated more than 11 sneezes within 10 minutes after the last HDM challenge. For nasal itching, a score of 1 indicated slight occasional scratching within 10 minutes after the last challenge, a score of 3 indicated severe and persistent scratching within 10 minutes after the last challenge, and a score of 2 indicated itching between these frequencies. Because rhinorrhea was not obvious in our study, the symptom score was calculated as the cumulative sneezing and nasal itching scores, without the addition of the rhinorrhea score. AR was considered to have been successfully established in mice with a symptom score higher than 5.
Enzyme-Linked Immunosorbent Assay (ELISA)
Blood samples were collected from mice by cardiac puncture 24 hours after the last HDM challenge. After centrifugation for 15 minutes at 1000g, the serum in the supernatants was obtained and stored at −80°C. Total IgE (tIgE) and HDM-specific IgE (sIgE) levels in the serum samples were measured by commercial ELISA kits according to the manufacturer’s instructions. The absorbance at 450 nm was measured with the EnVision Multilabel Plate Readers (PerkinElmer, USA).
Hematoxylin and Eosin (HE) Staining
Nasal tissues were fixed and decalcified with 10% neutral formalin. Coronal nasal sections (5 μm) were stained with HE. Two independent observers counted the number of eosinophils in lamina propria at magnification (400 ×) and analyzed five random fields.
Immunohistochemistry (IHC)
Paraffin sections were dewaxed and hydrated. Then 0.3% H2O2 methanol was used to inactivate the endogenous peroxidase. Sections were stained with rabbit anti-mouse IL-2 (1:100), IL-4 (1:100), IL-5 (1:100), IL-13 (1:150) and IFN-γ (1:100) primary antibodies. Because the expression of these cytokines is usually low in nasal mucosa, we used the highest concentrations of the antibodies recommended in the instruction and incubated the sections with the primary antibodies at 4°C for 24 hours. Subsequently, the sections were washed with PBS and incubated with biotin-labeled goat anti-rabbit IgG as the secondary antibody for 30 min. Color development was achieved with diaminobenzene. Positive cells were stained brown. Sections were counterstained with hematoxylin and mounted. Two independent observers counted the number of brown-stained cells in five random fields of the lamina propria at a magnification of 400 ×.
Quantitative PCR
Total RNA was extracted from nasal mucosa tissues with the RNeasy RNA extraction kit. Then, cDNA was synthesized using a reverse transcription kit. PCR of IL-2, IFN-γ, IL-17A, RORγt and JAK2 was performed using a SYBR Green-based qPCR kit and a Roche LightCycler 480 II system (Roche, Basel, Switzerland). The mRNA levels of the target genes were normalized to the housekeeping gene β-actin and were calculated with the 2−ΔΔCt method. All primers were synthesized by Sangon Biotech Co., Ltd. (Shanghai, China). The sequences of the primers are listed as follows:
forward primer for β-actin 5’-CTACCTCATGAAGATCCTGACC-3’, reverse primer for β-actin 5’-CACAGCTTCTCTTTGATGTCAC-3’;
forward primer for IL-2 5’-TGAGCAGGATGGAGAATTACAG-3’, reverse primer for IL-2 5’-CAGAGGTCCAAGTTCATCTTCT-3’;
forward primer for IFN-γ 5’-CTTGAAAGACAATCAGGCCAT-3’, reverse primer for IFN-γ 5’-CTTGGCAATACTCATGAATGCA-3’
forward primer for IL-17A 5’-GAGCTTCATCTGTGTCTCTGAT-3’, reverse primer for IL-17A 5’-GCCAAGGGAGTTAAAGACTTTG-3’
forward primer for RORγt 5’-ACAAATTGAAGTGATCCCTTGC-3’, reverse primer for RORγt 5’-GGAGTAGGCCACATTACACTG-3’
forward primer for JAK2 5’-ACATTCTTACCAAAGTGCGTTC-3’, reverse primer for JAK2 5’-GCTGAATGAATCTGCGAAATCT-3’.
Immunofluorescence (IF)
To observe the expression level of the receptor CD23 (FcεRII) on the B cell membrane, double IF staining of CD19 and CD23 in the nasal mucosa of mice was carried out as previously described.11 Briefly, the nasal mucosa slices were dehydrated and dewaxed followed by treatment with 3% hydrogen peroxide for 20 min at room temperature to quench the endogenous peroxidase activity. Then the tissues were incubated with anti-CD19 (1:150) and anti-CD23 (1:150) antibodies overnight at 4°C. Subsequently, the tissues were incubated with fluorescent secondary antibodies in dark for 1 hour. The nuclei was counterstained with 4′-6-diamidino-2-phenylindole (DAPI). Finally, the stained sections were detected using a fluorescence microscope (Olympus, Japan). CD19, a specific marker of B lymphocytes, was mainly distributed on cell membranes and was visualized as green fluorescence (FITC). CD23 (FcεRII) was mainly present on the apical surfaces and basement membranes of B cells as well as in the cytoplasm and was visualized as red fluorescence (PE). Double-positive cells were yellow, which indicated changes in CD23 receptor expression on B cells. Sections were counterstained with hematoxylin and mounted. Two independent observers counted the number of double-positive cells in lamina propria at magnification (400 ×) and analyzed five random fields. The percentage of double-positively cells was calculated.
Statistical Analysis
All the results are expressed as mean ± standard error of mean (SEM). GraphPad Prism 8 (La Jolla, USA) was used for data analysis. One-way ANOVA with Dunn’s post test was used for comparison among multiple groups. p < 0.05 was considered statistically significant.
Results
Effect of SO2 Exposure on Nasal Symptom
To investigate the role of SO2 in AR, we first developed a HDM-sensitized AR mouse model exposed to SO2 starting on two different days, namely, day 15 and day 1 respectively. The experimental protocol is described in Figure 1. Then, nasal symptom score was recorded. As shown in Figure 2, compared with the NS control group, the nasal symptom score was significantly increased in the other four groups, including the SO2-treated control, AR, AR-SO2-day15 and AR-SO2-day1 groups. Furthermore, the AR, AR-SO2-day15 and AR-SO2-day1 groups, had higher nasal symptom score than the SO2-treated control group. However, there was no significant difference among AR, AR-SO2-day15 and AR-SO2-day1 groups. This finding suggested that SO2 exposure aggravated nasal symptom in AR mice.
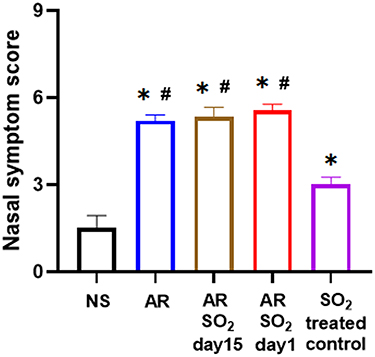 |
Figure 2 SO2 exposure aggravated nasal symptoms in AR mice. *p < 0.05 vs the NS group. #p < 0.05 vs the SO2-treated control group. Abbreviations: SO2, sulfur dioxide; HDM, house dust mite; NS, normal saline; AR, allergic rhinitis. |
Effect of SO2 Exposure on tIgE and sIgE Levels in Serum
To further investigate the aggravated effect of SO2 exposure on HDM-sensitized AR mice, we tested both total IgE (tIgE) and HDM-specific IgE (sIgE) production in serum. As shown in Figure 3A, compared with the NS control group, the tIgE level was significantly increased in the AR group and decreased in the SO2-treated control group. The AR, AR-SO2-day15 and AR-SO2-day1 groups had higher tIgE level than the SO2-treated control group. However, the serum tIgE level did not significantly differ among AR, AR-SO2-day15 and AR-SO2-day1 groups. Interestingly, the serum sIgE level were significantly increased in the AR, AR-SO2-day15 and AR-SO2-day1 groups compared with the NS and SO2-treated control groups (Figure 3B). In addition, the sIgE level was significantly higher in the AR-SO2-day15 group and lower in the AR-SO2-day1 group than in the AR group. These findings demonstrated that sIgE production in HDM-sensitized AR mice was increased upon simultaneous SO2 exposure and HDM challenge but decreased upon long-term exposure to SO2 before HDM challenge.
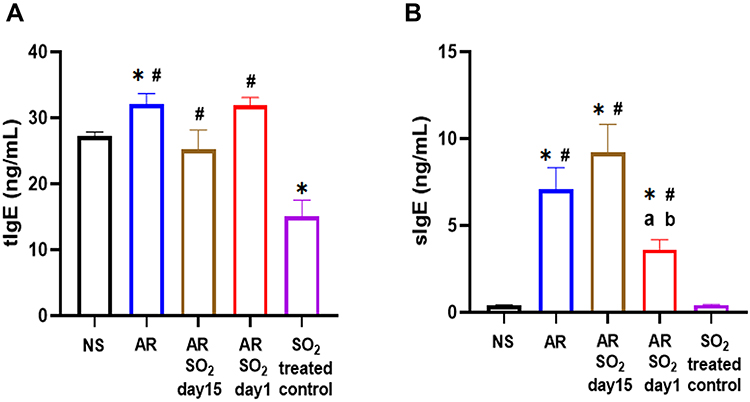 |
Figure 3 The level of tIgE and sIgE in serum. Concentration of (A) tIgE and (B) sIgE levels in the serum detected by ELISA. The AR group was sensitized with HDM challenge. The AR-SO2-day15 group and AR-SO2-day1 group included HDM sensitized mice exposed to SO2 beginning on day 15 and day 1, respectively. The NS group was challenged with normal saline instead of HDM. The SO2-treated control group was challenged with normal saline and exposed to SO2 beginning on day 1. *p < 0.05 vs the NS group. #p < 0.05 vs the SO2-treated control group. ap < 0.05 vs the AR group. bp < 0.05 vs the AR-SO2-day15 group. Abbreviations: tIgE, total IgE; sIgE, HDM-specific IgE; SO2, sulfur dioxide; NS, normal saline; AR, allergic rhinitis. |
SO2 Exposure Increased Eosinophil Infiltration in Nasal Mucosa
To determine the effect of long-term SO2 exposure on mucosal histology in AR mice, we examined changes of eosinophil infiltration in the nasal mucosa. The number of eosinophils that infiltrated into the nasal mucosa of AR, AR-SO2-day15, and AR-SO2-day1 groups was dramatically increased compared to that of the NS group or SO2-treated control group (Figure 4). Furthermore, compared with that in the AR group, eosinophil infiltration in AR-SO2-day15 group was increased and it was highest in AR-SO2-day1 group. This result indicated that long-term SO2 exposure significantly increased eosinophil infiltration in the nasal mucosa of HDM-sensitized AR mice.
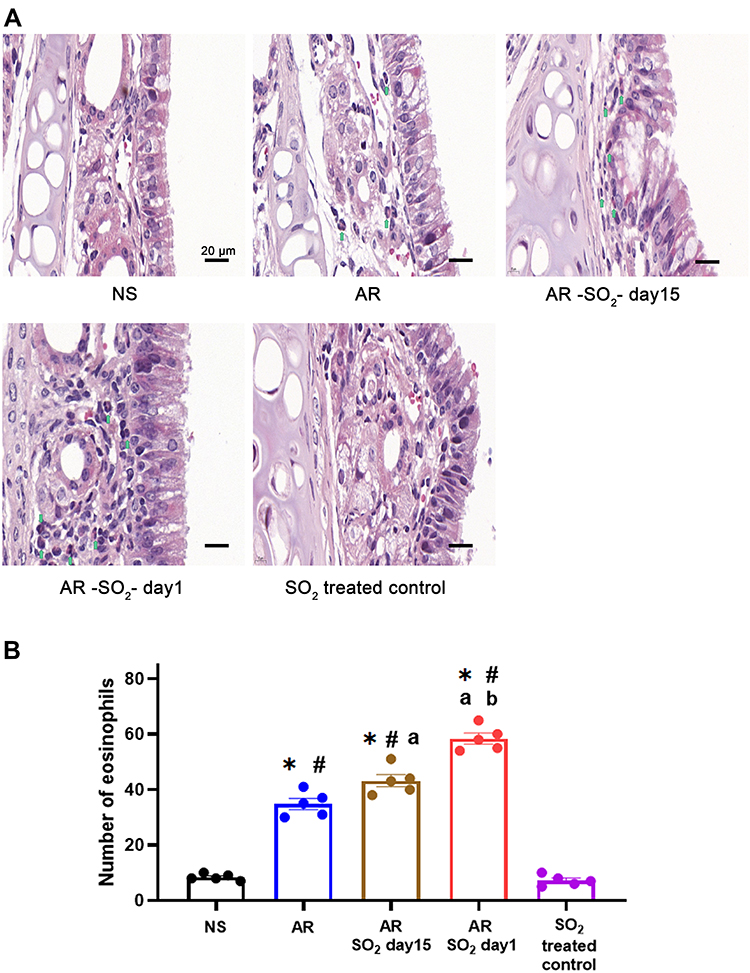 |
Figure 4 Eosinophilic inflammation in nasal mucosa. (A) Representative images and (B) statistical histogram of eosinophil infiltration in nasal mucosa detected by HE staining. Green arrows indicate eosinophils. The AR group was sensitized with HDM challenge. The AR-SO2-day15 group and AR-SO2-day1 group included HDM-sensitized mice exposed to SO2 beginning on day 15 and day 1, respectively. The NS group was challenged with normal saline instead of HDM. The SO2-treated control group was challenged with normal saline and exposed to SO2 beginning on day 1. Scale bars = 20 μm. The data are presented as the mean ± SEM. *p < 0.05 vs the NS group. #p < 0.05 vs the SO2-treated control group. ap < 0.05 vs the AR group. bp < 0.05 vs the AR-SO2-day15 group. Abbreviations: SO2, sulfur dioxide; HDM, house dust mite; NS, normal saline; AR, allergic rhinitis. |
Effect of SO2 on Allergic Inflammation in Nasal Mucosa
The effect of SO2 exposure on allergic inflammation in the nasal mucosa was assessed by IHC and quantitative PCR. As shown in Figure 5A–D, compared to that of the NS control group or SO2-treated control group, the percentage of cells that expressed IL-4, IL-15 and IL-13 in the nasal mucosa was increased in the AR, AR-SO2-day15 and AR-SO2-day1 groups. Furthermore, compared with the AR group, the expression of IL-4, IL-5 and IL-13 positive cells in the nasal mucosa was significantly increased in the AR-SO2-day15 group and AR-SO2-day1 group. The percentage of IL-4 positive cells was higher in AR-SO2-day1 group than in the AR-SO2-day15 group. However, IL-2 and IFN-γ expression was significantly increased in the SO2-treated groups, including SO2-treated control, AR-SO2-day15 and AR-SO2-day1 groups, compared with that in the NS group or AR group (Figure 5E and F). Moreover, the expression of IL-2 and IFN-γ was higher in the SO2-treated control and AR-SO2-day1 groups than in the AR-SO2-day15 group. Similarly, the mRNA level of IL-2, IFN-γ, RORγt and IL-17A in the nasal mucosa was increased significantly in SO2-treated control, AR-SO2-day15 and AR-SO2-day1 groups, compared with the NS group or AR group (Figure 6A–D). IL-2 mRNA level was higher in the AR-SO2-day1 group than AR-SO2-day15 group (Figure 6A). In addition, the JAK2 mRNA level was higher in AR group than in the NS group. And JAK2 mRNA level was higher in the AR-SO2-day1 group than AR group (Figure 6E). These findings indicated that SO2 not only increased Th2 cytokine expression but also enhanced Th1 and Th17 cytokine expression in the nasal mucosa of HDM-sensitized AR mice. The enhanced expression of Th1 cytokines IL-2 and IFN-γ might also lead to the decreased serum sIgE level in the HDM-sensitized mice exposed to SO2 beginning on day 1. The activation of JAK signaling pathway might increase the expression of IL-17A and then exacerbate the inflammatory response in AR mice treated with long-term SO2 exposure.
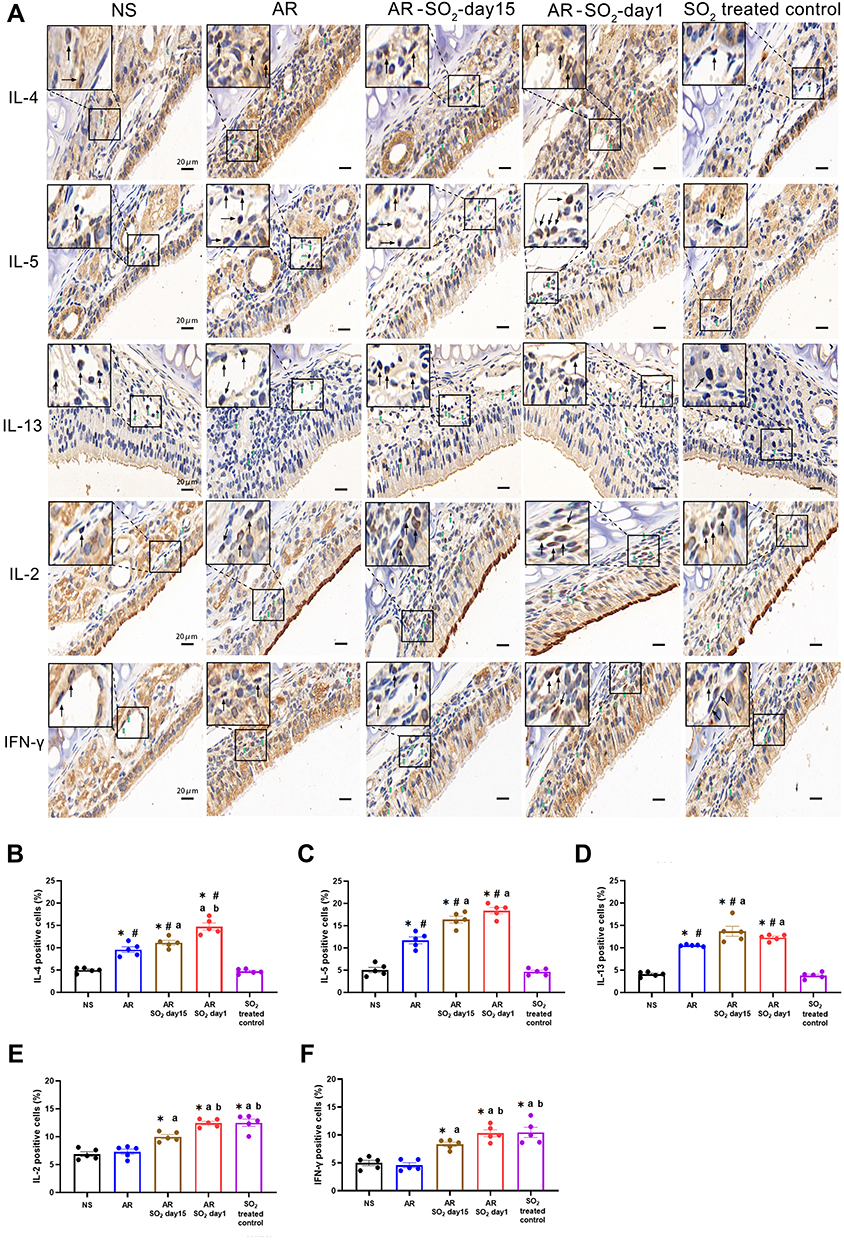 |
Figure 5 Allergic inflammation in nasal mucosa. (A) Representative images of IL-4, IL-5, IL-13, IL-2 and IFN-γ expression in nasal mucosa detected by immunohistochemistry. (B–F) Statistical analysis of the percentages of cells positive for (B) IL-4, (C) IL-5, (D) IL-13, (E) IL-2 and (F) IFN-γ in the nasal mucosa. Green and black arrows indicate positively stained cells. Scale bars = 20 μm. The AR group was sensitized with HDM challenge. The AR-SO2-day15 group and AR-SO2-day1 group included HDM-sensitized mice exposed to SO2 beginning on day 15 and day 1, respectively. The NS group was challenged with normal saline instead of HDM. The SO2-treated control group was challenged with normal saline and exposed to SO2 beginning on day 1. The data are shown as the mean ± SEM. *p < 0.05 vs the NS group. #p < 0.05 vs the SO2-treated control group. ap < 0.05 vs the AR group. bp < 0.05 vs the AR-SO2-day15 group. Abbreviations: IL-4, interleukin-4; IL-5, interleukin-5; IL-13, interleukin-13; IL-2, interleukin-2; IFN-γ, interferon-γ; SO2, sulfur dioxide; NS, normal saline; AR, allergic rhinitis. |
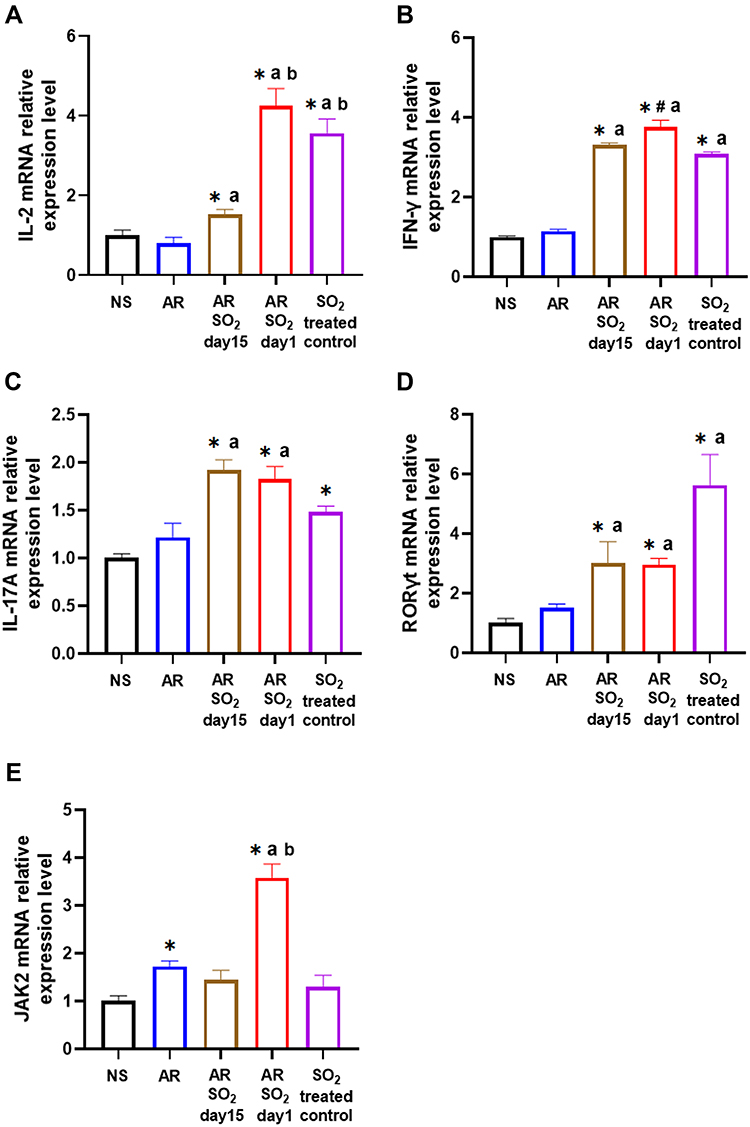 |
Figure 6 The mRNA expression levels of IL-2, IFN-γ, IL-17A, RORγt and JAK2 in nasal mucosa. (A) IL-2, (B) IFN-γ, (C) IL-17A, (D) RORγt and (E) JAK2 mRNA expression in nasal mucosa detected by quantitative PCR. The AR group was sensitized with HDM challenge. The AR-SO2-day15 group and AR-SO2-day1 group included HDM-sensitized mice exposed to SO2 beginning on day 15 and day 1, respectively. The NS group was challenged with normal saline instead of HDM. The SO2-treated control group was challenged with normal saline and exposed to SO2 beginning on day 1. The data are presented as the mean ± SEM. *p < 0.05 vs the NS group. #p < 0.05 vs the SO2-treated control group. ap < 0.05 vs the AR group. bp < 0.05 vs the AR-SO2-day15 group. Abbreviations: IL-2, interleukin-2; IFN-γ, interferon-γ; IL-17A, interleukin-17A; RORγt, RAR-related orphan receptor gamma T; JAK2, Janus kinase 2; SO2, sulfur dioxide; NS, normal saline; AR, allergic rhinitis. |
Effect of SO2 on CD23+ Expression in B Cells in Nasal Mucosa
The findings described above showed that SO2 exposure promoted allergic inflammation in the nasal mucosa, while the serum sIgE level decreased when HDM-sensitized mice were exposed to SO2 beginning on day 1. To explore whether SO2 influences sIgE production in nasal mucosa, the expression of CD23 (FcεRII), a low affinity receptor for IgE, on B lymphocytes (CD19) was detected by double positive staining (Figure 7A). We found that the percentage of CD23+CD19+ B lymphocytes was significantly increased in HDM-sensitized mice (AR group, AR-SO2-day15 group and AR-SO2-day1 group) compared with NS mice or SO2 treated control mice. Furthermore, there was a stronger increase in the AR-SO2-day15 group than in the AR group and a stronger decrease in the AR-SO2-day1 group than in the AR-SO2-day15 group (Figure 7B). This finding may suggest that SO2 decreases sIgE production by inhibiting CD23 expression on CD19+ B lymphocytes in HDM-sensitized mice.
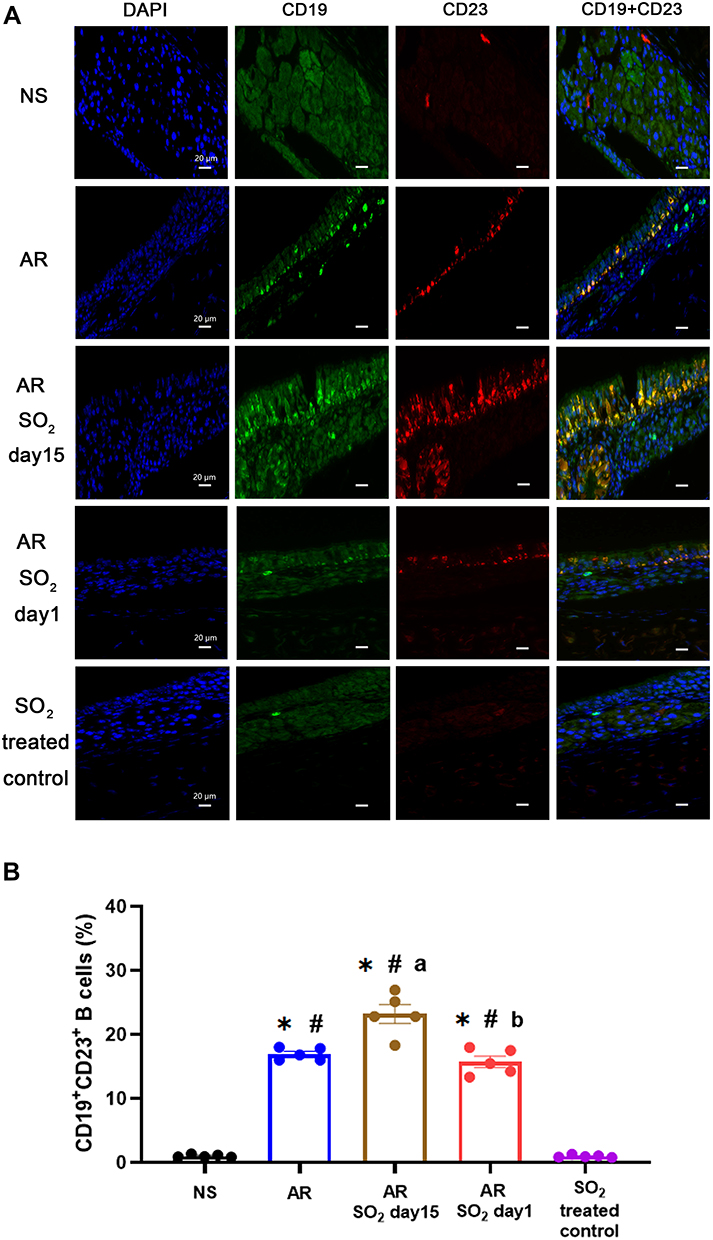 |
Figure 7 Expression of CD23+ B cells in nasal mucosa. (A) Representative images of CD19+CD23+ expression in nasal mucosa detected by immunofluorescence staining (magnification 1000×). DAPI, the nuclear staining (blue). CD19, a specific marker for B lymphocytes (green). CD23, the low-affinity receptor for IgE (red). CD19+CD23+, double positive for CD19 and CD23 expression (yellow). Scale bars = 20 μm. (B) Statistical analysis of the percentages of CD19+CD23+ cells in the nasal mucosa. The AR group was sensitized with HDM challenge. The AR-SO2-day15 group and AR-SO2-day1 group included HDM-sensitized mice exposed to SO2 beginning on day 15 and day 1, respectively. The NS group was challenged with normal saline instead of HDM. The SO2-treated control group was challenged with normal saline and exposed to SO2 beginning on day 1. The data are presented as the mean ± SEM. *p < 0.05 vs the NS group. #p < 0.05 vs the SO2-treated control group. ap < 0.05 vs the AR group. bp < 0.05 vs the AR-SO2-day15 group. Abbreviations: SO2, sulfur dioxide; NS, normal saline; AR, allergic rhinitis. |
Discussion
Increasing evidence suggests a strong relationship between air pollution and the prevalence of airway allergic disease.6 A broad range of air pollutants, including SO2, elemental carbon, nitrogen dioxide (NO2), nitric oxide (NO), particulate matter (PM2.5 and PM10), carbon monoxide (CO), and carbon dioxide (CO2), may play a role in exacerbating respiratory inflammatory diseases.4 SO2, one of the main pollutants in the air, is commonly produced by the combustion of fossil fuels. It has been reported that children living near petrochemical complexes that produce SO2 presented a higher incidence of AR, bronchitis and asthma.12 However, the exact role of SO2 in allergic inflammation in AR remains unclear. In this study, we first established the AR mouse model with long-term SO2 exposure. Then we found that long-term SO2 exposure increased nasal symptom score, eosinophil infiltration and Th1/2/17 inflammation in the nasal mucosa of HDM-sensitized AR mice. Interestingly, the level of sIgE production in serum was significantly decreased in AR mice treated with long-term SO2 exposure, which were exposed to SO2 before HDM sensitization. This might be related to increased Th1 cytokines and decreased CD23+ B lymphocytes in the nasal mucosa.
Although several studies have shown that SO2 exacerbates airway inflammation, most have focused on lower respiratory diseases, such as asthma. The effect of SO2 on upper respiratory disease, such as AR, has not been elucidated. Herein we established AR mouse model with long-term SO2 exposure. We found that SO2 exposure aggravated nasal symptom of AR mice. Some epidemiological investigations indicated that people in the zones with high SO2 concentrations presented with a higher prevalence of allergic diseases. In this study, we directly observed the aggravation effect of SO2 on AR mice.
IgE plays a key role in the pathogenesis of AR. It has been reported that SO2 stimulates IgE production in airway diseases. For example, exposure to diesel exhaust particles increased IgE level but not IgG level in the nasal airway in nonatopic healthy volunteers.13 Longer-term exposure to a low concentration of SO2 increased the serum tIgE levels in asthmatic mice.14 The sIgE production was increased in rats exposed to pollutants.15 In contrast, a report showed that inhalation of SO2 did not affect serum tIgE level but decreased the expression of the low-affinity IgE receptor in the nasal septum of rats.16 This contradiction might be caused by different experimental conditions such as the type of animal disease model, SO2 exposure strategy, and IgE measurement method. In our study, we found that SO2 exposure decreased the serum tIgE production in nonsensitized mice but did not change the serum tIgE production in sensitized mice. However, SO2 exposure did not change serum sIgE production in nonsensitized mice but increased sIgE production in sensitized mice. Interestingly, long-term SO2 exposure decreased the serum sIgE production in sensitized mice. Our findings indicated that SO2 may exacerbate the IgE-mediated inflammatory response in AR mice. Furthermore, as we found, the inhibitory effect of long-term SO2 exposure on sIgE production in HDM-sensitized mice with high nasal symptom scores might offer an explanation for the interesting phenomenon observed in the clinic, namely, that some patients with severe nasal allergic symptoms present with undetectable serum sIgE levels and negative skin prick test results. To date, we have not observed any reports about the change in serum sIgE level with SO2 exposure time.
Several studies with asthma models have demonstrated that SO2 amplifies Th2 inflammatory responses, including reactive oxygen species production and activation of the toll-like receptor 4/nuclear factor-κB pathway and STAT6, which can further enhance Th2 cytokine expression and eosinophilic inflammation.17–19 Moreover, SO2 caused structural alterations and dysfunction of mucociliary activity in guinea pig tracheas, and SO2 enhanced airway hyperresponsiveness via IL-4 in ovalbumin-sensitized rats.20,21 Consistent with previous studies, we found that SO2 exposure increased eosinophil infiltration and Th2 inflammation in the nasal mucosa of HDM-sensitized AR mice. Long-term SO2 exposure exacerbated eosinophilic inflammation.
To investigate the effect of SO2 exposure on nasal inflammation in AR, we also measured the levels of Th1/Th2/Th17-related cytokines in the nasal mucosa. Our results demonstrated that SO2 aggravated Th1/Th2/Th17 inflammatory responses in AR mice. Long-term SO2 exposure increased the expression of Th2 cytokines (IL-4, IL-5 and IL-13), Th17-related factors (IL-17A, RORγt and JAK2), and Th1 cytokines (IL-2 and IFN-γ). It seems that SO2 exacerbates AR by increasing the pro-inflammatory response (Th2 and Th17) and anti-inflammatory response (Th1) in a nonspecific manner. Considering the above results showed that long-term SO2 exposure aggravated nasal symptom and eosinophil inflammation, thus SO2 might mainly play a more pro-inflammatory role than an anti-inflammatory role. Th1 response might be a protective feedback when pro-inflammatory signaling occurs. Additionally, both Th2 and Th17 cells might contribute to the pro-inflammatory response. There is evidence indicating that Th17 cells may promote both eosinophilic and neutral inflammation in AR.22,23 Th17 response is closely related to JAK/STAT5 pathway in neutrophilic asthma.24 SO2 induced oxidant overload leads to recruitment of various immune cells (macrophages, neutrophils, and eosinophils) into tissue via pro-inflammatory cytokine TNF-α, subsequently leading to inflammatory mediator release and airway hyperresponsiveness.6,25,26 In addition, basophils may also play an important role in contributing to the process of SO2-induced nasal inflammation. Reports have showed that basophils are rapidly recruited and produce abundant amounts of IL-4 after allergen challenge in sensitized individuals.27 Diesel exhaust particles promoted basophil secretion of IL-8, aggravated local mucosal inflammation28 and induced histamine release in both allergic and non allergic subjects without IgE-allergen dependence.29 The inherent “irritant” properties of SO2 also induce neurogenic inflammation in asthma, including release of calcitonin gene-related peptide (CGRP), substance P, and neurokinin A.28,30,31 Therefore, long-term exposure to SO2 aggravated AR not entirely by classic Th2 allergic inflammation but by non-IgE mediated allergic inflammation related to Th17 response or other irritant response.
To explore the inhibitory effect of SO2 on sIgE production, we further focused on CD23 (IgE low affinity receptor) expression in B lymphocytes. B cells have been shown to be the main source of IgE production, and CD23 has been found to be the critical receptor for regulating B cells. We found that the expression of CD23 in B lymphocytes was significantly decreased in the nasal mucosa of AR-SO2-day1 mice, indicating that long-term exposure to SO2 decreased CD19+CD23+ expression. This suggests a strong relationship between decreased CD23 expression in B lymphocytes and low serum sIgE level, suggesting that long-term exposure to SO2 inhibited sIgE production partially through the downregulation of CD19+CD23+ B lymphocytes. However, a report showed that inhalation of SO2 reduced the percentage of CD19+CD23+ cells in the nasal septum of rats but did not affect serum IgE levels.16 This inconsistent result may have occurred due to the different protocols for SO2 treatment. The SO2 exposure time was only 7 days in that study, which was much shorter than that in our study. The longer exposure period and treatment before allergen challenge may be the main reason for the discrepancy. In addition, IL-2 was reported to inhibit the synthesis of IgE and the expression of CD23 on lymphocytes stimulated with pokeweed mitogen or LPS.32,33 Therefore, the higher expression of IL-2 in AR mice exposed to SO2 for a long period might also account for the lower sIgE production.
Some limitations in our study should be noted. Although Th1/Th2/Th17 inflammation was investigated in this study, the immune mechanism in AR is complex and also regulated by mechanisms other than T-cell subset imbalance. Other immune cells, such as basophils and macrophages, also play critical roles in AR.27 Regarding the interesting phenomenon that long-term SO2 exposed AR mice presented with higher nasal symptom on the one hand and lower serum sIgE level on the other hand, we hypothesized that this result may have occurred due to the decreased expression of CD23 in B lymphocytes. However, the B cells should be isolated for further functional research to study the regulatory effect of SO2 on sIgE secretion. Thus, more immune cells and more in-depth mechanisms should be explored.
Our findings suggest the potential role of SO2 in exacerbating allergic inflammation and provide clues that SO2 or even other environmental pollutants can be clearly pathogenic factors that contribute to AR via an immunological mechanism. Furthermore, this study provides a possible pathogenic mechanism to explain the undetectable IgE level in AR.
Conclusion
In conclusion, SO2 exposure aggravated nasal symptom, eosinophil infiltration, Th1/Th2/Th17 inflammation in AR mice. SO2 increased serum sIgE level in sensitized mice. However, the serum sIgE level could be lowered by long-term SO2 exposure. This inhibitory effect of SO2 on IgE production may be suppressed by CD23+ B lymphocytes.
Acknowledgments
This work was supported by grants from the National Natural Science Foundation of China [81870708], the Funds of Hunan Scientific Plan in China [2017SK2043] and the Natural Science Foundation of Hunan Province, China [2021JJ40933].
Disclosure
The authors report no conflicts of interest in this work.
References
1. Eguiluz-Gracia I, Pérez-Sánchez N, Bogas G, et al. How to diagnose and treat local allergic Rhinitis: a Challenge for Clinicians. J Clin Med. 2019;8:1062. doi:10.3390/jcm8071062
2. Papadopoulos NG, Guibas GV. Rhinitis Subtypes, endotypes, and definitions. Immunol Allergy Clin N Am. 2016;36:215–233. doi:10.1016/j.iac.2015.12.001
3. Brozek JL, Bousquet J, Agache I, et al. Allergic rhinitis and its impact on asthma (ARIA) guidelines-2016 revision. J Allergy Clin Immunol. 2017;140:950–958. doi:10.1016/j.jaci.2017.03.050
4. Hassoun Y, James C, Bernstein DI. The effects of air pollution on the development of atopic disease. Clin Rev Allergy Immunol. 2019;57(3):403–414. doi:10.1007/s12016-019-08730-3
5. Murugappan R, Nyall R, Anuj T, et al. Airborne particulate matter induces nonallergic eosinophilic sinonasal inflammation in Mice. Am J Respir Cell Mol Biol. 2017;57(1):59–65. doi:10.1165/rcmb.2016-0351OC
6. Naclerio R, Ansotegui IJ, Bousquet J, et al. International expert consensus on the management of allergic rhinitis (AR) aggravated by air pollutants: impact of air pollution on patients with AR: current knowledge and future strategies. World Allergy Organ J. 2020;13(3):100106. doi:10.1016/j.waojou.2020.100106
7. Rosser F, Forno E, Kurland SK, et al. Annual SO2 exposure, asthma, atopy, and lung function in Puerto Rican children. Pediatr Pulmonol. 2020;55(2):330–337. doi:10.1002/ppul.24595
8. Qihong D, Chan L, Yichen Y, et al. Early life exposure to traffic-related air pollution and allergic rhinitis in preschool children. Respir Med. 2016;121:67–73. doi:10.1016/j.rmed.2016.10.016
9. John-Schuster G, De Kleijn S, Van Wijck Y, et al. The effect of tiotropium in combination with olodaterol on house dust mite-induced allergic airway disease. Pulm Pharmacol Ther. 2017;45:210–217. doi:10.1016/j.pupt.2017.06.010
10. Hou M, Li W, Xie Z, et al. Effects of anticholinergic agent on miRNA profiles and transcriptomes in a murine model of allergic rhinitis. Mol Med Rep. 2017;16:6558–6569. doi:10.3892/mmr.2017.7411
11. Chen Q, Ba YP, Zhou MH, et al. CD23 on B cells determines Breg-facilitated IL-10 secretion as well as activation of T cells. Lin Chung Er Bi Yan Hou Tou Jing Wai Ke Za Zhi. 2018;32:931–937. doi:10.13201/j.issn.1001-1781
12. Chiang TY, Yuan TH, Shie RH, et al. Increased incidence of allergic rhinitis, bronchitis and asthma, in children living near a petrochemical complex with SO2 pollution. Environ Int. 2016;96:1–7. doi:10.1016/j.envint.2016.08.009
13. Diaz-Sanchez D, Dotson AR, Takenaka H, et al. Diesel exhaust particles induce local IgE production in vivo and alter the pattern of IgE messenger RNA isoforms. J Clin Invest. 1994;94:1417–1425. doi:10.1172/JCI117478
14. Di Giampaolo L, Quecchia C, Schiavone C, et al. Environmental pollution and asthma. Int J Immunopathol Pharmacol. 2011;24:31–38. doi:10.1177/03946320110240S207
15. Rusznak C, Devalia JL, Wang J, et al. Pollution-induced airway disease and the putative underlying mechanisms. Clin Rev Allergy Immunol. 1997;15(2):205–217. doi:10.1007/BF02826587
16. Chai R, Xie H, Zhang J, et al. Sulfur dioxide exposure reduces the quantity of CD19+ cells and causes nasal epithelial injury in rats. J Occup Med Toxicol. 2018;13:22. doi:10.1186/s12995-018-0208-7
17. Zhang L, Yi H, Sang N. Sulfur dioxide-induced exacerbation of airway inflammation via reactive oxygen species production and the toll-like receptor 4/nuclear factor-κB pathway in asthmatic mice. Toxicol Ind Health. 2021;37(9):564–572. doi:10.1177/07482337211033136
18. Li X, Huang L, Wang N, et al. Sulfur dioxide exposure enhances Th2 inflammatory responses via activating STAT6 pathway in asthmatic mice. Toxicol Lett. 2018;285:43–50. doi:10.1016/j.toxlet.2017.12.020
19. Jon PJ, Jennifer AK, Ari JA, et al. Azithromycin ameliorates sulfur dioxide-induced airway epithelial damage and inflammatory responses. Respir Res. 2020;21(1):233. doi:10.1186/s12931-020-01489-8
20. Riechelmann H, Maurer J, Kienast K, et al. Respiratory epithelium exposed to sulfur dioxide - functional and ultrastructural alterations. Laryngoscope. 1995;295–299. doi:10.1288/00005537-199503000-00013
21. Song A, Liao Q, Li J, et al. Chronic exposure to sulfur dioxide enhances airway hyperresponsiveness only in ovalbumin-sensitized rats. Toxicol Lett. 2012;214:320–327. doi:10.1016/j.toxlet.2012.09.010
22. Liu Y, Zeng M, Liu Z. Th17 response and its regulation in inflammatory upper airway diseases. Clin Exp Allergy. 2015;45(3):602–612. doi:10.1111/cea.12378
23. Tao B, Ruan G, Wang D, et al. Imbalance of Peripheral Th17 and Regulatory T Cells in Children with Allergic Rhinitis and Bronchial Asthma. Iran J Allergy Asthma Immunol. 2015;14(3):273–279.
24. Li RF, Wang GF. JAK/STAT5 signaling pathway inhibitor ruxolitinib reduces airway inflammation of neutrophilic asthma in mice model. Eur Rev Med Pharmacol Sci. 2018;22(3):835–843. doi:10.26355/eurrev_201802_14320
25. Anita LR, Edward GB, Bill TA. Mechanisms of Heightened Airway Sensitivity and Responses to Inhaled SO2 in Asthmatics. Environ Health Insights. 2015;9(Suppl 1):13–25. doi:10.4137/EHI.S15671
26. Shau-Ku H, Zhang Q, Qiu Z, et al. Mechanistic impact of outdoor air pollution on asthma and allergic diseases. J Thorac Dis. 2015;7(1):23–33. doi:10.3978/j.issn.2072-1439.2014.12.13
27. Poddighe D, Mathias CB, Freyschmidt EJ, et al. Basophils are rapidly mobilized following initial aeroallergen encounter in naïve mice and provide a priming source of IL-4 in adaptive immune responses. J Biol Regul Homeost Agents. 2014;28(1):91–103.
28. Stefanie L, Wolfgang S, Pusch G, et al. Polycyclic aromatic hydrocarbons from diesel emissions exert proallergic effects in birch pollen allergic individuals through enhanced mediator release from basophils. Environ Toxicol. 2010;25(2):188–197. doi:10.1002/tox.20490
29. Gilles D, Andrew S, Metcalfe DD, et al. Chemical constituents of diesel exhaust particles induce IL-4 production and histamine release by human basophils. J Allergy Clin Immunol. 2002;109(5):847–853. doi:10.1067/mai.2002.122843
30. Meggs WJ. Neurogenic inflammation and sensitivity to environmental chemicals. Environ Health Perspect. 1993;101(3):234–238. doi:10.1289/ehp.93101234
31. Bannenberg G, Atzori L, Xue J, et al. Sulfur dioxide and sodium metabisulfite induce bronchoconstriction in the isolated perfused and ventilated Guinea pig lung via stimulation of capsaicin-sensitive sensory nerves. Respiration. 1994;61(3):130–137. doi:10.1159/000196324
32. Knöller I, Bujanowski-Weber J, Brings B, et al. Influence of IL-2 and IL-4 on the IgE synthesis and the IgE-binding factor (sCD23) production by human lymphocytes in vitro. Immunology. 1989;66(3):368–375.
33. Miyajima H, Hirano T, Hirose S, et al. Suppression by IL-2 of IgE production by B cells stimulated by IL-4. J Immunol. 1991;146(2):457–462.
 © 2022 The Author(s). This work is published and licensed by Dove Medical Press Limited. The
full terms of this license are available at https://www.dovepress.com/terms
and incorporate the Creative Commons Attribution
- Non Commercial (unported, 3.0) License.
By accessing the work you hereby accept the Terms. Non-commercial uses of the work are permitted
without any further permission from Dove Medical Press Limited, provided the work is properly
attributed. For permission for commercial use of this work, please see paragraphs 4.2 and 5 of our Terms.
© 2022 The Author(s). This work is published and licensed by Dove Medical Press Limited. The
full terms of this license are available at https://www.dovepress.com/terms
and incorporate the Creative Commons Attribution
- Non Commercial (unported, 3.0) License.
By accessing the work you hereby accept the Terms. Non-commercial uses of the work are permitted
without any further permission from Dove Medical Press Limited, provided the work is properly
attributed. For permission for commercial use of this work, please see paragraphs 4.2 and 5 of our Terms.