Back to Journals » OncoTargets and Therapy » Volume 12
Long noncoding RNA ZFAS1 promotes progression of papillary thyroid carcinoma by sponging miR-590-3p and upregulating HMGA2 expression
Authors Tong H, Zhuang X, Cai J, Ding Y, Si Y, Zhang H, Shen M
Received 18 March 2019
Accepted for publication 14 August 2019
Published 13 September 2019 Volume 2019:12 Pages 7501—7512
DOI https://doi.org/10.2147/OTT.S209138
Checked for plagiarism Yes
Review by Single anonymous peer review
Peer reviewer comments 2
Editor who approved publication: Dr Sanjeev K. Srivastava
Houchao Tong,* Xi Zhuang,* Jingsheng Cai,* Yu Ding, Yan Si, Hao Zhang, Meiping Shen
Department of General Surgery, The First Affiliated Hospital of Nanjing Medical University, Nanjing, Jiangsu 210029, People’s Republic of China
*These authors contributed equally to this work
Correspondence: Meiping Shen
Department of General Surgery, The First Affliated Hospital of Nanjing Medical University, No. 300 Guangzhou Road, Nanjing, Jiangsu 210029, People’s Republic of China
Tel +86 1 381 395 5969
Email [email protected]
Background: Thyroid cancer is the most common endocrine malignancy, papillary thyroid carcinoma (PTC) is the main form of thyroid cancer. The long non-coding RNA (lncRNA) zinc finger antisense 1 (ZFAS1) is highly expressed in various cancer tissues and it has been shown to function as a tumor promoter in various cellular processes. However, the role of ZFAS1 in PTC is not well understood currently. Thus, this study aimed to explore the potential roles of ZFAS1 in the development and progression of PTC.
Material and methods: PTC tissues (n=80) and noncancerous tissues were collected. Gain- and loss-of-function assays were performed to determine the effect of ZFAS1 on proliferation in K-1 and TPC-1 cells. The ZFAS1/mir-590-3P/HMGA2 aixs were analysed in PTC cell lines.
Results: We found that the expression of ZFAS1 was increased in PTC tissues and four PTC cell lines (B-CPAP, IHH-4, TPC-1, and K-1). The gain- and loss-of-function assays showed that overexpressing ZFAS1 promoted cell proliferation and inhibited cell apoptosis in PTC cells in vitro. We demonstrated that knockdown of ZFAS1 inhibits tumor growth and upregulation of ZFAS1 promotes tumor growth in vivo. Bioinformatics analysis revealed that miR-590-3p targeted the 3ʹ-UTR of ZFAS1. The double luciferase reporter and RNA-binding protein immunoprecipitation assay demonstrated that miR-590-3p is a target of ZFAS1. Rescue experiments confirmed that miR-590-3p could reverse the effect of ZFAS1 on PTC cells. Moreover, we identified high mobility group AT-hook 2 (HMGA2) to be a downstream target of miR-590-3p and ZFAS1 which activates HMGA2 expression by sponging to miR-590-3p.
Conclusion: High ZFAS1 expression level was associated with the progression of PTC, and ZFAS1 contributed to PTC progression via miR-590-3p/HMGA2 regulatory aixs. Therefore, ZFAS1 might be a potential therapeutic target for PTC intervention.
Keywords: papillary thyroid cancer, ZFAS1, miR-590-3p, HMGA2, ceRNA, progression
Introduction
Thyroid cancer is a common endocrine malignancy, which stems from follicular or parafollicular thyroid cells.1 The incidence of thyroid cancer has been growing steadily over the past few decades worldwide.2 Recently, the American Cancer Society for Health Statistics estimated that about 53,990 new thyroid cancer cases are diagnosed annually, accounting for 3.11% of all newly diagnosed malignancies, and that 2060 people are likely to die of thyroid cancer in the USA in 2018.3 Thyroid cancer is histologically classified into PTC, follicular thyroid carcinoma, medullary thyroid carcinoma and anaplastic thyroid carcinoma. PTC is the main type of thyroid cancer, which accounts for more than 80% of all thyroid cancers.4 Although PTC is biologically indolent and has a relatively favorable prognosis with an overall five-year survival rate of 97%,5 data indicates that about 10–30% of PTC cases show aggressive behaviors and have poor prognosis.6 Therefore, it is essential to explore its molecular mechanisms and to design effective therapeutic strategies for PTC.
Long noncoding RNAs (lncRNA) are a group of non-protein coding RNA molecules which are longer than 200 nucleotides.7 Originally, lncRNAs were thought to be genomic “junk” and “noise”, owing to their lack of protein-encoding capacity.8 So far, many studies have demonstrated that lncRNAs are involved in multiple biological functions and play a crucial role in cancer development and progression, especially through epigenetic regulation, transcriptional and posttranscriptional regulation.9–11 Other studies have reported that lncRNAs can act as tumor suppressor genes or oncogenes.12,13 For example, lncRNAs GAS8-AS1 and H19 are downregulated and function as tumor suppressors in thyroid cancer.14–16 On the other hand, lncRNAs NEAT1 and HOTAIR are upregulated and function as oncogenes in thyroid cancer.17–20 Yet, the roles of the vast majority of lncRNAs in PTC are not clearly understood. ZFAS1 (a recently discovered lncRNA) is located on the antisense strand of the Znfx1 (zinc finger NFX-1-type containing) promoter region, and is a host to three small nucleolar RNAs.21 Many studies have reported that ZFAS1 expression is upregulated in various human cancers, including colorectal cancer, non-small cell lung cancer, hepatocellular carcinoma and osteosarcoma.22–26 However, little is known about the functional significance of ZFAS1 in PTC.
In this study, we investigated the expression of ZFAS1 in PTC tissues and cell lines. Furthermore, ZFAS1 expression levels in PTC tissues and its association with clinicopathological features were analyzed. Gain-of-function and loss-of-function experiments were performed to investigate the biological function and underlying mechanism of ZFAS1 in PTC progression.
Materials and methods
Ethics statement
This study protocol was approved by the Ethics Committee of The First Affiliated Hospital of Nanjing Medical University. In accordance with the Declaration of Helsinki, all patients provided informed consent forms and agreed to participate in this study. Animal experiments were also approved by the Animal Ethical and Welfare Committee of Nanjing Medical University.
Tissue samples
Eighty pairs of PTC tissues and paracancerous thyroid tissues were obtained from patients (Including 21 males and 49 females, the average age of males and females is 39±10.5 and 46±11.3 years respectively) who were diagnosed with thyroid cancer and underwent surgery at the Department of Thyroid Surgery of The First Affliated Hospital of Nanjing Medical University from August 2016 to June 2017. In all samples, the pathological results were confirmed by three pathologists. None of the patients was on radiotherapy or chemotherapy before surgery. All fresh tissues were frozen in liquid nitrogen before use.
Cell culture
The human PTC cell lines, IHH-4 and TPC-1, were obtained from the Department of Endocrinology of The First Affiliated Hospital of Nanjing Medical University (Nanjing, Jiangsu). The human PTC cell line K-1, B-CPAP and human thyroid follicular epithelial cell line Nthy-ori 3-1 were a gift from Professor Hao Zhang (Department of Thyroid Surgery of The First Affiliated Hospital of China Medical University, Shenyang, Liaoning). All cell lines have been approved by the Ethics Committee of the First Affiliated Hospital of Nanjing Medical University. The BCPAP was kept in RPMI 1640 medium (Hyclone, USA) supplemented with 10% heat-inactivated fetal bovine serum (FBS) (Gibco, USA). The Nthy-ori 3-1 was maintained in RPMI 1640+2 mM glutamine +10% FBS. The TPC1 was maintained in DMEM high Glucose medium (Hyclone, USA) supplemented with 15% FBS. The K1 was maintained in DMEM supplemented with 10% FBS. IHH4 was maintained in a mixture (1:1) of RPMI 1640 and DMEM supplemented with 10% FBS. All cells were cultured at 37 °C in a humidified atmosphere with 5% CO2.
Cell transfection
Commercially available lentiviral vectors were used to construct the LV2-hsa-miR-590-3p-mimic vector (miR-590-3p mimics) and the LV2-hsa-miR-590-3p-inhibitor vector (miR-590-3p inhibitor) (GenePharma, Shanghai, China). The mimics and inhibitor of miR-590-3p used to overexpress or knockdown the expression of miR-590-3p. ZFAS1-small interfering RNA (si-ZFAS1) and negative control siRNA (si-NC) were purchased from GenePharma (Shanghai, China). The ZFAS1 sequences were cloned into pcDNA3.1 vector (Invitrogen, USA). The empty pcDNA3.1 vector was used as the control. Cells were seeded in six-well plate the night before to give 80~90% confluence for plasmid and 40~50% for miRNA at the day of transfection. The following day cells were transfected with miR-590-3p mimics (50 nM), miR-590-3p inhibitor (100 nM), mimics-nc (50 nM), inhibitor-nc (100 nM), pcDNA3.1-ZFAS1 (4.0 μg), pcDNA3.1-empty (4.0 μg), si-ZFAS1 (50 nM) or si-NC (50 nM) respectively. Lipofectamine 3000 (Invitrogen, Carlsbad, CA, USA) was used to facilitate transfection in TPC-1 and K-1 cells according to the manufacturer’s protocol. The transfected cells were harvested 48 h after transfection.
Total RNA isolation and quantitative real-time reverse transcription PCR (qRT-PCR)
RNA was extracted from cells and tissue samples using TRIzol reagent (Invitrogen, Carlsbad, CA, USA), and then the reverse transcription kit (PrimeScript RT Master Mix, TaKaRa, Japan) was used to transcribe total RNA to cDNA according to the manufacturer’s instructions. For miR-590-3p, the total RNA was polyadenylated and reverse-transcribed using TaqMan MicroRNA Reverse Transcription Kit. QRT-PCR was carried out with the SYBR Premix Ex Taq kit (TaKaRa, Japan) on the StepOnePlus™ Real-time PCR system (Applied Biosystems, Foster City, CA, USA) to detect the expression of ZFAS1, mir-590-3p and HMGA2. The reaction system inculing: 5 μL of SYBR Premix Ex Taq II, 0.2 μL of forward primer, 0.2 μL of reverse primer, 1 μL of cDNA template, and 3.6 μL of ddH2O. The reaction conditions of PCR were as follows: 95 °C pre-denaturation for 2 min followed by 40 cycles of 95 °C denaturation for 15 s, 60 °C annealing for 30 s, and 72 °C extension for 30 s.The reaction conditions of PCR were as follows: 95 °C pre-denaturation for 2 min followed by 40 cycles of 95 °C denaturation for 15 s, 60 °C annealing for 30 s, and 72 °C extension for 30 s. For ZFAS1 and HMGA2 expression, GAPDH was used as the internal control. For mir-590-3p expression, U6 snRNA was measured as the reference standard. The relative expression level of the targeted genes was calculated and normalized using the 2−ΔΔCt method. All experiments were repeated three times. All primers sequences were as follows: ZFAS1 forward 5ʹ-AACCAGGCTTTGATTGAACC-3ʹ, reverse 5ʹ-ATTCCATCGCCAGTTTCT-3ʹ; mir-590-3p forward 5ʹ-AAAGATTCCAAGAAGCTAAGGGTG-3ʹ, reverse 5ʹ-CCTAACTGGTTTCCTGTGCCTA-3ʹ; HMGA2 forward 5ʹ -GCGCCTCAGAAGAGAGGAC-3ʹ, reverse 5ʹ-GGTCTCTTAGGAGAGGGCTCA-3ʹ; GAPDH forward 5′-GGTCTCCTCTGACTTCAACA-3′, reverse 5′-GTGAGGGTCTCTCTCTTCCT-3′; U6 forward 5′-CTCGCTTCGGCAGCACA-3′, reverse 5′- AACGCTTCACGAATTTGCGT-3′.
Cell viability assay
The proliferation of TPC-1 and K-1 cell lines after transfection with plasmids, siRNAs, mimics or inhibitor was determined using the Cell Counting Kit-8 (CCK-8) assays and Ethynyldeoxyuridine (Edu) assays. For CCK-8 assays, the cells were cultured in 96-well plates at a density of 2×10³ cells/well. At 1, 2, 3, 4 and 5 days, 10 μL of CCK-8 reagent (Dojindo, Kumamoto, Japan) was added to each well according to the manufacturer’s instructions. The plate was incubated for 2 h with 5% CO2 at 37 °C and then cell viability was determined by measuring the absorbance values at 490 nm using a spectrophotometer (Olympus, Japan). For Edu assays, the transfected cells (4×10⁴ cells/well) were seeded on 96-well plate. Forty-eight hours after transfection, 20 μM Edu labeling media (KeyGENBioTECH, Nanjing, China) was added to the 96-well plates, which were then incubated for 2 h at 37 °C and 5% CO2. After treatment with 4% paraformaldehyde and 0.5% Triton X-100, the cells were stained with an anti-Edu working solution. The cells were analyzed by fluorescence microscopy and the percentage of Edu-positive cells was calculated.
Flow cytometry assay
For cell apoptosis assay, cells were transfected under different conditions. Approximately 48h after transfection, the cells were harvested and washed twice with PBS. After treatment with trypsin (without EDTA), cells were fixed with 70% ice-cold methanol at 4 °C for 30 min. Then, cells were resuspended in binding buffer and the cell suspension was stained with 5 µL of Annexin V-FITC (Beyotime, Nanjing, China) reagent, followed by incubation in a dark place at room temperature for 15 min. Next, 1 µL of propidium iodide (PI, 50 µg/mL) (Beyotime, Nanjing, China) was added and gently mixed, followed by incubation in a dark place at room temperature for 5 min, and submission for detection. Flow cytometry (FACScan, BD Biosciences) equipped with Cell-Quest software (BD Biosciences, San Diego, CA, USA) was used to analyze the apoptotic cells.
Luciferase reporter assay
The 3ʹUTR sequence of ZFAS1 containing the putative miR-590-3p binding site was amplified using qRT-PCR and cloned into a pmirGLO Dual-luciferase Target Expression Vector (Promega, Madison, WI, USA) to form the reporter vector ZFAS1-wild-type (ZFAS1-Wt). The mutant 3ʹ-UTR sequence of ZFAS1 was designed and the ZFAS1-mutant-type (ZFAS1-Mut) was generated in a similar manner. HEK293T cells were seeded on 24-well plates for 24 h. Afterwards, ZFAS1-Wt and ZFAS1-Mut were transfected into HEK293T cells with miR-590-3p mimics or miR-NC (GenePharma, Shanghai, China) using Lipofectamine 3000 (Invitrogen) according to the manufacturer’s instructions. Forty-eight hours after transfection, luciferase activity was measured by the Dual-Luciferase Reporter Assay System (Promega). Additional Luciferase reporter assays were performed as described above to determine the direct binding of miR-590-3p to HMGA2 3ʹUTR.
RNA-binding protein immunoprecipitation (RIP) assay
RIP assays were performed to explore the interaction between ZFAS1 and miR-590-3p using EZMagna RIP RNA-binding protein immunoprecipitation kit (Millipore, Billerica, MA, USA) according to the manufacturer’s protocol. Human PTC cells subjected to different treatments and then lysed using RNA lysis buffer containing protease inhibitor and RNase inhibitor. The cell lysate was incubated with magnetic beads conjugated with human Ago2 antibody (Millipore) or negative control IgG (Abcam, Shanghai, China). After overnight incubation at 4 °C, the coprecipitated RNAs were reverse-transcribed and analyzed by qRT-PCR.
Western blot analysis
Total proteins were extracted from PTC cells by RIPA buffer (50 mm Tris-HCl, 150 mm NaCl, 1 mm EDTA, 0.1% SDS, 1% Triton X-100, 0.1% sodium deoxycholate) containing a proteinase inhibitor cocktail (Beyotime, Nanjing, China). The proteins were subjected to SDS-PAGE and then electrophoretically transferred to PVDF membranes. Membranes were incubated with 5% nonfat milk for 2 h at room temperature before they were treated with antibodies overnight at 4 °C. The primary antibodies used in this study included: rabbit anti-GAPDH (1:5000, CST), rabbit anti-BAX (1:1000, CST), rabbit anti-BCL-2 (1:1000, CST) and rabbit anti-HMGA2 (1: 1,000; Abcam, Cambridge, MA, USA). Thereafter, the membranes were washed and incubated with horseradish peroxidase-linked secondary antibody for 2h at room temperature. The protein blots were visualized using the enhanced chemiluminescence (ECL) detection system. Image J software was used to quantify the protein levels. The experiments were repeated three times.
In vivo xenograft tumor growth
All animal procedures were performed in accordance to the protocols approved by the Animal Care Committee of the Nanjing Medical University. K-1 cells were transfected with lentivirus vector of siRNA-ZFAS1 (sh-ZFAS1) or negative control, TPC-1 cells were transfected with pcDNA-ZFAS1 or negative control. A total of 16 male BALB/c nude mice (4 weeks old) were randomly divided into 4 groups (4 mice in sh-ZFAS1 group and 4 mice in control group, 4 mice in pcDNA-ZFAS1 group and 4 mice in control group). Approximately 2×10⁶ cells subcutaneously were injected in rear flank of nude mice. The tumor size was tested every seven days according the formula: V (mm3) = width (mm) 2 × length (mm)/2. After 4 weeks, the tumours were removed and photographed.
Statistical analysis
The RNA-seq data of 509 tumors and 59 matched normal samples were downloaded from UCSC xena (https://xenabrowser.net/datapages/), the dataset ID: TCGA-THCA/Xena_Matrices/TCGA-THCA.htseq_fpkm-uq.tsv. Statistical analyses were performed by using the SPSS 22.0 software. Student’s paired t-test (for two-group data) or post-ANOVA followed by Student-Newman-Keuls (for more than two-group data) and the chi-square test were used for the analysis of differences. P<0.05 was considered as statistically significant. Pearson’s Correlation Coefficient was used to assess the relationships among the levels of ZFAS1, miR-590-3p and HMGA2. All the experiments were repeated three times.
Results
ZFAS1 was upregulated in PTC tissues and cell lines
To explore the roles of ZFAS1 in thyroid cancer, we initially determined the level of ZFAS1 expression using the TCGA database.27–29 As shown in Figure 1A, the expression of ZFAS1 was significantly upregulated in thyroid cancer tissues (P<0.0001). Next, we detected the expression of ZFAS1 in 80 paired PTC and adjacent noncancerous tissues by qRT-PCR. The data showed that, compared with noncancerous tissues, ZFAS1 was markedly upregulated in PTC tissues (Figure 1B). As shown in Table 1, we analyzed the correlation between ZFAS1 expression level and clinicopathological features of the 80 patients. The results indicated that high expression of ZFAS1 was associated with larger tumor sizes (P=0.011). Moreover, the qRT-PCR results indicated that the expression level of ZFAS1 was significantly increased in the four PTC cell lines (B-CPAP, IHH-4, TPC-1, and K-1) compared with non-tumor thyroid follicular epithelial cell line Nthy-ori 3-1 (Figure 1C). These results implied that ZFAS1 is associated with development and progression of PTC.
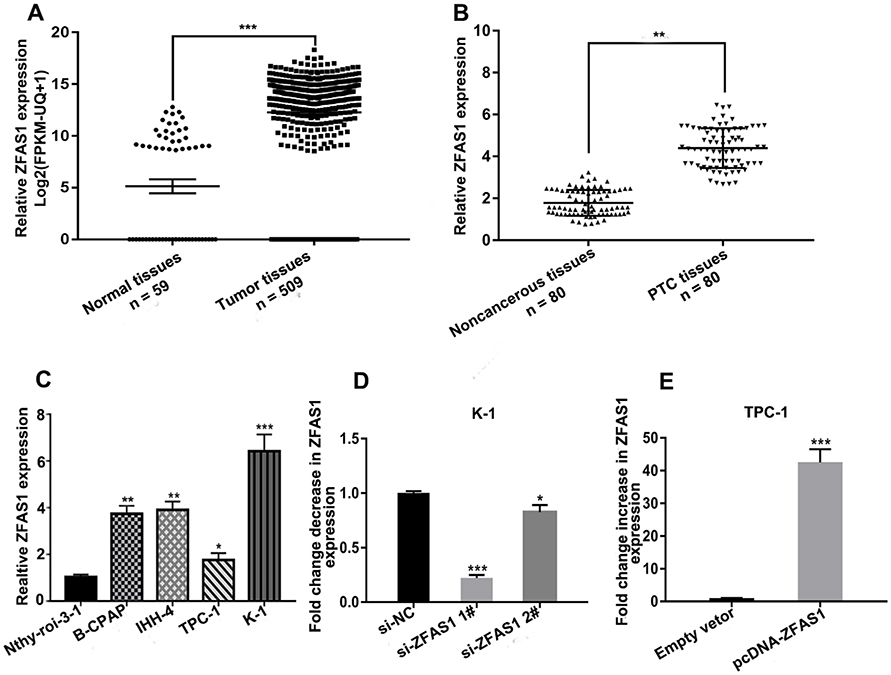 |
Figure 1 Expression level of ZFAS1 in PTC tissues and cell lines. Notes: (A) Relative expression levels of ZFAS1 analyzed from data retrieved from the TCGA database in thyroid cancer. (B) Relative expression levels of ZFAS1 in 80 pairs of PTC tissues and adjacent noncancerous tissues were identified using qRT-PCR. (C) Relative expression levels of ZFAS1 in human thyroid follicular epithelial cell line Nthy-ori 3–1 and four PTC cell lines (B-CPAP, IHH-4, TPC-1 and K-1). (D) Relative expression levels of ZFAS1 were identified using qRT-PCR in K-1 cells after transfection with si-ZFAS1. (E) Relative expression levels of ZFAS1 were identified using qRT-PCR in TPC-1 cells after transfection with pcDNA-ZFAS1. *P<0.05, **P<0.01, ***P<0.001.Abbreviations: ZFAS1, zinc finger antisense 1; PTC, papillary thyroid carcinoma; qRT-PCR, quantitative real‑time PCR. |
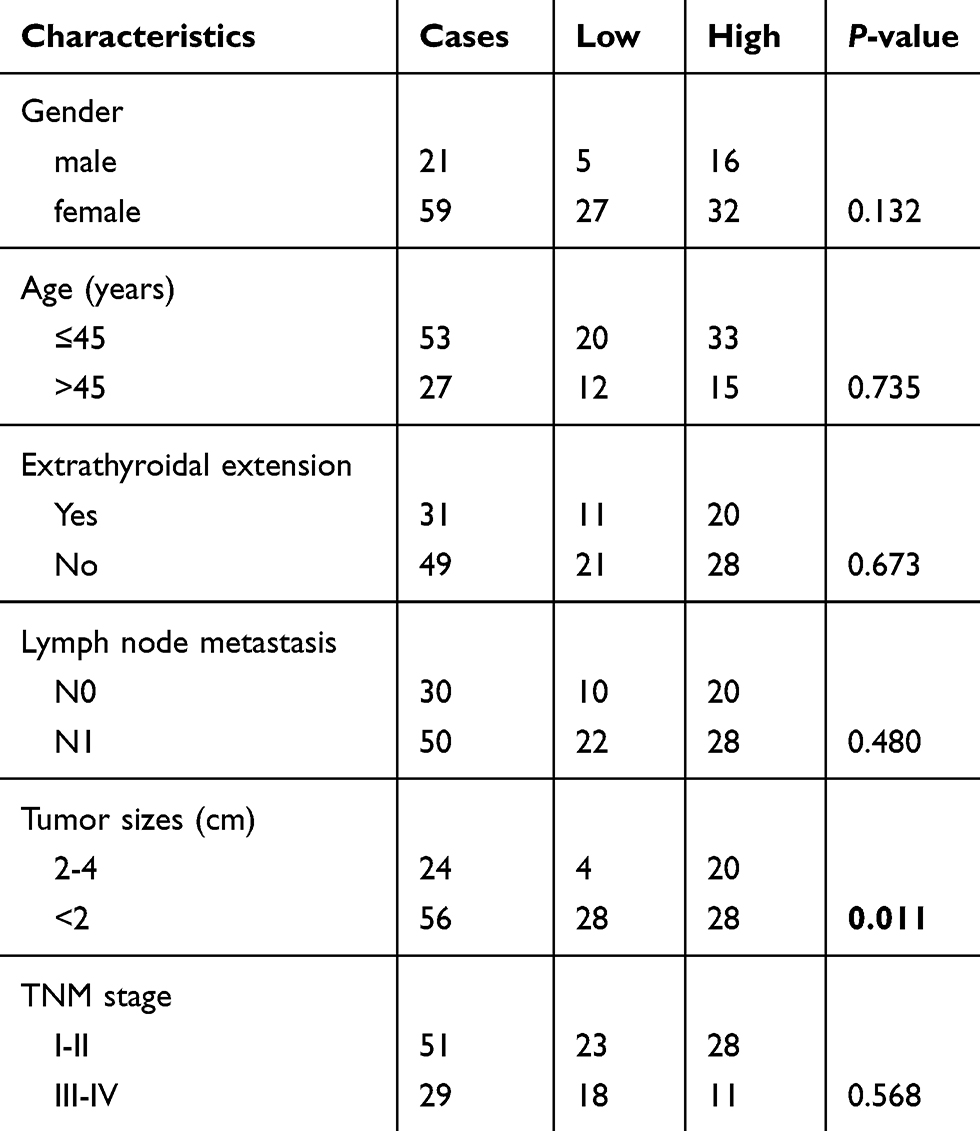 |
Table 1 Association between ZFAS1 expression and clinicopathological characteristics of PTC patients |
Because the expression level of ZFAS1 was highest in K-1 cells and lowest in TPC-1 cells (Figure 1C), we downregulated ZFAS1 expression in K-1 cells by si-ZFAS1 and upregulated ZFAS1 expression in TPC-1 by pcDNA-ZFAS1. The transfection efficiency of siRNA and plasmids were confirmed by qRT-PCR (Figure 1D and E).
ZFAS1 promotes PTC cell proliferation and inhibits apoptosis in vitro
The CCK-8 and Edu assays showed that downregulating ZFAS1 inhibited cell viability in K-1 cells compared to si-NC group (Figure 2A and C), and overexpressing ZFAS1 enhanced cell viability in TPC-1 cells compared to empty vector group (Figure 2B and D). There are many factors that influence cell growth, such as cell senescence, apoptosis and cycle, etc. In this study, we explored the effects of ZFAS1 on PTC cell apoptosis. The results showed that the apoptosis rate of K-1 cells was increased in si-ZFAS1 group compared with si-NC group while that of TPC-1cells was decreased in pcDNA-ZFAS1 group compared with the empty vector group (Figure 2E). The Western blot assay was conducted to detect the expression levels of apoptosis-associated proteins, including BAX and BCL-2. We found that si-ZFAS1 decreased the protein level of BCL-2 and increased the protein level of BAX in K-1 cells. Additionally, pcDNA-ZFAS1 promoted BCL-2 protein expression and inhibited BAX protein expression in TPC-1 cells (Figure 2F). These findings implied that ZFAS1 influenced tumor growth in PTC progression.
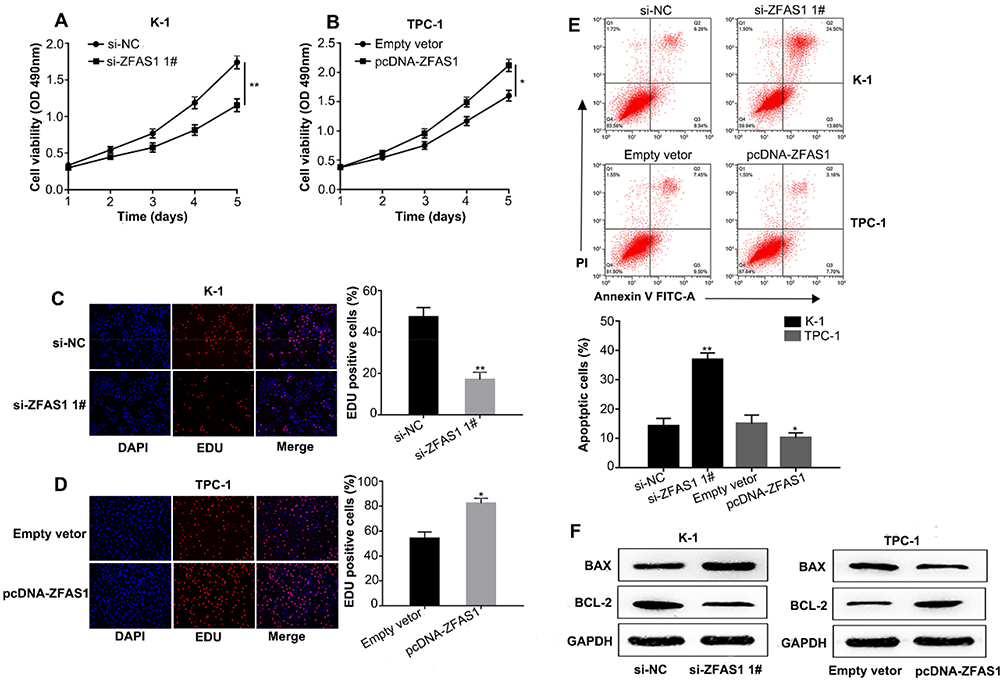 |
Figure 2 Effects of ZFAS1 on PTC cells proliferation and apoptosis. Notes: (A, C) The cell growth rates were determined by performing CCK-8 and Edu assays. Knockdown of ZFAS1 expression in K-1 cells significantly suppressed cell proliferation, relative to control cells. (B, D) The cell growth rates were detected by performing CCK-8 and Edu assays. Overexpression of ZFAS1 in TPC-1 cells significantly enhanced cell proliferation, relative to control cells. (E) The apoptosis rates of K-1 cells were increased in si-ZFAS1 groups compared with si-NC groups and the apoptosis rates of TPC-1 cells were decreased in pcDNA-ZFAS1 groups compared with Empty vetor groups. (F) The protein levels of BAX and BCL-2 as determined by Western blot analysis in K-1 cells transfected with si-ZFAS1 or si-NC and in TPC-1 cells transfected with pcDNA-ZFAS1 or Empty vetor. *P<0.05, **P<0.01.Abbreviations: CCK-8, cell counting kit-8; Edu, 5-Ethynyl-2ʹ-deoxyuridine; NC, negative control. |
ZFAS1 negatively regulated miR-590-3p
Recent studies found that lncRNA might act as a competing endogenous RNA (ceRNA) to regulate the expression and function of miRNAs. In this study, the bioinformatics online tool Starbase v2.0 (http://starbase.sysu.edu.cn/) was used to predict the complementary region at the 3ʹ-UTR of ZFAS1 and miR-590-3p (Figure 3A). Moreover, based on the luciferase reporter assay, we confirmed that overexpression of miR-590-3p reduced the luciferase activity of ZFAS1-Wt, but this effect was not observed in ZFAS1-Mut (Figure 3B). Results of qRT-PCR assay showed that si-ZFAS1 transfection significantly increased the expression level of miR-590-3p in K-1 cells and pcDNA-ZFAS1 transfection decreased the expression level of miR-590-3p in TPC-1 cells (Figure 3C). To support these observations, we examined the miR-590-3p expression in PTC tissues. We found that miR-590-3p was significantly decreased in PTC tissues compared with adjacent normal tissues (Figure 3D). Pearson’s correlation analysis revealed that ZFAS1 was negatively correlated with miR-590-3p expression in 80 PTC samples (Figure 3E). The qRT-PCR results showed that the expression level of miR-590-3p was significantly decreased in the four PTC cell lines compared with non-tumor thyroid follicular epithelial cell line Nthy-ori 3-1 (Figure 3F). RNA immunoprecipitation experiments comfirmed that both miR-590-3p and ZFAS1 were present in the Ago2-pulled down pellet (Figure 3G and H). Collectively, these results suggested that miR-590-3p targeted the 3ʹ-UTR of ZFAS1 and was negatively correlated with ZFAS1 expression.
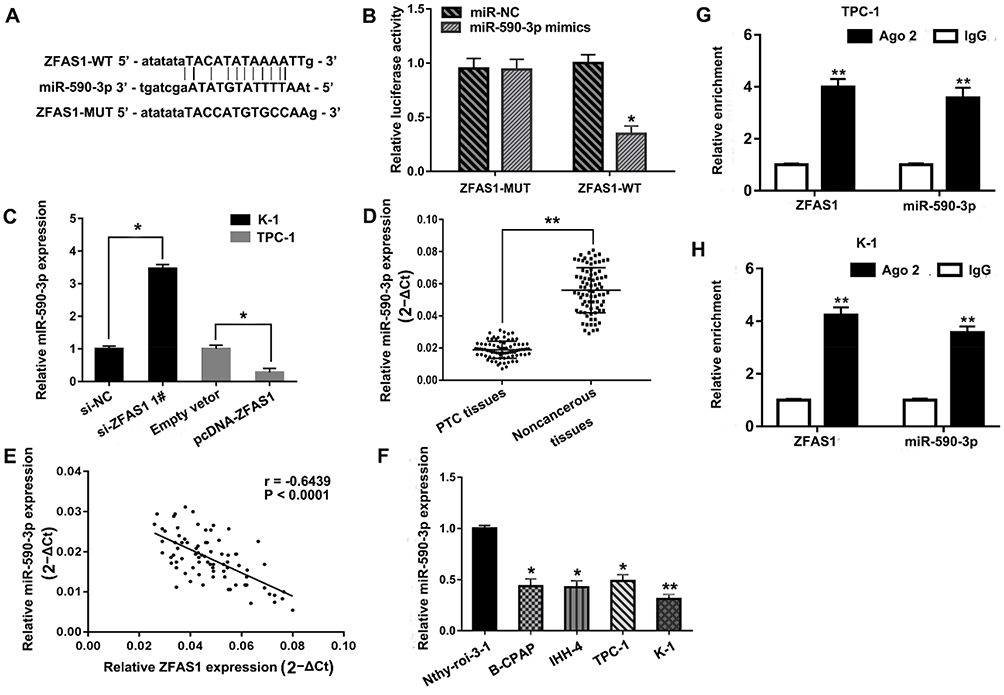 |
Figure 3 ZFAS1 negatively regulated miR-590-3p. Notes: (A) Bioinformatics analysis showed the prediction for miR-590-3p binding sites on ZFAS1. (B) Luciferase activity in HEK 293T cells co-transfected with miR-590-3p mimics or miR-NC and luciferase reporters containing wild type ZFAS1 or mutant ZFAS1. (C) Relative expression of ZFAS1 in K-1 cells transfected with si-ZFAS1 or si-NC and in TPC-1 cells transfected with pcDNA-ZFAS1 or Empty vetor. (D) Relative expression levels of miR-590-3p in 80 pairs of PTC tissues and adjacent noncancerous tissues. (E) The correlation between ZFAS1 and miR-590-3p expression were measured in 80 PTC tissues by Pearson correlation analysis. (r=−0.5380, P<0.0001). (F) Relative expression levels of miR-590-3p in human thyroid follicular epithelial cell line Nthy-ori 3-1 and four PTC cell lines (B-CPAP, IHH-4, TPC-1 and K-1). (G) Association of ZFAS1 and miR-590-3p with Ago2 in K-1 cells. (H) Association of ZFAS1 and miR-590-3p with Ago2 in TPC-1 cells. *P<0.05, **P<0.01.Abbreviations: WT, wild‑type; MUT, mutant, NC, negative control. |
ZFAS1 promotes PTC cell proliferation and inhibits apoptosis by targeting miR-590-3p in vitro
To determine whether the effects of ZFAS1 were mediated by miR-590-3p, we performed rescue experiments using the CCK-8 and Edu assays. The results demonstrated that knockdown of ZFAS1 decreased K-1 cells proliferation, while co-transfection of miR-590-3p inhibitors and si-ZFAS1 eliminated the effects caused by si-ZFAS1 (Figure 4A and C). Similarly, co-transfection of miR-590-3p mimics and pcDNA-ZFAS1 abolished the increase in proliferation of TPC-1 cells caused by pcDNA-ZFAS1 (Figure 4B and D). As shown in Figure 4E, the rate of apoptosis in K-1 cells was increased in si-ZFAS1 group, while that of the co-transfected si-ZFAS1 and miR-590-3p inhibitors groups was decreased. Furthermore, the rate of apoptosis in TPC-1cells was decreased in pcDNA-ZFAS1 group, while the rate of apoptosis in the co-transfected pcDNA-ZFAS1 and miR-590-3p mimics groups was increased. The protein levels of BAX and BCL-2 showed a similar trend to the above results (Figure 4F and G). Together, these results indicated that ZFAS1 promoted the progression of PTC cells by regulating miR-590-3p.
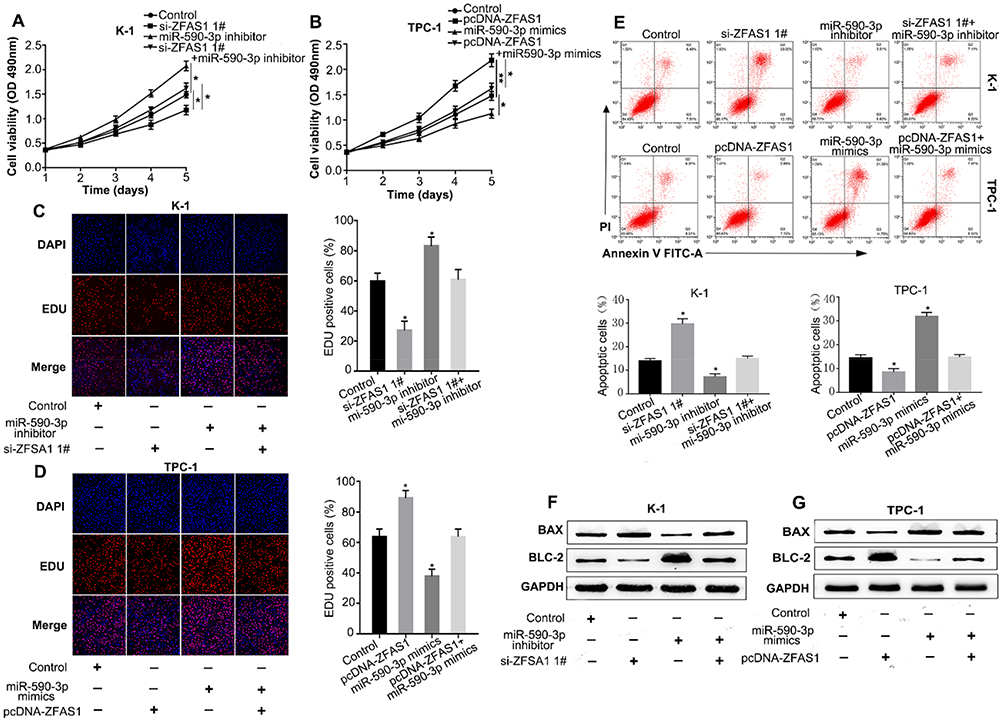 |
Figure 4 ZFAS1 promoted cell proliferation and inhibited apotosis by regulating miR-590-3p. Notes: (A) CCK-8 assay was used to determine the cell viability by transfecting si-NC, si-ZFAS1, miR-590-3p inhibitor or si-ZFAS1+ miR-590-3p inhibitor into K-1 cell. (B) CCK-8 assay was used to determine the cell viability by transfecting Empty vetor, pcDNA-ZFAS1, miR-590-3p mimics or pcDNA-ZFAS1+ miR-590-3p mimics into TPC-1 cell. (C, D) Similarly, cell viability also was detected by the Edu assay in K-1 cells and TPC-1 cells. (E) Apoptosis of K-1 cells cotransfected with si-NC, si-ZFAS1, miR-590-3p inhibitor or si-ZFAS1+ miR-590-3p, and apoptosis of TPC-1 cells cotransfected with Empty vetor, pcDNA-ZFAS1, miR-590-3p mimics or pcDNA-ZFAS1+ miR-590-3p mimics. (F) Effect of si-NC, si-ZFAS1, miR-590-3p inhibitor or si-ZFAS1+ miR-590-3p on BAX and BCL-2 protein levels in K-1 cells. (G) Effect of Empty vetor, pcDNA-ZFAS1, miR-590-3p mimics or pcDNA-ZFAS1+ miR-590-3p mimics on BAX and BCL-2 protein levels in TPC-1 cells. *P<0.05, **P<0.01.Abbreviation: NC, negative control. |
ZFAS1 promotes HMGA2 expression by regulating miR-590-3p
Using bioinformatics software (miRanda and TargetScan), we found that HMGA2 contains the binding sites for miR-590-3p. Two potential binding sites for miR-590-3p, 3ʹUTR-HMGA2-WT and 3ʹUTR-HMGA2-MUT were constructed in HMGA2 luciferase reporter gene vectors (Figure 5A). Luciferase assay demonstrated that overexpression of miR-590-3p suppressed the luciferase activity of 3ʹUTR-HMGA2-WT but not 3ʹUTR-HMGA2-MUT in HEK293T cells (Figure 5B), suggesting that HMGA2 was a direct target of miR-590-3p. Transfection of pcDNA, pcDNA-ZFAS1, miR-590-3p mimic, and pcDNA-ZFAS1+ miR-590-3p mimic into TPC-1 cells showed that miR-590-3p mimic reduced the mRNA level of HMGA2 in TPC-1 cells, but co-transfection with pcDNA-ZFAS1 and miR-590-3p mimic reversed these effects (Figure 5C). Transfection of si-NC, si-ZFAS1, miR-590-3p inhibitor, and si-ZFAS1+ miR-590-3p inhibitor into K-1 cells revealed that miR-590-3p inhibitor promoted the mRNA level of HMGA2 in K-1 cells, but co-transfection with si-ZFAS1 and miR-590-3p inhibitor eliminated these effects (Figure 5D). We further measured the HMGA2 expression in PTC tissues. We observed that HMGA2 was significantly increased in PTC tissues compared with adjacent normal tissues (Figure 5E). Additionally, Pearson’s correlation analysis showed that HMGA2 expression was inversely correlated with miR-590-3p expression in PTC tissues (Figure 5F). In contrast, HMGA2 expression was positively correlated with ZFAS1 expression in PTC tissues (Figure 5G). Similar results were obtained in Western blot analysis (Figure 5H and I). These findings showed that ZFAS1 upregulated the HMGA2 expression by downregulating miR-590-3p in PTC cells.
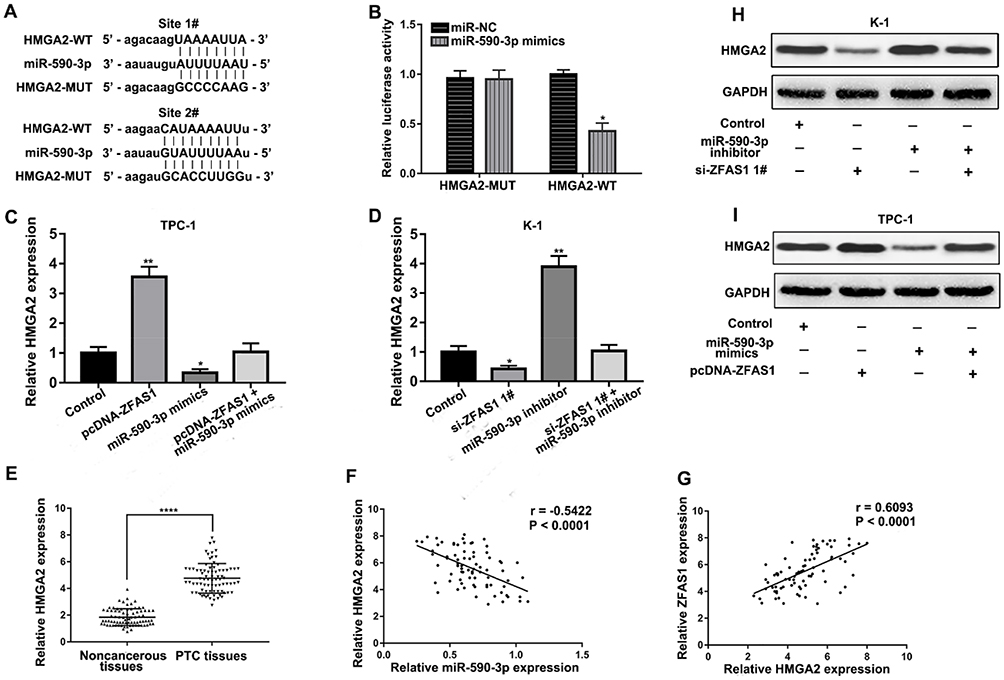 |
Figure 5 ZFAS1 promotes HMGA2 expression by regulating miR-590-3p. Notes: (A) The candidate binding sites of miR-590-3p in HMGA2 mRNA 3ʹ-UTR. (B) Luciferase activity in HEK 293T cells co-transfected with miR-590-3p mimics or miR-NC and luciferase reporters containing wild type HMGA2 or mutant HMGA2. (C) The relative mRNA expression of HMGA2 was detected by transfecting with Empty vetor, pcDNA-ZFAS1, miR-590-3p mimics or pcDNA-ZFAS1+ miR-590-3p mimics in TPC-1 cells. (D) The relative mRNA expression of HMGA2 was detected by transfecting with si-NC, si-ZFAS1, miR-590-3p inhibitor, or si-ZFAS1+ miR-590-3p inhibitor in K-1 cells. (E) Relative expression levels of HMGA2 in 80 pairs of PTC tissues and adjacent noncancerous tissues. (F) The correlation between HMGA2 and miR-590-3p expression were measured in 80 PTC tissues by Pearson correlation analysis. (r = −0.5422, P<0.0001). (G) The correlation between ZFAS1 and HMGA2 expression were measured in 80 PTC tissues by Pearson correlation analysis. (r =0.6093, P<0.0001). (H, I) The relative protein expression of HMGA2 was analyzed by transfecting with transfecting with si- NC, si-ZFAS1, miR- 590-3p inhibitor, or si-ZFAS1+ miR-590-3p inhibitor into K-1 cells or transfecting with Empty vetor, pcDNA- ZFAS1, miR-590-3p mimics, or pcDNA-ZFAS1+ miR-590-3p mimics into TPC-1 cells. *P<0.05, **P<0.01, ****P<0.0001. Abbreviations: NC, negative control, PTC, papillary thyroid carcinoma. |
ZFAS1 promotes PTC cell proliferation in vivo
To investigate the role of ZFAS1 on PTC tumor growth, we performed a xenograft model experiment in vivo. Results showed that sh-ZFAS1 markedly decreased the tumor volumes compared to the control group (Figure 6A and B), the pcDNA-ZFAS1 prominently increased tumor volumes compared to the control group (Figure 6C and D). Thus, these findings indicate that ZFAS1 could promote PTC growth in vivo.
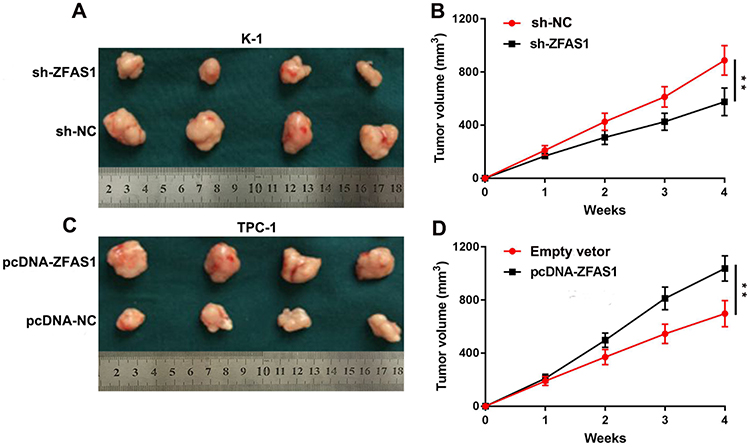 |
Figure 6 ZFAS1 promotes PTC cell proliferation in vivo. Notes: (A) The stable ZFAS1 knockdown K-1 cells were used for in vivo experiments. The nude mice carrying tumors from control and sh-ZFAS1 group were shown. (B) Tumor volume curves were measured every 1 weeks after the injection of K-1 cells. (C) The stable ZFAS1 overexpression TPC-1 cells were used for in vivo experiments. The nude mice carrying tumors from empty vetor and pcDNA-ZFAS1 group were shown. (D) Tumor volume curves were measured every 1 weeks after the injection of TPC-1 cells. **P<0.01.Abbreviations: sh, short hairpin RNA. |
Discussion
In our present study, we found that ZFAS1 was remarkably upregulated in PTC tissues and cell lines. Moreover, functional analysis showed that ZFAS1 promoted PTC cell proliferation, but inhibited apoptosis. Additionally, mechanistic experiments demonstrated that ZFAS1 triggers tumor-promoting effects through the miR-590-3p/HMGA2 axis in PTC.
Multiple studies have reported that lncRNAs play vital roles in the initiation and development of various cancers. But, fewer studies have investigated their contribution to PTC. In previous reports, it was found that upregulation of ZFAS1 promoted cell proliferation and inhibited apoptosis in Acute Myelocytic Leukemia cells.30 ZFAS1 promotes glioma cell progression by activating the Notch signaling pathway and is associated with poor prognosis in patients with gliomas.31 Knockdown of ZFAS1 inhibits the proliferation, cell cycle progress, migration, invasion, and EMT due to inactivation of the Wnt/β-catenin signaling in gastric cancer cells.32 Delivery of ZFAS1 by exosomes promotes gastric cancer cell proliferation and migration and therefore it may be used as a diagnostic biomarker for gastric cancer.33 ZFAS1 was highly expressed and may serve as a potential biomarker for predicting the prognosis of thyroid cancer.34 In the current study, we found that ZFAS1 was upregulated in PTC tissues and cell lines, and the high ZFAS1 expression was correlated with tumor sizes. These data sets suggested that ZFAS1 is dysregulated in PTC, and might function as an oncogene in the tumorigenesis of PTC. To explore this hypothesis, the function of ZFAS1 was investigated using different experiments. We observed that ZFAS1 promoted cell proliferation and inhibited PTC cell apoptosis. We showed that ZFAS1 promoted tumor growth in vivo. Thus, these results indicated that ZFAS1 acted as an oncogene in PTC.
Other studies indicated that lncRNA containing miRNA binding sites could act as competitive endogenous RNA (ceRNA)35 and some studies demonstrated that lncRNA and miRNA interact.36–38 In bladder cancer, ZFAS1 promotes cell proliferation, invasion and inhibits cell apoptosis by sponging miR-329.39 Similarly, ZFAS1 enhances epithelial ovarian cancer cell proliferation, migration, invasion, and chemo-resistance by directly binding to miR-150-5p which targets Sp1.40 In the present study, we identified miR-590-3p as a direct target of ZFAS1 using the luciferase activity and RIP assays. Moreover, we found that low miR-590-3p expression was negatively associated with higher ZFAS1 expression in PTC samples. Further experiments demonstrated that ZFAS1 knockdown up-regulated the mRNA level of miR-590-3p while overexpression of ZFAS1 had an opposite effect in PTC cells. Previous studies showed that miR-590-3p functions as a tumor suppressor in various cancers.41,42 Our results are consistent with these previous findings. Furthermore, we found that ZFAS1 promoted PTC cell proliferation in addition to preventing cell apoptosis by negatively regulating miR-590-3p. Thus, these results revealed a novel regulatory target for ZFAS1 in PTC.
Previous investigations have shown that HMGA2 gene is a novel molecular marker that can distinguish benign from malignant human thyroid nodules.43–45 In addition, miRNA-204 was found to inhibit the proliferation of in thyroid cancer cells by targeting HMGA2.46 In this study, we used predictive tools and luciferase reporter gene assay analysis to demonstrate that HMGA2 is a target of miR-590-3p in PTC cells. Moreover, the expression of miR-590-3p was inversely correlated with HMGA2 expression in PTC tissues. These results impiled that ZFAS1 knockdown inhibited HMGA2 expression, while co-transfection of miR-590-3p inhibitor and si-ZFAS1 reversed the effects induced by si-ZFAS1. Up-regulating ZFAS1 expression enhanced HMGA2 expression, but co-transfection of miR-590-3p mimic and pcDNA-ZFAS1 reversed the effects induced by pcDNA-ZFAS1. Thus, these results showed that HMGA2 was a direct downstream target of ZFAS1.
In conclusion, this study presents a novel mechanism of ZFAS1 in the tumorigenesis of PTC. We demonstrate that ZFAS1 is increased in PTC tissues and cell lines. ZFAS1 promoted PTC cell growth and inhibited cell apoptosis in vitro. Our in vivo animal study data also showed that ZFAS1 promoted PTC cell growth. Furthermore, these data-sets shows that ZFAS1 directly interacts with miR-590-3p to influence PTC cell proliferation and apoptosis in vitro. Moreover, we confirmed that ZFAS1 inhibited HMGA2 expression by sponging -miR-590-3p in PTC cells. Our findings reveal that the ZFAS1/miR-590-3p/HMGA2 axis is involved PTC cell growth nd apoptosis, which indicates that this pathway might be a potential therapeutic target for PTC treatment.
Disclosure
The authors declare that they have no competing interests in this work.
References
1. Kilfoy BA, Zheng T, Holford TR, et al. International patterns and trends in thyroid cancer incidence, 1973–2002. Cancer Causes Control. 2008;20(5):525–531. doi:10.1007/s10552-008-9260-4
2. Pellegriti G, Frasca F, Regalbuto C, Squatrito S, Vigneri R. Worldwide increasing incidence of thyroid cancer: update on epidemiology and risk factors. J Cancer Epidemiol. 2013;2013:965212. doi:10.1155/2013/965212
3. Siegel RL, Miller KD, Jemal A. Cancer statistics, 2018. CA Cancer J Clin. 2018;68(1):7–30. doi:10.3322/caac.21442
4. Gimm O. Thyroid cancer. Cancer Lett. 2001;163(2):143–156. doi:10.1016/s0304-3835(00)00697-2
5. Hundahl SA, Fleming ID, Fremgen AM, Menck HR. A National Cancer Data Base report on 53,856 cases of thyroid carcinoma treated in the U.S., 1985-1995 [see commetns]. Cancer. 1998;83(12):2638–2648. doi:10.1002/(sici)1097-0142(19981215)83:12<2638::aid-cncr31>3.0.co;2-1
6. Lundgren CI, Hall P, Dickman PW, Zedenius J. Clinically significant prognostic factors for differentiated thyroid carcinoma: a population-based, nested case-control study. Cancer. 2006;106(3):524–531. doi:10.1002/cncr.21653
7. Wahlestedt C. Targeting long non-coding RNA to therapeutically upregulate gene expression. Nat Rev Drug Discov. 2013;12(6):433–446. doi:10.1038/nrd4018
8. Ponting CP, Oliver PL, Reik W. Evolution and functions of long noncoding RNAs. Cell. 2009;136(4):629–641. doi:10.1016/j.cell.2009.02.006
9. Dey BK, Mueller AC, Dutta A. Long non-coding RNAs as emerging regulators of differentiation, development, and disease. Transcription. 2014;5(4):e944014. doi:10.4161/21541272.2014.944014
10. Guttman M, Rinn JL. Modular regulatory principles of large non-coding RNAs. Nature. 2012;482(7385):339–346. doi:10.1038/nature10887
11. Chen LL. Linking long noncoding RNA localization and function. Trends Biochem Sci. 2016;41(9):761–772. doi:10.1016/j.tibs.2016.07.003
12. Chen X, Sun Y, Cai R, Wang G, Shu X, Pang W. Long noncoding RNA: multiple players in gene expression. BMB Rep. 2018;51:280–289. doi:10.5483/BMBRep.2018.51.6.025
13. Spizzo R, Almeida MI, Colombatti A, Calin GA. Long non-coding RNAs and cancer: a new frontier of translational research? Oncogene. 2012;31(43):4577–4587. doi:10.1038/onc.2011.621
14. Qin Y, Sun W, Zhang H, et al. LncRNA GAS8-AS1 inhibits cell proliferation through ATG5-mediated autophagy in papillary thyroid cancer. Endocrine. 2018;59(3):555–564. doi:10.1007/s12020-017-1520-1
15. Dai W, Tian Y, Jiang B, Chen W. Down-regulation of long non-coding RNA AFAP1-AS1 inhibits tumor growth, promotes apoptosis and decreases metastasis in thyroid cancer. Biomed Pharmacother. 2018;99:191–197. doi:10.1016/j.biopha.2017.12.105
16. Lan X, Sun W, Dong W, et al. Downregulation of long noncoding RNA H19 contributes to the proliferation and migration of papillary thyroid carcinoma. Gene. 2018;646:98–105. doi:10.1016/j.gene.2017.12.051
17. Zhang H, Cai Y, Zheng L, Zhang Z, Lin X, Jiang N. Long noncoding RNA NEAT1 regulate papillary thyroid cancer progression by modulating miR-129-5p/KLK7 expression. J Cell Physiol. 2018.
18. Liang L, Xu J, Wang M, et al. LncRNA HCP5 promotes follicular thyroid carcinoma progression via miRNAs sponge. Cell Death Dis. 2018;9(3):372. doi:10.1038/s41419-018-0382-7
19. Huang JK, Ma L, Song WH, et al. LncRNA-MALAT1 promotes angiogenesis of thyroid cancer by modulating tumor-associated macrophage FGF2 protein secretion. J Cell Biochem. 2017;118(12):4821–4830. doi:10.1002/jcb.26153
20. Di W, Li Q, Shen W, Guo H, Zhao S. The long non-coding RNA HOTAIR promotes thyroid cancer cell growth, invasion and migration through the miR-1-CCND2 axis. Am J Cancer Res. 2017;7(6):1298–1309.
21. Hansji H, Leung EY, Baguley BC, et al. ZFAS1: a long noncoding RNA associated with ribosomes in breast cancer cells. Biol Direct. 2016;11(1):62. doi:10.1186/s13062-016-0165-y
22. Wang W, Xing C. Upregulation of long noncoding RNA ZFAS1 predicts poor prognosis and prompts invasion and metastasis in colorectal cancer. Pathol Res Pract. 2016;212(8):690–695. doi:10.1016/j.prp.2016.05.003
23. Tian FM, Meng FQ, Wang XB. Overexpression of long-noncoding RNA ZFAS1 decreases survival in human NSCLC patients. Eur Rev Med Pharmacol Sci. 2016;20(24):5126–5131.
24. Zhou H, Wang F, Chen H, et al. Increased expression of long-noncoding RNA ZFAS1 is associated with epithelial-mesenchymal transition of gastric cancer. Aging. 2016;8(9):2023–2038. doi:10.18632/aging.101048
25. Li T, Xie J, Shen C, et al. Amplification of long noncoding RNA ZFAS1 promotes metastasis in hepatocellular carcinoma. Cancer Res. 2015;75(15):3181–3191. doi:10.1158/0008-5472.CAN-14-3721
26. Liu G, Wang L, Han H, et al. LncRNA ZFAS1 promotes growth and metastasis by regulating BMI1 and ZEB2 in osteosarcoma. Am J Cancer Res. 2017;7(7):1450–1462.
27. Cancer Genome Atlas Project (TCGA) [cited July 25, 2019]. Available from: http://cancergenome.nih.gov/.
28. Deng M, Elmann J, Schultze JL, Perner S. Web-TCGA: an online platform for integrated analysis of molecular cancer data sets. BMC Bioinformatics. 2016;17:72. doi:10.1186/s12859-016-0917-9
29. Chandran U, Medvedeva O, Barmada MM, et al. TCGA expedition: a data acquisition and management system for TCGA data. PLoS One. 2016;11(10):e0165395. doi:10.1371/journal.pone.0165395
30. Guo H, Wu L, Zhao P, Feng A. Overexpression of long non-coding RNA zinc finger antisense 1 in acute myeloid leukemia cell lines influences cell growth and apoptosis. Exp Ther Med. 2017;14(1):647–651. doi:10.3892/etm.2017.4535
31. Gao K, Ji Z, She K, Yang Q, Shao L. Long non-coding RNA ZFAS1 is an unfavourable prognostic factor and promotes glioma cell progression by activation of the Notch signaling pathway. Biomed Pharmacother. 2017;87:555–560. doi:10.1016/j.biopha.2017.01.014
32. Xu W, He L, Li Y, Tan Y, Zhang F, Xu H. Silencing of lncRNA ZFAS1 inhibits malignancies by blocking Wnt/β-catenin signaling in gastric cancer cells. Biosci Biotechnol Biochem. 2018;82(3):456–465. doi:10.1080/09168451.2018.1431518
33. Pan L, Liang W, Fu M, et al. Exosomes-mediated transfer of long noncoding RNA ZFAS1 promotes gastric cancer progression. J Cancer Res Clin Oncol. 2017;143(6):991–1004. doi:10.1007/s00432-017-2361-2
34. Han CG, Huang Y, Qin L. Long non-coding RNA ZFAS1 as a novel potential biomarker for predicting the prognosis of thyroid cancer. Med Sci Monit. 2019;25:2984–2992. doi:10.12659/MSM.912921
35. Tay Y, Rinn J, Pandolfi PP. The multilayered complexity of ceRNA crosstalk and competition. Nature. 2014;505(7483):344–352. doi:10.1038/nature12986
36. Chen EG, Zhang JS, Xu S, Zhu XJ, Hu HH. Long non-coding RNA DGCR5 is involved in the regulation of proliferation, migration and invasion of lung cancer by targeting miR-1180. Am J Cancer Res. 2017;7(7):1463–1475.
37. Ba Z, Gu L, Hao S, Wang X, Cheng Z, Nie G. Downregulation of lncRNA CASC2 facilitates osteosarcoma growth and invasion through miR-181a. Cell Prolif. 2018;51(1):e12409. doi:10.1111/cpr.2018.51.issue-1
38. Han P, Li JW, Zhang BM, et al. The lncRNA CRNDE promotes colorectal cancer cell proliferation and chemoresistance via miR-181a-5p-mediated regulation of Wnt/β-catenin signaling. Mol Cancer. 2017;16(1):9. doi:10.1186/s12943-017-0583-1
39. Wang JS, Liu QH, Cheng XH, Zhang WY, Jin YC. The long noncoding RNA ZFAS1 facilitates bladder cancer tumorigenesis by sponging miR-329. Biomed Pharmacother. 2018;103:174–181. doi:10.1016/j.biopha.2018.04.031
40. Xia B, Hou Y, Chen H, et al. Long non-coding RNA ZFAS1 interacts with miR-150-5p to regulate Sp1 expression and ovarian cancer cell malignancy. Oncotarget. 2017;8(12):19534–19546. doi:10.18632/oncotarget.14663
41. Zhang J, Jin M, Chen X, et al. Loss of PPM1F expression predicts tumour recurrence and is negatively regulated by miR-590-3p in gastric cancer. Cell Prolif. 2018;51:e12444. doi:10.1111/cpr.12444
42. Pang H, Zheng Y, Zhao Y, Xiu X, Wang J. miR-590-3p suppresses cancer cell migration, invasion and epithelial-mesenchymal transition in glioblastoma multiforme by targeting ZEB1 and ZEB2. Biochem Biophys Res Commun. 2015;468(4):739–745. doi:10.1016/j.bbrc.2015.11.025
43. Belge G, Meyer A, Klemke M, et al. Upregulation of HMGA2 in thyroid carcinomas: a novel molecular marker to distinguish between benign and malignant follicular neoplasias. Genes Chromosomes Cancer. 2008;47(1):56–63. doi:10.1002/gcc.20505
44. Chiappetta G, Ferraro A, Vuttariello E, et al. HMGA2 mRNA expression correlates with the malignant phenotype in human thyroid neoplasias. Eur J Cancer. 2008;44(7):1015–1021. doi:10.1016/j.ejca.2008.02.039
45. Lappinga PJ, Kip NS, Jin L, et al. HMGA2 gene expression analysis performed on cytologic smears to distinguish benign from malignant thyroid nodules. Cancer Cytopathol. 2010;118(5):287–297. doi:10.1002/cncy.20095
46. Wu ZY, Wang SM, Chen ZH, et al. MiR-204 regulates HMGA2 expression and inhibits cell proliferation in human thyroid cancer. Cancer Biomarkers. 2015;15(5):535–542. doi:10.3233/CBM-150492
 © 2019 The Author(s). This work is published and licensed by Dove Medical Press Limited. The
full terms of this license are available at https://www.dovepress.com/terms
and incorporate the Creative Commons Attribution
- Non Commercial (unported, 3.0) License.
By accessing the work you hereby accept the Terms. Non-commercial uses of the work are permitted
without any further permission from Dove Medical Press Limited, provided the work is properly
attributed. For permission for commercial use of this work, please see paragraphs 4.2 and 5 of our Terms.
© 2019 The Author(s). This work is published and licensed by Dove Medical Press Limited. The
full terms of this license are available at https://www.dovepress.com/terms
and incorporate the Creative Commons Attribution
- Non Commercial (unported, 3.0) License.
By accessing the work you hereby accept the Terms. Non-commercial uses of the work are permitted
without any further permission from Dove Medical Press Limited, provided the work is properly
attributed. For permission for commercial use of this work, please see paragraphs 4.2 and 5 of our Terms.