Back to Journals » OncoTargets and Therapy » Volume 12
Long noncoding RNA LINC-PINT promotes proliferation through EZH2 and predicts poor prognosis in clear cell renal cell carcinoma
Authors Duan J ![]() , Ma X, Shi J, Xuan Y, Wang H, Li P, Zhang Y, Fan Y, Gong H, Ma X, Pang Y, Wang L
, Ma X, Shi J, Xuan Y, Wang H, Li P, Zhang Y, Fan Y, Gong H, Ma X, Pang Y, Wang L ![]() , Yan Y, Zhang X
, Yan Y, Zhang X
Received 25 January 2019
Accepted for publication 16 May 2019
Published 19 June 2019 Volume 2019:12 Pages 4729—4740
DOI https://doi.org/10.2147/OTT.S202938
Checked for plagiarism Yes
Review by Single anonymous peer review
Peer reviewer comments 2
Editor who approved publication: Dr Sanjeev K. Srivastava
Junyao Duan,1 Xin Ma,2 Jing Shi,1 Yundong Xuan,2 Hanfeng Wang,2 Pin Li,3 Yu Zhang,2 Yang Fan,2 Huijie Gong,1 Xuetao Ma,1 Yuewen Pang,1 Ling Wang,1 Yongji Yan,1 Xu Zhang2
1Department of Urology, Dongzhimen Hospital Affiliated to Beijing University of Chinese Medicine, Beijing 100700, People’s Republic of China; 2Department of Urology, State Key Laboratory of Kidney Diseases, PLA Medical School, Chinese People’s Liberation Army General Hospital, Beijing 100853, People’s Republic of China; 3School of Medicine, Nankai University, Tianjin 300071, People’s Republic of China
Background: Renal cell carcinoma (RCC) is one of the most common types of urological malignant tumors. Despite recent advances in diagnosis and management of RCC, its prognosis remains poor. Emerging evidence has shown that long noncoding RNAs (lncRNAs) play crucial regulatory roles in cancer biology.
Materials and methods: The most abundant transcript of long intergenic non-protein coding RNA p53 induced transcript (LINC-PINT) in clear cell RCC (ccRCC) was determined by RT-PCR. Quantitative real-time PCR was performed to examine LINC-PINT expression in paired ccRCC samples and cell lines. The relationship of LINC-PINT expression with clinicopathologic characteristics and clinical outcome was analyzed. The biological function of LINC-PINT was studied by MTS and colony formation. The flow cytometry was used to analyze cell cycle distribution and apoptosis. The subcelluar fractionation and RIP assay was performed to explore the molecular mechanism of LINC-PINT. Western blotting and immunofluorescence was carried out to examine EZH2 and p53.
Results: We found that the LINC-PINT was frequently upregulated in ccRCC samples. Furthermore, we observed that the level of LINC-PINT depended on gender as well as on pT and TNM stage of patients with ccRCC. Moreover, patients with high LINC-PINT expression had poor disease-free survival and overall survival. Functionally, overexpression of LINC-PINT promoted ccRCC cell proliferation, induced cell cycle progression, and inhibited apoptosis. LINC-PINT was primarily located in cell nuclei and interacted with EZH2. When EZH2 was knocked down in 769P and OS-RC-2 cells overexpressing LINC-PINT, the effect of LINC-PINT on cell proliferation, cell cycle, and apoptosis was partially reversed. Additionally, inducing p53 by doxorubicin (Dox) promoted LINC-PINT expression.
Conclusion: Collectively, our results provide novel insights into the important role of LINC-PINT in ccRCC development and indicate that LINC-PINT may serve as a valuable prognostic biomarker for ccRCC.
Keywords: long noncoding RNA, LINC-PINT, clear cell renal cell carcinoma, prognosis, cell proliferation, EZH2
Introduction
Renal cell carcinoma (RCC) arising from the renal tubule epithelium is one of the 10 most common cancers worldwide. Every year, 295,000 new cases are diagnosed, and 134,000 deaths occur globally. Clear cell renal cell carcinoma (ccRCC) represents 75% of these cases.1 Over the last several decades, mortality rate due to ccRCC has been decreasing, but the incidence rate is consistently increasing.2 On diagnosis, 25% of the patients present with advanced and metastatic disease.3 For patients with surgically resectable RCC, either partial or radical nephrectomy is performed with curative intent. In contrast, those without a surgical option can only undergo therapy with targeted agents and/or immune checkpoint inhibitors. These treatments have low response rates and only prolong patient survival by 1–2 years.1 Despite intensive research, early markers of diagnosis, prognosis, or responsiveness to therapy in RCC remain controversial, and few markers have been identified and validated in routine clinical practice.4
Long noncoding RNAs (lncRNAs) are a subclass of transcripts longer than 200 bp without identifiable open reading frames or protein-coding capacity that are derived from intergenic regions (the antisense strand of a given gene), introns of protein-coding genes, or due to alternative splicing.5 LncRNAs, which are aberrantly expressed in a broad spectrum of cancers, promote and maintain tumor development and progression, as well as provide prognostic value and therapeutic options for patients with cancer. For example, high expression of metastasis-associated lung adenocarcinoma transcript 1 (MALAT1) promotes migration by actively regulating the expression of a set of metastasis-associated genes and is highly predictive of poor outcome of early stage non-small cell lung cancer.6,7 Increased expression of HOX transcript antisense RNA (HOTAIR) has been revealed in different primary and metastatic tumors, including breast cancer, hepatocellular carcinoma, and gastrointestinal tract tumors, and elevated levels of HOTAIR can be used to predict poor prognosis. Loss of HOTAIR in epithelial cancer cells inhibits invasiveness in a polycomb repressive complex 2 (PRC2)-dependent manner.8–10 Several lncRNAs have been reported to be involved in RCC. Hirata et al reported that MALAT1 expression is higher in RCC tissues, where it negatively correlates with patient survival, and when MALAT1 is silenced, RCC cell proliferation and invasion rates decrease but the rate of apoptosis increases. MALAT1 can be transcriptionally activated by c-Fos and can interact with enhancer of zeste homolog 2 (EZH2) and miR-205.11 lncRNA-suppressing androgen receptor in renal cell carcinoma (SARCC) could function as a key modulator of hypoxia signaling, connecting lncRNA-SARCC with the androgen receptor (AR)/hypoxia inducible factor-2α (HIF-2α)/C-MYC axis for regulating RCC cell proliferation in response to hypoxia.12 Another study has revealed that the level of lncRNA activated in RCC with sunitinib resistance (lncARSR) is associated with poor response to sunitinib; in vitro and in vivo experiments have demonstrated that lncARSR promotes sunitinib resistance through competitively binding miR-34/miR-449 to upregulate AXL and c-MET expression in RCC cells. Furthermore, lncARSR can be transmitted to sensitive cells through exosomes.13 However, the role and mechanism of long intergenic non-protein coding RNA, p53 induced transcript (LINC-PINT) in ccRCC are still not understood. In this study, we determined the expression level of LINC-PINT in ccRCC tissues and examined whether LINC-PINT level was associated with disease-free survival (DFS) and overall survival (OS) of ccRCC. We explored the effects of LINC-PINT on ccRCC cells and identified downstream and upstream mechanisms of ccRCC regulation by LINC-PINT.
Materials and methods
Tissue samples
Ninety-eight ccRCC samples and 16 paired adjacent normal tissue samples were acquired from patients who underwent resection surgery from January 2010 to December 2010 at the Urology Department of the Chinese People’s Liberation Army (PLA) General Hospital (Beijing, China). All samples were preserved at −80°C until RNA extraction. Two senior pathologists confirmed ccRCC pathology in these tissue samples. Based on the 8th edition of the AJCC Cancer Staging Manual and Fuhrman nuclear grading system, TNM stages and nuclear grades of ccRCC samples were determined. The study was approved by the Ethics Committee of the Chinese PLA General Hospital. Written informed consent was obtained from all patients, and the study was in compliance with the Declaration of Helsinki and International Conference on Harmonization-Good Clinical Practice guidelines.
Cell lines and culture
The human renal proximal tubule epithelial cell line HKC and human ccRCC cell lines, viz., 786-O, A498, 769P, Caki-2, Caki-1, ACHN, OS-RC-2, and SN12-PM6, were obtained from the National Platform of Experimental Cell Resources for Sci-Tech (Beijing, China), cultured in RPMI 1640, McCoy’s 5A, or high-glucose DMEM (Hyclone, USA) media with 10% fetal bovine serum (TransGen Biotech, Beijing, China), 100 U/mL penicillin, and 100 μg/mL streptomycin (Solarbio, Beijing, China). All cells were maintained at 37°C in the atmosphere of 95% air and 5% CO2.
RT-PCR
Total RNA was isolated with TRIzol reagent (ComWin Biotech, Beijing, China), and RT-PCR was performed using a RT-PCR system (TIANGEN BIOTECH, Beijing, China) according to the manufacturers’ instructions. Amplified cDNA were then subjected to PCR with the following specific primers: P18, forward 5′-CGTGCGCATCATTTTCACCT-3′ and reverse 5′-TGGTTCCAGTCCCTCTTCCT-3′; P1, forward 5′-CGTGCGCATCATTTTCACCT-3′ and reverse 5′-TAACTCACAGGCCCACTGAC-3′; P2, forward 5′-CAGCAACTCCCTGGAACTCG-3′ and reverse 5′-CGTTAACACCGAGGGAGGAC-3′; P6, forward 5′-AAAGCATTAGGGGAGCCCAC-3′ and reverse 5′-CGCCAGTGACAGGAATCAGT-3′.
RNA extraction and quantitative real-time PCR
Total RNA was extracted from tissue specimens or cultured cells using TRIzol reagent (ComWin Biotech, Beijing, China) according to the manufacturer’s instructions. cDNA was generated by reverse transcription of 1 μg of total RNA using TransScript First-Strand cDNA Synthesis SuperMix (TransGen Biotech, Beijing, China). qRT-PCR was performed using TransStart Green qPCR SuperMix (TransGen Biotech) on an Applied Biosystems 7500 Detection System (Applied Biosystems, Foster City, CA, USA) to detect the expression of LINC-PINT, HOTAIR, MALAT1, U6, and GAPDH, with peptidylprolyl isomerase A (PPIA) transcript as reference. The primers for LINC-PINT were 5′-GAACGAGGCAAGGAGCTAAA-3′ and 5′-AGCAAGGCAGAGAAACTCCA-3′, primers for HOTAIR were 5′-GGTAGAAAAAGCAACCACGAAGC-3′ and 5′-ACATAAACCTCTGTCTGTGAGTGCC-3′, primers for MALAT1 were 5′-AAAGCAAGGTCTCCCCACAAG-3′ and 5′-GGTCTGTGCTAGATCAAAAGGCA-3′, primers for U6 were 5′-CTCGCTTCGGCAGCACA-3′ and 5′-AACGCTTCACGAATTTGCGT-3′, primers for GAPDH were 5′-ACCATCTTCCAGGAGCGAGA-3′ and 5′-GACTCCACGACGTACTCAGC-3′, and primers for PPIA were 5′-TCATCTGCACTGCCAAGACTG-3′ and 5′-CATGCCTTCTTTCACTTTGCC-3′.
Construction of vectors and stable cell lines
Full-length complementary DNA of LINC-PINT was synthesized by Tolo Biotech (Shanghai, China) and cloned into the lentiviral expression vector pLV-EGFP-(2A) Puro (Inovogen Tech. Co). The resulting construct was checked by sequencing. Viral particles were packaged by the 3-plasmid transient cotransfection method (Inovogen Tech. Co) following the manufacturer’s protocol. 769P and OS-RC-2 cells were infected with control lentivirus and LINC-PINT lentivirus and were stably selected with puromycin after 72 hrs of transduction.
Cell proliferation assay
A CellTiter 96® AQueous One Solution Cell Proliferation Assay Kit (Promega, USA) was used to perform the assay. Cells (2×10³) were seeded in 96-well plates and cultured for 24, 48, 72, and 96 hrs. Twenty microliters of the reagent was added into each well and incubated at 37°C for another 2 hrs. Absorbance at 490 nm was detected using a microplate reader (BioTek Instruments, USA).
Colony formation assay
The assay was performed as previously described.22 769P and OS-RC-2 cells overexpressing LINC-PINT and negative control cells were seeded into 6-well plates at a density of 1,000 cells per well. After culturing for another 2 weeks, the cells were fixed and stained for 30 mins in 35% methanol and 1% crystal violet solution. The area percentage of colonies was analyzed by the ImageJ software with ColonyArea plugin.
Flow cytometry analysis of cell cycle and apoptosis
Cell cycle analysis was performed using a DNA Content Quantitation Assay Kit (Solarbio, Beijing, China). The cells were fixed with ice-cold 70% ethanol at −4°C overnight and washed with ice-cold phosphate-buffered saline (PBS). Then, the cells were incubated at 37°C for 30 mins with 100 μL of RNase and stained with 400 μL of propidium iodide (PI) for 30 mins in the dark. Cells were counted using a BD FACSCalibur flow cytometer (Becton Dickinson, Franklin Lakes, NJ).
Apoptosis rates were estimated using an Annexin V-APC/7-AAD Kit (KeyGene BioTECH, Suzhou, China) according to the manufacturer’s recommendations.
Subcellular fractionation
To determine cellular localization of LINC-PINT, cytosolic and nuclear fractions were collected using a Nuclear/Cytoplasmic Isolation Kit (Biovision, USA). Briefly, the cells were lysed and centrifuged at 1,000 rpm for 10 mins at 4°C, and the supernatant was used as the cytosolic fraction. Then, the pellets were washed and incubated with RIPA buffer at 4°C for 10 mins and used as the nuclear fraction.
RIP assay
The RIP assay was performed using a Magna RIP™ RNA-Binding Protein Immunoprecipitation Kit (Millipore, USA). Briefly, cells were cross-linked with 1% formaldehyde, incubated overnight with antibodies, including rabbit polyclonal IgG (Millipore, PP64) as negative control and anti-EZH2 (Abcam, Cambridge, MA, USA), and recovered with protein G Dynabeads. RNA obtained after stringent washing and extraction with TRIzol was analyzed by qRT-PCR.
siRNA synthesis and transfection
Two EZH2-specific siRNAs were designed and synthesized by GenePharma (Shanghai, China). Transfection was performed with Lipofectamine 2000 (Invitrogen) according to the manufacturer’s protocols.
Western blotting
Total cellular protein was extracted from indicated ccRCC cells using RIPA buffer with protease inhibitors (Solarbio, Beijing, China). Equal amounts of proteins were separated by sodium dodecyl sulfate-polyacrylamide gel (5–10%) electrophoresis and transferred to polyvinylidene difluoride membranes (Millipore, Billerica, MA). After blocking with Tris-buffered saline-Tween with 5% skim milk (BD Bioscience, USA), the membrane was incubated with primary antibodies against EZH2 (1:1,000; Abcam, Cambridge, MA, USA), p53 (1:1,000; Abcam, Cambridge, MA, USA), or β-actin (1:3,000; ZSGB-BIO, Beijing, China), followed by the incubation with anti-rabbit or anti-mouse horseradish peroxidase-conjugated secondary antibodies (1:5,000; ZSGB-BIO, Beijing, China), and detected using an enhanced chemiluminescence detection system (Thermo Fisher Scientific, USA).
Immunofluorescence
Cells were fixed in 4% paraformaldehyde for 15 mins, permeabilized with 0.5% Triton X-100 for 10 mins, blocked in PBS with 3% bovine serum albumin, and incubated overnight at 4°C with primary antibodies against EZH2 (Abcam, Cambridge, MA, USA) and p53 (Abcam, Cambridge, MA, USA). Secondary antibodies conjugated with tetramethylrhodamine (TRITC; ZSGB-BIO, Beijing, China) were incubated at 37°C for 1 hr. DAPI (4′,6-diamidino-2-phenylindole) was used to visualize cell nuclei. Digital images were captured on an Olympus confocal microscope.
Statistical analysis
Prism 6.0 software (GraphPad, Inc., La Jolla, CA) was used for statistical analysis. The Student’s t-test was used to determine the significance of the difference of means between two groups. The chi-squared test was applied to analyze the association of LINC-PINT level with clinicopathological characteristics. The Kaplan–Meier analysis was used to calculate DFS and OS, and the log-rank test was used to assess the difference in DFS and OS between groups with high and low LINC-PINT expression. All values were presented as the mean ± standard deviation (S.D.). All statistical analyses were conducted with a significance level of α=0.05 (P<0.05).
Results
LINC-PINT transcript variant 1 is the main transcript in ccRCC
An NCBI search revealed that LINC-PINT has 11 transcript variants. However, considering the results of previous studies, we assumed that LINC-PINT transcript variants 1–8 may be critical in ccRCC.14 Next, to identify the LINC-PINT transcript variant most potently upregulated in ccRCC, we performed reverse transcription (RT)-PCR using different primer pairs (Table 1; Figure 1A). RT-PCR revealed that transcript variant 1 was the most abundant transcript variant in ccRCC (Figure 1B).
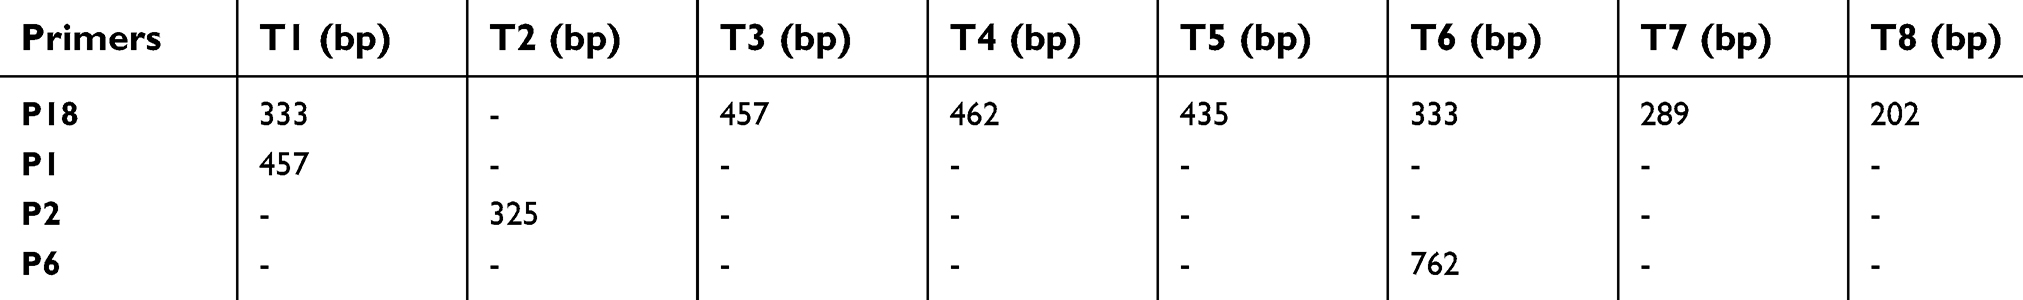 | Table 1 Products length of primers for LINC-PINT variants |
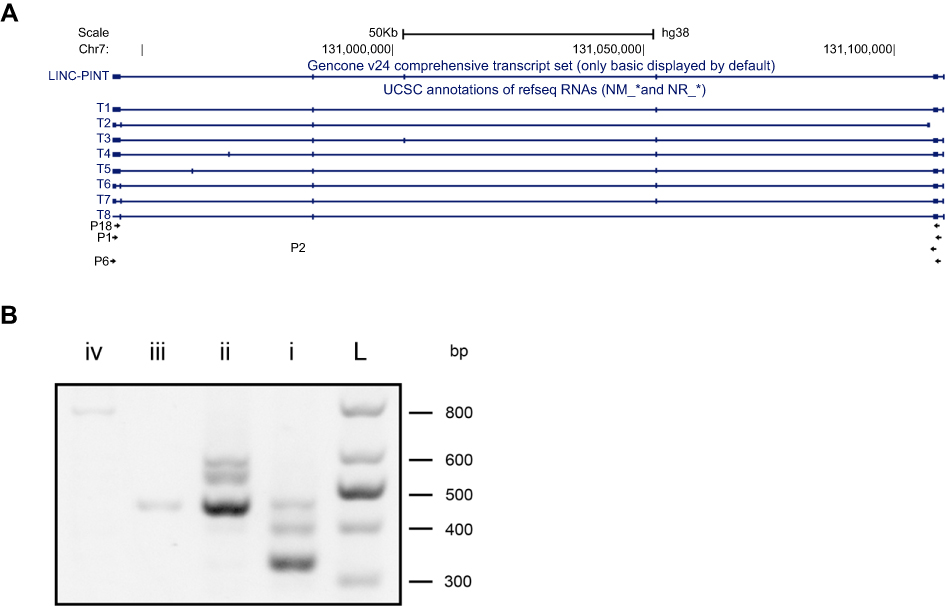 | Figure 1 Identification of LINC-PINT transcript variant 1 as the main LINC-PINT transcript. (A) Schematic diagram of LINC-PINT variants and primers for them. T1–T8: variant names; P1, P2, P6, and P18: primer names. (B) RT-PCR products from cDNAs generated using primers for LINC-PINT variants. L, ladder; I, P18; ii, P1; iii, P2; iv, P6. |
Upregulation of LINC-PINT level in ccRCC and its association with clinicopathological characteristics and survival of ccRCC cells
LINC-PINT expression level was determined in tumor and paired normal tissue specimens from 16 patients with ccRCC. We found that LINC-PINT was upregulated in ccRCC specimens compared to its level in paired normal tissues (Figure 2A). Furthermore, the level of LINC-PINT was significantly higher in ccRCC cell lines (786-O, A498, 769P, Caki-2, Caki-1, ACHN, OS-RC-2, and SN12-PM6) than in human HKC renal proximal tubule epithelial cell line (Figure 2B). Although there were no significant correlations between LINC-PINT expression level and age, body mass index, tumor size, or Fuhrman stage, aberrant expression level of LINC-PINT was more frequently observed in ccRCC patients with pT3 and pT4 or TNM-III and -IV stage tumors than in those with pT1 and pT2 or TNM-I and -II stage tumors and in males than in females (Table 2).
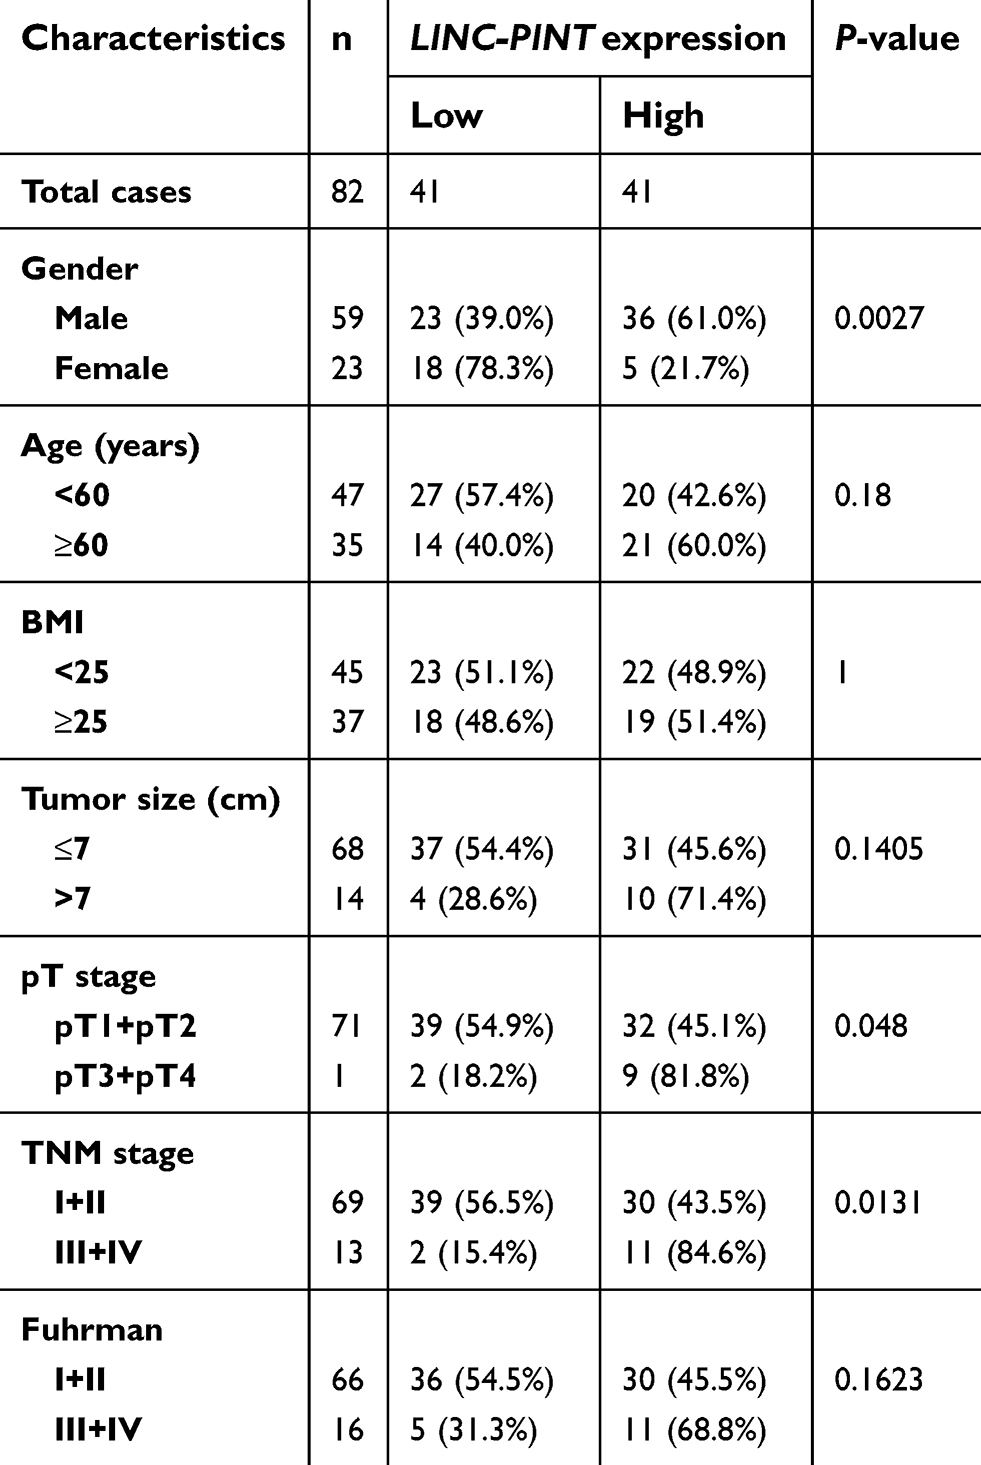 | Table 2 Relationship between LINC-PINT expression and clinicopathological features in patients with ccRCC |
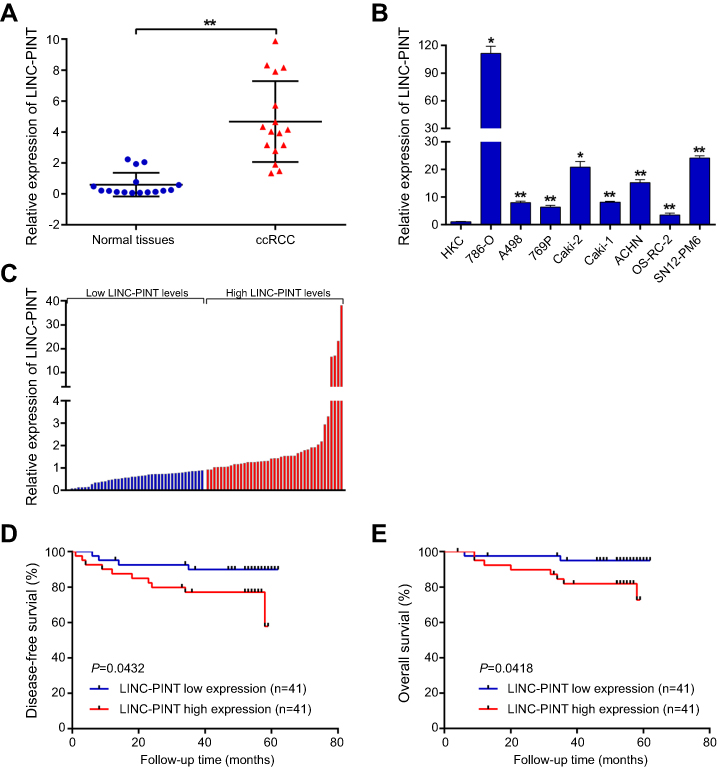 | Figure 2 Upregulation of LINC-PINT in ccRCC patients and correlation of LINC-PINT level with the severity of ccRCC outcome. (A) qRT-PCR analysis of LINC-PINT expression level in 16 sets of paired samples of ccRCC and non-tumor tissues. (B) qRT-PCR analysis of LINC-PINT expression level in the human renal proximal tubule epithelial cell line HKC and in ccRCC cell lines (786-O, A498, 769P, Caki-2, Caki-1, ACHN, OS-RC-2, and SN12-PM6). (C) qRT-PCR analysis of LINC-PINT expression level in 82 samples of ccRCC tissues. (D and E) Kaplan–Meier analysis of disease-free survival (DFS) and overall survival (OS) based on LINC-PINT expression level in 82 patients with ccRCC. The median level of LINC-PINT is the cutoff. Patients with ccRCC were divided into LINC-PINT high and low expression groups. The results illustrate data from three independent experiments and are presented as the mean ± SD. Statistical significance of differences is indicated as follows: *P<0.05, **P<0.01. |
To determine the prognostic value of LINC-PINT in ccRCC, we analyzed the association of LINC-PINT level with DFS and OS by the Kaplan–Meier survival analysis and log-rank test using 82 ccRCC patient samples. We found that ccRCC patients with high LINC-PINT expression level had shorter DFS and OS compared with those with low LINC-PINT expression level (Figure 2C–E). Thus, we speculated that LINC-PINT may act as an oncogene in ccRCC.
Overexpression of LINC-PINT promotes ccRCC cell proliferation
To explore biological consequences of LINC-PINT upregulation in ccRCC, we performed loss-of-function studies by using RNA interference, short hairpin RNAs, or anti-sense oligonucleotides designed by us. However, we were not able to lower the levels of LINC-PINT by these approaches (data not shown). Therefore, we constructed 769P and OS-RC-2 cell lines with LINC-PINT stable overexpression using lentiviruses. LINC-PINT overexpression plasmids significantly increased LINC-PINT levels in 769P and OS-RC-2 cells (Figure 3A). Functionally, overexpression of LINC-PINT significantly increased proliferation of 769P and OS-RC-2 cells compared with proliferation of control cells as shown by the MTS (3-(4,5-dimethylthiazol-2-yl)-5-(3-carboxymethoxyphenyl)-2-(4-sulfophenyl)-2H-tetrazolium) assay (Figure 3B). Additionally, the colony formation assay also showed that the number of 769P and OS-RC-2 cell colonies increased significantly after LINC-PINT overexpression compared to the number of control cell colonies (Figure 3C). These results suggested that upregulated LINC-PINT expression promoted ccRCC cell proliferation.
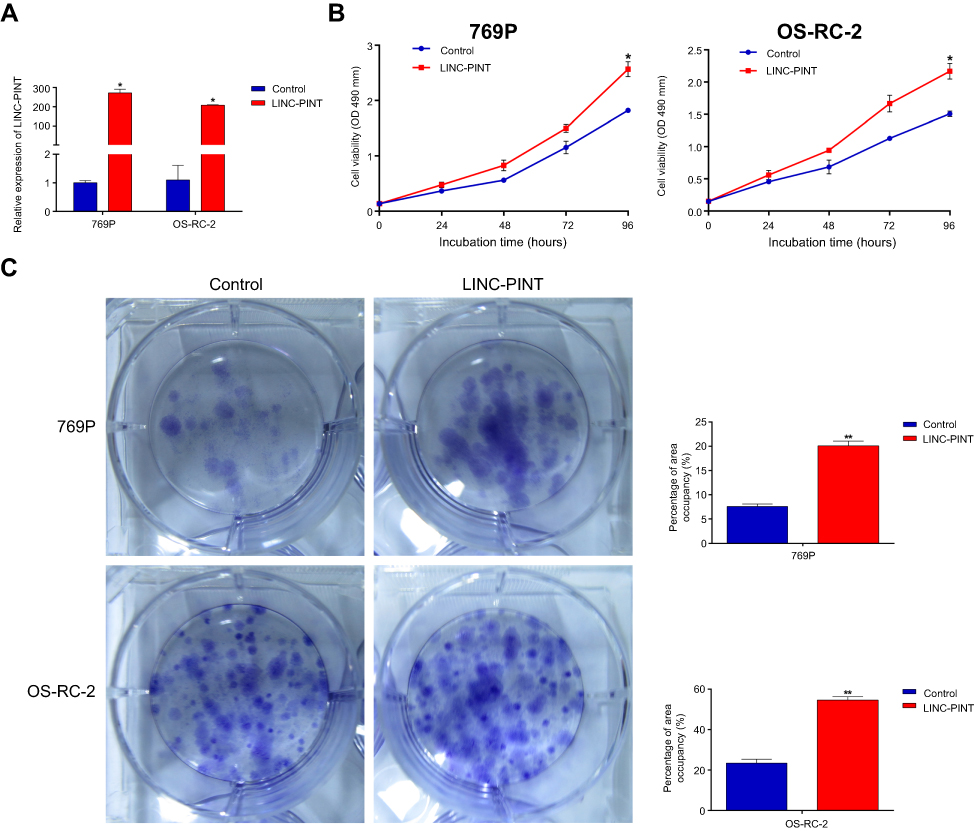 | Figure 3 LINC-PINT promotes ccRCC cell proliferation. (A) qRT-PCR analysis of LINC-PINT expression level after LINC-PINT overexpression in 769P and OS-RC-2 cells. (B) 769P and OS-RC-2 cell proliferation was assayed after LINC-PINT overexpression by the MTS assay. (C) Colony forming growth assays were performed to determine the proliferation of 769P and OS-RC-2 cells with LINC-PINT overexpression. The results illustrate data from three independent experiments and are presented as mean ± SD. Statistical significance of differences is indicated as follows: *P<0.05, **P<0.01.Abbreviations: MTS, 3-(4,5-dimethylthiazol-2-yl)-5-(3-carboxymethoxyphenyl)-2-(4-sulfophenyl)-2H-tetrazolium, inner salt. |
Overexpression of LINC-PINT promotes cell cycle and inhibits cell apoptosis
To address the mechanisms by which LINC-PINT enhanced ccRCC cell proliferation, we examined its effect on cell cycle and apoptosis of 769P and OS-RC-2 cells by fluorescence-activated cell sorting (FACS) analysis. LINC-PINT overexpression led to a dramatic decrease in the percentage of G1 phase cells and a concomitant increase in the percentage of S phase cells (Figure 4A). Furthermore, the number of annexin V-positive cells was significantly reduced (Figure 4B). Collectively, these findings indicated that LINC-PINT promoted cell proliferation by inducing cell cycle progression and inhibiting apoptosis.
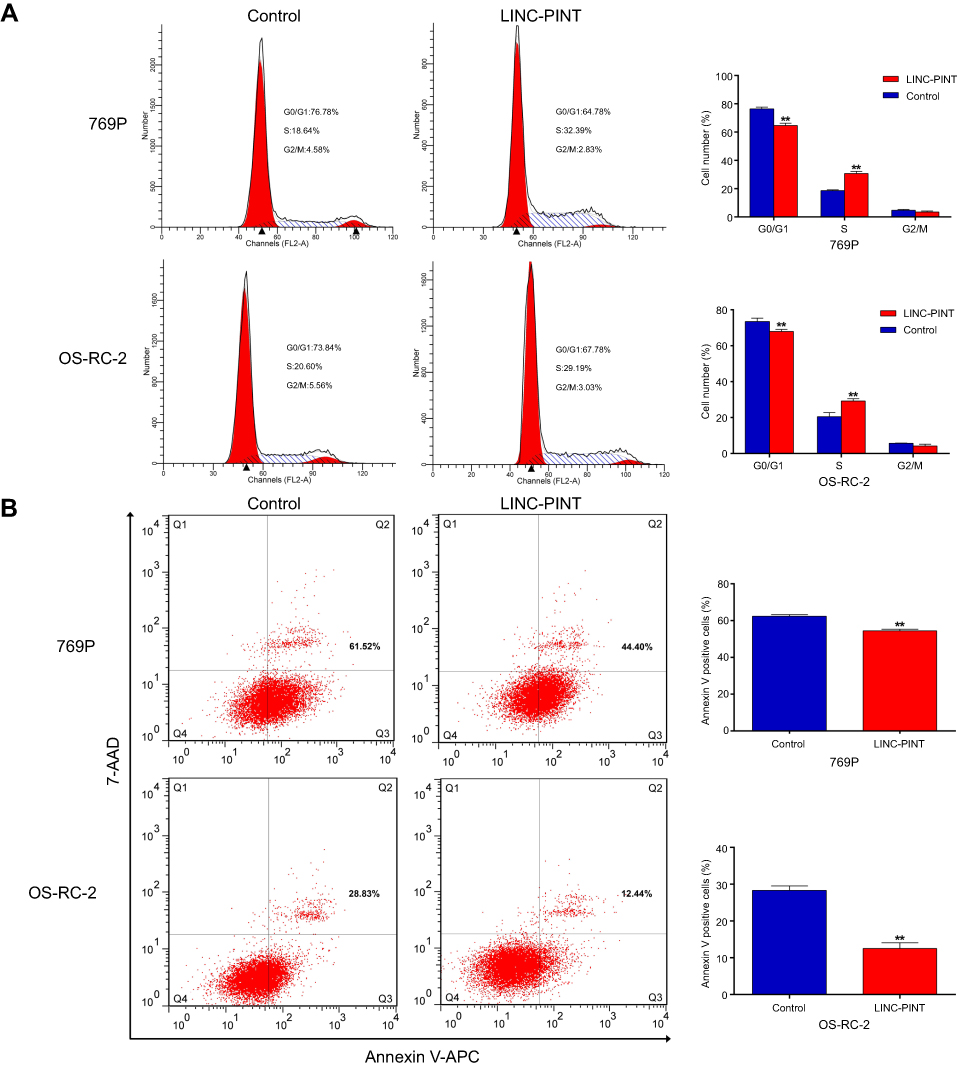 | Figure 4 LINC-PINT induces cell cycle progression and inhibits cell apoptosis. (A) Fluorescence-activated cell sorting analysis showed a significant decrease in G1 cells and a significant increase in S phase cells in 769P and OS-RC-2 overexpressing LINC-PINT. (B) Cells were stained with a combination of annexin V-allophycocyanin (APC) and 7-aminoactinomycin D (7-AAD) and analyzed by FACS. Cells positive for annexin V–APC staining were counted as apoptotic cells, and the percentage of apoptotic cells is shown. The results depict data from three independent experiments and are presented as the mean ± SD. Statistical significance of differences is indicated as follows: *P<0.05, **P<0.01.Abbreviation: FACS, fluorescence-activated cell sorting. |
LINC-PINT promotes cell proliferation by interacting with EZH2
To further investigate the molecular mechanism by which LINC-PINT affected ccRCC cell proliferation, we first examined its subcellular localization. By using cytoplasmic and nuclear RNA isolation and qRT-PCR, we found that at least 90% of LINC-PINT is located in the nucleus (Figure 5A). Therefore, we tested whether LINC-PINT interacts with polycomb repressive complex 2 (PRC2). In the RNA binding protein immunoprecipitation (RIP) assay, an antibody against EZH2, which is an essential subunit that facilitates PRC2 binding to lncRNAs, was incubated with total RNA from 769P and OS-RC-2 cells. qRT-PCR showed a significant increase in LINC-PINT expression after incubation with an anti-EZH2 antibody compared to the level observed after the treatment with a nonspecific IgG control antibody (Figure 5B). Next, we designed two EZH2-specific siRNAs to knockdown EZH2 in 769P and OS-RC-2 cells. Western blotting analysis showed that EZH2 expression was strongly reduced in these cells after treatment with these two siRNAs compared with EZH2 level in negative control cells. The most effective siRNA that decreased EZH2 expression was used in the remaining experiments (Figure 5C). A similar result was also achieved by the analysis of EZH2 expression using immunofluorescence staining in 769P and OS-RC-2 cells (Figure 5D). Then, we transfected 769P and OS-RC-2 cells overexpressing LINC-PINT with EZH2 siRNA. EZH2 silencing partially reversed changes in cell proliferation, cell cycle, and apoptosis induced by LINC-PINT overexpression (Figure 5E–G). Together, these results demonstrated that LINC-PINT exerted its function, at least in part, via interacting with PRC2.
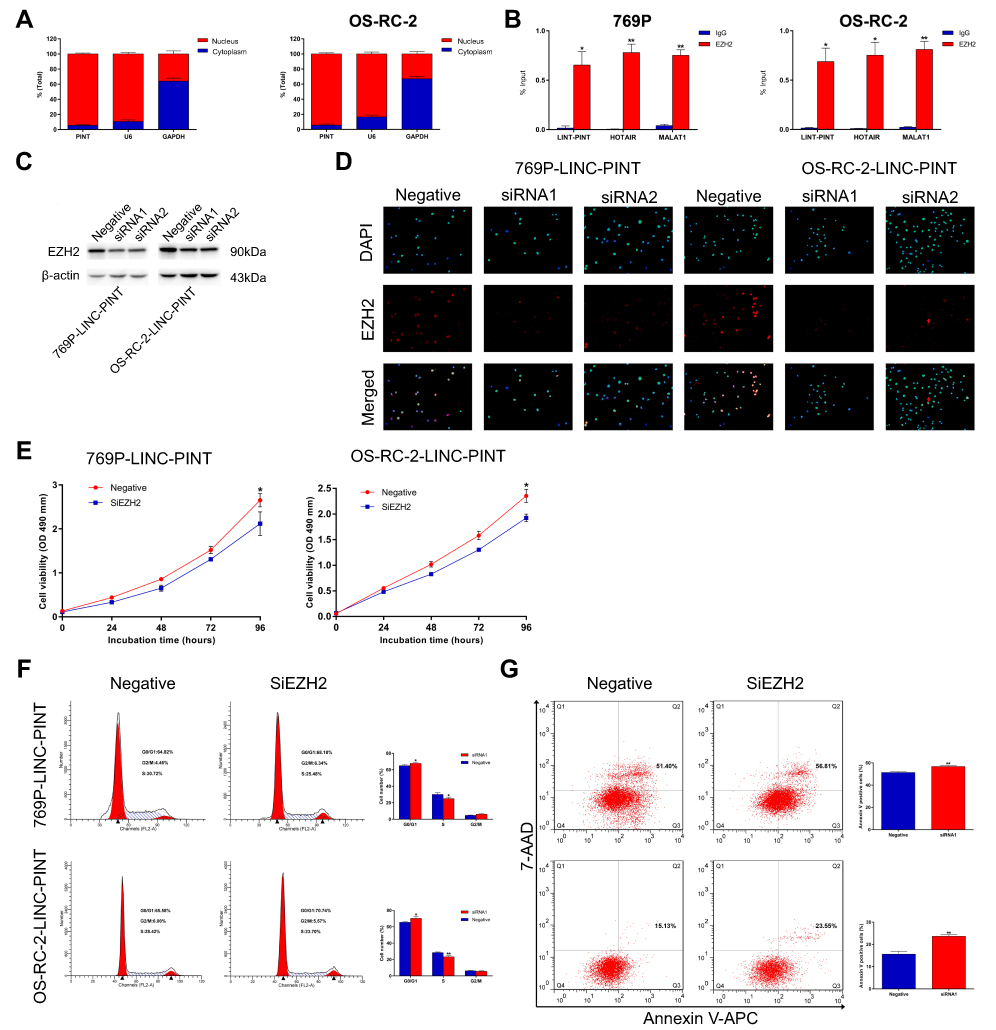 | Figure 5 LINC-PINT physically interacts with EZH2. (A) Cellular characterization of LINC-PINT in 769P and OS-RC-2 cells: expression levels of the nuclear control transcript U6, cytoplasmic control transcript (GAPDH mRNA), and LINC-PINT were examined by qRT-PCR in nuclear and cytoplasmic fractions. (B) RIP assays were performed using 769P and OS-RC-2 cells, and the co-precipitated RNAs were subjected to qRT-PCR to determine expression levels of LINC-PINT, HOTAIR, and MALAT1. The latter two transcripts were used as positive controls. (C) EZH2 expression was analyzed by Western blotting in 769P and OS-RC-2 cells overexpressing LINC-PINT after transfection with EZH2 siRNAs. (D) EZH2 expression was analyzed by immunofluorescence staining in 769P and OS-RC-2 cells overexpressing LINC-PINT after transfection with EZH2 siRNAs. (E) Cell proliferation was assessed by the MTS assay after EZH2 knockdown in 769P and OS-RC-2 cells overexpressing LINC-PINT. (F) FACS analysis showed that the numbers of cells in G1 and S phases were significantly increased and decreased, respectively, when EZH2 was knocked down in 769P and OS-RC-2 cells overexpressing LINC-PINT. (G) Cells were stained with a combination of annexin V-allophycocyanin (APC) and 7-aminoactinomycin D (7-AAD) and analyzed by FACS. The results depict data from three independent experiments and are presented as the mean ± SD. Statistical significance of differences is indicated as follows: *P<0.05, **P<0.01.Abbreviation: RIP, RNA binding protein immunoprecipitation. |
LINC-PINT is regulated by p53
To examine whether p53 regulates LINC-PINT expression level, we first treated 769P and OS-RC-2 cells with doxorubicin (Dox) at different concentrations. Cells were exposed to Dox, a known DNA-damaging agent, for 24 hrs, and dose-dependent p53 induction was detected by Western blotting analysis (Figure 6A). Immunofluorescence staining also showed that p53 expression increased in 769P and OS-RC-2 cells exposed to 0.2 μM Dox for 24 hrs compared with that in the blank control (Figure 6B). Therefore, we then selected 0.2 μM Dox for 24 hrs for sub-sequential experiments and confirmed that Dox induced LINC-PINT expression in 769P and OS-RC-2 cells by qRT-PCR (Figure 6C). This suggested that LINC-PINT was induced by p53.
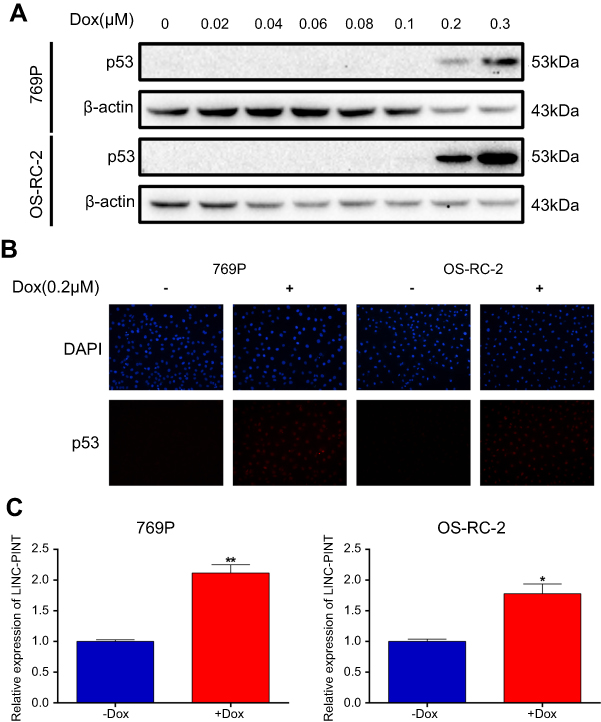 | Figure 6 LINC-PINT is a p53-inducible lncRNA. (A) Detection of p53 induction in response to varying Dox concentrations by Western blotting. (B) Detection of p53 expression after treatment with 0.2 μM Dox for 24 hrs by immunofluorescence staining. (C) Effect of Dox on LINC-PINT expression in 769P and OS-RC-2 cells. The results depict data from three independent experiments and are presented as the mean ± SD. Statistical significance of differences is indicated as follows: *P<0.05, **P<0.01. |
Discussion
To reveal the mechanism underlying the development of ccRCC, an increasing number of basic studies have focused on genetic and epigenetic lesions. Genetically, ccRCC has been characterized with a very high frequency of biallelic VHL inactivation occurring through allelic deletion or loss of heterozygosity on 3p.15 Hypermethylation of enhancer and promoter CpGs of the genes encoding wingless/integrated (Wnt) antagonists in ccRCC, such as secreted frizzled related protein 1 (SFRP1), SFRP2, SFRP5, and WNT inhibitory factor 1 (WIF-1), decreases their expression and inhibits ccRCC cell proliferation.16 However, over the last decades, many studies have reported that lncRNAs have comprehensive functions in cancer biological processes through diverse mechanisms.
In this study, we revealed that LINC-PINT transcript variant 1 was the predominant LINC-PINT transcript variant in ccRCC. Furthermore, we found that LINC-PINT was frequently upregulated in ccRCC samples with its expression level depending on gender as well as pT and TNM stage of patients with ccRCC. Moreover, we also showed that patients with high LINC-PINT expression had poor DFS and OS. In functional experiments in vitro, we observed that overexpression of LINC-PINT promoted ccRCC cell proliferation, induced cell cycle progression, and inhibited cell apoptosis. Moreover, we demonstrated that LINC-PINT was primarily located in cell nuclei and interacted with EZH2 in ccRCC cells. Additionally, Dox-induced p53 expression promoted LINC-PINT expression in ccRCC cells.
Marín-Béjar et al discovered that LINC-PINT expression is significantly downregulated in human colorectal tumors compared with that in matched normal tissue samples. Moreover, through analyzing RNA sequencing data from The Cancer Genome Atlas, they found that LINC-PINT expression is also significantly decreased in other tumors, such as breast, uterine corpus endometrial, and lung squamous cell cancers, and that the low expression level of LINC-PINT is associated with diminished OS in patients with lung adenocarcinoma.14,17 Li et al reported that plasma LINC-PINT levels were lower in patients with pancreatic cancer than in healthy volunteers. Furthermore, LINC-PINT levels correlated with tumor recurrence and predicted pancreatic cancer more sensitively than CA19-9 levels.18 In another study, Garitano-Trojaola et al demonstrated that in acute lymphoblastic leukemia cell lines, LINC-PINT expression level was lower than in control cells. In contrast to previous studies, our results demonstrated that in ccRCC, LINC-PINT expression level was up- rather than downregulated, so that samples with high LINC-PINT expression tended to originate from ccRCC patients with poor outcome. This may be due to the intrinsically complex and diverse biological mechanisms of LINC-PINT effects in different cancer types.
PRC2 is a lysine methyltransferase that trimethylates histone H3 at lysine 27. This modification is associated with epigenetic gene silencing. PRC2 has three core subunits, viz., the catalytic subunit EZH 1 or 2 (EZH1/EZH2), Suppressor of Zeste 12 (SUZ12), and Embryonic Ectoderm Development (EED).19,20 Rinn et al demonstrated that HOTAIR physically interacts with PRC2 directly or indirectly and that the loss of this interaction may reduce the ability of PRC2 to methylate histone tails and silence transcription at the HOXD locus.21 LINC-PINT has been reported to regulate downstream effectors via binding to PRC2 and recruiting it to the promoter regions of genes identified in enhancing mitogen-activated protein kinase signaling, extracellular matrix receptor interaction, and transforming growth factor-β signaling.14 In this study, by using the RIP assay, we found that LINC-PINT directly binds EZH2 in ccRCC cells. Further experiments revealed that knockdown of EZH2 partially rescued the effects induced by LINC-PINT overexpression. Future research will be needed to establish whether there are other mechanisms by which LINC-PINT affects ccRCC development.
Conclusion
In conclusion, we are reporting for the first time that LINC-PINT is upregulated in ccRCC and that its expression level correlates with the severity of ccRCC patient outcome. LINC-PINT influenced biological properties of ccRCC cells via direct interactions with EZH2. Additionally, in ccRCC cells, p53 stimulated LINC-PINT expression. The results of the present study suggest that LINC-PINT may serve as a promising prognostic biomarker for ccRCC as it plays a pivotal role in ccRCC development.
Disclosure
The authors report no conflicts of interest in this work.
References
1. Hsieh JJ, Purdue MP, Signoretti S, et al. Renal cell carcinoma. Nature Rev Dis Primers. 2017;3:17009. doi:10.1038/nrdp.2017.9
2. Siegel RL, Miller KD, Jemal A. Cancer statistics, 2018. CA Cancer J Clin. 2018;68(1):7–30. doi:10.3322/caac.21442
3. Cohen HT, McGovern FJ. Renal-cell carcinoma. N Engl J Med. 2005;353(23):2477–2490. doi:10.1056/NEJMra043172
4. Delahunt B, Cheville JC, Martignoni G, et al. The International Society of Urological Pathology (ISUP) grading system for renal cell carcinoma and other prognostic parameters. Am J Surg Pathol. 2013;37(10):1490–1504. doi:10.1097/PAS.0b013e318299f0fb
5. St Laurent G, Wahlestedt C, Kapranov P. The landscape of long noncoding RNA classification. Trends Genet. 2015;31(5):239–251. doi:10.1016/j.tig.2015.03.007
6. Ji P, Diederichs S, Wang W, et al. MALAT-1, a novel noncoding RNA, and thymosin beta4 predict metastasis and survival in early-stage non-small cell lung cancer. Oncogene. 2003;22(39):8031–8041. doi:10.1038/sj.onc.1206928
7. Gutschner T, Hammerle M, Eissmann M, et al. The noncoding RNA MALAT1 is a critical regulator of the metastasis phenotype of lung cancer cells. Cancer Res. 2013;73(3):1180–1189. doi:10.1158/0008-5472.CAN-12-2850
8. Gupta RA, Shah N, Wang KC, et al. Long non-coding RNA HOTAIR reprograms chromatin state to promote cancer metastasis. Nature. 2010;464(7291):1071–1076. doi:10.1038/nature08975
9. Yang Z, Zhou L, Wu LM, et al. Overexpression of long non-coding RNA HOTAIR predicts tumor recurrence in hepatocellular carcinoma patients following liver transplantation. Ann Surg Oncol. 2011;18(5):1243–1250. doi:10.1245/s10434-011-1581-y
10. Kogo R, Shimamura T, Mimori K, et al. Long noncoding RNA HOTAIR regulates polycomb-dependent chromatin modification and is associated with poor prognosis in colorectal cancers. Cancer Res. 2011;71(20):6320–6326. doi:10.1158/0008-5472.CAN-11-1021
11. Hirata H, Hinoda Y, Shahryari V, et al. Long noncoding RNA MALAT1 promotes aggressive renal cell carcinoma through Ezh2 and interacts with miR-205. Cancer Res. 2015. doi:10.1158/0008-5472.CAN-14-2931
12. Zhai W, Sun Y, Jiang M, et al. Differential regulation of LncRNA-SARCC suppresses VHL-mutant RCC cell proliferation yet promotes VHL-normal RCC cell proliferation via modulating androgen receptor/HIF-2α/C-MYC axis under hypoxia. Oncogene. 2016;35(37):4866–4880. doi:10.1038/onc.2016.19
13. Qu L, Ding J, Chen C, et al. Exosome-transmitted lncARSR promotes sunitinib resistance in renal cancer by acting as a competing endogenous RNA. Cancer Cell. 2016;29(5):653–668. doi:10.1016/j.ccell.2016.03.004
14. Marin-Bejar O, Marchese FP, Athie A, et al. Pint lincRNA connects the p53 pathway with epigenetic silencing by the Polycomb repressive complex 2. Genome Biol. 2013;14(9):R104. doi:10.1186/gb-2013-14-9-r104
15. Sato Y, Yoshizato T, Shiraishi Y, et al. Integrated molecular analysis of clear-cell renal cell carcinoma. Nat Genet. 2013;45(8):860–867. doi:10.1038/ng.2699
16. Shenoy N, Vallumsetla N, Zou Y, et al. Role of DNA methylation in renal cell carcinoma. J Hematol Oncol. 2015;8:88. doi:10.1186/s13045-015-0180-y
17. Marin-Bejar O, Mas AM, Gonzalez J, et al. The human lncRNA LINC-PINT inhibits tumor cell invasion through a highly conserved sequence element. Genome Biol. 2017;18(1):202. doi:10.1186/s13059-017-1331-y
18. Li L, Zhang GQ, Chen H, et al. Plasma and tumor levels of Linc-pint are diagnostic and prognostic biomarkers for pancreatic cancer. Oncotarget. 2016;7(44):71773–71781. doi:10.18632/oncotarget.12365
19. Moritz LE, Trievel RC. Structure, mechanism, and regulation of polycomb-repressive complex 2. J Biol Chem. 2018;293(36):13805–13814. doi:10.1074/jbc.R117.800367
20. Liu L, Xu Z, Zhong L, et al. Enhancer of zeste homolog 2 (EZH2) promotes tumour cell migration and invasion via epigenetic repression of E-cadherin in renal cell carcinoma. BJU Int. 2016;117(2):351–362. doi:10.1111/bju.12702
21. Rinn JL, Kertesz M, Wang JK, et al. Functional demarcation of active and silent chromatin domains in human HOX loci by noncoding RNAs. Cell. 2007;129(7):1311–1323. doi:10.1016/j.cell.2007.05.022
22. Duan J, Bao X, Ma X, et al. Upregulation of far upstream element-binding protein 1 (FUBP1) promotes tumor proliferation and tumorigenesis of clear cell renal cell carcinoma. PLoS One. 2017;12(1):e0169852. doi:10.1371/journal.pone.0169852
 © 2019 The Author(s). This work is published and licensed by Dove Medical Press Limited. The
full terms of this license are available at https://www.dovepress.com/terms
and incorporate the Creative Commons Attribution
- Non Commercial (unported, 3.0) License.
By accessing the work you hereby accept the Terms. Non-commercial uses of the work are permitted
without any further permission from Dove Medical Press Limited, provided the work is properly
attributed. For permission for commercial use of this work, please see paragraphs 4.2 and 5 of our Terms.
© 2019 The Author(s). This work is published and licensed by Dove Medical Press Limited. The
full terms of this license are available at https://www.dovepress.com/terms
and incorporate the Creative Commons Attribution
- Non Commercial (unported, 3.0) License.
By accessing the work you hereby accept the Terms. Non-commercial uses of the work are permitted
without any further permission from Dove Medical Press Limited, provided the work is properly
attributed. For permission for commercial use of this work, please see paragraphs 4.2 and 5 of our Terms.