Back to Journals » OncoTargets and Therapy » Volume 13
Long Non-Coding RNA Taurine Upregulated Gene 1 Targets miR-185 to Regulate Cell Proliferation and Glycolysis in Acute Myeloid Leukemia Cells in vitro
Authors Zhang W, Liu Y, Zhang J, Zheng N
Received 11 November 2019
Accepted for publication 15 July 2020
Published 7 August 2020 Volume 2020:13 Pages 7887—7896
DOI https://doi.org/10.2147/OTT.S238189
Checked for plagiarism Yes
Review by Single anonymous peer review
Peer reviewer comments 2
Editor who approved publication: Dr Yao Dai
Weide Zhang,1,* Yuhua Liu,2,* Jing Zhang,3 Ni Zheng4
1Department of Hematology, The People’s Hospital of Shouguang, Shouguang, Shandong, People’s Republic of China; 2Department of Digestive Oncology, The Gansu Provincial Cancer Hospital, Lanzhou, Gansu, People’s Republic of China; 3Department of Psychiatry, Shouguang Mental and Health Care Center, Shouguang, Shandong, People’s Republic of China; 4Department of Clinical Laboratory, Shengli Oilfield Central Hospital, Dongying, Shandong, People’s Republic of China
*These authors contributed equally to this work
Correspondence: Ni Zheng
Department of Clinical Laboratory, Shengli Oilfield Central Hospital, No. 31 Jinan Road, Dongying 257034, Shandong, People’s Republic of China
Tel +86-5468770171
Email [email protected]
Background: Acute myeloid leukemia (AML) is a group of malignant hematopoietic system diseases. Taurine-upregulated gene 1 (TUG1) is a long non-coding RNA that has been associated with human cancers, including AML. However, the role and molecular mechanisms of TUG1 in AML remains to be defined.
Methods: Expression of TUG1 and miR-185 was detected using RT-qPCR. Cell viability and apoptotic rate were measured by MTT assay and flow cytometry, respectively. Glycolysis was determined by commercial glucose and lactate assay kits and Western blot. The target binding between TUG1 and miR-185 was predicted on Starbase online database and confirmed by luciferase reporter assay and RNA immunoprecipitation.
Results: TUG1 was upregulated and miR-185 was downregulated in the peripheral blood mononuclear cells of AML specimens and cells (HL-60, KG-1, MOLM-14, and MOLM-13). Both TUG1 knockdown and miR-185 overexpression via transfection could suppress cell viability, glucose consumption, lactate production, and hexokinase 2 expression, but promote apoptotic rate in HL-60 and KG-1 cells. Notably, TUG1 functioned as a sponge of miR-185 by target binding. Moreover, downregulation of miR-185 could partially overturn the effect of TUG1 knockdown on cell proliferation and glycolysis in HL-60 and KG-1 cells.
Conclusion: Expression of TUG1 was upregulated in AML patients and cells, and its knockdown repressed cell proliferation and glycolysis in AML cells in vitro by targeting miR-185.
Keywords: TUG1, miR-185, glycolysis, AML
Introduction
Acute myeloid leukemia (AML) is a highly invasive, heterogeneous disease, and originates from the hematopoietic system.1 AML accounts for approximately 70% of acute leukemia cases. The characteristics of AML include uncontrollable proliferation of leukemia cells in bone marrow and a maturation arrest, which results in preventing normal hematopoiesis.2 Generally, conventional chemotherapy and allogenic stem cell transplantation accompanied with targeted therapy serve as the effective way for AML treatment.3,4 However, the clinical outcome of AML remains unsatisfactory, and its long-term survival is still poor; only less than 40% of AML patients achieve long-term survival.5 In addition, the incidence of AML increases with the growth of age. Therefore, it is essential to explore novel biomarkers for AML.
Emerging evidence has suggested the vital role of epigenetic regulation in AML, such as histone modification, noncoding RNAs (ncRNAs), and DNA methylation.6 Long non-coding RNAs (lncRNAs), longer than 200 nucleotides, are increasingly recognized as important regulators in solid and hematologic malignancies,7,8 including AML.9 Functionally, they participate in various biological progresses, like microRNAs (miRNA) silencing, alternative splicing, epigenetic regulation, RNA decay, and protein activity modulation. Thus, dysregulated lncRNAs are closely associated with tumorigenesis, metastasis, diagnosis, and prognosis.8 However, the regulatory role of lncRNAs in AML development and progression remains unclear. LncRNA taurine-upregulated gene 1 (TUG1) is located on chromosome 22q12.2, and takes part in carcinogenesis in a number of cancers.10 In AML, TUG1 is reported to be upregulated and its high expression correlates with a worse prognosis and poor risk stratification.11,13 Furthermore, function of TUG1 has been claimed in chemotherapy resistance in cancers, including AML.14 There is a competing publication about TUG1 expression in AML as well.11 Hence, it is urgent to provide more information to determine the role of TUG1 in AML.
A physiological low oxygen level has been observed in the bone marrow microenvironment, and this local hypoxia may thereby influence the metabolic function of AML cells, including leukemic stem cells. The level of glycolytic metabolism is high in AML,15 as well as in other hematologic malignancies. Metabolomics profiling shows that serum glucose metabolites are abnormally expressed in AML serum, and that a panel of six metabolites serve to assess prognostic value.16 More importantly, several targeted therapies are now considered in AML including targeting cell metabolism.17 Recent researchers have announced that ncRNAs including lncRNAs and miRNAs are able to regulate metabolic switch to aerobic glycolysis and lactic acid fermentation, which is termed the Warburg effect.18 Several months ago, the link of TUG1 to glycolysis was uncovered in hepatocellular carcinoma and osteosarcoma.19,20 However, the contribution of TUG1 to the glycolysis in AML is unclear.
In this present study, the purpose was to investigate the role of TUG1 in cell proliferation and glycolysis in AML cells, as well as its molecular mechanism through acting as competing endogenous RNAs (ceRNAs). Therefore, we attempted to indicate a novel TUG1/miRNA axis in AML cells.
Patients and Methods
Patients and Clinical Samples
Clinically, bone marrow specimens were enrolled from 23 de novo AML patients diagnosed by French-American-British (FAB) criteria. Besides, 12 non-hematologic malignancy patients who received bone marrow biopsy were recruited as controls. All patients were from the People’s Hospital of Shouguang. The work was carried out according to the recommendations of the Declaration of Helsinki, and written informed consents were obtained from the patients or legal guardians. Samples were enriched and purified for normal and AML peripheral blood mononuclear cells (nPBMC and AML PBMC) from bone marrow specimens by standard Ficoll-Hypaque density centrifugation and stored at −80°C. The study was approved by the Ethics Committee of the People’s Hospital of Shouguang.
Cell and Cell Culture
Human AML cell lines (HL-60, KG-1, MOLM-14, and MOLM-13) and the normal human bone marrow stromal cell line (HS-5) were originally obtained from the American Type Culture Collection (ATCC; Manassas, VA, USA). AML cells were cultured in ATCC-formulated RPMI-1640 Medium (ATCC), and HS-5 cells were in ATCC-formulated Dulbecco’s Modified Eagle’s Medium (DMEM; ATCC). All cells were maintained in medium containing 10% fetal bovine serum (FBS) at 37°C in a humidified incubator with 5% CO2 and 20% O2.
Cell Transfection
HL-60 and KG-1 cells were seeded in 6-well plates (Corning, NY, USA) and incubated overnight. Plasmid pcDNA 3.1-TUG1, and oligonucleotides TUG1 siRNA (si-TUG1), miR-185 mimic, anti-miR-185, and their negative controls were acquired from GenePharma (Shanghai, China). HL-60 and KG-1 cells were plated in a 6-well plate for 24 hours prior to cell transfection. Usually, 50 nM of oligonucleotides and 2 μg of plasmid were separately transfected into HL-60 and KG-1 cells at 80% confluency. In rescue experiments, 25 nM of si-TUG1 and 25 nM of anti-miR-185/NC were uniformly mixed and co-transfected. All transfection procedures were carried out using Lipofectamine™ 2000 (Invitrogen, Carlsbad, CA, USA). Transfected cells were incubated for 48 hours for further study.
RNA Extraction and Real Time Quantitative PCR (RT-qPCR)
For examination of TUG1 and miR-185, total RNA from cultured cells was extracted with TRIzol reagent (Invitrogen) and the first-strand cDNA was synthesized using high capacity RNA-to-cDNA kit (Takara, Shiga, Japan). The quantitative PCR was performed with SYBR Prime-Script RT-PCR kit (Takara) on ABI 7500 real-time PCR system (Applied Biosystems, Foster City, CA, USA). GAPDH mRNA and U6 snRNA (U6) were used as an internal control for TUG1 and miR-185, respectively. Primers involved were listed as follows: TUG1: 5ʹ-AGGTAGAACCTCTATGCATTTTGTG-3ʹ forward and 5ʹ-ACTCTTGCTTCACTACTTCATCCAG-3ʹ reverse; GAPDH: 5ʹ- CTCCCGCTTCGCTCTCT-3ʹ forward and 5ʹ-GGCGACGCAAAAGAAGATG-3ʹ reverse; miR-185: 5ʹ-GGTGGAGAGAAAGGCAGT-3ʹ forward and 5ʹ-TGCGTGTCGTGGAGTC-3ʹ reverse; U6: 5ʹ-GCTTCGGCAGCACATATACTAAAAT-3ʹ forward and 5ʹ-CGCTTCACGAATTTGCGTGTCAT-3ʹ reverse. The reactions were performed in quadruplicate for each sample on at least three independent runs. The relative gene expression was calculated using the 2−ΔΔCt method.
3-(4, 5-Dimethylthiazol-2-Yl)-2, 5 Diphenyltetrazolium Bromide (MTT) Assay
Transfected HL-60 and KG-1 cells (5000 cells) were seeded onto a 96-well plate (Corning) for 0, 24, 48, and 72 hours. The cell viability was determined by MTT (Sigma, Louis, MO, USA) staining. MTT (20 μL, 5 mg/mL) was added to each well for another 4 hours at 37°C; after that, the medium was discarded and 150 μL dimethyl sulfoxide (DMSO; Sigma) was added into each well. The optical density value at 450 nm (OD 450 value) was measured with a Bio-Rad 680 microplate reader (Bio-Rad, Hercules, CA, USA) and the ability of cell viability was represented by OD 450 values. The samples were in quintuplicate and all experiments were performed three times.
Flow Cytometry
Apoptotic rate of transfected HL-60 and KG-1 cells was analyzed by Annexin V-Fluorescein isothiocyanate (FITC)/Propidium Iodide (PI) kit (Beyotime, Shanghai, China) on flow cytometry. After transfection for 48 hours, apoptotic cells were collected and washed with phosphate-buffered saline (PBS). Cell suspension of 106 cells were prepared and labelled with FITC-Annexin V and PI for 30 minutes in the dark. The fluorescence was analyzed on an Influx Flow Cytometer & Cell Sorter System (BD, Franklin Lakes, NJ, USA). Quadrants were positioned on Annexin V/PI plots to distinguish apoptotic cells (Annexin V+/PI-, Annexin V+/PI+). Apoptotic rate=apoptotic cells/total cells×100%.
Western Blot
Total protein from transfected HL-60 and KG-1 cells was isolated in RIPA lysis buffer (Beyotime) supplemented with cocktail protease inhibitor (Roche), and the protein concentrations were determined by Bradford protein assay reagent (Bio-Rad). Equal amounts of protein (20 μg) from each sample were loaded for the standard procedures of Western blot assay. β-actin on the same membrane was an internal standard to normalize protein levels. The primary antibodies including hexokinase 2 (HK2; #2867, 1:1000) and β-actin (#58169, 1:1000) were purchased from Cell Signaling Technology (CST; Danvers, Massachusetts, USA).
Luciferase Reporter Assay and RNA Immunoprecipitation (RIP)
Human TUG1 3ʹ UTR fragment wild type (TUG1-WT) containing the potential binding sites of hsa-miR-185 and its corresponding mutant (TUG1-MUT) were cloned by PCR methods into pmirGLO vector (Invitrogen), respectively. The TUG1-MUT replaced the UUUCUCUCC with GAGUCUAAU in the TUG1-WT fragment. HL-60 and KG-1 cells were transfected according to the following groups: TUG1-WT+miR-NC mimic (miR-NC), TUG1-WT+miR-185 mimic (miR-185), TUG1-MUT+miR-NC, TUG1-MUT+miR-185. The pmirGLO vector itself provided a strong Renilla luciferase signal acting as a control reporter for normalization. After 48 hours incubation, cells were collected to measure Firefly and Renilla luciferase activities using the dual-luciferase reporter assay system (Promega, Madison, WI, USA). All the data were the average of at least three independent transfections.
RIP was performed with HL-60 and KG-1 cells extract after transfection of miR-185/NC mimic. Magna RIPTM RNA-binding protein immunoprecipitation kit (Millipore, Bradford, MA, USA) was chosen to detect expression of TUG1 from the RIP samples bound to Ago2 or IgG antibody. After washing, total RNAs were extracted with TRIzol and subjected to RT-qPCR assay. All operations obeyed the standard instructions.
Measurements of Glucose Consumption and Lactate Production
After transfection for 48 hours, the supernatants of cell culture medium were collected. Glucose level in growth medium was determined using a glucose assay kit (Sigma), and lactate level was determined using the lactate assay kit (Biovision, Mountain View, CA, USA) according to the manufacturer’s protocols. Glucose consumption and lactate production were evaluated by the fold changes in glucose/lactate concentration compared with control.
Statistical Analyses
Data were presented as mean±standard error of mean (SEM). A Student’s t-test was performed to compare the difference between the treated group relative to paired control. Statistical analyses were performed using Graphpad 6.0 (GraphPad Software Inc., San Diego, CA, USA) and P<0.05 (*) was considered significant. P<0.01 (**) was considered highly significant, and P<0.001 (***) was considered very highly significant.
Results
Expression of TUG1 Was Upregulated in AML Specimens and Cells
To identify whether TUG1 was abnormally expressed in AML, RT-qPCR analysis was performed to evaluate TUG1 level in clinical AML specimens. As shown in Figure 1A, levels of TUG1 were significantly increased in AML PBMC compared with nPBMC. Additionally, TUG1 expression was similarly upregulated in AML cell lines HL-60, KG-1, MOLM-14, and MOLM-13 vs nPBMC (Figure 1B). Therefore, our data claimed that TUG1 was highly expressed in AML, which was consistent with a previous study.14
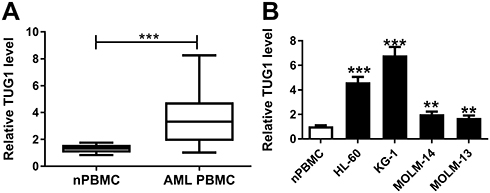 |
Figure 1 Expression of TUG1 in acute myeloid leukemia (AML) specimens and cells. (A and B) TUG1 expression levels were detected by RT-qPCR analysis in (A) the peripheral blood mononuclear cells (PBMC) derived from AML patients (AML nPBMC; n=23) compared with the healthy normal PBMC (nPBMC; n=12), and (B) human AML cell lines (HL-60, KG-1, MOLM-14, and MOLM-13) versus nPBMC. The error bars represent the mean±standard error of mean (SEM) of three independent experiments. **P<0.01, and ***P<0.001. |
Knockdown of TUG1 Suppressed Cell Proliferation and Glycolysis of AML Cells in vitro
In this study, we carried out a series of loss-of-function experiments to determine the role of TUG1. In consideration that the level of TUG1 was the highest in HL-60 and KG-1 cells (Figure 1B), TUG1 expression was knocked down in these cells by transient transfection of si-TUG1. RT-qPCR was utilized to evaluate the transfection efficiency by analyzing TUG1 expression, and TUG1 level was less than 0.4-fold in HL-60 and KG-1 cells after si-TUG1 transfection compared to the si-NC group (Figure 2A). Cell viability was reduced by TUG1 silencing as shown by MTT assay (Figure 2B and C). Subsequently, glycolysis of HL-60 and KG-1 cells was detected after transfection. The special kits demonstrated that glucose consumption and lactate production were reduced in the presence of si-TUG1 (Figure 2D and E); the protein expression of glycolysis-associated enzyme HK2 was suppressed by TUG1 knockdown as well (Figure 2F). In addition, we observed an elevated apoptotic rate in HL-60 and KG-1 cells transfected with si-TUG1 (Figure 2G). In conclusion, TUG1 downregulation suppressed cell proliferation and glycolysis in AML cells in vitro. TUG1 knockdown in nPBMC failed to affect the cell viability, apoptotic rate, glucose consumption, or lactate production (Supplementary Figure 1A–F). These results suggested that TUG1 could function as a regulator to coordinate glycolysis, cell viability, and apoptosis.
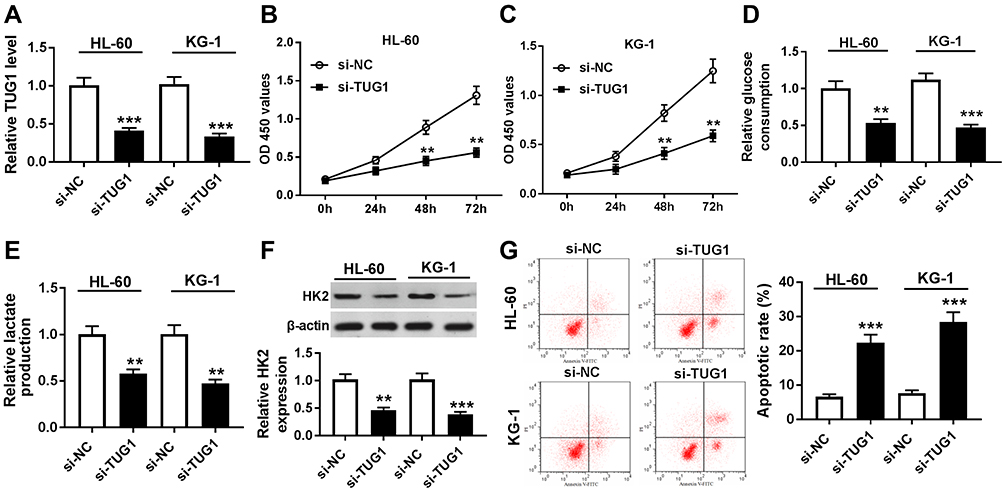 |
Figure 2 Role of TUG1 knockdown in human AML cells in vitro. (A–G) HL-60 and KG-1 cells were transfected with TUG1 siRNA (si-TUG1) or its negative control si-NC. (A) RT-qPCR analyzed TUG1 expression level after transfection. (B and C) Cell viability was measured by MTT assay. (D and E) The glucose consumption and lactate production in the cell supernatant of transfected cells were measured by commercial kits. (F) Western blot assay examined expression of hexokinase 2 (HK2) after transfection. (G) Apoptotic rate was determined using flow cytometry. The error bars represent the mean±SEM of three independent experiments. **P<0.01, and ***P<0.001 compared with the si-NC group. |
TUG1 Functioned as a ceRNA of miR-185 by Direct Binding
Bioinformatics analysis was employed to analyze the potential targets of TUG1 on Starbase software. Here, we presented the putative binding sites of miR-185 on the human TUG1 gene, as shown in Figure 3A. To confirm this potential binding, luciferase reporter assay and RIP were launched in HL-60 and KG-1 cells. After transfection with miR-185 mimic, relative luciferase activity of TUG1-WT was impaired versus miR-NC mimic transfection; however, there was no difference in TUG1-MUT groups (Figure 3B and C). Meanwhile, miR-185 mimic-transfected HL-60 and KG-1 cells showed dramatically enriched TUG1 in RIP-Ago2 (Figure 3D and E). Moreover, the expression level of miR-185 was detected to be elevated in HL-60 and KG-1 cells transfected with si-TUG1, and to be reduced with pcDNA-TUG1 transfection (Figure 3F and G). Taken together, we identified miR-185 as a novel TUG-1 target in AML cells. Moreover, RT-qPCR analysis was performed to evaluate miR-185 level in clinical AML specimens and cells. As shown in Figure 4A, the level of miR-185 was significantly decreased in AML PBMC compared with the healthy nPBMC. Similarly, miR-185 expression was lower in AML cell lines HL-60, KG-1, MOLM-14, and MOLM-13 (Figure 4B). These data illuminated that miR-185 was downregulated in AML via TUG1 targeting.
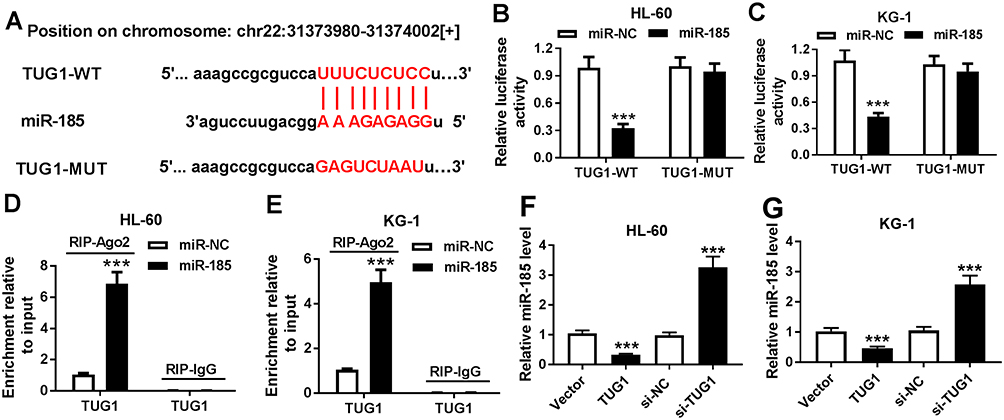 |
Figure 3 The regulatory effect of TUG1 on miR-185 expression. (A) The miR-185 binding sites were shown on the wild type of human TUG1 (TUG1-WT) according to Starbase. The corresponding sequence in the mutated version (TUG1-MUT) was shown as well. (B and C) Luciferase reporter assay detected the luciferase activities of TUG1-WT and TUG1-MUT in HL-60 and KG-1 cells transfected with miR-185/NC mimic (miR-185/NC). (D and E) RNA immunoprecipitation (RIP) assay was performed to identify TUG1 levels in HL-60 and KG-1 cells transfected with miR-185/NC. (F and G) Expression level of miR-185 was detected in HL-60 and KG-1 cells after transfection of si-TUG1, pcDNA-TUG1 (TUG1), or matched controls. The error bars represent the mean±SEM of three independent experiments. ***P<0.001 compared with control groups (miR-NC, si-NC, or Vector). |
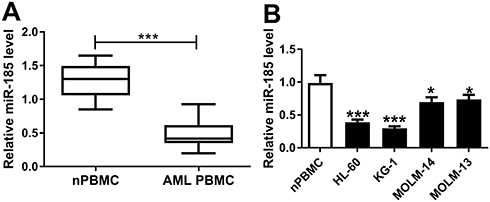 |
Figure 4 Expression of miR-185 in AML specimens and cells. (A and B) miR-185 expression level was detected by RT-qPCR analysis (2−ΔΔCt, normalized to U6) in (A) AML PBMC (n=23) compared with nPBMC (n=12), and (B) human HL-60, KG-1, MOLM-14, and MOLM-13 cells vs nPBMC. The error bars represent the mean±SEM of three independent experiments. *P<0.05, and ***P<0.001. |
Overexpression of miR-185 Suppressed Cell Proliferation and Glycolysis in AML Cells in vitro
To explore biological functions of miR-185 in AML, functional experiments were carried out. First of all, HL-60 and KG-1 cells were transfected with miR-185/NC mimic, and the transfection efficiency was determined. As presented, miR-185 level was abundantly upregulated with miR-185 mimic transfection analyzed by RT-qPCR (Figure 5A). Cell proliferation and glycolysis were strongly inhibited by miR-185 overexpression, as evidenced by attenuated cell viability (Figure 5B and C), glucose consumption (Figure 5D), lactate production (Figure 5E), and HK2 expression (Figure 5F). On the contrary, apoptotic rate was induced in HL-60 and KG-1 cells in response to miR-185 upregulation (Figure 5G). These data showed that upregulation of miR-185, similar to TUG1 knockdown, could suppress cell proliferation and glycolysis in AML cells in vitro.
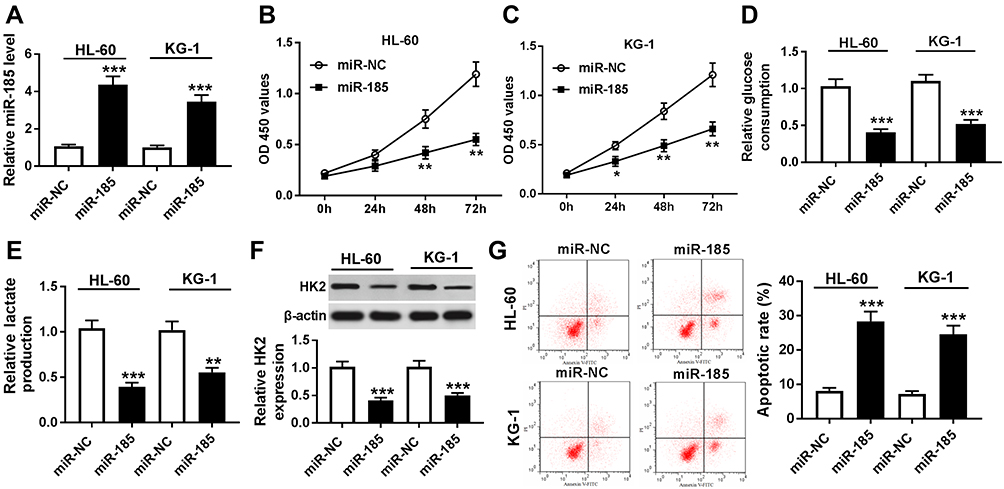 |
Figure 5 Role of miR-185 overexpression in human AML cells in vitro. (A–G) HL-60 and KG-1 cells were transfected with miR-185/NC. After transfection, (A) RT-qPCR determined miR-185 expression level, (B and C) MTT assay measured cell viability, (D and E) commercial kits measured glucose consumption and lactate production, (F) Western blot assay examined HK2 expression, and (G) flow cytometry determined apoptotic rate. The error bars represent the mean±SEM of three independent experiments. *P<0.05, **P<0.01, and ***P<0.001 compared with the miR-NC group. |
miR-185 Downregulation Partially Overturned the Inhibitory Effect of TUG1 Knockdown on Proliferation and Glycolysis in AML Cells in vitro
Then, to discover the underlying mechanism of TUG1 and miR-185 in AML cells in vitro, HL-60 and KG-1 cells were co-transfected with si-TUG1 and anti-mir-185 or anti-miR-NC. As depicted, the lower cell viability in si-TUG1 transfected cells was improved by anti-miR-185 co-transfection (Figure 6A and B). Moreover, si-TUG1 sole transfection led to attenuated glucose consumption (Figure 6C and D), lactate production (Figure 6E and F), and HK2 protein expression (Figure 6G and H) in HL-60 and KG-1 cells, which was abolished by simultaneous miR-185 deletion. Besides, the apoptotic rate was increased by TUG1 knockdown, and this promotion was attenuated by anti-miR-185 introduction (Figure 6I and J). These outcomes revealed that TUG1 knockdown displayed inhibitory effects on glycolysis and cell proliferation in AML cells depending on upregulating its target gene miR-185.
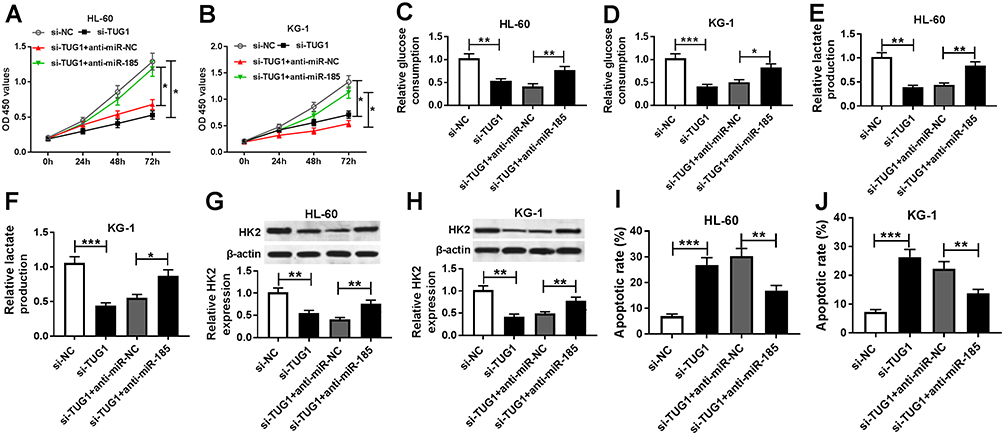 |
Figure 6 Influence of miR-185 on the role of TUG1 knockdown in human AML cells in vitro. (A–J) HL-60 and KG-1 cells were transfected with si-TUG1/NC or co-transfected with si-TUG1 and anti-miR-185/NC. After transfection, (A and B) cell viability, (C–F) glucose consumption and lactate production, (G and H) HK2 expression, and (I and J) apoptotic rate were measured by MTT assay, commercial kits, Western blot, and flow cytometry, respectively. The error bars represent the mean±SEM of three independent experiments. *P<0.05, **P<0.01, and ***P<0.001 compared with controls (si-NC or si-TUG1+anti-miR-NC). |
Discussion
Aerobic glycolysis had been declared to be popular in AML cells. Except abnormally expressed glucose metabolites in AML sera,16 hypoxia-inducible factor (HIF)-1 and -2 expression and their possible biologic impacts functioned as an essential role in AML. For example, Wang et al21 proposed HIF-1α mRNA was clearly more highly expressed in CD34+CD38− leukemic cells than in CD34+CD38+ cells. Moreover, HIF-1α shRNA, as well as the HIF inhibitor echinomycin, could reduce leukemic growth in leukemic xenograft models initiated by primary AML cells. Rouault-Pierre et al22 showed 10/33 patients with AML displayed a higher level of HIF-2α, and its silencing in leukemic blasts induced an overall significant inhibition in leukemic engraftment into immune-deficient mice. Furthermore, glucose metabolites were abnormally expressed in AML sera,16 and altered glucose metabolism had been described as a cause of chemo-resistance in AML. Findings from Song et al23 indicated that no remission AML patients (NR-AML) showed a decreased β subunit of human F1-F0 adenosine triphosphate synthase (β-F1-ATPase) and increased HIF-1α, HK2, GLUT1, and LDH, suggesting that increased glycolysis and low efficiency of oxidative phosphorylation might contribute to ADR resistance. In this study, we found TUG1 was upregulated in AML patients and cells, and knockdown of TUG1 suppressed cell proliferation and glycolysis in HL-60 and KG-1 cells through targeting miR-185, accompanied with lower cell viability and higher apoptotic rate.
Noncoding RNAs including lncRNAs and miRNAs have been shown to be closely involved in glucose metabolism in cancers. However, there was still very limited information of lncRNAs in glycolysis in AML. The study from Zhang et al24 demonstrated the first evidence that lncRNA UCA1 targeting miR-125a regulated ADR resistance of pediatric AML by glycolysis pathway in HL-60 cells, as evidenced by altered glucose consumption, lactate production, and expression of HIF-1α and HK2. Another work from Sun et al25 claimed that lncRNA ANRIL could promote malignant cell survival and cell glucose metabolism to accelerate AML progression through the AdipoR1-AMPK/SIRT1 signaling pathway. Very recently, an association of TUG1 and HK2 was widely described in malignant tumors. For instance, TUG1 functioned as a ceRNA affected cell growth, metastasis, and glycolysis through regulating HK2 expression through the TUG1/miR-455-3p/AMPKβ2 axis in hepatocellular carcinoma cells.20 In osteosarcoma, glycolysis was implied to be involved in the effect of TUG1 on cell viability.19 However, whether TUG1 took part in regulating glycolysis in AML cells was unclear yet. Herewith, in this study, functional assays depicted that TUG1 knockdown in HL-60 and KG-1 cells resulted in reduced glucose consumption, lactate production, and HK2 protein expression. In brief, we discovered that TUG1 constructively modulated AML cell viability, apoptosis, and glycolysis by sponging miR-185 in vitro. Notably, we provided the first information about the target relationship between TUG1 and miR-185. However, further studies should be required to define the downstream target genes and the signaling pathways underlying the TUG1/miR185 axis in AML cells.
Expression of TUG1 was upregulated in AML patients, and even higher in refractory or relapsed acute myeloid leukemia (R/R AML) patients.12 Clinically, the correlation of TUG1 with clinicopathological characteristics and prognosis had been reported in several studies. For example, Qin et al11 indicated that TUG1 was positively correlated with white blood cell counts as well as a poor risk stratification, and negatively correlated with event-free survival and overall survival in 230 de novo AML patients. Consistently, another work from Wang et al13 showed higher TUG1 level independently predicted worse event-free survival and overall survival, as evidenced by higher white blood cell counts, monosomal karyotype, FLT3-ITD mutation, poor-risk stratification, and poor prognosis. In vitro, expression of TUG1 was upregulated in AML cell lines KG-1, MOLM-14, Kasumi-6, THP-1, and HL-60, compared to CD34+ cells sorted from healthy bone marrow aspirates;11,13 while, level of TUG1 in the AML cell line NB-4 was controversial. However, the role of TUG1 in AML cells activity had been unanimous. Cell proliferation was reduced, but apoptosis was promoted in KG-1 cells transfected with a TUG1 inhibitor, as descripted by CCK-8 assay, flow cytometry, and Western blot;11,13 meanwhile, the TUG1 mimic facilitated cell proliferation and reduced apoptosis. Furthermore, the first target gene of TUG1 identified in AML was aurora kinase A.13 Here, our results supported the high expression of TUG1 in clinical AML specimens and cell lines HL-60, KG-1, MOLM-14, and MOLM-13 compared with healthy controls and nPBMC, respectively. Knockdown of TUG1 promoted the apoptosis rate and suppressed cell viability in HL-60 and KG-1 cells, accompanied by inhibited glycolysis. A novel mechanism of TUG1 in AML cells was uncovered through serving as ceRNA of miR-185. Rescue experiments declared that miR-185 downregulation could partially overturn the inhibitory effect of TUG1 knockdown in AML cells. This present study suggested that TUG1 might be a potential biomarker in the development and prognosis of patients with AML. Notably, there is mounting evidence for an involvement of TUG1 in chemo-resistance of cancer.26,29 In AML, Li et al14 demonstrated elevated TUG1 expression in adriamycin (ADR)-resistant tissues and cells, and TUG1 knockdown sensitized AML cells to ADR in vitro and in vivo through epigenetically regulating miR-34a expression. Taken together, TUG1 plays a pivotal role in AML, and could be a novel biomarker and therapeutic target for AML development, treatment, and prognosis.
It had been reported that miR-185 participated in many pathological processes, especially in cancer progression.30,32 In addition, expression level of this miRNA was closely involved in HCV infection in hepatocellular carcinoma.33 In leukemia, several miRNAs were found to be implicated in metabolic adaptation of cells to a transformed state in types of leukemia, including miR-125b in chronic lymphocytic leukemia (CLL) and T-cell acute lymphoblastic leukemia (T-ALL),34,35 miR-22 in chronic myeloid leukemia (CML),36 and miR-125a in AML.24 Meanwhile, miR-15b-3p, miR-182-5p, and miR-185-5p were found to be involved in acute lymphoblastic leukemia (ALL).37 Moreover, it was demonstrated that miR-185 enhanced glucocorticoid sensitivity via suppressing the mTORC signaling pathway,37 suggesting miR-185 as a potential target for diagnosis and reversion of glucocorticoid resistance. Chen et al38 investigated specific variations of miRNA expression patterns in microvesicles (MVs) derived from CML K562 cells, and miR-185 was expressed both in MVs derived from K562 cells and in K562 cells. Whereas there was no data to illuminate the role of miR-185 in AML. Herein, we discovered that miR-185 was significantly downregulated in AML patients and cell lines. Additionally, the role of miR-185 was partially explained in AML, and its overexpression led to impaired cell proliferation and glucose metabolism in HL-60 and KG-1 cells as shown by induced apoptosis rate, reduced cell viability, glucose consumption, lactate production, and HK2 protein expression. In this study, we provided evidence for a target relationship between TUG1 and miR-185 in AML.
In conclusion, TUG1 was found to be upregulated in AML patients and cells. Knockdown of TUG1 might suppress AML development through inhibiting glycolysis and cell proliferation via targeting miR-185. This is probably the first report that TUG1 could regulate the glucose metabolism in AML through a TUG1/miR-185 pathway. Furthermore, our study might provide a new piece of theoretical evidence for targeted therapy in AML, especially targeting of glycolysis.
Disclosure
The authors declare that they have no competing interests for this work.
References
1. Dohner H, Weisdorf DJ, Bloomfield CD. Acute myeloid leukemia. N Engl J Med. 2015;373(12):1136–1152. doi:10.1056/NEJMra1406184
2. Short NJ, Ravandi F. Acute myeloid leukemia: past, present, and prospects for the future. Clin Lymphoma Myeloma Leuk. 2016;16(Suppl):S25–S29. doi:10.1016/j.clml.2016.02.007
3. Dohner H, Estey EH, Amadori S, et al. Diagnosis and management of acute myeloid leukemia in adults: recommendations from an international expert panel, on behalf of the European LeukemiaNet. Blood. 2010;115(3):453–474. doi:10.1182/blood-2009-07-235358
4. Reikvam H, Hauge M, Brenner AK, et al. Emerging therapeutic targets for the treatment of human acute myeloid leukemia (part 1) - gene transcription, cell cycle regulation, metabolism and intercellular communication. Expert Rev Hematol. 2015;8(3):299–313. doi:10.1586/17474086.2015.1032935
5. Dohner H, Estey E, Grimwade D, et al. Diagnosis and management of AML in adults: 2017 ELN recommendations from an international expert panel. Blood. 2017;129(4):424–447. doi:10.1182/blood-2016-08-733196
6. Finn L, Dalovisio A, Foran J. Older patients with acute myeloid leukemia: treatment challenges and future directions. Ochsner J. 2017;17(4):398–404.
7. Tam C, Wong JH, Tsui SKW, et al. LncRNAs with miRNAs in regulation of gastric, liver, and colorectal cancers: updates in recent years. Appl Microbiol Biotechnol. 2019;103(12):4649–4677.
8. Alvarez-Dominguez JR, Lodish HF. Emerging mechanisms of long noncoding RNA function during normal and malignant hematopoiesis. Blood. 2017;130(18):1965–1975. doi:10.1182/blood-2017-06-788695
9. Cao L, Xiao PF, Tao YF, et al. Microarray profiling of bone marrow long non-coding RNA expression in Chinese pediatric acute myeloid leukemia patients. Oncol Rep. 2016;35(2):757–770. doi:10.3892/or.2015.4415
10. Ghaforui-Fard S, Vafaee R, Taheri M. Taurine-upregulated gene 1: a functional long noncoding RNA in tumorigenesis. J Cell Physiol. 2019;234(10):17100–17112. doi:10.1002/jcp.28464
11. Qin J, Bao H, Li H. Correlation of long non-coding RNA taurine-upregulated gene 1 with disease conditions and prognosis, as well as its effect on cell activities in acute myeloid leukemia. Cancer Biomark. 2018;23(4):569–577. doi:10.3233/CBM-181834
12. Luo W, Yu H, Zou X, et al. Long non-coding RNA taurine-upregulated gene 1 correlates with unfavorable prognosis in patients with refractory or relapsed acute myeloid leukemia treated by purine analogue based chemotherapy regimens. Cancer Biomark. 2018;23(4):485–494. doi:10.3233/CBM-181405
13. Wang X, Zhang L, Zhao F, et al. Long non-coding RNA taurine-upregulated gene 1 correlates with poor prognosis, induces cell proliferation, and represses cell apoptosis via targeting aurora kinase A in adult acute myeloid leukemia. Ann Hematol. 2018;97(8):1375–1389. doi:10.1007/s00277-018-3315-8
14. Li Q, Song W, Wang J. TUG1 confers Adriamycin resistance in acute myeloid leukemia by epigenetically suppressing miR-34a expression via EZH2. Biomed Pharmacother. 2019;109:1793–1801. doi:10.1016/j.biopha.2018.11.003
15. Herst PM, Howman RA, Neeson PJ, et al. The level of glycolytic metabolism in acute myeloid leukemia blasts at diagnosis is prognostic for clinical outcome. J Leukoc Biol. 2011;89(1):51–55. doi:10.1189/jlb.0710417
16. Chen WL, Wang JH, Zhao AH, et al. A distinct glucose metabolism signature of acute myeloid leukemia with prognostic value. Blood. 2014;124(10):1645–1654. doi:10.1182/blood-2014-02-554204
17. Hauge M, Bruserud Ø, Hatfield KJ. Targeting of cell metabolism in human acute myeloid leukemia–more than targeting of isocitrate dehydrogenase mutations and PI3K/AKT/mTOR signaling? Eur J Haematol. 2016;96(3):211–221. doi:10.1111/ejh.12690
18. Shankaraiah RC, Veronese A, Sabbioni S, et al. Non-coding RNAs in the reprogramming of glucose metabolism in cancer. Cancer Lett. 2018;419:167–174. doi:10.1016/j.canlet.2018.01.048
19. Han X, Yang Y, Sun Y, et al. LncRNA TUG1 affects cell viability by regulating glycolysis in osteosarcoma cells. Gene. 2018;674:87–92. doi:10.1016/j.gene.2018.06.085
20. Lin YH, Wu MH, Huang YH, et al. Taurine up-regulated gene 1 functions as a master regulator to coordinate glycolysis and metastasis in hepatocellular carcinoma. Hepatology (Baltimore, Md). 2018;67(1):188–203. doi:10.1002/hep.29462
21. Wang Y, Liu Y, Malek SN, et al. Targeting HIF1α eliminates cancer stem cells in hematological malignancies. Cell Stem Cell. 2011;8(4):399–411. doi:10.1016/j.stem.2011.02.006
22. Rouault-Pierre K, Lopez-Onieva L, Foster K, et al. HIF-2α protects human hematopoietic stem/progenitors and acute myeloid leukemic cells from apoptosis induced by endoplasmic reticulum stress. Cell Stem Cell. 2013;13(5):549–563. doi:10.1016/j.stem.2013.08.011
23. Song K, Li M, Xu X, et al. Resistance to chemotherapy is associated with altered glucose metabolism in acute myeloid leukemia. Oncol Lett. 2016;12(1):334–342. doi:10.3892/ol.2016.4600
24. Zhang Y, Liu Y, Xu X. Knockdown of LncRNA-UCA1 suppresses chemoresistance of pediatric AML by inhibiting glycolysis through the microRNA-125a/hexokinase 2 pathway. J Cell Biochem. 2018;119(7):6296–6308. doi:10.1002/jcb.26899
25. Sun LY, Li XJ, Sun YM, et al. LncRNA ANRIL regulates AML development through modulating the glucose metabolism pathway of AdipoR1/AMPK/SIRT1. Mol Cancer. 2018;17(1):127. doi:10.1186/s12943-018-0879-9
26. Hu T, Fei Z, Su H, et al. Polydatin inhibits proliferation and promotes apoptosis of doxorubicin-resistant osteosarcoma through LncRNA TUG1 mediated suppression of Akt signaling. Toxicol Appl Pharmacol. 2019;371:55–62. doi:10.1016/j.taap.2019.04.005
27. Yu G, Zhou H, Yao W, et al. lncRNA TUG1 promotes cisplatin resistance by regulating CCND2 via epigenetically silencing miR-194-5p in bladder cancer. Mol Ther Nucleic Acids. 2019;16:257–271. doi:10.1016/j.omtn.2019.02.017
28. Yang F, Li X, Zhang L, et al. LncRNA TUG1 promoted viability and associated with gemcitabine resistant in pancreatic ductal adenocarcinoma. J Pharmacol Sci. 2018;137(2):116–121. doi:10.1016/j.jphs.2018.06.002
29. Niu Y, Ma F, Huang W, et al. Long non-coding RNA TUG1 is involved in cell growth and chemoresistance of small cell lung cancer by regulating LIMK2b via EZH2. Mol Cancer. 2017;16(1):5. doi:10.1186/s12943-016-0575-6
30. Tian C, Deng Y, Jin Y, et al. Long non-coding RNA RNCR3 promotes prostate cancer progression through targeting miR-185-5p. Am J Transl Res. 2018;10(5):1562–1570.
31. Zhang W, Sun Z, Su L, et al. miRNA-185 serves as a prognostic factor and suppresses migration and invasion through Wnt1 in colon cancer. Eur J Pharmacol. 2018;825:75–84. doi:10.1016/j.ejphar.2018.02.019
32. Zhao L, Zhang Y, Liu J, et al. MiR-185 inhibits cell proliferation and invasion of non-small cell lung cancer by targeting KLF7. Oncol Res. 2018.
33. Fan HX, Feng YJ, Zhao XP, et al. MiR-185-5p suppresses HBV gene expression by targeting ELK1 in hepatoma carcinoma cells. Life Sci. 2018;213:9–17. doi:10.1016/j.lfs.2018.10.016
34. Tili E, Michaille JJ, Luo Z, et al. The down-regulation of miR-125b in chronic lymphocytic leukemias leads to metabolic adaptation of cells to a transformed state. Blood. 2012;120(13):2631–2638. doi:10.1182/blood-2012-03-415737
35. Liu Z, Smith KR, Khong HT, et al. miR-125b regulates differentiation and metabolic reprogramming of T cell acute lymphoblastic leukemia by directly targeting A20. Oncotarget. 2016;7(48):78667–78679. doi:10.18632/oncotarget.12018
36. Monteleone F, Taverna S, Alessandro R, et al. SWATH-MS based quantitative proteomics analysis reveals that curcumin alters the metabolic enzyme profile of CML cells by affecting the activity of miR-22/IPO7/HIF-1α axis. J Exp Clin Cancer Res. 2018;37(1):170. doi:10.1186/s13046-018-0843-y
37. Chen P, Shen T, Wang H, et al. MicroRNA-185-5p restores glucocorticoid sensitivity by suppressing the mammalian target of rapamycin complex (mTORC) signaling pathway to enhance glucocorticoid receptor autoregulation. Leuk Lymphoma. 2017;58(11):2657–2667.
38. Chen X, Xiong W, Li H. Comparison of microRNA expression profiles in K562-cells-derived microvesicles and parental cells, and analysis of their roles in leukemia. Oncol Lett. 2016;12(6):4937–4948. doi:10.3892/ol.2016.5308
 © 2020 The Author(s). This work is published and licensed by Dove Medical Press Limited. The
full terms of this license are available at https://www.dovepress.com/terms
and incorporate the Creative Commons Attribution
- Non Commercial (unported, 3.0) License.
By accessing the work you hereby accept the Terms. Non-commercial uses of the work are permitted
without any further permission from Dove Medical Press Limited, provided the work is properly
attributed. For permission for commercial use of this work, please see paragraphs 4.2 and 5 of our Terms.
© 2020 The Author(s). This work is published and licensed by Dove Medical Press Limited. The
full terms of this license are available at https://www.dovepress.com/terms
and incorporate the Creative Commons Attribution
- Non Commercial (unported, 3.0) License.
By accessing the work you hereby accept the Terms. Non-commercial uses of the work are permitted
without any further permission from Dove Medical Press Limited, provided the work is properly
attributed. For permission for commercial use of this work, please see paragraphs 4.2 and 5 of our Terms.