Back to Journals » OncoTargets and Therapy » Volume 13
Long Non-Coding RNA ASB16-AS1 Functions as a miR-760 Sponge to Facilitate the Malignant Phenotype of Osteosarcoma by Increasing HDGF Expression
Authors Yin R, Liu J, Zhao D, Wang F
Received 26 November 2019
Accepted for publication 27 February 2020
Published 13 March 2020 Volume 2020:13 Pages 2261—2274
DOI https://doi.org/10.2147/OTT.S240022
Checked for plagiarism Yes
Review by Single anonymous peer review
Peer reviewer comments 2
Editor who approved publication: Dr Sanjay Singh
This paper has been retracted.
Ruofeng Yin, 1 Junzhi Liu, 2 Dongxu Zhao, 1 Fei Wang 1
1Department of Orthopedics, China-Japan Union Hospital Jilin University, Changchun, Jilin 130033, People’s Republic of China; 2Department of Quality Control, China-Japan Union Hospital Jilin University, Changchun, Jilin 130033, People’s Republic of China
Correspondence: Fei Wang
Department of Orthopedics, China-Japan Union Hospital Jilin University, No. 126, Xiantai Road, Changchun, Jilin 130033, People’s Republic of China
Email [email protected]
Purpose: ASB16 antisense RNA 1 (ASB16-AS1) is a cancer-associated long non-coding RNA that contributes to tumorigenesis and tumor development. Nevertheless, to the best of our knowledge, whether and how ASB16-AS1 is implicated in osteosarcoma (OS) malignancy remains unclear and therefore warrants exploration. Our current study focused on making in-depth investigation of ASB16-AS1 in OS. In the present study, the expression pattern of ASB16-AS1 in OS tissues and cell lines was analyzed. In addition, we examined the clinical value of ASB16-AS1 for OS patients. Furthermore, we explored the impacts of ASB16-AS1 on the malignant phenotype of OS cells in vitro and in vivo as well as the underlying mechanism.
Methods: ASB16-AS1, microRNA-760 (miR-760) and hepatoma-derived growth factor (HDGF) expressions were measured using reverse transcription-quantitative PCR. Cell proliferation and apoptosis were evaluated using CCK-8 and flow cytometry analyses, respectively, and cell migration and invasion were determined via cell migration and invasion assays.
Results: ASB16-AS1 expression was significantly elevated in OS tissues and cell lines, and increased ASB16-AS1 expression was related to patients’ tumor size, TNM stage, and distant metastasis. The overall survival rate of OS patients presenting high ASB16-AS1 expression was shorter than that of patients presenting low ASB16-AS1 expression. Reduced ASB16-AS1 expression inhibited OS cell proliferation, migration, and invasion; promoted cell apoptosis; and impaired tumor growth in vivo. Mechanistically, ASB16-AS1 served as a sponge for miR-760 and positively modulated the expression of its target HDGF. Finally, inhibiting miR-760 and restoring HDGF expression abolished the impacts of ASB16-AS1 knockdown on the malignant characteristics of OS cells.
Conclusion: ASB16-AS1 is a novel oncogenic lncRNA in OS cells. ASB16-AS1 increased HDGF expression by sponging miR-760, thereby conferring cancer-promoting roles in OS. ASB16-AS1 is a potential early diagnostic and therapeutic target in OS.
Keywords: osteosarcoma therapy, ASB16-AS1, hepatoma-derived growth factor, microRNA-760
Introduction
Osteosarcoma (OS), a malignancy originating from mesenchymal cells, mainly occurs in adolescents and young adults.1 OS accounts for approximately 56% of all malignant neoplasms and ranks third among the most common cancers of adolescents.2 The metaphysis of the long tubular bone is the principle site of OS, although other bones can be affected.3 Patients with OS are usually treated with surgical resection in combination with adjuvant chemotherapy, transplantation, and radiotherapy.4 With the development of early diagnostic methods and therapeutic techniques, clinical outcomes of patients with OS have noticeably improved. However, OS continues to pose considerable threat to patients’ survival due to early metastasis, chemoresistance, and recurrence.5 The 5-year survival rate of OS patients without metastasis is 55%–70% following first-line therapy; however, it has fallen to approximately 5%–20% in OS patients with metastasis.6,7 The pathogenesis of OS is complex and involves a number of complicated biological events; however, detailed mechanisms remain to be investigated and confirmed.8,9 Accordingly, there is an urgent need to explore the mechanism of OS onset and progression to develop promising therapeutic strategies.
Long non-coding RNAs (lncRNAs) are a family of evolutionarily non-protein-coding RNA molecules with transcripts containing over 200 nucleotides.10 They are involved in several aspects of physiological and pathological processes, and their regulatory functions are mediated via diversified mechanisms involving chromatin modification, gene transcriptional regulation, epigenetic modulation, mRNA post-transcriptional processing, and interaction with proteins or microRNAs (miRNAs).11–13 In recent years, alteration of lncRNA expression has been widely reported in numerous human malignancies and is likely to exert a great impact on carcinogenesis and cancer progression.14–16 Regarding OS, extensive evidence has demonstrated that many lncRNAs are dysregulated and that this dysregulation is important in tumor onset and development.17–19 For instance, FBXL19-AS1,20 GClnc1,21 and DLX6-AS122 are highly expressed in OS and play cancer-promoting roles in regulating cancer aggressiveness. On the contrary, TUSC7,23 AWPPH,24 and HAND2-AS125 are weakly expressed in OS and restrain malignant cancer cell phenotypes. Therefore, understanding of the detailed roles of OS-related lncRNAs may lead to the identification of potential targets for treating patients with this disease.
ASB16 antisense RNA 1 (ASB16-AS1) is a cancer-associated lncRNA that contributes to tumorigenesis and tumor development.26,27 However, to the best of our knowledge, whether and how ASB16-AS1 is implicated in OS malignancy remains unclear and therefore warrants exploration. Therefore, the present study aimed to investigate the detailed functions of ASB16-AS1 in OS. Our findings advance the understanding of crucial functions of ASB16-AS1 in OS and may promote the identification of promising therapeutic targets for patients with this fatal disease.
Materials and Methods
Patients and OS Tissues
The present study was approved by the ethics committee of China-Japan Union Hospital Jilin University and was performed in accordance with the Declaration of Helsinki. A written informed consent was provided by all participants prior to their enrollment in the study. A total of 47 patients with OS were recruited. OS tissues and their corresponding adjacent normal tissues were collected after surgical excision and immediately stored in liquid nitrogen prior to usage. No patients had received chemotherapy, transplantation, radiotherapy, or other anticancer treatments.
Cell Lines
A normal human osteoblast hFOB1.19 and five OS cell lines (HOS, 143B, MG-63, U2OS, and SAOS-2) were purchased from American Type Culture Collection (Manassas, VA, USA). Dulbecco’s Modified Eagle Medium: Nutrient Mixture F-12 (DMEM/F-12) containing 150 mg/L L-glutamine, 1.5 g/L NaHCO3, and 10% fetal bovine serum (FBS; all from Gibco, Invitrogen, Carlsbad, CA, USA) was used for culturing hFOB1.19 cells. OS cell lines were maintained in DMEM supplemented with 10% FBS plus 1% penicillin and streptomycin (Sigma-Aldrich, Milan, Italy). All cells were cultured in 5% CO2 at 37°C in a humidified atmosphere.
Cell Transfection
ASB16-AS1-targeting small interfering RNA (siRNA; si- ASB16-AS1) and target-free siRNA (si-NC) were obtained from GenePharma (Shanghai, China). The si- ASB16-AS1 sequences were 5ʹ- GGTTCTGAATCATTCAGTT-3ʹ and the si-NC sequences were 5ʹ-UUCUCCGAACGUGUCACGUTT-3ʹ. To increase endogenous HDGF expression, the pcDNA3.1 plasmid carrying full-length HDGF or the empty pcDNA3.1 plasmid was chemically generated by RiboBio (Guangzhou, China). miR-760 agomir (agomir-760) and miR-760 antagomir (antagomir-760) used to overexpress and silence miR-760 expression, respectively, were purchased from GenePharma; agomir-NC and antagomir-NC were controls. Cells in the logarithmic growth phase were collected and seeded into 6-well plates. When the cell density reached 60% confluence, transient transfection was conducted using Lipofectamine 2000 (Invitrogen; Thermo Fisher Scientific, Inc.).
Reverse Transcription-Quantitative PCR (RT-qPCR)
TRIzol reagent (Invitrogen; Thermo Fisher Scientific, Inc.) was used for total RNA isolation, and the isolated total RNA was subjected to determination of RNA quality with a NanoDrop™ 2000 spectrophotometer (Thermo Fisher Scientific, Inc.). To assess the expression of miR-760, total RNA was reverse transcribed to cDNA using the miScript Reverse Transcription Kit (Qiagen GmbH, Hilden, Germany). Quantitative PCR systems were prepared through a miScript SYBR Green PCR kit (Qiagen GmbH). U6 small nuclear RNA functioned as an internal control for determination of miR-760 expression. To quantify ASB16-AS1 and HDGF mRNA, cDNA was produced using the PrimeScript™RT reagent Kit, and then used for qPCR with a SYBR® Premix Ex Taq™ (both from Takara Biotechnology Co., Ltd., Dalian, China). β-actin was used for the normalization of ASB16-AS1 and HDGF mRNA. All gene expressions were analyzed by the 2−ΔΔCq method.
Cell Counting Kit-8 (CCK-8) Assay
After a 24-h culture, cells transfected with the abovementioned molecular products were harvested and suspensions were prepared at a density of 2 × 10⁴ cells/mL. A total of 100 µL cell suspension was inoculated into each well of 96-well plates. Five replicates were made for each group. Cells were grown for 0, 24, 48, and 72 h at 37°C in a humidified atmosphere with 5% CO2, at which point 10 µL CCK-8 (Dojindo Laboratories Co. Ltd., Kumamoto, Japan) was added. Following incubation for additional 4 h, optical density (OD) was recorded at 450 nm using a microplate reader (Bio-Rad, Hercules, CA, USA).
Flow Cytometry
Sufficient number of transfected cells were harvested after a 48-h incubation, washed twice with ice-cooled phosphate buffer solution and centrifugated 716 ×g for 5 min to discard the phosphate buffer solution. An Annexin V fluorescein isothiocyanate (FITC) apoptosis detection kit (Biolegend, San Diego, CA, USA) was applied for measurement of cell apoptosis. In short, transfected cells were resuspended in 100 µL 1× binding buffer. Prior to determination of the apoptosis rate on the flow cytometer (FACScan; BD Biosciences, Franklin Lakes, NJ, USA), the transfected cells were treated with 5 µL of Annexin V and 5 µL of PI and kept at room temperature under darkness for 15 min. Cell Quest acquisition software (version 2.9; BD Biosciences) was used for data analysis.
EDTA-free trypsin was used to treat transfected cells at 48 h post-transfection. Subsequent to washing twice using pre-cooled phosphate buffer solution, transfected cells were fixed in 70% ethanol at 4°C for 1 h. Following this treatment, transfected cells were collected and incubated with 50 µL of RNase (100 µg/mL). Then, 25 µL of the propidium iodide solution was added into 425 µL of cell staining buffer (both from Biolegend, San Diego, CA, USA). The cells were resuspended and incubated at room temperature for 30 min. Cell cycle status was tested using a flow cytometer.
Cell Migration and Invasion Assays
For the invasion assay, Matrigel (BD Biosciences, Franklin Lakes, NJ, USA) diluted with FBS-free DMEM was added into the upper chamber. After ~6 h of incubation until the Matrigel was solidified, 5×10⁴ transfected cells suspended in FBS-free DMEM medium were seeded into the upper chamber. The basolateral chambers were covered with 500 μL DMEM that was supplemented with 10% FBS. Cells were maintained at 37°C in a humidified atmosphere with 5% CO2 for 24 h, then fixed with 4% paraformaldehyde, and stained with 0.5% crystal violet. Thereafter, the non-invasive cells were eliminated with cotton ball, and the invasive cells were imaged under an inverted microscope (Olympus, Tokyo, Japan). Cell migration assay was carried out in the same way as the invasion assay, except that the upper chambers were no pre-coated with Matrigel. The number of migratory and invasive cells was counted in five visual fields to count the mean value.
Xenograft Mouse Model
All animal studies were approved by the Committee on the Ethics of Animal Experiments of China-Japan Union Hospital Jilin University, and were conducted in compliance with the Animal Protection Law of the People’s Republic of China-2009 for experimental animals. We mentioned this information in the manuscript. The lentiviral plasmids (Hanbio Biotechnology Co., Ltd.) that specifically and stably expressed ASB16-AS1-targeting short hairpin RNA (sRNA; sh- ASB16-AS1) and target-free shRNA (sh-NC) were chemically produced by Hanbio Biotechnology Co., Ltd (Shanghai, China). U2OS cells were infected with the above lentiviral plasmids and then selected via Puromycin. U2OS cells stably expressing sh-ASB16-AS1 or sh-NC were subcutaneously injected into BALB/c male nude mice (Beijing HFK Bioscience Co., Ltd; Beijing, China). A vernier caliper was utilized to record the width and length of tumor xenografts. The tumor volume was determined with the following formula: volume = 1/2 × length × (width).2 At the termination of the in vivo assay (4 weeks post-injection), all mice were sacrificed, and tumor xenografts were collected for further use.
Hematoxylin and Eosin (HE) Staining
Tumor xenografts were fixed by means of 10% formaldehyde, embedded in paraffin and then cut into 4 μm sections. After dewaxing using xylene, the section were hydrated with gradient ethanol and stained with hematoxylin for 5 min, after which were differentiated in hydrochloric acid alcohol and counterstained with eosin for 2 min. After that, the sections treated with different concentrations ethanol for dehydration, transparentized with xylene I and xylene II, and finally mounted in neutral gum. An inverted microscope (Olympus, Tokyo, Japan) was utilized for for photography and observation.
Bioinformatic Prediction
The interaction between ASB16-AS1-miRNA was predicted using the online database starBase 3.0 (http://starbase.sysu.edu.cn/). Putative targets of miR-760 were predicted with starBase 3.0, TargetScan algorithms (http://www.targetscan.org) and miRDB (http://mirdb.org/).
Subcellular Fractionation
The nuclear and cytoplasmic fractions of OS cells was separated with a Cytoplasmic and Nuclear RNA Purification Kit (Norgen Biotek, Thorold, Canada). RNA from the nuclear and cytoplasmic fractions was extracted and subjected to RT-qPCR for the assessment of ASB16-AS1 expression distribution in OS cells.
RNA Immunoprecipitation (RIP) Assay
The assay was processed based on the EZ-Magna RIP RNA-binding protein immunoprecipitation kit (Millipore, Billerica, MA, USA) instructions. OS cells were incubated with pre-cooled lysis buffer containing protease inhibitor and ribonuclease inhibitor. The lysate was incubated with RIP immunoprecipitation buffer supplemented with magnetic beads coated with human anti-argonaute2 (AGO2) or IgG antibody. Next, after extensive washing with wash buffer, the immunoprecipitate complex was treated with Proteinase K buffer at 55°C to digest protein. Finally, immunoprecipitated RNA was extracted and subjected to RT-qPCR.
Luciferase Reporter Assay
The 3′-UTR of HDGF containing the wild-type (wt) or mutant (mut) binding site for miR-760 was amplified by GenePharma and inserted into pmirGLO dual-luciferase vector (Promega, Madison, WI, USA). The synthesized luciferase reporter plasmids were respectively defined as HDGF-wt and HDGF-mut. The plasmids ASB16-AS1-wt and ASB16-AS1-mut were constructed via similar experimental steps. Either wt or mut plasmid was transected into OS cells in the presence of agomir-760 or agomir-NC. After a 48-h culture, the transected cells were collected and subsequently subjected to a dual-luciferase reporter assay (Promega) to detect the firefly and Renilla luciferase activities. Renilla luciferase activity was used for data normalization.
Western Blotting
The total protein was extracted using RIPA buffer (Beyotime Institute of Biotechnology; Haimen, China), and its concentration was quantified with the bicinchoninic acid protein assay kit (Beyotime Institute of Biotechnology). Equal amounts of protein were separated by 10% SDS-polyacrylamide gel electrophoresis and transferred to polyvinylidene difluoride membrane. Following 2-h blocking with 5% fat-free milk, the membranes were incubated with primary antibodies against HDGF (1:1000; ab128921; Abcam, Cambridge, UK) or GAPDH (1:1000; ab128915; Abcam) at 4°C overnight. On the next day, the membranes were treated with goat anti-rabbit horseradish peroxidase-conjugated secondary antibody (1:5000; ab150077; Abcam) at room temperature for 2 h, followed by processing with the Immobilon Western Chemiluminescent HRP Substrate kit (EMD Millipore) for visualizing the protein signals. GAPDH was used as an endogenous control for data normalization.
Statistical Analysis
All results are shown as mean and standard deviation. SPSS (version 16.0; SPSS Inc.) was used for all statistical analyses. The statistical significance among multiple groups was analyzed with one-way analysis of variance followed by Tukey’s test. Student’s t-test was employed to test the differences between two groups. The association between ASB16-AS1 expression and clinicopathological parameters of patients with OS was examined via Chi-square test. The overall survival curves were plotted using Kaplan–Meier analysis and compared using the Log rank test. Associations among the expression of ASB16-AS1 and miR-760, miR-760 and HDGF as well as between ASB16-AS1 and HDGF were explored via Spearman correlation analysis. P<0.05 was considered statistically significant.
Results
ASB16-AS1 Is Upregulated in OS Tissues and Cell Lines and Is Correlated to Poor Prognosis
To examine the implication of ASB16-AS1 in OS, its expression profiles in 47 pairs of OS tissues and their corresponding adjacent normal tissues were detected via RT-qPCR. ASB16-AS1 expression was higher in OS tissues than in the corresponding adjacent normal tissues (Figure 1A). In addition, ASB16-AS1 expression was analyzed in five human OS cell lines (HOS, 143B, MG-63, U2OS, and SAOS-2), with the normal human osteoblast hFOB1.19 as a control. RT-qPCR data revealed that ASB16-AS1 was overexpressed in all tested OS cell lines compared with that in hFOB1.19 (Figure 1B).
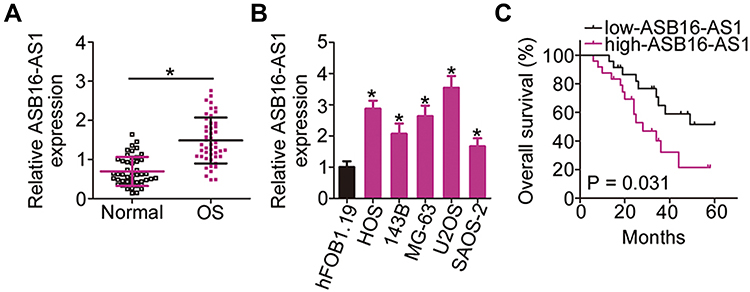 |
Figure 1 High expression of ASB16-AS1 in OS predicts poor prognosis. (A) RT-qPCR was conducted to examine ASB16-AS1 expression in 47 pairs of OS tissues and their corresponding adjacent normal tissues. *P < 0.05 vs adjacent normal tissues. (B) Expression of ASB16-AS1 in five human OS cell lines (HOS, 143B, MG-63, U2OS, and SAOS-2) and a normal human osteoblast hFOB1.19 was analyzed with RT-qPCR. *P < 0.05 vs hFOB1.19. (C) The association between ASB16-AS1 expression and overall survival of OS patients was evaluated using Kaplan–Meier analysis and Log rank test. P = 0.031. |
To estimate the clinical value of ASB16-AS1 in patients with OS, all participants were classified into either low-ASB16-AS1 (n = 23) or high-ASB16-AS1 (n =24) groups based on the median value of ASB16-AS1 expression in the OS tissues. Chi-square was used to evaluate the correlation between ASB16-AS1 expression and clinicopathological characteristics of patients with OS. As presented in Table 1, High ASB16-AS1 expression was closely associated with the tumor size (P = 0.036), TNM stage (P = 0.041), and distant metastasis (P = 0.015) (Table 1). Furthermore, patients with OS exposing high ASB16-AS1 tended to have a shorter overall survival than patients with OS expressing low ASB16-AS1 (Figure 1C, P = 0.031). Together, these data showed that ASB16-AS1 was overexpressed in OS and may be involved in its progression.
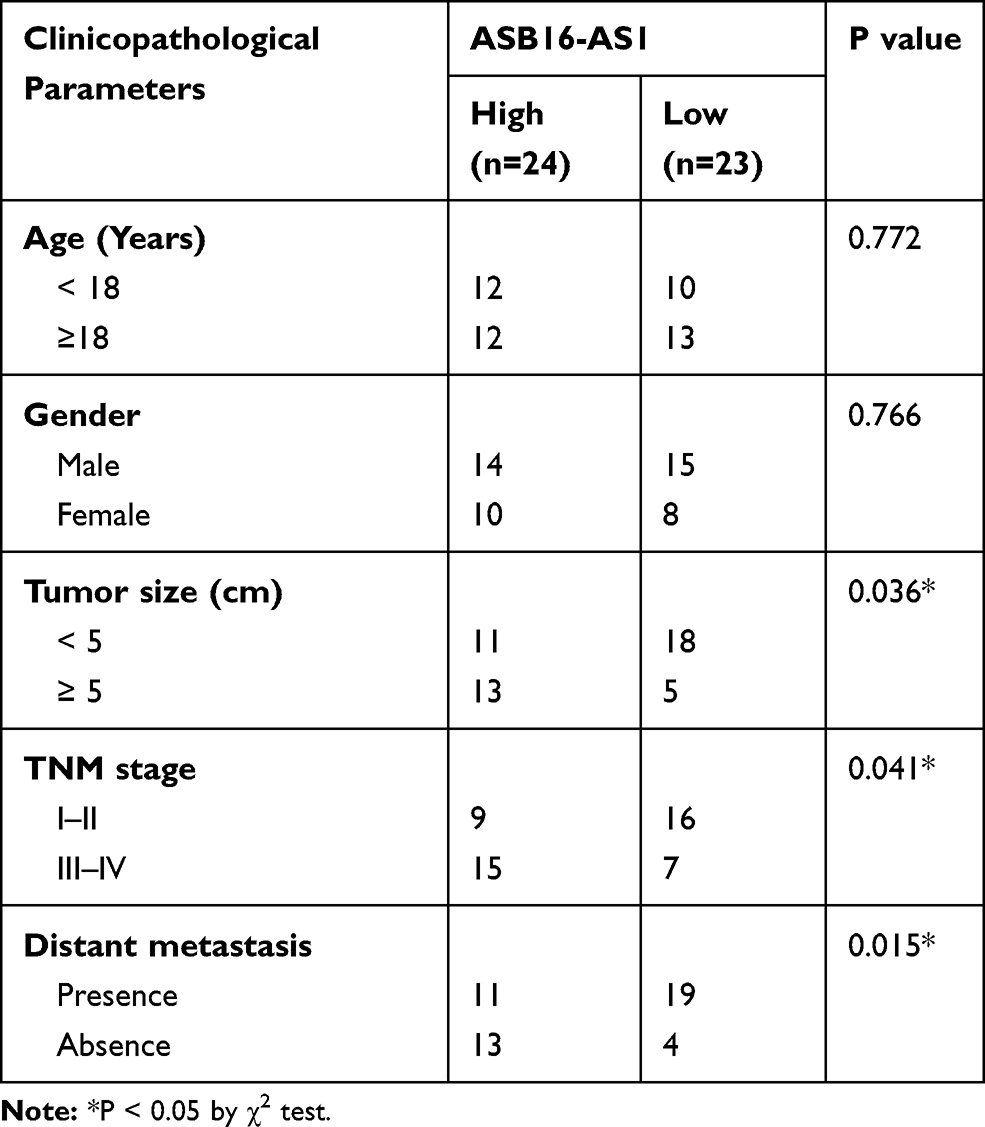 |
Table 1 The Correlation Between ASB16-AS1 Expression and Clinicopathological Parameters of the Patients with OS |
ASB16-AS1 Deficiency Inhibits OS Cell Proliferation, Migration, and Invasion and Induces Cell Apoptosis in vitro
The HOS and U2OS cell lines, which exhibited relatively higher ASB16-AS1 expression among the five OS cell lines, were selected for further cell-based experiments. To uncover the possible regulatory roles of ASB16-AS1 in the malignancy of OS cells, ASB16-AS1 expression was knocked down in HOS and U2OS cells through transfection with si-ASB16-AS1. RT-qPCR analysis verified successful ASB16-AS1 knockdown (Figure 2A). CCK-8 assay was used to determine the effects of ASB16-AS1 on cell proliferation in OS. Compared with that of the si-NC cells, the proliferative ability of HOS and U2OS cells with siRNA-induced ASB16-AS1 knockdown was decreased (Figure 2B). Flow cytometry analysis revealed that the proportion of apoptotic HOS and U2OS cells was elevated following AS16-AS1 knockdown (Figure 2C). In addition, ASB16-AS1 deficient-HOS and U2OS cells presented an obvious increase in the proportion of G0–G1 transition cells and decrease in the proportion of S phase cells (Figure 2D), indicating that silencing of ASB16-AS1 resulted in G0–G1 arrest in OS cells. Furthermore, cell migration and invasion assays showed that transfection with si-ASB16-AS1 resulted in a significant impairment of the migratory (Figure 2E) and invasive (Figure 2F) abilities of HOS and U2OS cells. Together, these results suggested that ASB16-AS1 functions as a cancer-promoting lncRNA in OS progression.
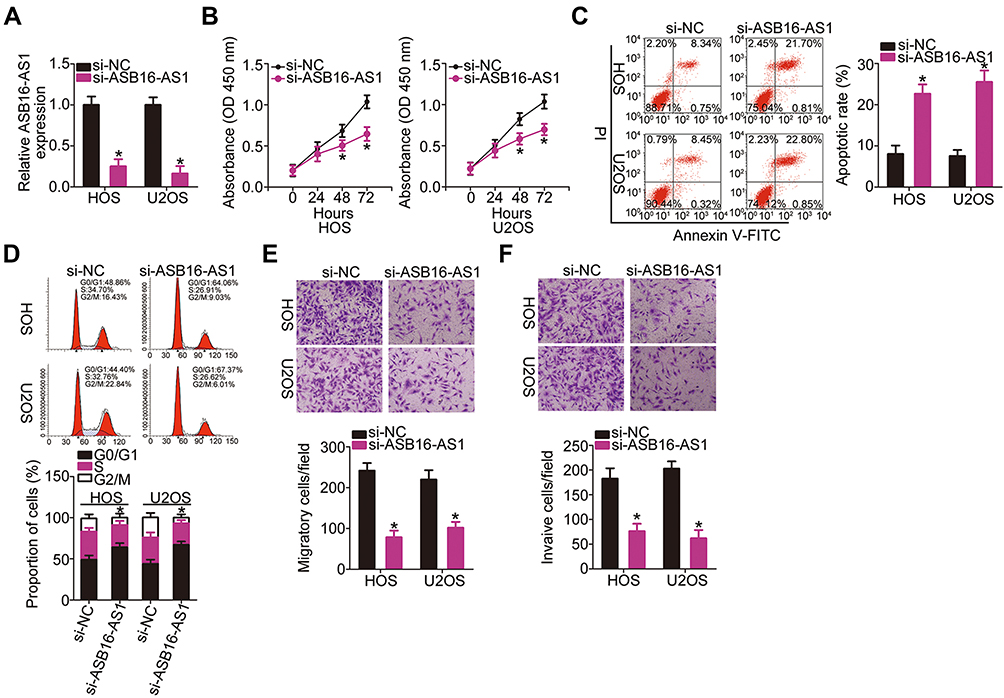 |
Figure 2 Interference of ASB16-AS1 expression inhibits HOS and U2OS cell proliferation, migration, and invasion and promotes cell apoptosis. (A) The knockdown efficiency for si-ASB16-AS1 in HOS and U2OS cells was determined via RT-qPCR analysis. *P < 0.05 vs si-NC. (B) The impact of ASB16-AS1 silencing on the proliferation of HOS and U2OS cells was examined via the CCK-8 assay. *P<0.05 vs si-NC. (C, D) The apoptosis rate and cell cycle status of HOS and U2OS cells transfected with si-ASB16-AS1 or si-NC was detected via flow cytometry. *P<0.05 vs si-NC. (E, F) The migratory and invasive abilities of HOS and U2OS cells with ASB16-AS1 knockdown were evaluated via cell migration and invasion assays. *P<0.05 vs si-NC. |
ASB16-AS1 Operates as an miRNA Sponge for miR-760 and Negatively Modulates Its Expression
To uncover the mechanisms through which the oncogenic activities of ASB16-AS1 are mediated in OS cells, we first employed subcellular fractionation and RT-qPCR to assess the localization of ASB16-AS1 expression in OS cells. ASB16-AS1 was mostly distributed in the cytoplasm of HOS and U2OS cells (Figure 3A). The results implied that ASB16-AS1 may function as a competing endogenous RNA (ceRNA) that regulates the expression of targets of miRNAs by competitively binding to miRNA. Next, through the online platform starBase 3.0, miR-760 was discovered to harbor two binding sites for ASB16-AS1 (Figure 3B).
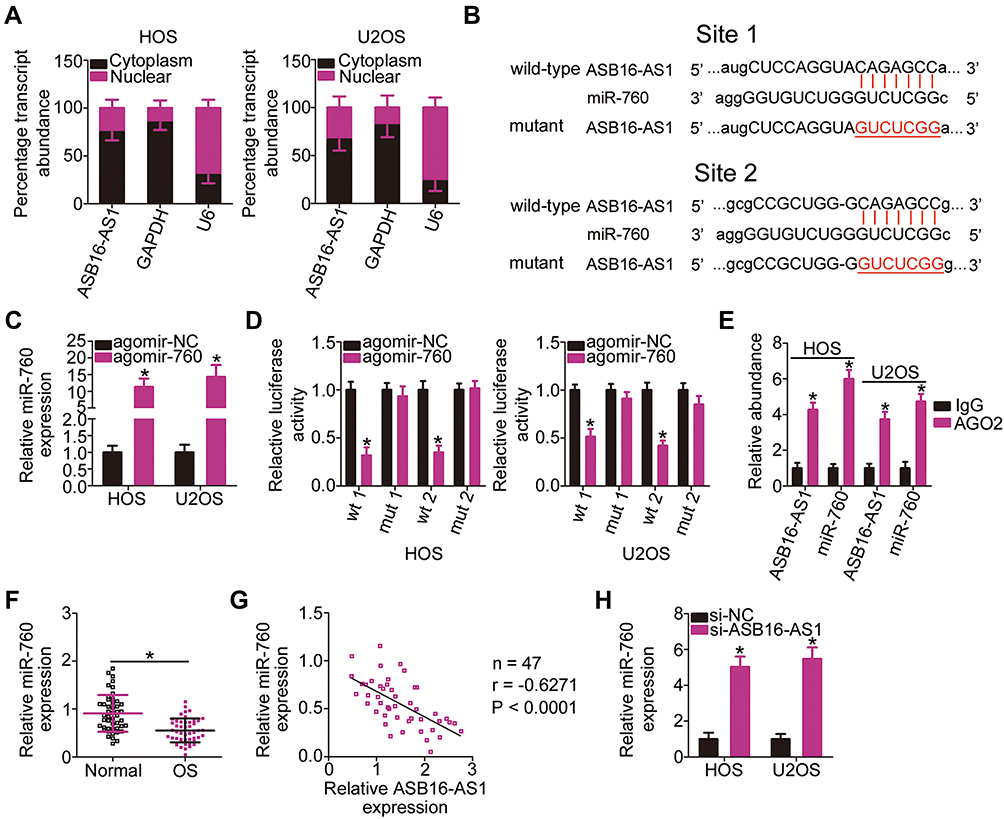 |
Figure 3 ASB16-AS1 operates as an miRNA sponge for miR-760 and negatively modulates its expression. (A) Subcellular fractionation followed by RT-qPCR analysis was used for assessing the localization of ASB16-AS1 expression in HOS and U2OS cells. (B) Schematic representation of the wild-type and mutant binding sites of miR-760 for ASB16-AS1. (C) The efficiency for agomir-760 transfection in HOS and U2OS cells was evaluated via RT-qPCR. *P < 0.05 vs agomir-NC. (D) Luciferase reporter assay indicated that ASB16-AS1-wt activity was impaired by miR-760 overexpression; however, the ASB16-AS1-mut activity was unaffected upon miR-760 upregulation. *P < 0.05 vs agomir-NC. (E) RIP assay displayed the enrichment of ASB16-AS1 and miR-760 in anti-AGO2 group. *P < 0.05 vs IgG. (F) RT-qPCR analysis was conducted to detect the expression of miR-760 in 47 pairs of OS tissues and their corresponding adjacent normal tissues. *P < 0.05 vs adjacent normal tissues. (G) The analysis of the expression correlation between miR-760 and ASB16-AS1 in OS tissues was performed with Spearman correlation analysis. r= −0.6271, P < 0.0001. (H) HOS and U2OS cells were transfected with si-ASB16-AS1 or si-NC. Forty-eight h after transfection, the cells were harvested for the evaluation of miR-760 expression using RT-qPCR. *P < 0.05 vs si-NC. |
After confirming the effects of agomir-760 on increasing endogenous miR-760 expression (Figure 3C), luciferase reporter assay was utilized to verify whether the binding site was functional. Reduction in the luciferase activity of ASB16-AS1-wt (both 1 and 2) induced by miR-760 overexpression was observed in HOS and U2OS cells; however, mutagenesis of the binding site (both 1 and 2) abrogated the inhibitory influence of miR-760 upregulation on the luciferase activity (Figure 3D). Additionally, distinct enrichment of ASB16-AS1 and miR-760 in anti-AGO2 group was validated using RIP analysis (Figure 3E), further demonstrating the direct interaction between ASB16-AS1 and miR-760 in OS cells. To further test the association between ASB16-AS1 and miR-760, RT-qPCR was employed to quantify miR-760 expression in 47 pairs of OS tissues and their corresponding adjacent normal tissues. miR-760 was weakly expressed in OS tissues (Figure 3F), showing an inverse relationship with ASB16-AS1 expression (Figure 3G; r = −0.6271, P < 0.0001). Furthermore, interference of ASB16-AS1 expression resulted in increased miR-760 accumulation in HOS and U2OS cells (Figure 3H). Therefore, ASB16-AS1 served as a ceRNA by sponging miR-760 in OS cells.
HDGF Is a Direct Target of miR-760 in OS Cells
After revealing the aberrant downregulation of miR-760 in OS, we explored whether miR-760 contributed to the oncogenicity of OS. CCK-8 and flow cytometry analyses revealed that transfection with agomir-760 resulted in a conspicuous decrease of HOS and U2OS cell proliferation (Figure 4A), promotion of cell apoptosis (Figure 4B) and induction of G0–G1 arrest (Figure 4C) compared with transfection with agomir-NC. In addition, the migratory and invasive abilities of HOS and U2OS cells were remarkable hindered following forced miR-760 overexpression, as evidenced by cell migration and invasion assays (Figure 4D).
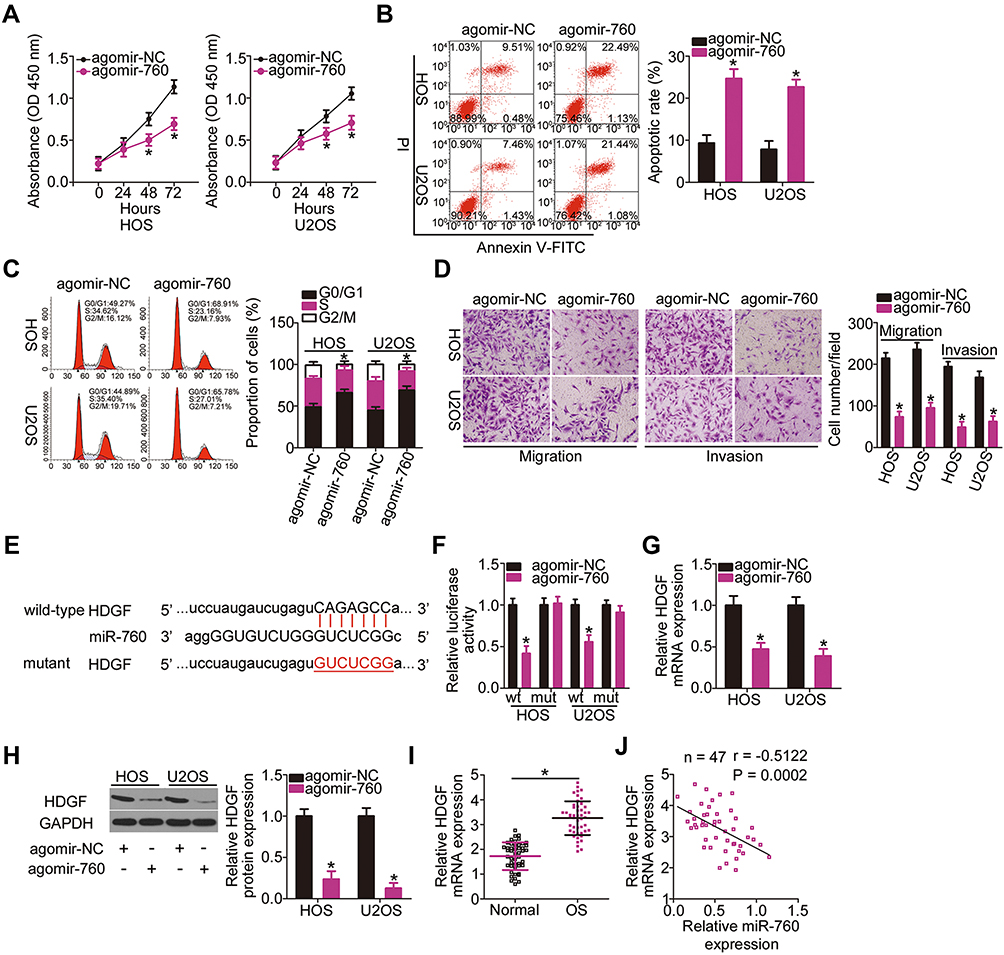 |
Figure 4 Validation of HDGF as a direct target of miR-760 in OS cells. (A–C) CCK-8 assay and flow cytometry analysis was utilized to respectively evaluate the influence of miR-760 upregulation on the proliferation, apoptosis and cell cycle status of HOS and U2OS cells. *P < 0.05 vs agomir-NC. (D) The migratory and invasive capacities of agomir-760 or agomir-NC-transfected HOS and U2OS cells were detected using cell migration and invasion assays. *P < 0.05 vs agomir-NC. (E) The wild-type miR-760-binding site in the 3′-UTR of HDGF mRNA. The mutant binding sequences were also presented. (F) The luciferase activity of HDGF-wt or HDGF-mut was measured after cotransfection with agomir-760 or agomir-NC in the HOS and U2OS cells. *P < 0.05 vs agomir-NC. (G, H) RT-qPCR and Western blotting respectively showed that agomir-760 transfection decreased HDGF mRNA and protein expression in HOS and U2OS cells. *P < 0.05 vs agomir-NC. (I) RT-PCR analysis showed the upregulation of HDGF mRNA expression in OS tissues relative to that in their corresponding adjacent normal tissues. *P < 0.05 vs corresponding adjacent normal tissues. (J) The expression correlation between HDGF mRNA and miR-760 in OS tissues was tested via Spearman correlation analysis. r = −0.5122, P = 0.0002. |
To elucidate the mechanism underlying miR-760 overexpression-induced suppression of the malignant phenotype of OS, bioinformatic predictions were performed to screen for the putative targets of miR-760. HDGF was predicted as a potential target of miR-760 (Figure 4E). Luciferase reporter assay was adopted to investigate whether miR-760 could bind to the 3′-UTR of HDGF. miR-760 overexpression inhibited the luciferase activity of the plasmid carrying a wild-type miR-760 binding site, while no obvious reduction of luciferase activity was observed for HDGF-mut (Figure 4F). Furthermore, the mRNA (Figure 4G) and protein (Figure 4H) levels of HDGF were conspicuously reduced in HOS and U2OS cells following agomir-760 introduction, as shown by RT-qPCR and Western blotting, respectively. Moreover, HDGF mRNA expression was higher in OS tissues than in the adjacent normal tissues (Figure 4I). Spearman correlation analysis revealed that miR-760 expression was negatively correlated to HDGF mRNA expression in OS tissues (Figure 4J; r = −0.5122, P = 0.0002). These observations collectively identified HDGF as a direct target of miR-760 in OS cells.
ASB16-AS1 Positively Affects HDGF Expression in OS Cells via Sponging of miR-760
After validating ASB16-AS1 as a molecular sponge of miR-760 and HDGF as a direct target of miR-760, we further assessed whether ASB16-AS can alter HDGF expression in OS cells. As expected, transfection with si-ASB16-AS1 dramatically decreased HDGF mRNA (Figure 5A) and protein (Figure 5B) expression in HOS and U2OS cells compared with si-NC-transfection. In addition, ASB16-AS1 expression was positively correlated to HDGF mRNA expression in OS tissues (Figure 5C; r = 0.5087, P = 0.0003). Subsequently, si-ASB16-AS1 plus antagomir-NC or antagomir-760 was transfected into HOS and U2OS cells, and HDGF expression was then determined. RT-qPCR analysis confirmed that antagomir-760 efficiently silenced miR-760 expression in HOS and U2OS cells (Figure 5D). ASB16-AS1 knockdown-induced downregulation of HDGF mRNA (Figure 5E) and protein (Figure 5F) expression was mostly reversed by antagomir-760 cotransfection. These observations imply that ASB16-AS1 functioned as a ceRNA for miR-760 and positively regulated HDGF expression.
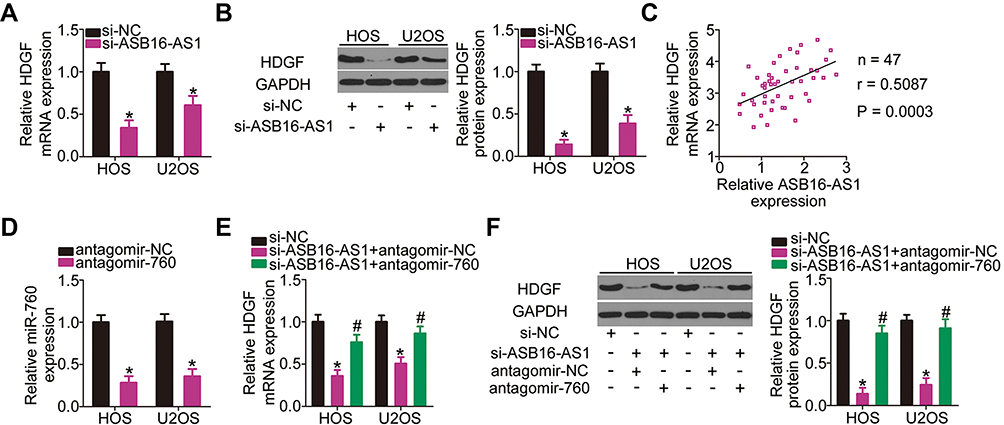 |
Figure 5 ASB16-AS1 positively regulates HDGF expression in OS cells via sponging miR-760. (A, B) si-ASB16-AS1 or si-NC was introduced into the HOS and U2OS cells. After transfection, the mRNA and protein levels of HDGF were detected through RT-qPCR and Western blotting, respectively. *P < 0.05 vs si-NC. (C) Spearman correlation analysis was adopted to assess the expression correlation between ASB16-AS1 and HDGF mRNA levels in the OS tissues. r = 0.5087, P = 0.0003. (D) The knockdown efficiency for antagomir-760 in HOS and U2OS cells was determined with RT-qPCR analysis. *P < 0.05 vs antagomir-NC. (E, F) HOS and U2OS cells were cotransfected with si-ASB16-AS1 and antagomir-760 or antagomir-NC. ASB16-AS1 silencing the reduced HDGF mRNA and protein expression, which was reversed by the antagomir-760. *P < 0.05 vs si-NC. #P < 0.05 vs si-ASB16-AS1+antagomir-NC. |
miR-760/HDGF Axis Responsible for the Cancer-Promoting Roles of ASB16-AS1 in OS Cells
Rescue experiments were performed to clarify whether the miR-760/HDGF axis mediates the promotive activities of ASB16-AS1 in OS progression. To this end, ASB16-AS1-deficient HOS and U2OS cells were further transfected with antagomir-NC or antagomir-760. Functional experiments indicated that ASB16-AS1 silencing attenuated HOS and U2OS cell proliferation (Figure 6A), promoted cell apoptosis (Figure 6B), induced cell G0–G1 arrest (Figure 6C), and impaired cell migration and invasion (Figure 6D). However, these were reversed by miR-760 inhibition.
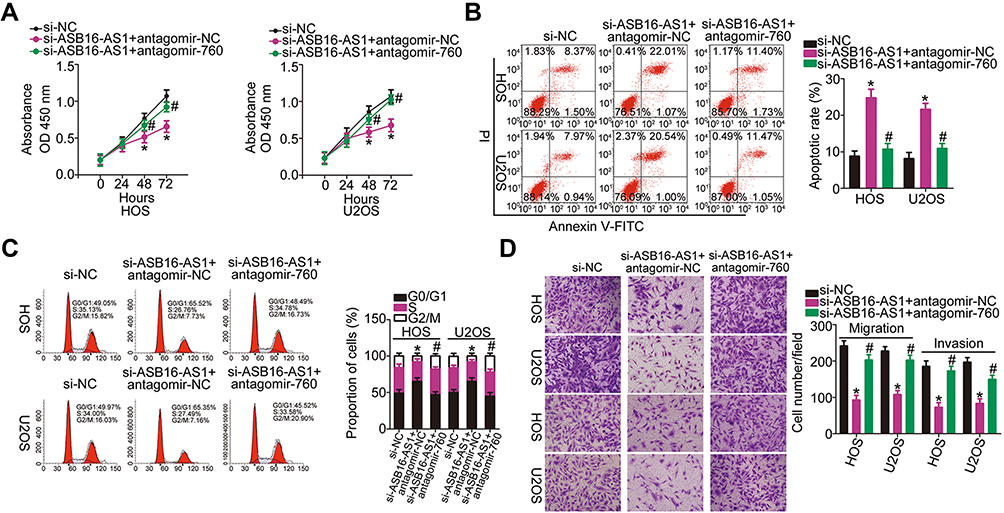 |
Figure 6 Inhibition of miR-760 rescues the actions of ASB16-AS1 silencing in OS cells (A–C) si-ASB16-AS1 plus antagomir-760 or antagomir-NC was introduced into the HOS and U2OS cells. HOS and U2OS cells transfected with si-ASB16-AS1 inhibited proliferation, promoted apoptosis and induced G0–G1 arrest, whereas the effects were reversed by miR-760 inhibition. *P<0.05 vs si-NC. #P < 0.05 vs si-ASB16-AS1+antagomir-NC. (D) The impaired migratory and invasive abilities of HOS and U2OS cells were partially abolished by antagomir-760 cotransfection. *P < 0.05 vs si-NC. #P < 0.05 vs si-ASB16-AS1+antagomir-NC. |
In addition to verifying that HDGF was successfully overexpressed by HDGF overexpression plasmid pc-HDGF (Figure 7A), rescue experiments were conducted in HOS and U2OS cells by transfecting with si-ASB16-AS1 in the presence of either pc-HDGF or empty pcDNA3.1 plasmid. Recovery of HDGF expression counteracted si-ASB16-AS1-induced influences on the proliferation (Figure 7B), apoptosis (Figure 7C), cell cycle status (Figure 7D), migration, and invasion (Figure 7E) of HOS and U2OS. Taken together, these results suggest that the oncogenic roles of ASB16-AS1 in OS cells depend on the regulation of the miR-760/HDGF axis.
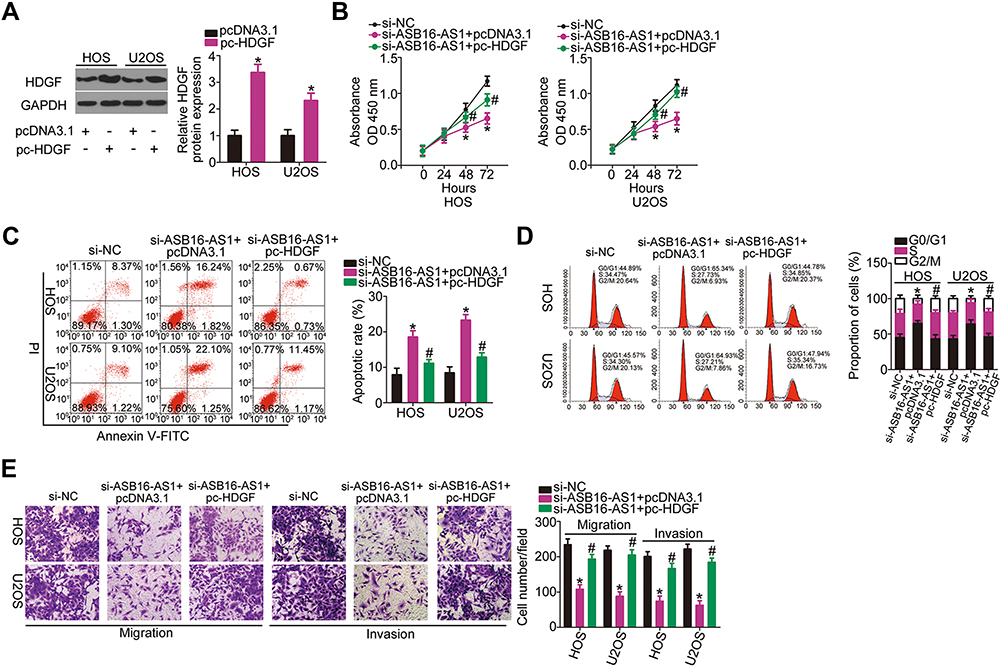 |
Figure 7 HDGF reintroduction abrogates the impacts of ASB16-AS1 knockdown in OS cells (A) The efficiency of pc-HDGF transfection in HOS and U2OS cells was evaluated using RT-qPCR. *P < 0.05 vs pcDNA3.1. (B–E) The ASB16-AS1-deficient HOS and U2OS cells were further transfected with pc-HDGF or pcDNA3.1. The decreased proliferation, promotion of apoptosis, and hindered migration and invasion caused by ASB16-AS1 knockdown in HOS and U2OS cells was abrogated by HDGF upregulation. *P < 0.05 vs si-NC. #P < 0.05 vs si-ASB16-AS1+ pcDNA3.1. |
ASB16-AS1 Silencing Suppresses Tumor Growth of OS in vivo
The ability of ASB16-AS1 knockdown to hinder OS growth in vivo was assessed in a xenograft mouse model. U2OS cells stably transfected with sh-ASB16-AS1 or sh-NC were subcutaneously injected into BALB/c nude mice. The volume of tumor xenografts formed by ASB16-AS1-silenced U2OS cells lower than that of xenografts formed by sh-NC cells (Figure 8A and B). After 4 weeks, all tumor xenografts were collected and weighted. HE staining was performed to demonstrate that the tumor xenografts were derived from U2OS cells (Figure 8C). The average weight of the tumor xenografts was lower in the sh-ASB16-AS1 group than in the sh-NC group (Figure 8D). Furthermore, the tumor xenografts harvested from the sh-ASB16-AS1 group exhibited significantly lower sh-ASB16-AS1 expression (Figure 8E), higher miR-760 expression (Figure 8F), and lower HDGF protein expression (Figure 8G) than tumor xenografts in the sh-NC group. Together, our data suggest that ASB16-AS1 downregulation inhibits tumor growth of OS in vivo through controlling the miR-760/HDGF axis.
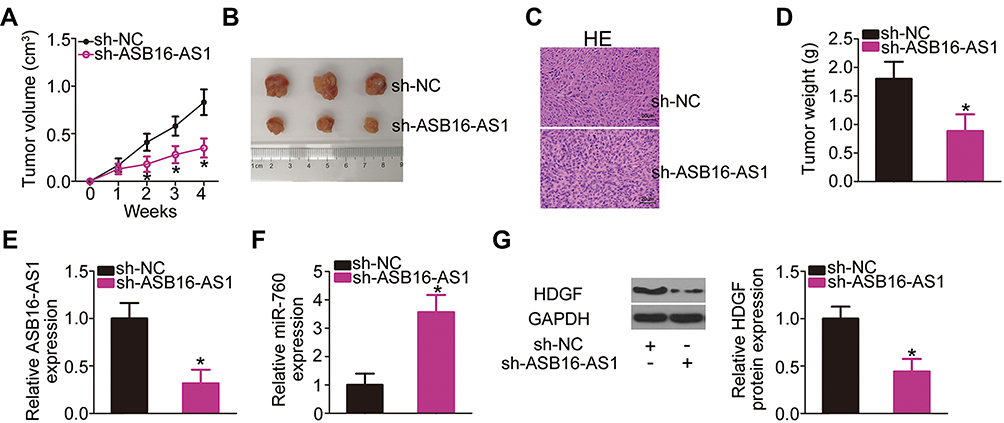 |
Figure 8 ASB16-AS1 inhibition restricts tumor growth of OS cells in vivo. (A) The growth curve of the tumor xenografts after inoculation of either the sh-ASB16-AS1-transfected or sh-NC-transfected U2OS cells into nude mice. *P < 0.05 vs sh-NC. (B) Representative photographs of the tumor xenografts derived from groups “sh-ASB16-AS1” and “sh- NC.” (C) Tumor xenografts detected by HE staining (magnification: x400). (D) The weight of the tumor xenografts obtained from groups “sh-ASB16-AS1” and “sh- NC.” *P < 0.05 vs sh-NC. (E, F) The expression of ASB16-AS1 and miR-760 in tumor xenograft derived from sh-ASB16-AS1-transfected or sh-NC-transfected U2OS cells was detected via RT-qPCR analysis. *P < 0.05 vs sh-NC. (G) The tumor xenografts were evaluated under Western blotting to detect the HDGF protein expression. *P < 0.05 vs sh-NC. |
Discussion
A great deal of attention is being recently paid to the expression profiles and roles of lncRNAs in carcinogenesis and cancer progression.28–30 An increasing number of studies suggest that the alteration of lncRNA expression is closely linked to the onset and progression of OS.31–33 Therefore, an investigation of specific molecules that are dysregulated in OS may reveal potential therapeutic targets. Despite the tremendous progress in the research on lncRNA, its association with OS remained to be investigated. In the present study, the expression pattern of ASB16-AS1 in OS tissues and cell lines was analyzed. In addition, the clinical value of ASB16-AS1 in OS patients was examined. The effects of ASB16-AS1 on malignant phenotypes of OS cells in vitro and in vivo as well as the mechanism of action were also explored.
A previous study reported the expression level and vital roles of ASB16-AS1 in glioma26 and hepatocellular carcinoma.27 ASB16-AS1 was elevated in glioma and was significantly associated with tumor staging and grading.26 ASB16-AS1 was also upregulated in hepatocellular carcinoma, and closely related with low survival rate. In addition, upregulation of ASB16-AS1 predicted low disease-free survival rate for patients with hepatocellular carcinoma.27 Functionally, ASB16-AS1 exerted pro-oncogenic roles in glioma26 and hepatocellular carcinoma.27 Nevertheless, its expression and functions in OS have not been thoroughly investigated. Data from the current study revealed that ASB16-AS1 expression was increased in OS tissues and cell lines. An increased ASB16-AS1 expression exhibited significantly relation with OS patients’ tumor size, TNM stage, and distant metastasis. Patients with OS expressing high ASB16-AS1 tended to show a shorter overall survival than those with expressing low ASB16-AS1. In terms of function, interference of ASB16-AS1 expression decreased OS cell proliferation, migration, and invasion in vitro. Furthermore, ASB16-AS1 silencing facilitated OS cell apoptosis and impaired tumor growth in vivo. To the best of our knowledge, the present study is the first endeavor to investigate the significant regulatory roles of ASB16-AS1 in OS.
Having validated the pro-oncogenic activities of ASB16-AS1, we subsequently elucidated the molecular mechanism through which ASB16-AS1 affects OS cells. Mechanically, cytoplasmic lncRNAs have miRNA responsive elements that work as miRNA sponges to negatively regulate the miRNAs available to interact with their target mRNAs, thereby decreasing the suppression of these mRNAs.34 In this study, subcellular fractionation followed by RT-qPCR analysis demonstrated ASB16-AS1 localization in the cytoplasm of OS cells. Following bioinformatic analysis, ASB16-AS1 was predicted to sponge miR-760. The interaction between ASB16-AS1 and miR-760 in OS cells was then verified by luciferase reporter and RIP assays. Additionally, miR-760 expression was decreased in OS and was inversely correlated with ASB16-AS1 expression. Furthermore, miR-760 expression was increased by ASB16-AS1 silencing in OS cells. Moreover, HDGF was identified as a direct target gene of miR-760 in OS cells, and its expression could be positively modulated by ASB16-AS1 via sponging miR-760. Given these results, we propose that ASB16-AS1 acts as a ceRNA for miR-760 and thereby positively controlling HDGF expression in OS.
Some previous studies reported that miR-760 was weakly expressed in breast cancer,35 lung cancer,36 colorectal cancer,37 and hepatocellular carcinoma38 but was highly expressed in ovarian cancer.39 However, the expression and effects of miR-760 on the oncogenicity in OS have been rarely explored. Our results showed that miR-760 was underexpressed in OS and exerted an inhibitory role on the malignant characteristics of OS cells. Mechanically, HDGF was validated as a direct target gene of miR-760 in OS cells. HDGF, first purified from a culture medium conditioned with the hepatoma cell line HuH7, has been verified as a heparin-binding growth factor.40 HDGF is upregulated in OS, and its high expression is closely related with tumor size.41 This gene plays cancer-promoting roles in OS progression and is involved in the modulation of multiple aggressive behaviors both in vitro and in vivo.41,42 However, the molecular events that lead to the decrease of miR-760 and increase of HDGF have not been investigated in OS. Our results also showed that ASB16-AS1 harbors miR-760 to indirectly regulate HDGF expression in OS cells. Consequently, a novel regulatory network involving ASB16-AS1, miR-760, and HDGF was identified to play an important role in the pathogenesis of OS.
Increasing number of studies uncovered that a small group of cells with stem-like characteristics called cancer stem-like cells are implicated in the OS initiation and progression because of their stronger stemness.43–45 In addition, lncRNA and miRNA is reported to be involved in the regulation of stemness of OS cells. For instance, Liang et al found that the activation of DNA methyltransferase 1 promoted the methylation of miR-34a and thereby decreased miR-34a expression, resulting in the sustaining the stemness of OS cells.46 LncRNA THOR overexpression increased the stemness of OS cells through enhancing SRY (sex determining region Y)-box 9 mRNA stability and raising its expression.47 However, in this study, we did not test the impacts of ASB16-AS1/miR-760/HDGF pathway on the cancer stem cells of OS cells. We will resolve this limitation in the near future.
Conclusion
The results of this study suggest the contribution of ASB16-AS1 to the progression of OS via the miR-760/HDGF pathway. ASB16-AS1 seemed to function as a ceRNA to reduce the endogenous negative regulatory effect of miR-760 on its target HDGF. These findings highlight the expression and roles of ASB16-AS1 in OS as well as underscore a novel molecular mechanism through which ASB16-AS1 exerts its oncogenic effects. Therefore, targeting the ASB16-AS1/miR-760/HDGF pathway may be an effective therapeutic target in OS.
Data Sharing Statement
The datasets used and/or analyzed during the present study are available from the corresponding author on reasonable request.
Ethics Approval and Informed Consent
The present study was approved by the ethics committee of China-Japan Union Hospital Jilin University and was performed in accordance with the Declaration of Helsinki. A written informed consent was provided by all participants prior to their enrollment in the study. All animal studies were approved by the Committee on the Ethics of Animal Experiments of China-Japan Union Hospital Jilin University, and were performed in compliance with the Animal Protection Law of the People’s Republic of China-2009 for experimental animals. We mentioned this information in the manuscript.
Funding
This study was supported by a special fund for Key Laboratories by Jilin Provincial Science and Technology Agency (#20190201282JC).
Disclosure
The authors declare that they have no competing interests in this work.
References
1. Isakoff MS, Bielack SS, Meltzer P, Gorlick R. Osteosarcoma: current treatment and a collaborative pathway to success. J Clin Oncol. 2015;33(27):3029–3035. doi:10.1200/JCO.2014.59.4895
2. He J-P, Hao Y, Wang X-L, et al. Review of the molecular pathogenesis of osteosarcoma. Asian Pac J Cancer Prev. 2014;15(15):5967–5976. doi:10.7314/APJCP.2014.15.15.5967
3. Lin Y-H, Jewell BE, Gingold J, et al. Osteosarcoma: molecular pathogenesis and iPSC modeling. Trends Mol Med. 2017;23(8):737–755. doi:10.1016/j.molmed.2017.06.004
4. Kager L, Zoubek A, Potschger U, et al. Primary metastatic osteosarcoma: presentation and outcome of patients treated on neoadjuvant cooperative osteosarcoma study group protocols. J Clin Oncol. 2003;21(10):2011–2018. doi:10.1200/JCO.2003.08.132
5. Anderson ME. Update on survival in osteosarcoma. Orthop Clin North Am. 2016;47(1):283–292. doi:10.1016/j.ocl.2015.08.022
6. Durfee RA, Mohammed M, Luu HH. Review of osteosarcoma and current management. Rheumatol Ther. 2016;3(2):221–243. doi:10.1007/s40744-016-0046-y
7. Yang Y, Han L, He Z, et al. Advances in limb salvage treatment of osteosarcoma. J Bone Oncol. 2018;10:36–40. doi:10.1016/j.jbo.2017.11.005
8. Kushlinskii NE, Fridman MV, Braga EA. Molecular mechanisms and microRNAs in osteosarcoma pathogenesis. Biochem Biokhimiia. 2016;81(4):315–328. doi:10.1134/S0006297916040027
9. Denduluri SK, Wang Z, Yan Z, et al. Molecular pathogenesis and therapeutic strategies of human osteosarcoma. J Biomed Res. 2015;30.
10. Mattick JS, Makunin IV. Non-coding RNA. Hum Mol Genet. 2006;15 Spec No 1:R17–29. doi:10.1093/hmg/ddl046
11. Smolle MA, Pichler M. The role of long non-coding RNAs in Osteosarcoma. Non-Coding RNA. 2018;4:1. doi:10.3390/ncrna4010007
12. Sparber P, Filatova A, Khantemirova M, Skoblov M. The role of long non-coding RNAs in the pathogenesis of hereditary diseases. BMC Med Genomics. 2019;12(Suppl 2):42. doi:10.1186/s12920-019-0487-6
13. Cui YS, Song YP, Fang BJ. The role of long non-coding RNAs in multiple myeloma. Eur J Haematol. 2019;103(1):3–9. doi:10.1111/ejh.13237
14. Zhang L, Meng X, Zhu XW, et al. Long non-coding RNAs in oral squamous cell carcinoma: biologic function, mechanisms and clinical implications. Mol Cancer. 2019;18(1):102. doi:10.1186/s12943-019-1021-3
15. Flippot R, Beinse G, Boileve A, Vibert J, Malouf GG. Long non-coding RNAs in genitourinary malignancies: a whole new world. Nat Rev Urol. 2019;16(8):484–504. doi:10.1038/s41585-019-0195-1
16. Wu Y, Shao A, Wang L, et al. The Role of lncRNAs in the distant metastasis of breast cancer. Front Oncol. 2019;9:407. doi:10.3389/fonc.2019.00407
17. Shi D, Wu F, Mu S, et al. LncRNA AFAP1-AS1 promotes tumorigenesis and epithelial-mesenchymal transition of osteosarcoma through RhoC/ROCK1/p38MAPK/Twist1 signaling pathway. J Exp Clin Cancer Res. 2019;38(1):375. doi:10.1186/s13046-019-1363-0
18. Guo W, Jiang H, Li H, et al. LncRNA-SRA1 suppresses osteosarcoma cell proliferation while promoting cell apoptosis. Technol Cancer Res Treat. 2019;18:1533033819841438. doi:10.1177/1533033819841438
19. Li G, Zhu Y. Effect of lncRNA ANRIL knockdown on proliferation and cisplatin chemoresistance of osteosarcoma cells in vitro. Pathol Res Pract. 2019;215(5):931–938. doi:10.1016/j.prp.2019.01.042
20. Pan R, He Z, Ruan W, et al. lncRNA FBXL19-AS1 regulates osteosarcoma cell proliferation, migration and invasion by sponging miR-346. Onco Targets Ther. 2018;11:8409–8420. doi:10.2147/OTT.S160963
21. Sui Y, Han Y, Zhao X, Li D, Li G. Long non-coding RNA GClnc1 promotes tumorigenesis in osteosarcoma by inhibiting p53 signaling. Biochem Biophys Res Commun. 2018;507(1–4):36–42. doi:10.1016/j.bbrc.2018.10.135
22. Zhang RM, Tang T, Yu HM, Yao XD. LncRNA DLX6-AS1/miR-129-5p/DLK1 axis aggravates stemness of osteosarcoma through Wnt signaling. Biochem Biophys Res Commun. 2018;507(1–4):260–266. doi:10.1016/j.bbrc.2018.11.019
23. Cong M, Jing R. Long non-coding RNA TUSC7 suppresses osteosarcoma by targeting miR-211. Biosci Rep. 2019;39. doi:10.1042/BSR20190291
24. Ding W, Wu D, Ji F, Zhang H. Inhibition of long non-coding RNA-AWPPH decreases osteosarcoma cell proliferation, migration and invasion. Oncol Lett. 2019;18(5):5055–5062. doi:10.3892/ol.2019.10898
25. Chen S, Xu X, Lu S, Hu B. Long non-coding RNA HAND2-AS1 targets glucose metabolism and inhibits cancer cell proliferation in osteosarcoma. Oncol Lett. 2019;18(2):1323–1329. doi:10.3892/ol.2019.10445
26. Ji L, Fan X, Zhou F, Gu J, Deng X. lncRNA RPL34-AS1 inhibits cell proliferation and invasion while promoting apoptosis by competitively binding miR-3663-3p/RGS4 in papillary thyroid cancer. J Cell Physiol. 2019;235(4):3669–678.
27. Yao X, You G, Zhou C, Zhang D. LncRNA ASB16-AS1 promotes growth and invasion of hepatocellular carcinoma through regulating miR-1827/FZD4 axis and activating Wnt/beta-catenin pathway. Cancer Manag Res. 2019;11:9371–9378. doi:10.2147/CMAR.S220434
28. Yao F, Wang Q, Wu Q. The prognostic value and mechanisms of lncRNA UCA1 in human cancer. Cancer Manag Res. 2019;11:7685–7696. doi:10.2147/CMAR.S200436
29. Huang J, Chen J, Liu L, Cai X, Yao Z. Progress in the study of long noncoding RNA in tongue squamous cell carcinoma. Oral Surg Oral Med Oral Pathol Oral Radiol. 2019.
30. Fattahi S, Kosari-monfared M, Golpour M, et al. LncRNAs as potential diagnostic and prognostic biomarkers in gastric cancer: a novel approach to personalized medicine. J Cell Physiol. 2019;235(4):3189–3206.
31. Chen J, Wu Z, Zhang Y. LncRNA SNHG3 promotes cell growth by sponging miR-196a-5p and indicates the poor survival in osteosarcoma. Int J Immunopathol Pharmacol. 2019;33:2058738418820743. doi:10.1177/2058738418820743
32. Su P, Mu S, Wang Z. Long noncoding RNA SNHG16 promotes osteosarcoma cells migration and invasion via sponging miRNA-340. DNA Cell Biol. 2019;38(2):170–175. doi:10.1089/dna.2018.4424
33. Liang R, Liu Z, Chen Z, et al. Long noncoding RNA DNAJC3-AS1 promotes osteosarcoma progression via its sense-cognate gene DNAJC3. Cancer Med. 2019;8(2):761–772. doi:10.1002/cam4.2019.8.issue-2
34. Abdollahzadeh R, Daraei A, Mansoori Y, Sepahvand M, Amoli MM, Tavakkoly-bazzaz J. Competing endogenous RNA (ceRNA) cross talk and language in ceRNA regulatory networks: a new look at hallmarks of breast cancer. J Cell Physiol. 2019;234(7):10080–10100. doi:10.1002/jcp.27941
35. Hu S-H, Wang C-H, Huang Z-J, et al. miR-760 mediates chemoresistance through inhibition of epithelial mesenchymal transition in breast cancer cells. Eur Rev Med Pharmacol Sci. 2016;20(23):5002–5008.
36. Yan C, Zhang W, Shi X, Zheng J, Jin X, Huo J. MiR-760 suppresses non-small cell lung cancer proliferation and metastasis by targeting ROS1. Environ Sci Pollut Res Int. 2018;25(19):18385–18391. doi:10.1007/s11356-017-1138-0
37. Cao L, Liu Y, Wang D, et al. MiR-760 suppresses human colorectal cancer growth by targeting BATF3/AP-1/cyclinD1 signaling. J Exp Clin Cancer Res. 2018;37(1):83. doi:10.1186/s13046-018-0757-8
38. Sun D, Lu J, Hu C, et al. Prognostic role of miR-760 in hepatocellular carcinoma. Oncol Lett. 2018;16(6):7239–7244. doi:10.3892/ol.2018.9546
39. Liao Y, Deng Y, Liu J, et al. MiR-760 overexpression promotes proliferation in ovarian cancer by downregulation of PHLPP2 expression. Gynecol Oncol. 2016;143(3):655–663. doi:10.1016/j.ygyno.2016.09.010
40. Huang J-S, Chao C-C, Su T-L, et al. Diverse cellular transformation capability of overexpressed genes in human hepatocellular carcinoma. Biochem Biophys Res Commun. 2004;315(4):950–958. doi:10.1016/j.bbrc.2004.01.151
41. Chen Z, Qiu S, Lu X. The expression and clinical significance of HDGF in osteosarcoma. Onco Targets Ther. 2015;8:2509–2517. doi:10.2147/OTT.S91708
42. Liu X, Ma W, Ma J, Xiao L, Hao D. Upregulation of miR95-3p inhibits growth of osteosarcoma by targeting HDGF. Pathol Res Pract. 2019;215(8):152492. doi:10.1016/j.prp.2019.152492
43. Abarrategi A, Tornin J, Martinez-cruzado L, et al. Osteosarcoma: cells-of-origin, cancer stem cells, and targeted therapies. Stem Cells Int. 2016;2016:3631764. doi:10.1155/2016/3631764
44. La Noce M, Paino F, Mele L, et al. HDAC2 depletion promotes osteosarcoma’s stemness both in vitro and in vivo: a study on a putative new target for CSCs directed therapy. J Exp Clin Cancer Res. 2018;37(1):296. doi:10.1186/s13046-018-0978-x
45. Paino F, La Noce M, Di Nucci D, et al. Human adipose stem cell differentiation is highly affected by cancer cells both in vitro and in vivo: implication for autologous fat grafting. Cell Death Dis. 2017;8(1):e2568. doi:10.1038/cddis.2016.308
46. Liang X, Xu C, Wang W, Li X. The DNMT1/miR-34a axis is involved in the stemness of human osteosarcoma cells and derived stem-like cells. Stem Cells Int. 2019;2019:7028901. doi:10.1155/2019/7028901
47. Wu H, He Y, Chen H, et al. LncRNA THOR increases osteosarcoma cell stemness and migration by enhancing SOX9 mRNA stability. FEBS Open Bio. 2019;9(4):781–790. doi:10.1002/feb4.2019.9.issue-4
 © 2020 The Author(s). This work is published and licensed by Dove Medical Press Limited. The
full terms of this license are available at https://www.dovepress.com/terms
and incorporate the Creative Commons Attribution
- Non Commercial (unported, 3.0) License.
By accessing the work you hereby accept the Terms. Non-commercial uses of the work are permitted
without any further permission from Dove Medical Press Limited, provided the work is properly
attributed. For permission for commercial use of this work, please see paragraphs 4.2 and 5 of our Terms.
© 2020 The Author(s). This work is published and licensed by Dove Medical Press Limited. The
full terms of this license are available at https://www.dovepress.com/terms
and incorporate the Creative Commons Attribution
- Non Commercial (unported, 3.0) License.
By accessing the work you hereby accept the Terms. Non-commercial uses of the work are permitted
without any further permission from Dove Medical Press Limited, provided the work is properly
attributed. For permission for commercial use of this work, please see paragraphs 4.2 and 5 of our Terms.