")
Back to Journals » Psychology Research and Behavior Management » Volume 16
Loneliness Trajectories, Associated Factors and Subsequent Health in Children and Young People During the COVID-19 Pandemic: A National Matched Cohort Study
Authors Schneider V , Norris T, Nugawela M, Dalrymple E , Hargreaves D , Käll A , McOwat K , Shafran R , Stephenson T, Xu L, Pinto Pereira SM
Received 15 May 2023
Accepted for publication 29 September 2023
Published 1 November 2023 Volume 2023:16 Pages 4461—4477
DOI https://doi.org/10.2147/PRBM.S421165
Checked for plagiarism Yes
Review by Single anonymous peer review
Peer reviewer comments 3
Editor who approved publication: Dr Igor Elman
Verena Schneider,1 Tom Norris,2 Manjula Nugawela,3 Emma Dalrymple,3 Dougal Hargreaves,4 Anton Käll,5,6 Kelsey McOwat,7 Roz Shafran,3 Terence Stephenson,3 Laila Xu,3 Snehal M Pinto Pereira2 On behalf of CLoCk Consortium members
1Department of Epidemiology & Public Health, University College London, London, UK; 2Department of Targeted Intervention, University College London, London, UK; 3UCL Great Ormond Street Institute of Child Health, University College London, London, UK; 4Mohn Centre for Children’s Health & Wellbeing, School of Public Health, Imperial College London, London, UK; 5Department of Behavioural Sciences and Learning, Linköping University, Linköping, Sweden; 6Department of Biomedical and Clinical Sciences, Linköping University, Linköping, Sweden; 7Immunisation Department, UK Health Security Agency, London, UK
Correspondence: Verena Schneider, Department of Epidemiology and Public Health, University College London, 1– 19, Torrington Place, London, WC1E 7HB, UK, Tel +44 7985 682045, Email [email protected]
Purpose: Loneliness is common amongst children and young people (CYP) and is an independent risk factor for poor health. This study aimed to i) determine whether subgroups of CYP with different loneliness trajectories (during the second year of the pandemic) exist; ii) examine associations with socio-demographic characteristics and subsequent health; and iii) understand whether associations between loneliness and subsequent health were modified by SARS-CoV-2 infection.
Methods: A total of 5851 CYP (N=3260 SARS-CoV-2 positive and 2591 SARS-CoV-2 negative) provided data on loneliness (via the validated 3-item version of the UCLA Loneliness Scale for Children) at least twice in a 12-month period post PCR index-testing (conducted October 2020-March 2021). Latent class growth analyses were used to identify distinct classes of loneliness trajectories. Multinomial logistic regression was used to identify socio-demographic characteristics associated with class membership. Logistic regression models assessed the odds of reporting impairing symptoms 12-months post index-test.
Results: Four distinct loneliness trajectories were identified: three mostly stable (low, medium, high) and one low-increasing trajectory. Being older, female, living in more deprived areas and testing negative were associated with greater odds of being in the highest vs lowest loneliness trajectory; eg OR for female vs male: 5.6 (95% CI:4.1,7.8); OR for 15– 17 vs 11– 14 years: 4.5 (95% CI:3.4,6.0). Following higher loneliness trajectories was associated with higher odds of experiencing impairing symptoms 12-months post index-test: ORadjusted (compared to lowest loneliness trajectory) were 15.9 (95% CI:11.9,21.3) (high loneliness), 6.5 (5.3,7.9) (medium loneliness) and 2.3 (1.9,2.8) (low-increasing loneliness). There was no evidence that this association was modified by PCR index-test result.
Conclusion: About 5.3% of CYP were classified into a group experiencing (chronically) high loneliness. Being female, older and from more deprived areas were risk factors of belonging to this group. Results suggest that even small increases from low loneliness levels may be associated with worse health outcomes.
Plain Language Summary: Why was the study done?
Multiple lockdowns and school closures during the COVID-19 pandemic may have led to a rise in loneliness in children and young people (CYP). Loneliness can harm health and loneliness research often examines adult populations. We wanted to know if feelings of loneliness in CYP changed during the pandemic and which factors were associated with different loneliness patterns. Furthermore, we wanted to know how different patterns of loneliness linked to later health.
What did the researchers do and find?
We used data on almost 6000 CYP from the CLoCk study who completed multiple surveys during the pandemic. CYP were asked about feelings of loneliness using questions like: “how often do you feel you have no one to talk to”. We also asked about their health.
We identified four patterns of loneliness in CYP between April 2021 and April 2022: 1) stable low loneliness levels, 2) initial low loneliness levels which increased over time, 3) stable medium loneliness levels, and 4) stable high loneliness levels. 5.3% of CYP had stable high loneliness levels and they were also more likely to be older, female, living in more deprived areas and testing negative for COVID-19. Compared to those following the lowest loneliness pattern, those with higher levels of loneliness were at greater risk of impaired health.
What do these result mean?
We identify CYP who may experience high levels of loneliness and highlight that even small increases in loneliness may be associated with worse health outcomes.
Keywords: Adolescence, Loneliness, Pandemic, Mental Health, Physical Health, Longitudinal Studies
Introduction
The COVID-19 pandemic prompted several measures to limit face-to-face social contacts, including lockdowns, school closures and restrictions to leisure time activities. These measures have led to concerns regarding rising loneliness in the UK and worldwide.1–3 Loneliness is defined as a “subjective, unwelcome feeling of lack or loss of companionship” which occurs when there is a mismatch between the perceived and desired quantity and quality of social relationships.4 Loneliness is distinct from social isolation in that it is based on the subjective experience of feeling isolated from others, rather than the objective characteristics of the social situation only.5 Moreover, loneliness is an independent risk factor for poor mental and physical health.6 It thus represents an important public health matter.7
Young people have been identified as being at high risk of experiencing severe and/or frequent (eg often/very often/always) loneliness both pre- and during the COVID-19 pandemic.3,6,8–10 For children, pre-pandemic factors associated with higher likelihood of experiencing frequent loneliness (eg “always or very often”/“often”) were female gender, receiving free school meals, low family affluency, living in a city, and reporting low satisfaction with their health and/or their relationships with family and friends.11,12 Loneliness in children and young people (CYP) is concerning due to its links with adverse long-term health outcomes.13,14 For example, following a trajectory of high peer-related loneliness levels in mid-childhood (vs low, stable loneliness) was associated with long-term adverse health including more depressive symptoms, poorer sleep and lower self-rated health.13 Systematic reviews have linked social isolation and loneliness in CYP to (long-term) anxiety and depression, higher cortisol levels and worse cognitive development.15,16
During the COVID-19 pandemic, CYP have been particularly vulnerable to experience loneliness. This is because, at a critical period of their life-course, CYP endured strict lockdown measures, which restricted their social contacts, education, and development. Therefore, understanding the broader implications of lockdowns on CYP is warranted. For example, it has been shown that school closures and lockdowns during the pandemic had adverse impacts on CYP’s physical and mental health, including increases in loneliness.17–24 However, uncertainties remain regarding loneliness of CYP during the pandemic and its implications because the existing evidence is sparse, is based on studies conducted in different countries and contexts, with different loneliness measures and often cross-sectional data. For example, repeated cross-sectional surveys of 13-to-19-year olds across Britain between summer 2020 and summer 2021 reported little change in the prevalence of CYP reporting feeling (sometimes/often) alone, left out or having no one to talk to.25 While informative at the population level, such data do not elucidate on how loneliness changes (or stays constant) within the same individuals over time.
Little is known about patterns of loneliness over time and CYP may differ not only in their loneliness at a particular time-point, but also in how their loneliness changes over time. In adults, studies investigating subgroups of loneliness trajectories during the pandemic have suggested substantial heterogeneity.26,27 To our knowledge, no study has investigated whether different loneliness trajectories during the pandemic exist in CYP. Moreover, it would be useful to understand which factors are associated with these different loneliness trajectories and how subgroup membership relates to subsequent health. The latter is relevant because experiencing prolonged loneliness due to pandemic social isolation measures may be an independent risk factor for experiencing subsequent impairing symptoms, irrespective of SARS-CoV-2 infection status.28
Therefore, the three objectives of the current study were to: i) determine whether subgroups of CYP with different loneliness trajectories (during the second year of the COVID-19 pandemic) exist (measured using the validated loneliness scale); ii) examine associations with socio-demographic characteristics and subsequent health; and iii) understand whether associations between loneliness and subsequent health were modified by SARS-CoV-2 infection.
Materials and Methods
Study Design
We used data from the CLoCk study, a longitudinal cohort study of CYP aged 11–17 years living in England.29 The study was originally set up with three broad aims to describe post-COVID-19 symptoms in CYP, develop an operational research definition of Long COVID in CYP, and understand it’s prevalence.29 CYP with an index negative or positive SARS-CoV-2 PCR test taken between September 2020 and March 2021 were identified from the Public Health England (now UK Health Security Agency) database. CYP with a positive PCR test were matched to CYP with a negative PCR test on month of test, age, sex, and geographical area. At the time of this study, data was available at 3-months (for a sub-sample), 6-months and 12-months post SARS-CoV-2 index-test. The index-test period covered a 7-month period, hence data collection also stretched across different phases of the COVID-19 pandemic. Figure 1 presents the pandemic context in England at the time of the study.30,31
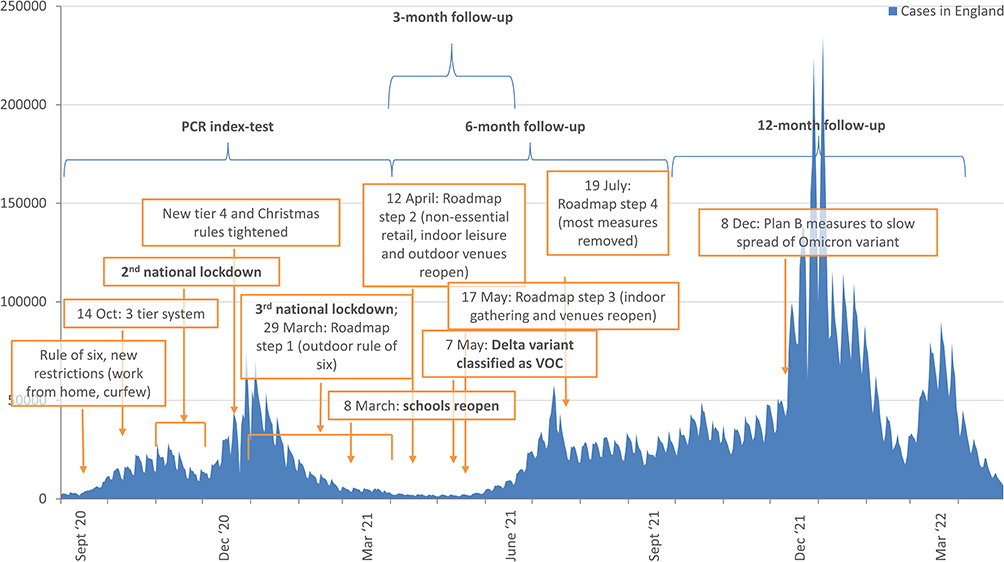 |
Figure 1 CLoCk data collection timings against context of the COVID-19 pandemic in England.30,31 |
Participants
The current study included all CYP who completed at least two surveys. Thus, the target population for this study was CLoCk participants invited to respond to the 3- and/or 6-month survey post index-test (N=127,894; of which 55,447 and 72,447 CYP tested positive and negative, respectively; Figure 2). Of those, 17,886 responded. Further exclusion criteria were a SARS-CoV-2 reinfection (in test positives) or subsequently infection (in test negatives), having fewer than two data points, missing 12-month outcome data, or having illogical dates of survey completion (eg, 6- and 12-month data with identical completion date) (Figure 2). After these exclusions, the analytic sample (n=5851) comprised 3260 test-positive and 2591 test-negative CYP. A sub-sample of 1934 individuals with data at all three time points (3-, 6- and 12-months post index-test) was used for sensitivity and supplementary analyses (described below).
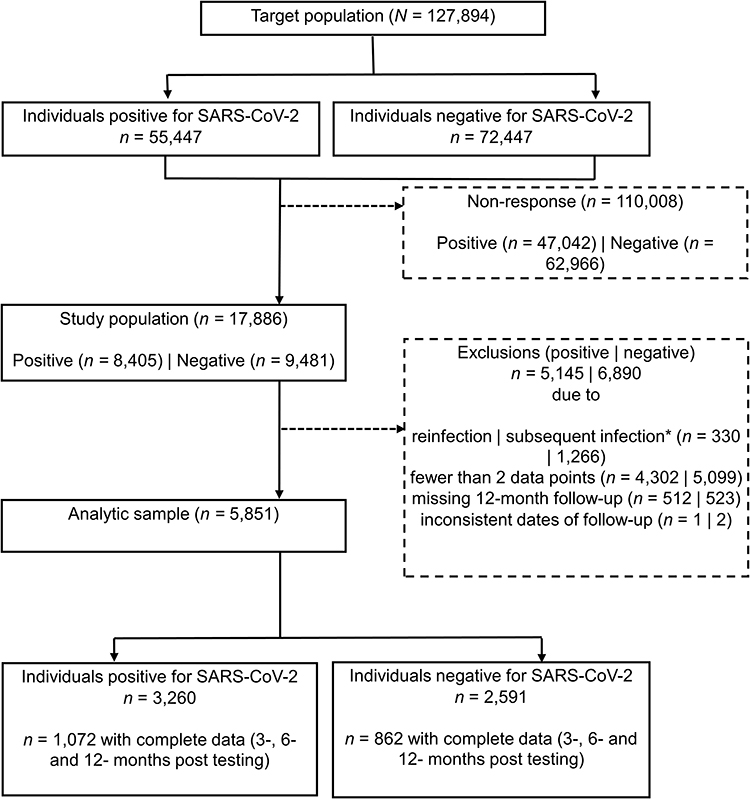 |
Figure 2 Flowchart of participants. Note: *determined by PCR tests results held by UKHSA and self-report of whether (or not) the participant ever had a positive COVID-19 test. |
Measures
Outcome measures
Loneliness was measured using a modified version of the validated UCLA Loneliness Scale for Children.32 Responses to the three items (eg “How often do you feel you have no one to talk to?”) are scored as 1 (“Hardly ever/never”), 2 (“Some of the time”) or 3 (“Often”). Responses are summed to create a single measure ranging from 3 to 9 with higher scores indicating higher levels of loneliness. CYP filled in the UCLA Loneliness Scale for Children at 3-months (for a sub-sample), 6-months and 12-months post index-test. When CYP first registered with the study (at 3- or 6-months post index-test) a retrospective measure relating to loneliness before their PCR test was also collected (see Covariate section).
We also collected a single direct measure of loneliness (recommended by the Office for National Statistics when assessing loneliness prevalence).32 CYP responded to the question “How often do you feel lonely?” with five options ranging from “Often or always” to “Never”. A dichotomized measure was used to identify CYP who indicated feeling lonely “often or always” (vs all others).8,12
To explore associations between loneliness and subsequent health, we operationalized the Delphi research definition of Long COVID in CYP, 12-months post index-test.33 This research definition is similar to the recent clinical case definition published by the World Health Organization.34 We classified CYP as having Long COVID at 12-months post index-test if they reported having at least 1 symptom and experiencing some/a lot of problems with respect to mobility, self-care, doing usual activities or having pain/discomfort or feeling very worried/sad. The need for a positive test result was not required when assessing how many test-negative CYP would also have met this definition.
Covariates
Covariates included the index SARS-CoV-2 PCR test result, age (15–17 vs 11–14 years, representing key educational stages), sex (female vs male), and area level deprivation (Index of Multiple Deprivation (IMD) grouped into quintiles from most (1) to least (5) deprived). At first contact with the study, CYP retrospectively reported baseline mental and physical health (five-item Likert scale, dichotomized as “Very poor/poor” vs “OK/good/very good”) and loneliness by the 3-item UCLA scale (dichotomized as ≥8 vs <8).
Time
For descriptive purposes, we created six phases of the COVID-19 pandemic to account for the changing background context when each participant completed the survey. These phases reflected changes in pandemic measures, infection rates and school holidays (see Text S1 for further details). They are: 1) April 12 to May 16, 2021 (n=1880 data points); 2) May 17 to July 18, 2021 (n=3913); 3) July 19 to September 1st, 2021 (n=1605); 4) September 2nd to December 7, 2021 (n=3581); 5) December 8 to January 17, 2022 (n=359); 6) January 18, 2022 onwards (n=2297). To build trajectories (described below), we calculated each person’s date of survey completion as number of days since April 13, 2021 (the first day of data collection) and divided by 30 to aid interpretation on a month-metric.
Data Analysis
We compare the analytic sample to the target population in terms of socio-demographic characteristics. We cross-sectionally describe average loneliness (from the UCLA scale), and prevalence of loneliness (from the single item direct measure) during six pandemic phases.
To identify whether distinct sub-groups of individuals based on similarities in their loneliness trajectories exist (objective i), we modelled the UCLA loneliness scale as an ordinal outcome using growth mixture models (GMM) and latent class growth analyses (LCGA). Our original plan was to develop trajectory models using a GMM framework. However, due to convergence issues experienced when developing these, trajectory development proceeded with LCGAs, as recommended.35 In these models, each trajectory class has a distinct intercept and slope, and individuals are assigned a probability of belonging to each of these classes. In contrast to GMMs, LCGAs assume that all individuals in a class follow the same average trajectory.35
Criteria for selecting the optimum number of trajectory classes was primarily assessed by the Bayesian Information Criteria (BIC), while also aiming to retain model parsimony, adequate class sizes, plausibility, and interpretability. We tested for different shapes of trajectories (eg linear, quadratic and fractional polynomials) and used a forward-modelling approach, starting with a one-class solution (non-mixture model) and incrementally adding classes, aiming to fit up to six classes if convergence allowed. Fractional polynomials were identified in Stata and LCGA was performed using the “lcmm” package in R.36
To explore factors associated with membership into loneliness trajectories (objective ii), we used univariate multinomial logistic regression models. We regressed age group, sex, quintiles of IMD and index-PCR test result, separately onto the most likely loneliness class membership (defined as the class with the highest probability).37 We further adjusted the index-PCR test result model for age group, as this was unevenly distributed between test-positive and test-negative CYP. To account for the bias of misclassification from using most likely class membership assignment, we implemented robust standard errors using the sandwich package in R.38
To determine whether loneliness trajectories were associated with Long COVID 12-months post index-test (objective ii), we used binary logistic regression models.39 We adjusted associations for age group, sex, IMD and index-PCR test result (see directed acyclic graph in Figure S1). Models were fitted with and without an interaction between loneliness trajectories and index-PCR test result to assess whether associations differed by PCR status (objective iii). The models were weighted by the posterior probability of belonging to the assigned class using the survey package in R.40,41
All analyses were conducted in Stata MP v17.0 and in R 3.6.2. Given the exploratory nature of these analyses, we applied the Benjamini–Hochberg method to control the false discovery rate in multiple testing.42 We report this study following STROBE guidelines (Table S1). 43
Supplementary and Sensitivity Analyses
Analyses were conducted to assess robustness of the results. Trajectories were compared to those found in the second-best class solution. Trajectories were also refitted (as described above) in the sub-sample with full data at 3-, 6- and 12-month post index-test. These solutions were used to rerun the above described multinomial and binary logistic regression models. Additionally, in the sub-sample with information at 3-, 6- and 12-months, associations between loneliness and long COVID at 12-months post index-test were further adjusted for retrospectively reported health and loneliness at the time of index-test.
Results
Compared to the target population, our analytic sample consisted of a higher proportion of older CYP (15–17 vs 11–14), more females (vs males), and more CYP from less deprived areas (Table 1).
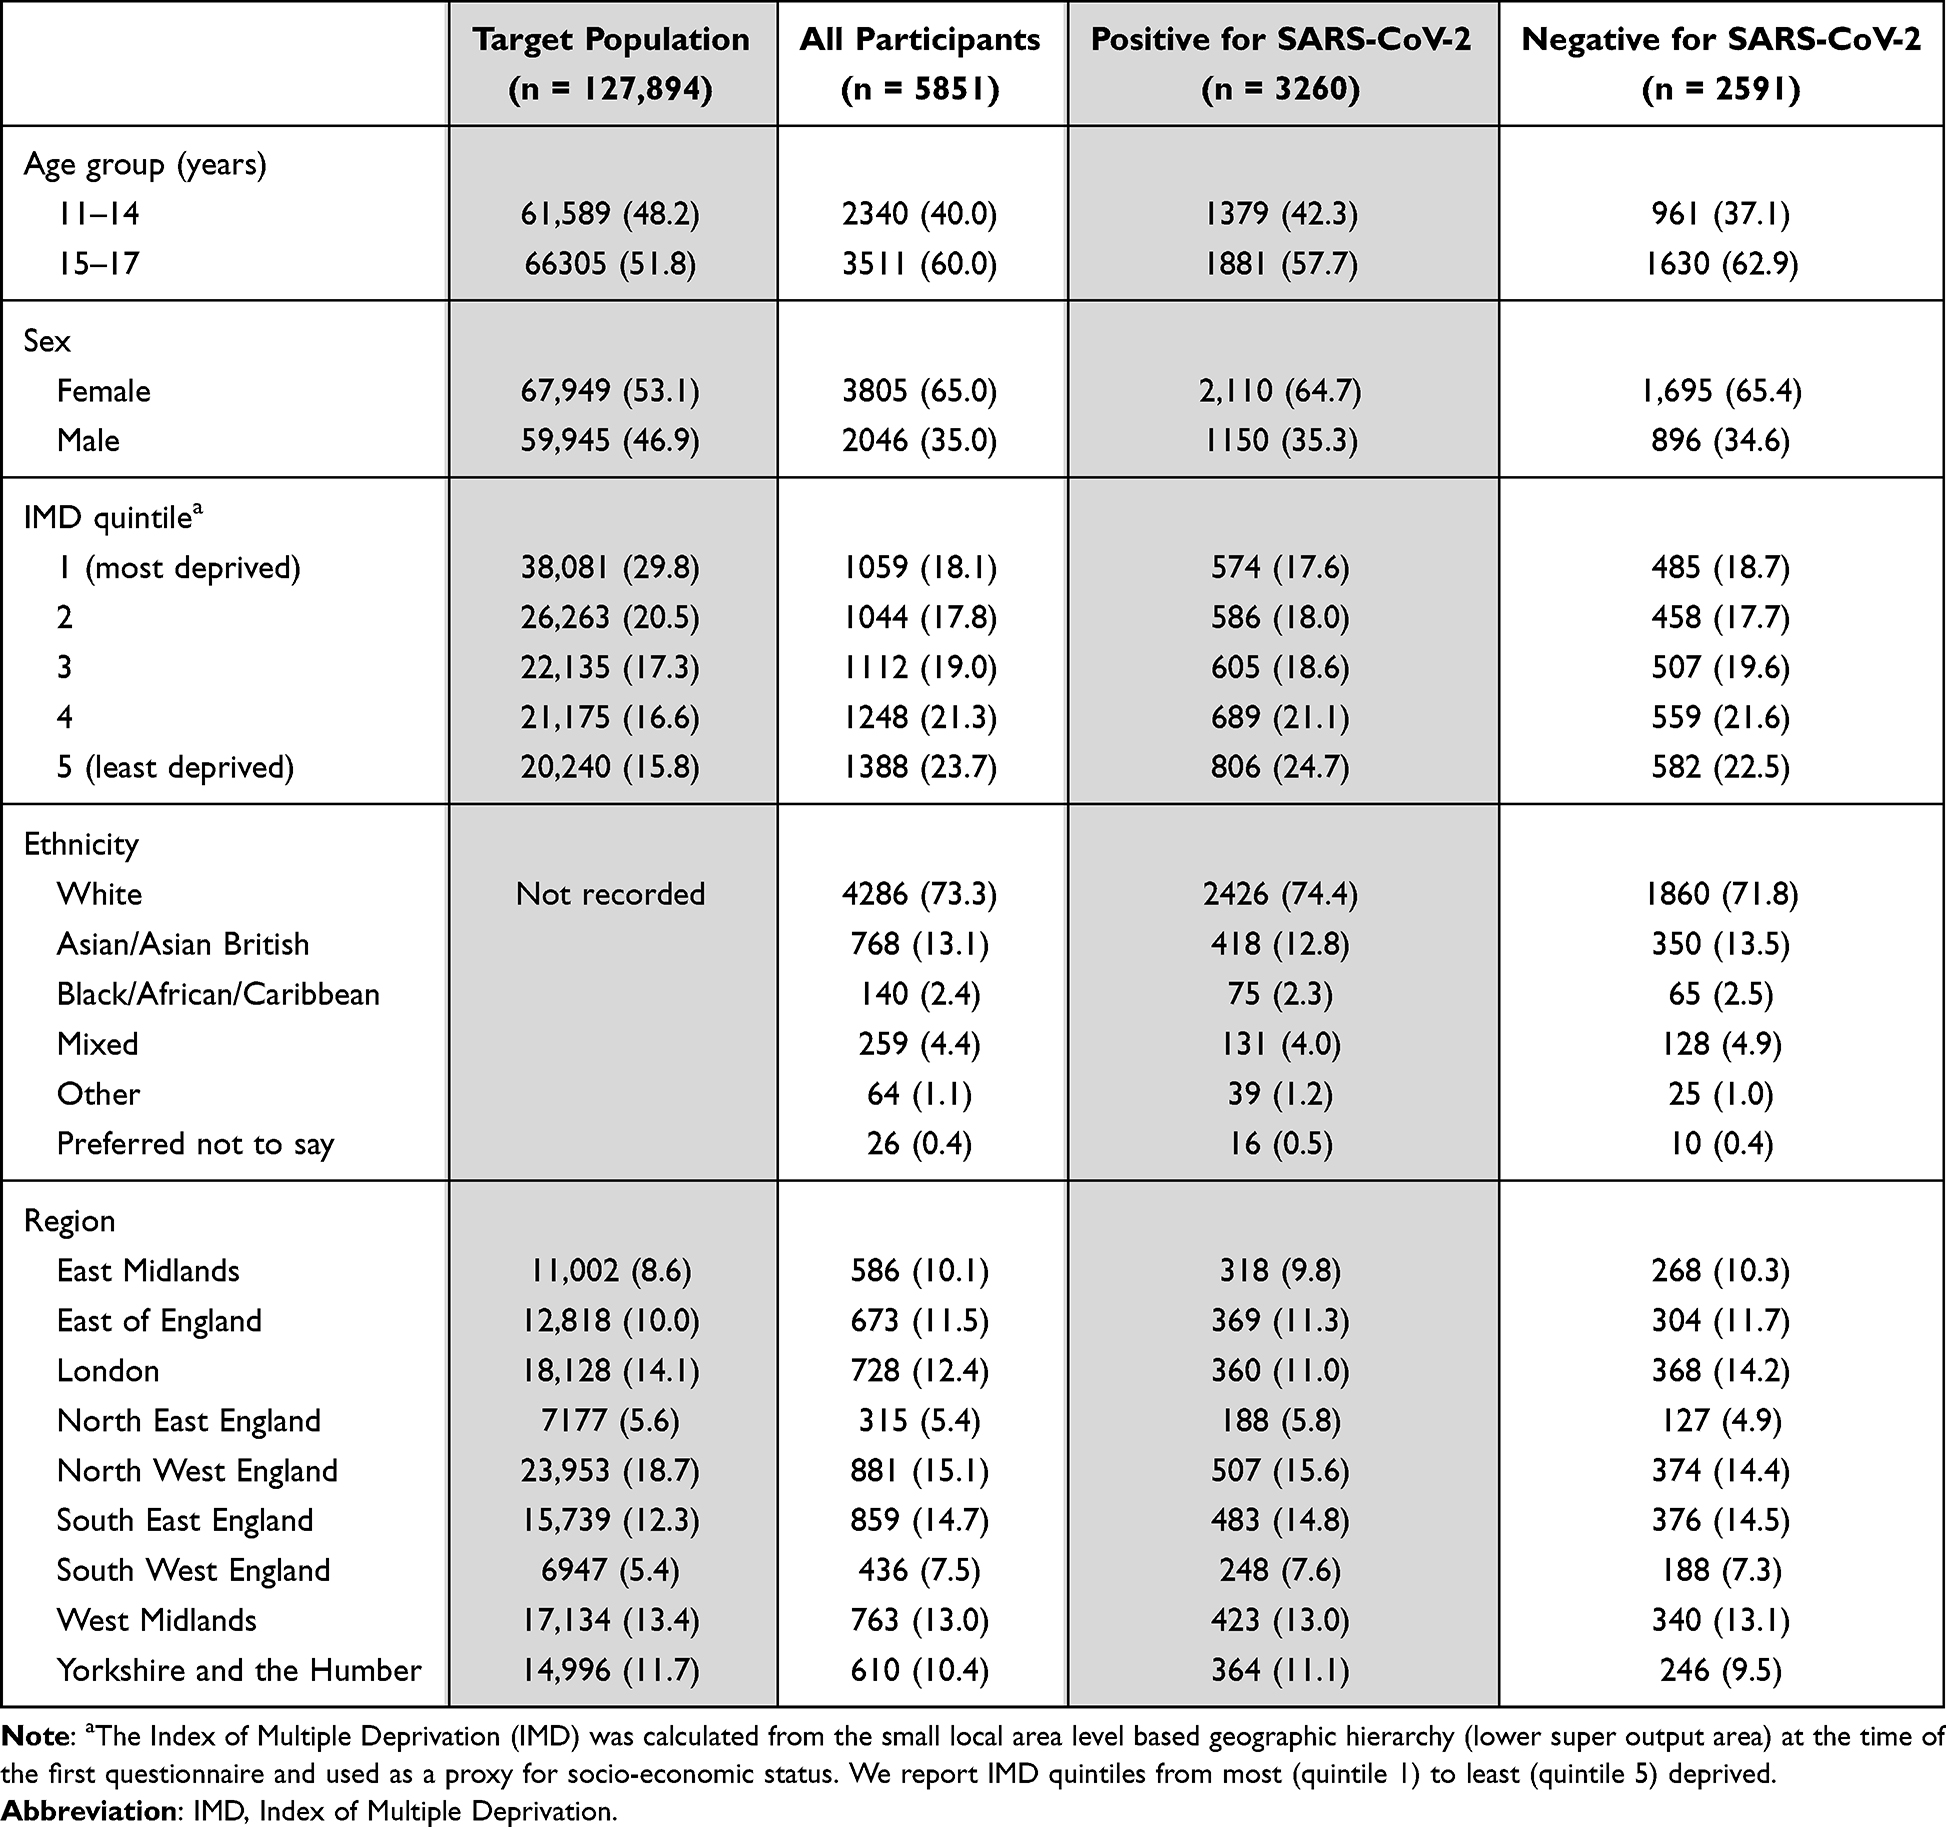 |
Table 1 Demographics of Target Population and Participants Included in the Analytic Sample; N(%) |
Cross-Sectional Loneliness Scores by Phases of the COVID-19 Pandemic
Figure 3 and Table S2 present average loneliness scores across the six pandemic phases, in test-positive and test-negative CYP (see Table S2 and Figure S2 for corresponding information on the 1-item loneliness measure). Average loneliness scores showed a slight (although not substantial) increase over time, with test-negative CYP reporting higher scores of loneliness. For example, mean (SD) loneliness was 4.3 (1.7) during Phase 1 and 4.9 (1.9) during Phase 6 in test-negative CYP; corresponding values in test-positive CYP were 4.2 (1.7) and 4.7 (1.8).
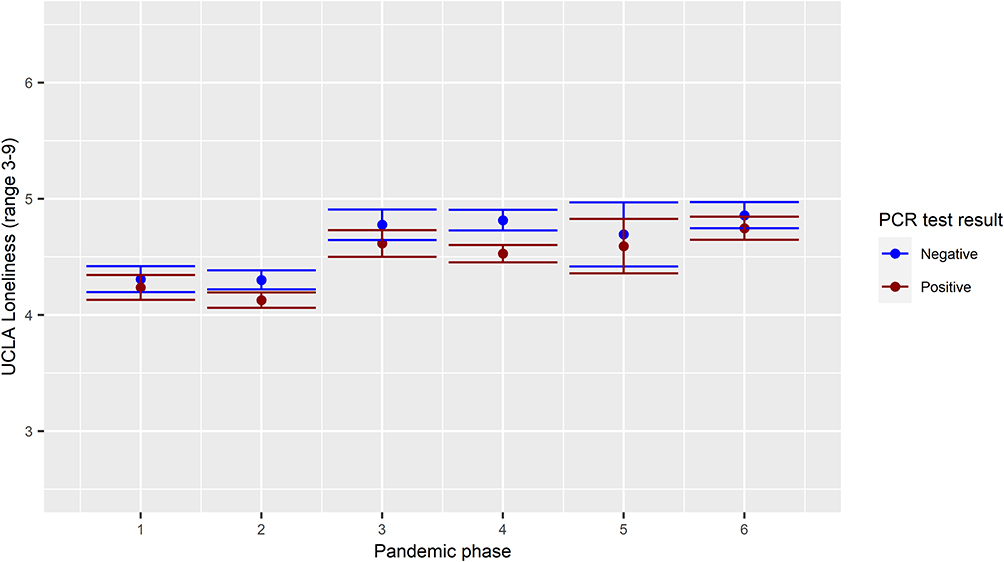 |
Figure 3 Average UCLA loneliness score by phase of the COVID-19 pandemic and SARS-CoV-2 PCR test result. Note: For ten respondents who had two measures within one phase, the first measure was used in the above description. |
Loneliness Trajectories
The 4-class solution provided the most appropriate solution to the data (Text S2 and Tables S3, S4). The 4 classes can be described as:
- a high loneliness group
In this class, which represented 5.3% of CYP, mean loneliness scores almost reached 8 on the UCLA loneliness scale. This class was characterized by a higher proportion of older adolescents, females, living in areas with higher deprivation, and more likely to meet the research definition of Long COVID 12-months post index-test (Table 2). For example, 62.8% of those following the high loneliness trajectory fulfilled the long COVID definition, compared to 41.1%, 20.2% and 9.3% of the medium, low-increasing and low loneliness groups, respectively (described below, see also Table 2 and Figure 4).
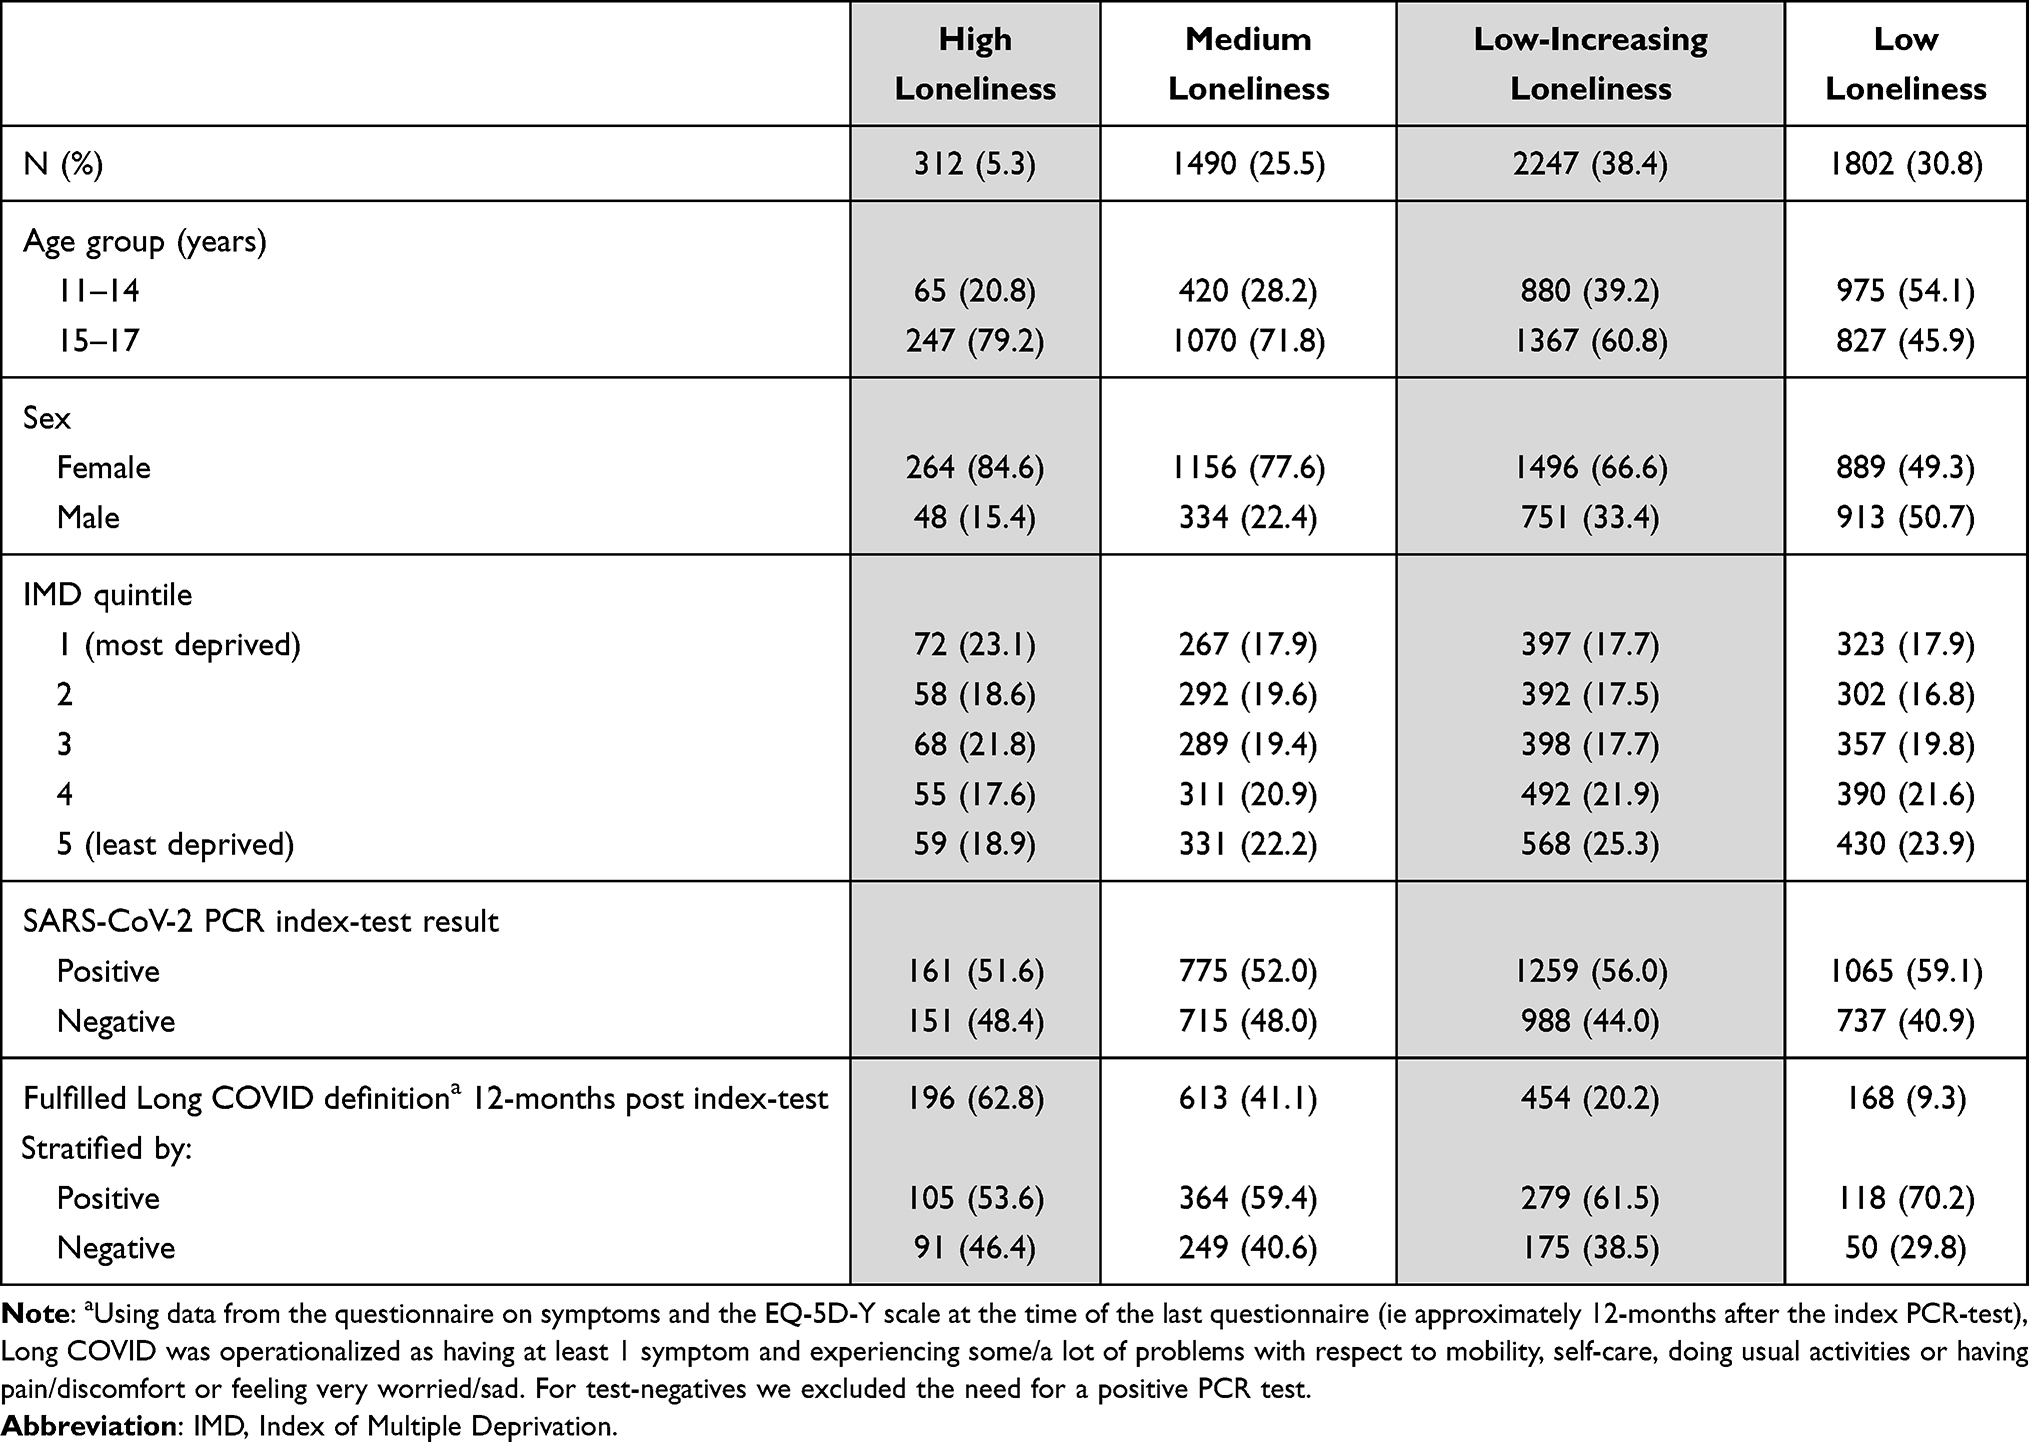 |
Table 2 Demographic Characteristics of CYP Assigned to Each Latent Loneliness Trajectory Class; N (%) |
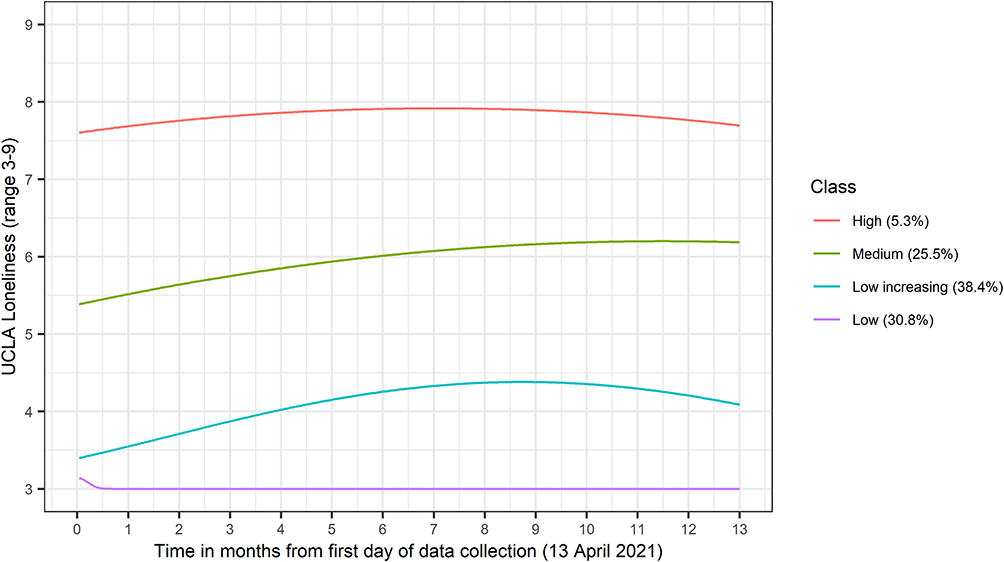 |
Figure 4 Plotted loneliness trajectories. |
This trajectory was characterized by average scores varying around 6 on the UCLA loneliness scale. This class represented 25.5% of CYP of whom 72% were from the older age group, 78% female and 41% fulfilled the Long COVID definition.
This class had the highest proportion of CYP at 38.4% and its trajectory was characterized by initially very low average scores of just over 3 and a slight increase to over 4 points on the UCLA loneliness scale. In this class, 61% of CYP were older, 67% female and 20% fulfilled the Long COVID definition.
30.8% of CYP were classed into this category and this trajectory was characterized by consistent average scores of 3 (the lowest score on the UCLA loneliness scale). 46% of CYP belonging to this group were older, 49% female and 9% fulfilled the long COVID definition.
Factors Associated with Loneliness Trajectories
Being older, female, living in more deprived areas and testing negative for SARS-CoV-2 were associated with greater odds of being in higher loneliness classes (compared to the low loneliness class, Table 3). For example, the odds ratios (ORs) comparing older (15–17 year olds) to younger (11–15 year olds) CYP were 1.8 (1.6, 2.1) for low-increasing, 3.0 (2.6, 3.5) for medium and 4.5 (3.4, 6.0) for high loneliness compared to the low loneliness class. When associations between PCR-testing and loneliness trajectories were adjusted for age, associations remained broadly consistent with those reported in Table 3 (see footnotes).
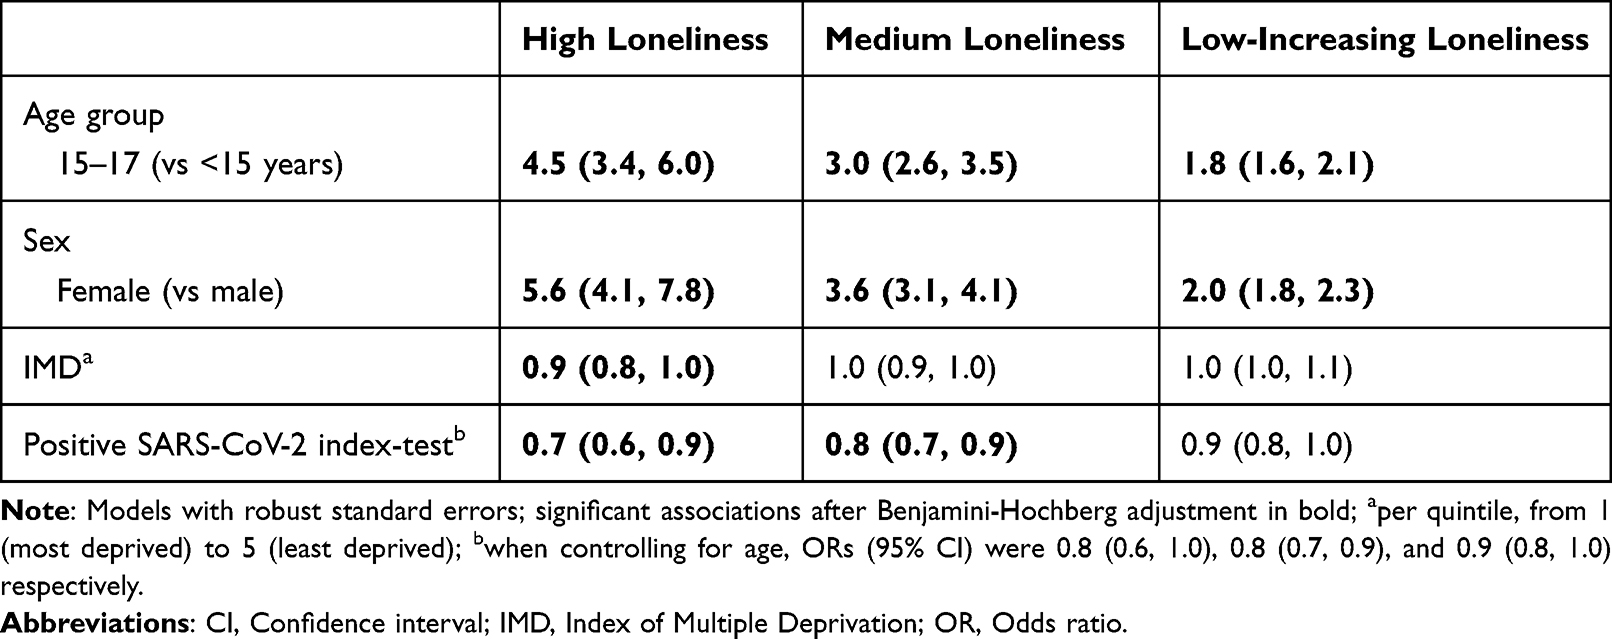 |
Table 3 Factors Associated with Latent Loneliness Trajectory Class, Univariate Associations from Multinomial Logistic Models (Low Loneliness Class = Reference Category), OR (95% CI) |
Associations Between Loneliness Trajectories and Long COVID at 12-Months Post Index-Test
There was a trend such that, compared to the low loneliness class, being in the low-increasing, medium and high loneliness classes were associated with greater odds of Long COVID 12-months post index-test (Table 4). For example, adjusted ORs for long COVID were 2.3 (1.9, 2.8) for low-increasing, 6.5 (5.3, 7.9) for medium and 15.9 (11.9, 21.3) for high loneliness classes compared to the low loneliness class. There was no evidence that associations differed by PCR test result (pinteraction=0.35).
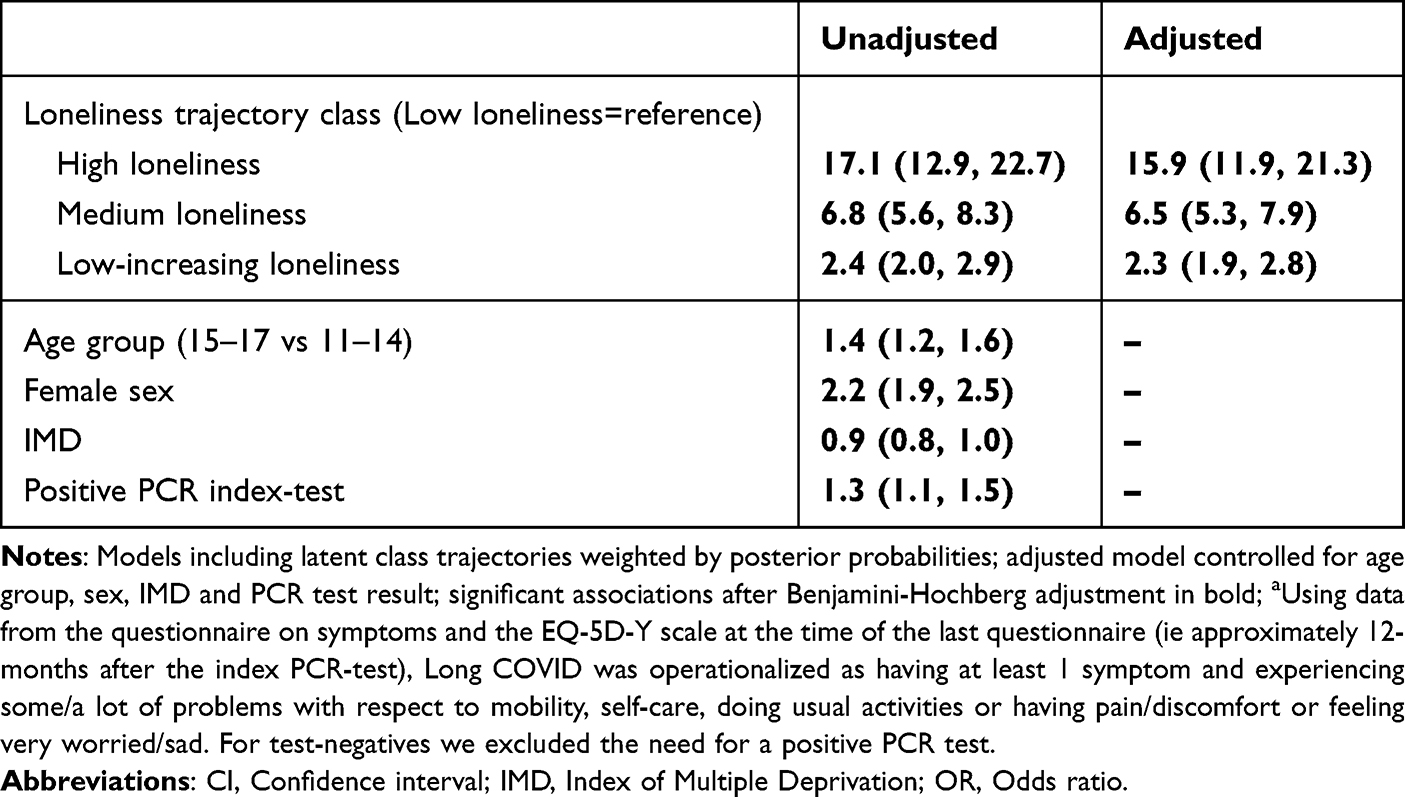 |
Table 4 Unadjusted and Adjusted Associations with Long COVIDa at 12 Months Post Index-Test, OR (95% CI) |
Supplementary and Sensitivity Analyses
The second-best class solution was the 3-class solution, with classes identified as high (prevalence=14.6%), low-increasing (prevalence=43.9%) and low loneliness (prevalence=41.5%). In the sub-sample with data at 3-, 6- and 12-months (N=1934), a 1-degree fractional polynomial fit the data better than the quadratic function used in the main analysis (Table S5). Hence, we considered both the 4-class solution with fractional polynomials and with a quadratic function (to be comparable to the main analysis). Trajectories of the 3-class solution (using all available data) and 4-class solutions (in the sub-sample) are shown in Figures S3–S5. Factors associated with the loneliness trajectories and subsequent associations with long COVID are shown in Tables S6 and S7. In line with analyses reported above, (i) trajectories suggested broadly similar groups with little or no increase over time, (ii) there was robust support for strong associations between age and sex with loneliness trajectories and (iii) associations between loneliness trajectories and long COVID were robust (even when controlling for baseline physical and mental health and loneliness; Table S7).
Discussion
Summary of Principle Findings
In our sample of nearly 6000 11–17-year-old CYP, we had three important findings. First, we found four distinct trajectories of which three were mostly stable (high, medium and low) and one low-increasing trajectory. This suggests that overall, loneliness was relatively unaffected by lockdowns and easing of restrictions, however, there may be a subgroup with increasing loneliness over time despite easing of restrictions. Second, being older, female, from more deprived areas and testing negative for SARS-CoV-2 were associated with greater odds of following higher loneliness trajectories. Finally, we found that compared to a stable low loneliness trajectory, following higher loneliness trajectories, including a trajectory with small increases from initially low loneliness levels, were associated with greater odds of Long COVID 12-months post index-test, irrespective of index SARS-CoV-2 status.
Comparison with the Literature
Over the second year of the COVID-19 pandemic, we found the prevalence of CYP feeling frequently lonely (often or always; assessed by the single-item direct measure) ranged between 7% and 9.8% in our sample of 11–17-year-old CYP. This is similar to the stable average prevalence of 8.2% reported for 11–15-year-old CYP between 2006 and 2014, but lower than the 11.3% prevalence reported for 10–15 year olds in 2017/18.11,12 However, direct comparisons of these figures are limited by a number of factors, such as differences in loneliness measures (different direct question/use of a 3-point scale in previous studies vs the Office for National Statistics 5-point single direct measure used here), and populations (eg different age ranges).
We identified four distinct loneliness trajectories in CYP, characterized by stable high, medium, low-increasing and stable low/no loneliness. In line with our cross-sectional findings, trajectories showed a marginally increasing, but mostly stable trend in loneliness (UCLA scale) over time. There were thus, on average, no observed changes in feelings of loneliness that corresponded with the opening of lockdowns and relaxing of restrictions. This finding differs from previous reports that loneliness in 16–24 years old individuals in the UK tracked closely with restrictions at the beginning of the COVID-19 pandemic and returned to pre-pandemic levels by September 2021.44 However, comparisons are limited due to the different age groups examined, measures of loneliness used, and methods employed. For example, the former study examined loneliness using responses to a single item in 16–24-year-olds assuming no subgroups exist that experience different trajectories of loneliness. In contrast, we examine loneliness using a validated scale in 11–17-year-olds and explore the existence of different subgroups in the population. Similar to our analysis, other cross-sectional research with CYP in Great Britain conducted between summer 2020 and summer 2021 found little variation in loneliness over time.25 On the other hand, in Western Australia, adolescents had increased loneliness levels after school opening suggesting that country specific handling of the pandemic and subsequent lockdowns may impact feelings of loneliness differently.24 Other research conducted in UK adults during the first national lockdown also identified four loneliness trajectories of which two were stable, one was characterized by high increasing and one by low decreasing loneliness.26 However, the population and period studied were very different to ours. In summary, without pre-pandemic or early pandemic baseline levels of loneliness and longer follow-up, it is difficult to say whether our trajectories over the second year of the COVID-19 pandemic reflect a stable continuation of pre-pandemic or pandemic related loneliness levels.
In line with previous research in the general population, we found that being female, older, and living in a more deprived area was associated with following higher loneliness trajectories.8,12,26,44–48 A positive SARS-CoV-2 PCR test was associated with lower odds of being in the high and medium loneliness trajectories (compared to the low loneliness class), which is counter to what might be expected from social behaviors and cognitive processes commonly associated with sickness.49 In fact, recent analyses of retrospective loneliness data in the CLoCk study found testing positive for SARS-CoV-2 was associated with increased loneliness from pre-pandemic levels to the time of study enrollment (McOwat K, personal communication, October 16, 2023). While the association in our study weakened after accounting for age, it remained. One possible explanation is that CYP who had to shield consequently experienced both higher loneliness and were less likely to get infected. Alternatively, CYP who had been mixing more with others were more likely to get infected and/or to feel more comfortable mixing after recovering from an infection, despite social distancing measures, and as a result felt less lonely.
Loneliness trajectories showed strong relationships with long COVID one year after the index-test. These results fit with previous research, showing that loneliness is associated with adverse health outcomes.49,50 Our study extends previous findings to CYP in England during the COVID-19 pandemic, examining links between loneliness trajectories and long COVID. While long COVID was more common in test-positive CYP, and there was an association between index-test and loneliness trajectories, we did not find evidence that PCR index-test result differentially affected associations between loneliness trajectories and the odds of Long COVID one year after SARS-CoV-2 testing. Importantly, our findings highlight that associations between loneliness and adverse health outcomes were not limited exclusively to those classified into the high loneliness trajectory group. Even those belonging to a group with low but somewhat increasing levels of loneliness had 2.3 greater odds of Long COVID compared to those who never felt lonely.
Strengths and Limitations
This study has a number of strengths including the large sample size of the CLoCk dataset, long follow-up across different phases of the COVID-19 pandemic and data availability from matched SARS-CoV-2 positive and negative CYP. The latter allowed us to distinguish prospective health outcomes associated with a previous infection from cohort-wide health outcomes associated with living through a pandemic. However, we acknowledge that some participants might have been misdiagnosed as SARS-CoV-2 negative and vice-versa which could underestimate any associations and interactions with PCR test status. By using trajectories rather than cross-sectional measures we were able to account for fluctuations over time and assess whether there were different subgroups of CYP experiencing distinct trajectories of loneliness and the long-term consequences associated with these trajectories. We modelled unconditional LCGAs which has the advantage of being fully data driven and independent from covariates which reduces bias when assessing associated factors and outcomes in subsequent steps.35 Finally, we opted for an explorative approach using LCGAs which is hypothesis-generating and chose a solution using a number of criteria (eg model fit, class size etc.). Importantly, we were able to demonstrate robustness of our results using sensitivity and supplementary analyses.
We acknowledge study limitations. First, the observational nature of the data and lack of prospectively collected baseline measures limited causal conclusions regarding the association between loneliness and health outcomes. Additionally, it is possible that there is a bi-directional association between loneliness and health.49,51 Poor health and chronic health conditions are known risk factors of experiencing loneliness and poor mental health, potentially amplified during the COVID-19 pandemic for subgroups who had to shield because of their health condition.49,52,53 Nevertheless, the longitudinal data allowed assessment of temporality by using measures of exposures (loneliness) preceding the outcome (Long COVID) and controlling for baseline loneliness, physical and mental health measures in a subsample with limited recall bias. Second, the sample representativeness and generalization of results was limited by self-selection response bias and drop-out. For example, our sample consisted of a higher proportion of females, 15–17-year-olds and CYP living in less deprived areas. Furthermore, testing regimes changed during the study period from symptomatic to asymptomatic testing, and we could not match test-positive and test-negative CYP on testing reason.54 Thus composition of the groups of CYP with a positive and negative PCR test might be unbalanced and associations confounded by unmeasured factors. We have recently developed flexible survey weights to address potential bias and selection issues in the CLoCk study and have demonstrated that previously reported prospective findings from CLoCk (based on a sample similar to those presented in the current manuscript) are generalizable to the wider population of CYP in England.55,56 Third, all relevant measures (eg loneliness, health outcomes etc.) were self-reported which is subject to biases and measurement errors. While self-report is an acceptable method of data collection in large-scale epidemiological studies such as CLoCk, future studies may want to extend our research using other objectively measured health outcomes. Fourth, we did not have data on individual level socio-economic status and thus cannot comment on associations with individual level deprivation as this is distinct from area level deprivation.57,58 Fifth, at the outset, we aimed to develop loneliness trajectories using GMMs. However, the added complexity in developing GMMs compared to LCGAs, the relatively small number of time points (n = 3) and participants meant many of our GMMs failed to fit. While not as realistic as GMMs, our LCGAs are still more likely to reflect reality than studies that assume a single “average” loneliness trajectory around which individuals vary.24 As such, LCGA is the recommended approach when more complex models do not converge.35 Furthermore, due to current software limitations, we were unable to conduct recommended bias-adjusted approaches to account for misclassification bias into latent classes when relating classes to covariates and external outcomes (currently unavailable in the R packages).35 However, we used robust standard errors and weights to reduce classification biases. Sensitivity analyses were also conducted to assess the robustness of our results. Sixth, while our trajectories accounted for loneliness measures being taken across a wide range of pandemic contexts, we did not account for this in our outcome of Long COVID 12-month post index-test. Stratifying for the latter would have led to power issues and further complexity which were deemed unnecessary for the scope of this study given the robust associations. Similarly, we did not stratify by time of infection, even though CYP were infected at different times when different virus variants were prevalent (eg wildtype or alpha).
Implications
While loneliness in adolescence may be a normative experience when changes in school and shifts in peer relations take place, chronic rather than transient loneliness is of great concern; both in its own right and also due to its associated mental and physical health implications.14,16 Furthermore, our results suggest that even small increases from low loneliness levels may be associated with worse health. This has important implications to identify those groups most at risk of experiencing higher or increasing loneliness levels and to invest in longitudinal research tracking long-term loneliness trajectories. Our analysis was robust, but conclusions may be limited due to examining observational data with a lack of baseline information, potential sample selection and use of self-report. Thus, future research may address some of these limitations. Future work may also consider possible pathways through which loneliness affects health including a behavioral (eg smoking, physical inactivity), psychological (eg reduced self-efficacy) and/or physiological (eg stress response, immune dysregulation) pathway.49–51,59–64 Having such evidence can illuminate plausible underlying mechanisms. Finally, future research may also look into the role of media and misinformation in feelings of loneliness.65,66
Concerns around loneliness levels and its wider impacts are not new. The work of the Jo Cox Loneliness Commission and the government’s loneliness strategy, “A connected society: A strategy for tackling loneliness”, are examples of pre-pandemic efforts towards tackling loneliness in the UK.67,68 However, despite there being increasing concern about the long-term effects of the COVID-19 pandemic on CYP’s health, there is a scarcity of loneliness research in CYP limiting comparison of trajectories, risk factors, and health outcomes. We recommend further research using the nationally recommended loneliness measures and validated scales to enable between study comparisons.32
Conclusion
We have demonstrated that during the second year of the COVID-19 pandemic in the UK, CYP exhibited four distinct loneliness trajectories, 5.3% of CYP were classified into a group experiencing (chronically) high loneliness. Being older, female and living in deprived areas were associated with greater risk of experiencing high loneliness. For the first time, we have shown that compared to CYP who demonstrated low loneliness, those experiencing chronically high levels had almost 16 times greater odds of subsequent adverse health, while those with initially low but increasing loneliness levels had over 2 times greater odds. Our findings identify groups of CYP who may be most in need of interventions to tackle loneliness and prevention of associated adverse health outcomes. More research is needed to understand longer-term trajectories, underlying mechanisms and health outcomes.
Abbreviations
BIC, Bayesian Information Criteria; CYP, Children and young people; GMM, Growth Mixture Models; IMD, Index of Multiple Deprivation; LCGA, Latent Class Growth Analyses; OR, Odd’s Ratio; PCR, Polymerase Chain Reaction; SD, Standard Deviation; STROBE, Strengthening the Reporting of Observational Studies in Epidemiology; UCLA, University of California, Los Angeles; UKHSA, United Kingdom Health Security Agency.
Data Sharing Statement
Data is not publicly available. All requests for data will be reviewed by the Children & young people with Long Covid (CLoCk) study team, to verify whether the request is subject to any intellectual property or confidentiality obligations. Requests for access to the participant-level data from this study can be submitted via email to [email protected] with detailed proposals for approval. A signed data access agreement with the CLoCk team is required before accessing shared data.
Ethical Approval
Ethical approval was provided by the Yorkshire & The Humber - South Yorkshire Research Ethics 181 Committee (REC reference: 21/YH/0060; IRAS project ID:293495). UKHSA sent an invitation to parents/carers with a link to a website containing information sheets and consent forms on behalf of the CLoCk research team. Parents/carers were provided an opportunity to ask any questions about the study. Those CYP under 16 were asked to complete an assent form, and their parent/caregiver would complete a consent form. Both were needed to indicate consent to the study. CYP who were 16 or older were asked to complete the Young Person Consent Form.
Consent for Publication
I consent for contents within this article (including any tables and figures) to be published.
Acknowledgments
Michael Lattimore, UKHSA, as Project Officer for the CLoCk Study. Olivia Swann and Elizabeth Whittaker designed the elements of the ISARIC Paediatric COVID-19 follow-up questionnaire which were incorporated into the online questionnaire used in this study to which all the CLoCk Consortium members contributed.
CLoCk Consortium Members not listed as an author (alphabetical):
Marta Buszewicz, University College London, [email protected] (Orcid ID: 0000-0003-4016-5857)
Trudie Chalder, King’s College London, [email protected] (Orcid ID: (0000-0003-0775-1045)
Esther Crawley, University of Bristol, [email protected] (Orcid ID: 0000-0002-2521-0747).
Bianca De Stavola, University College London, [email protected] (Orcid ID: 0000-0001-7853-0528)
Tamsin J Ford, University of Cambridge, [email protected] (Orcid ID: (0000-0001-5295-4904)
Shruti Garg, University of Manchester, [email protected] (Orcid ID: 0000-0002-4472-4583)
Anthony Harnden, Oxford University, [email protected] (Orcid ID: 0000-0003-0013-9611)
Isobel Heyman, Great Ormond Street Hospital for Children NHS Foundation Trust, [email protected] (Orcid ID: 0000-0001-7358-9766)
Shamez Ladhani, UK Health Security Agency, [email protected] (Orcid ID: 0000-0002-0856-2476)
Michael Levin, Imperial College London, [email protected] (Orcid ID: 0000-0003-2767-6919)
Vanessa Poustie, University of Liverpool, [email protected] (Orcid ID: 0000-0003-2338-8768)
Malcolm Semple, University of Liverpool, [email protected] (Orcid ID: 0000-0001-9700-0418)
Kishan Sharma, Manchester University NHS Foundation Trust (sadly deceased)
Olivia Swann, University of Edinburgh, [email protected] (Orcid ID: 0000-0001-7386-2849)
Terry Segal (Orcid ID: 0000-0002-4420-8810), University College London Hospitals NHS Foundation Trust, [email protected]
Elizabeth Whittaker, Imperial College London, [email protected] (Orcid ID: 0000-0002-7944-8793)
Author Contributions
All authors made a significant contribution to the work reported, whether that is in the conception, study design, execution, acquisition of data, analysis and interpretation, or in all these areas; took part in drafting, revising or critically reviewing the article; gave final approval of the version to be published; have agreed on the journal to which the article has been submitted; and agree to be accountable for all aspects of the work.
Funding
This study was funded by The Department of Health and Social Care, in their capacity as the National Institute for Health Research (NIHR), and by UK Research and Innovation (UKRI) who have awarded funding grant number COVLT0022. All research at Great Ormond Street Hospital NHS Foundation Trust and UCL Great Ormond Street Institute of Child Health is made possible by the NIHR Great Ormond Street Hospital Biomedical Research Centre. The views expressed are those of the authors and not necessarily those of the NHS, the NIHR, UKRI, or the Department of Health. SMPP is supported by a UK Medical Research Council Career Development Award (MR/P020372/1). VS is funded by the ESRC-BBSRC Soc-B Centre for Doctoral Training (Grant ref: ES/T00200X/1).
Disclosure
Terence Stephenson is Chair of the Health Research Authority and therefore recused himself from the Research Ethics Application. The remaining authors report no conflicts of interest in this work.
References
1. Ernst M, Niederer D, Werner AM, et al. Loneliness before and during the COVID-19 pandemic: a systematic review with meta-analysis. American Psychologist. 2022;77(5):660–677. doi:10.1037/amp0001005
2. Groarke JM, Berry E, Graham-Wisener L, McKenna-Plumley PE, McGlinchey E, Armour C. Loneliness in the UK during the COVID-19 pandemic: cross-sectional results from the COVID-19 psychological wellbeing study. PLoS One. 2020;15(9):e0239698. doi:10.1371/journal.pone.0239698
3. Varga TV, Bu F, Dissing AS, et al. Loneliness, worries, anxiety, and precautionary behaviours in response to the COVID-19 pandemic: a longitudinal analysis of 200,000 Western and Northern Europeans. Lancet Region Health Europe. 2021;2:100020. doi:10.1016/j.lanepe.2020.100020
4. Perlman D, Peplau L. Toward a social psychology of loneliness. In: Gilmour G, Duck S, editors. Personal Relationships in Disorder. London: Academic Press.; 1981:31–33.
5. Wigfield A, Turner R, Alden S, Green M, Karania VK. Developing a new conceptual framework of meaningful interaction for understanding social isolation and loneliness. Soc Policy Soc. 2022;21(2):172–193. doi:10.1017/S147474642000055X
6. Mental Health Foundation. Loneliness and mental health report; 2022. Available from: https://www.mentalhealth.org.uk/our-work/research/loneliness-and-mental-health-report-uk.
7. Mushtaq R, Shoib S, Shah T, Mushtaq S. Relationship between loneliness, psychiatric disorders and physical health ? A review on the psychological aspects of loneliness. J Clin Diagn Res. 2014;8(9):WE01–4. doi:10.7860/JCDR/2014/10077.4828
8. Office for National Statistics. Loneliness - what characteristics and circumstances are associated with feeling lonely?; 2018. Available from: https://www.ons.gov.uk/peoplepopulationandcommunity/wellbeing/articles/lonelinesswhatcharacteristicsandcircumstancesareassociatedwithfeelinglonely/2018-04-10.
9. Lasgaard M, Friis K, Shevlin M. “Where are all the lonely people?” A population-based study of high-risk groups across the life span. Soc Psychiatry Psychiatr Epidemiol. 2016;51(10):1373–1384. doi:10.1007/s00127-016-1279-3
10. BBC. The anatomy of loneliness: who feels lonely? The results of the world’s largest loneliness study; 2018. Available from: https://www.bbc.co.uk/programmes/articles/2yzhfv4DvqVp5nZyxBD8G23/who-feels-lonely-The-results-of-The-world-s-largest-loneliness-study.
11. Office for National Statistics. Children’s and young people’s experiences of loneliness; 2018. Available from: https://www.ons.gov.uk/peoplepopulationandcommunity/wellbeing/articles/childrensandyoungpeoplesexperiencesofloneliness/2018.
12. Qualter P, Hennessey A, Yang K, Chester KL, Klemera E, Brooks F. Prevalence and social inequality in youth loneliness in the UK. Int J Environ Res Public Health. 2021;18(19):10420. doi:10.3390/ijerph181910420
13. Harris RA, Qualter P, Robinson SJ. Loneliness trajectories from middle childhood to pre-adolescence: impact on perceived health and sleep disturbance. J Adolesc. 2013;36(6):1295–1304. doi:10.1016/j.adolescence.2012.12.009
14. Heinrich LM, Gullone E. The clinical significance of loneliness: a literature review. Clin Psychol Rev. 2006;26(6):695–718. doi:10.1016/j.cpr.2006.04.002
15. de Almeida IL, Rego L, Teixeira ACG JF, Moreira MR. Social isolation and its impact on child and adolescent development: a systematic review. Rev Paul Pediatr. 2021;40:e2020385. doi:10.1590/1984-0462/2022/40/2020385
16. Loades ME, Chatburn E, Higson-Sweeney N, et al. Rapid systematic review: the impact of social isolation and loneliness on the mental health of children and adolescents in the context of COVID-19. J Am Acad Child Adolesc Psychiatry. 2020;59(11):1218–1239.e3. doi:10.1016/j.jaac.2020.05.009
17. Saulle R, De Sario M, Bena A, et al. School closures and mental health, wellbeing and health behaviours among children and adolescents during the second COVID-19 wave: a systematic review of the literature. Epidemiol Prev. 2022;46(5–6):333–352. doi:10.19191/ep22.5-6.a542.089
18. Chaabane S, Doraiswamy S, Chaabna K, Mamtani R, Cheema S. The impact of COVID-19 school closure on child and adolescent health: a rapid systematic review. Children. 2021;8(5). doi:10.3390/children8050415
19. Farrell AH, Vitoroulis I, Eriksson M, Vaillancourt T. Loneliness and well-being in children and adolescents during the COVID-19 pandemic: a systematic review. Children. 2023;10(2). doi:10.3390/children10020279
20. Jamil A, Syed J, Kanwal S, et al. Loneliness and mental health related impacts of COVID-19: a narrative review. Int J Adolesc Med Health. 2023;35(1):21–30. doi:10.1515/ijamh-2022-0032
21. Kauhanen L, Wan Mohd Yunus WMA, Lempinen L, et al. A systematic review of the mental health changes of children and young people before and during the COVID-19 pandemic. Eur Child Adolesc Psychiatry. 2023;32(6):995–1013. doi:10.1007/s00787-022-02060-0
22. Theberath M, Bauer D, Chen W, et al. Effects of COVID-19 pandemic on mental health of children and adolescents: a systematic review of survey studies. SAGE Open Med. 2022;10:20503121221086712. doi:10.1177/20503121221086712
23. Windarwati HD, Lestari R, Supianto AA, et al. A narrative review into the impact of COVID-19 pandemic on senior high school adolescent mental health. J Child Adolesc Psychiatr Nurs. 2022;35(3):206–217. doi:10.1111/jcap.12370
24. Houghton S, Kyron M, Hunter SC, et al. Adolescents’ longitudinal trajectories of mental health and loneliness: the impact of COVID-19 school closures. J Adolesc. 2022;94(2):191–205. doi:10.1002/jad.12017
25. Mental Health Foundation. About the “mental health in the pandemic” adolescent study; 2022. Available from: https://www.mentalhealth.org.uk/our-work/research/about-mental-health-pandemic-adolescent-study.
26. Bu F, Steptoe A, Fancourt D. Loneliness during a strict lockdown: trajectories and predictors during the COVID-19 pandemic in 38,217 United Kingdom adults. Soc Sci Med. 2020;265:113521. doi:10.1016/j.socscimed.2020.113521
27. Mayerl H, Stolz E, Freidl W. Trajectories of loneliness, depressive symptoms, and anxiety symptoms during the COVID-19 pandemic in Austria. Public Health. 2022;212:10–13. doi:10.1016/j.puhe.2022.08.004
28. Blankenburg J, Wekenborg MK, Reichert J, et al. Comparison of mental health outcomes in seropositive and seronegative adolescents during the COVID19 pandemic. Sci Rep. 2022;12(1):2246. doi:10.1038/s41598-022-06166-y
29. Stephenson T, Shafran R, De Stavola B, et al. Long COVID and the mental and physical health of children and young people: national matched cohort study protocol (the CLoCk study). BMJ Open. 2021;11(8):e052838. doi:10.1136/bmjopen-2021-052838
30. Institute for Government. Timeline of UK government coronavirus lockdowns and measures; 2020. Available from: https://www.instituteforgovernment.org.uk/sites/default/files/2022-12/timeline-coronavirus-lockdown-december-2021.pdf.
31. UK Health Security Agency. Cases in England. 2023. Available from: https://coronavirus.data.gov.uk/details/cases?areaType=nation&areaName=England.
32. Office for National Statistics. Recommended National Indicators of Loneliness; 2018. Available from: https://www.ons.gov.uk/peoplepopulationandcommunity/wellbeing/compendium/nationalmeasurementofloneliness/2018/recommendednationalindicatorsofloneliness.
33. Stephenson T, Allin B, Nugawela MD, et al. Long COVID (post-COVID-19 condition) in children: a modified Delphi process. Arch Dis Child. 2022;107(7):674–680. doi:10.1136/archdischild-2021-323624
34. World Health Organisation. A clinical case definition for post COVID-19 condition in children and adolescents by expert consensus. Available from: https://www.who.int/publications/i/item/WHO-2019-nCoV-Post-COVID-19-condition-CA-Clinical-case-definition-2023-1.
35. van de Schoot R, Sijbrandij M, Winter SD, Depaoli S, Vermunt JK. The GRoLTS-checklist: guidelines for reporting on latent trajectory studies. Struct Equ Modeling. 2017;24(3):451–467. doi:10.1080/10705511.2016.1247646
36. Proust-Lima C, Philipps V, Liquet B. Estimation of extended mixed models using latent classes and latent processes: the R package lcmm. J Stat Softw. 2017;78(2). doi:10.18637/jss.v078.i02
37. Croissant Y. Estimation of random utility models in R: the mlogit package. J Stat Softw. 2020;95(11). doi:10.18637/jss.v095.i11
38. Zeileis A, Köll S, Graham N. Various versatile variances: an object-oriented implementation of clustered covariances in R. J Stat Softw. 2020;95(1). doi:10.18637/jss.v095.i01
39. R Core Team. R: a language and environment for statistical computing. 2021.
40. Lumley T. Analysis of complex survey samples. J Stat Softw. 2004;9(8). doi:10.18637/jss.v009.i08
41. Clark S, Muthén B, Clark S, Muthén B. Relating latent class analysis results to variables not included in the analysis. 2009. Available from: https://www.statmodel.com/download/relatinglca.pdf.
42. Benjamini Y, Hochberg Y. Controlling the false discovery rate: a practical and powerful approach to multiple testing. J R Stat Soc. 1995;57(1):289–300. doi:10.1111/j.2517-6161.1995.tb02031.x
43. Vandenbroucke JP, von Elm E, Altman DG, et al. Strengthening the Reporting of Observational Studies in Epidemiology (STROBE). Epidemiology. 2007;18(6):805–835. doi:10.1097/EDE.0b013e3181577511
44. Kung CSJ, Kunz JS, Shields MA. COVID-19 lockdowns and changes in loneliness among young people in the U.K. Soc Sci Med. 2023;320:115692. doi:10.1016/j.socscimed.2023.115692
45. Bu F, Steptoe A, Fancourt D. Who is lonely in lockdown? Cross-cohort analyses of predictors of loneliness before and during the COVID-19 pandemic. Public Health. 2020;186:31–34. doi:10.1016/j.puhe.2020.06.036
46. Hu Y, Gutman LM. The trajectory of loneliness in UK young adults during the summer to winter months of COVID-19. Psychiatry Res. 2021;303:114064. doi:10.1016/j.psychres.2021.114064
47. Kung CSJ, Pudney SE, Shields MA. Economic gradients in loneliness, social isolation and social support: evidence from the UK Biobank. Soc Sci Med. 2022;306:115122. doi:10.1016/j.socscimed.2022.115122
48. Lim MH, Eres R, Vasan S. Understanding loneliness in the twenty-first century: an update on correlates, risk factors, and potential solutions. Soc Psychiatry Psychiatr Epidemiol. 2020;55(7):793–810. doi:10.1007/s00127-020-01889-7
49. Eisenberger NI, Moieni M, Inagaki TK, Muscatell KA, Irwin MR. In sickness and in health: the co-regulation of inflammation and social behavior. Neuropsychopharmacology. 2017;42(1):242–253. doi:10.1038/npp.2016.141
50. Cacioppo JT, Hawkley LC, Crawford LE, et al. Loneliness and health: potential mechanisms. Psychosom Med. 2002;64(3):407–417. doi:10.1097/00006842-200205000-00005
51. Baarck J, Kovacic M. The Relationship Between Loneliness and Health. Luxembourg: Publications Office of the European Union; 2022. doi:10.2760/90915
52. Cowley LE, Hodgson K, Song J, et al. Effects of the COVID-19 pandemic on the mental health of clinically extremely vulnerable children and children living with clinically extremely vulnerable people in Wales: a data linkage study. BMJ open. 2023;13(6):e067882.
53. Griffiths H, O’Connor K, Phillips B, et al. The child & family clinical psychology review.; 2020. Available from: https://cms.bps.org.uk/sites/default/files/2022-09/Meeting%20the%20psychological%20needs%20of%20children%20in%20shielding%20families.pdf.
54. Chapter 6: Testing. Department of health & social care. Available from: https://www.gov.uk/government/publications/technical-report-on-The-covid-19-pandemic-in-The-uk/chapter-6-testing.
55. Rojas N, Stavola B, Norris T, et al. Developing survey weights to ensure representativeness in a national, matched cohort study: results from the Children and young people with Long Covid (CLoCk) study. 2023. doi:10.21203/rs.3.rs-2912362/v1
56. Pinto Pereira SM, Shafran R, Nugawela MD, et al. Natural course of health and well-being in non-hospitalised children and young people after testing for SARS-CoV-2: a prospective follow-up study over 12 months. Lancet Region Health Europe. 2023;25:100554. doi:10.1016/j.lanepe.2022.100554
57. Kelly S. Individual socioeconomic status is important but hard to measure. BMJ. 2021;n174. doi:10.1136/bmj.n174
58. Ministry of Housing C& LG. English indices of deprivation; 2019. Available from: https://www.gov.uk/government/statistics/english-indices-of-deprivation-2019.
59. Valtorta NK, Kanaan M, Gilbody S, Ronzi S, Hanratty B. Loneliness and social isolation as risk factors for coronary heart disease and stroke: systematic review and meta-analysis of longitudinal observational studies. Heart. 2016;102(13):1009–1016. doi:10.1136/heartjnl-2015-308790
60. Berkman L, Krishna A. Social Network Epidemiology. In: Social Epidemiology. Oxford University Press; 2014.
61. Hawkley LC, Cacioppo JT. Loneliness matters: a theoretical and empirical review of consequences and mechanisms. Ann Behav Med. 2010;40(2):218–227. doi:10.1007/s12160-010-9210-8
62. Cole SW, Hawkley LC, Arevalo JM, Sung CY, Rose RM, Cacioppo JT. Social regulation of gene expression in human leukocytes. Genome Biol. 2007;8(9):R189. doi:10.1186/gb-2007-8-9-r189
63. Hackett RA, Hamer M, Endrighi R, Brydon L, Steptoe A. Loneliness and stress-related inflammatory and neuroendocrine responses in older men and women. Psychoneuroendocrinology. 2012;37(11):1801–1809. doi:10.1016/j.psyneuen.2012.03.016
64. Pourriyahi H, Yazdanpanah N, Saghazadeh A, Rezaei N. Loneliness: an immunometabolic syndrome. Int J Environ Res Public Health. 2021;18(22):12162. doi:10.3390/ijerph182212162
65. Lăzăroiu G, Adams C. Viral panic and contagious fear in scary times: the proliferation of COVID-19 misinformation and fake news. Anal Metaphys. 2020;19:80–86. doi:10.22381/AM1920209
66. Lăzăroiu G, Horák J, Valaskova K. Scaring ourselves to death in the time of COVID-19: pandemic awareness, virus anxiety, and contagious fear. Linguist Philos Investig. 2020;19. doi:10.22381/LPI1920208
67. The Jo Cox Foundation. The Jo Cox Loneliness Commission. 2019. Available from: https://www.jocoxfoundation.org/loneliness_commission.
68. Department for Digital Culture Media and Sport. Policy Paper: tackling loneliness annual report February 2022: the third year; 2022. Available from: https://www.gov.uk/government/publications/loneliness-annual-report-The-third-year/tackling-loneliness-annual-report-february-2022-The-third-year.
 © 2023 The Author(s). This work is published and licensed by Dove Medical Press Limited. The full terms of this license are available at https://www.dovepress.com/terms.php and incorporate the Creative Commons Attribution - Non Commercial (unported, v3.0) License.
By accessing the work you hereby accept the Terms. Non-commercial uses of the work are permitted without any further permission from Dove Medical Press Limited, provided the work is properly attributed. For permission for commercial use of this work, please see paragraphs 4.2 and 5 of our Terms.
© 2023 The Author(s). This work is published and licensed by Dove Medical Press Limited. The full terms of this license are available at https://www.dovepress.com/terms.php and incorporate the Creative Commons Attribution - Non Commercial (unported, v3.0) License.
By accessing the work you hereby accept the Terms. Non-commercial uses of the work are permitted without any further permission from Dove Medical Press Limited, provided the work is properly attributed. For permission for commercial use of this work, please see paragraphs 4.2 and 5 of our Terms.